Embed Size (px)
Citation preview

NeuroImage 158 (2017) 18–25
Contents lists available at ScienceDirect
NeuroImage
journal homepage: www.elsevier .com/locate/neuroimage
Meditation is associated with increased brain network integration
Remko van Lutterveld a,*, Edwin van Dellen b, Prasanta Pal a, Hua Yang a, Cornelis Jan Stam c,Judson Brewer a
a Center for Mindfulness, University of Massachusetts Medical School, Worcester, MA, USAb Department of Psychiatry, Brain Center Rudolf Magnus, University Medical Center Utrecht, Utrecht, The Netherlandsc Department of Clinical Neurophysiology and MEG Centre, VU University Medical Center, Amsterdam, The Netherlands
A B S T R A C T
Introduction: This study aims to identify novel quantitative EEG measures associated with mindfulness meditation. As there is some evidence that meditation isassociated with higher integration of brain networks, we focused on EEG measures of network integration.Methods: Sixteen novice meditators and sixteen experienced meditators participated in the study. Novice meditators performed a basic meditation practice thatsupported effortless awareness, which is an important quality of experience related to mindfulness practices, while their EEG was recorded. Experienced meditatorsperformed a self-selected meditation practice that supported effortless awareness. Network integration was analyzed with maximum betweenness centrality and leaffraction (which both correlate positively with network integration) as well as with diameter and average eccentricity (which both correlate negatively with networkintegration), based on a phase-lag index (PLI) and minimum spanning tree (MST) approach. Differences between groups were assessed using repeated-measuresANOVA for the theta (4–8 Hz), alpha (8–13 Hz) and lower beta (13–20 Hz) frequency bands.Results: Maximum betweenness centrality was significantly higher in experienced meditators than in novices (P ¼ 0.012) in the alpha band. In the same frequencyband, leaf fraction showed a trend toward being significantly higher in experienced meditators than in novices (P ¼ 0.056), while diameter and average eccentricitywere significantly lower in experienced meditators than in novices (P ¼ 0.016 and P ¼ 0.028 respectively). No significant differences between groups were observedfor the theta and beta frequency bands.Conclusion: These results show that alpha band functional network topology is better integrated in experienced meditators than in novice meditators during medi-tation. This novel finding provides the rationale to investigate the temporal relation between measures of functional connectivity network integration and meditationquality, for example using neurophenomenology experiments.
Mindfulness meditation programs have increasingly shown beneficialeffects on a variety of medical disorders. For example, a recent meta-analysis showed that these programs may have similar effects on anxi-ety and depression as medication, perhaps without the associated sideeffects (Goyal et al., 2014). Currently, the most consistent EEG findingsassociated with meditation are increased theta and alpha power (for arecent systematic review see Lomas et al. (2015)). However, as Brand-meyer and Delorme (2013) point out, “Recent research suggests thatcomplex brain activity during meditation may not be adequatelydescribed by basic EEG analyses”. More specifically, a limitation of poweranalysis is that it provides no information about the organization of in-teractions between brain regions. As such, more advanced EEG measures,such as network integration, i.e. how efficiently information isexchanged across the whole network, may provide potential targets forneurofeedback. Indeed, there is some neuroimaging evidence thatmeditation may be associated with increased network integration. In arecent EEG study, assessing the relationship between meditation and
* Corresponding author. UMass Medical School, Center for Mindfulness, Hoagland-Pincus BuE-mail address: [email protected] (R. van Lutterveld).
http://dx.doi.org/10.1016/j.neuroimage.2017.06.071Received 31 May 2017; Accepted 26 June 2017Available online 27 June 20171053-8119/Published by Elsevier Inc.
network integration in the theta band, it was found that a meditationintervention increased global and local network efficiency (which can beconsidered measures of network integration) during resting-state (Xueet al., 2014). However, in this study, synchronization likelihood was usedto calculate functional connectivity, which is sensitive to volume con-duction and EEG reference effects. Volume conduction relates to nearbyelectrodes being highly likely to pick up activity from the same, i.e.common, sources, which then gives rise to spurious correlations betweentime series at these electrodes (Stam et al., 2007). Fortunately, newmethodologies have been developed to address these limitations. A so-lution to this issue would be to use a measure that assesses phase syn-chrony (and focuses on non-zero phase differences), such as the phase lagindex (PLI), which minimizes the effect of volume conduction (Stamet al., 2007). Functional connectivity matrices based on a phase syn-chrony measure can then be calculated for the network of all electrodes.Sophisticated signal processing analysis methods, such as recent in-novations in graph analysis (Tewarie et al., 2015), can subsequently be
ilding, 222 Maple Ave, Shrewsbury, MA 01545, USA.
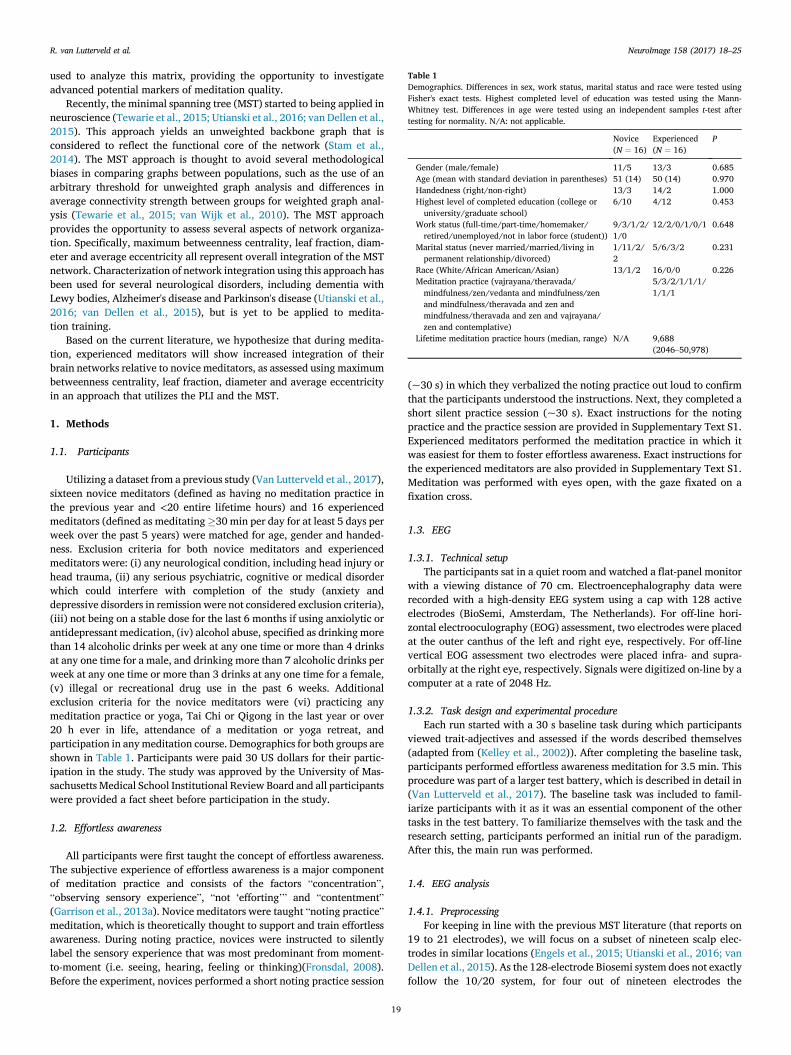
Table 1Demographics. Differences in sex, work status, marital status and race were tested usingFisher's exact tests. Highest completed level of education was tested using the Mann-Whitney test. Differences in age were tested using an independent samples t-test aftertesting for normality. N/A: not applicable.
Novice(N ¼ 16)
Experienced(N ¼ 16)
P
Gender (male/female) 11/5 13/3 0.685Age (mean with standard deviation in parentheses) 51 (14) 50 (14) 0.970Handedness (right/non-right) 13/3 14/2 1.000Highest level of completed education (college oruniversity/graduate school)
6/10 4/12 0.453
Work status (full-time/part-time/homemaker/retired/unemployed/not in labor force (student))
9/3/1/2/1/0
12/2/0/1/0/1 0.648
Marital status (never married/married/living inpermanent relationship/divorced)
1/11/2/2
5/6/3/2 0.231
Race (White/African American/Asian) 13/1/2 16/0/0 0.226Meditation practice (vajrayana/theravada/mindfulness/zen/vedanta and mindfulness/zenand mindfulness/theravada and zen andmindfulness/theravada and zen and vajrayana/zen and contemplative)
5/3/2/1/1/1/1/1/1
Lifetime meditation practice hours (median, range) N/A 9,688(2046–50,978)
R. van Lutterveld et al. NeuroImage 158 (2017) 18–25
used to analyze this matrix, providing the opportunity to investigateadvanced potential markers of meditation quality.
Recently, the minimal spanning tree (MST) started to being applied inneuroscience (Tewarie et al., 2015; Utianski et al., 2016; van Dellen et al.,2015). This approach yields an unweighted backbone graph that isconsidered to reflect the functional core of the network (Stam et al.,2014). The MST approach is thought to avoid several methodologicalbiases in comparing graphs between populations, such as the use of anarbitrary threshold for unweighted graph analysis and differences inaverage connectivity strength between groups for weighted graph anal-ysis (Tewarie et al., 2015; van Wijk et al., 2010). The MST approachprovides the opportunity to assess several aspects of network organiza-tion. Specifically, maximum betweenness centrality, leaf fraction, diam-eter and average eccentricity all represent overall integration of the MSTnetwork. Characterization of network integration using this approach hasbeen used for several neurological disorders, including dementia withLewy bodies, Alzheimer's disease and Parkinson's disease (Utianski et al.,2016; van Dellen et al., 2015), but is yet to be applied to medita-tion training.
Based on the current literature, we hypothesize that during medita-tion, experienced meditators will show increased integration of theirbrain networks relative to novice meditators, as assessed using maximumbetweenness centrality, leaf fraction, diameter and average eccentricityin an approach that utilizes the PLI and the MST.
1. Methods
1.1. Participants
Utilizing a dataset from a previous study (Van Lutterveld et al., 2017),sixteen novice meditators (defined as having no meditation practice inthe previous year and <20 entire lifetime hours) and 16 experiencedmeditators (defined as meditating�30 min per day for at least 5 days perweek over the past 5 years) were matched for age, gender and handed-ness. Exclusion criteria for both novice meditators and experiencedmeditators were: (i) any neurological condition, including head injury orhead trauma, (ii) any serious psychiatric, cognitive or medical disorderwhich could interfere with completion of the study (anxiety anddepressive disorders in remission were not considered exclusion criteria),(iii) not being on a stable dose for the last 6 months if using anxiolytic orantidepressant medication, (iv) alcohol abuse, specified as drinking morethan 14 alcoholic drinks per week at any one time or more than 4 drinksat any one time for a male, and drinking more than 7 alcoholic drinks perweek at any one time or more than 3 drinks at any one time for a female,(v) illegal or recreational drug use in the past 6 weeks. Additionalexclusion criteria for the novice meditators were (vi) practicing anymeditation practice or yoga, Tai Chi or Qigong in the last year or over20 h ever in life, attendance of a meditation or yoga retreat, andparticipation in anymeditation course. Demographics for both groups areshown in Table 1. Participants were paid 30 US dollars for their partic-ipation in the study. The study was approved by the University of Mas-sachusetts Medical School Institutional Review Board and all participantswere provided a fact sheet before participation in the study.
1.2. Effortless awareness
All participants were first taught the concept of effortless awareness.The subjective experience of effortless awareness is a major componentof meditation practice and consists of the factors “concentration”,“observing sensory experience”, “not ‘efforting’” and “contentment”(Garrison et al., 2013a). Novice meditators were taught “noting practice”meditation, which is theoretically thought to support and train effortlessawareness. During noting practice, novices were instructed to silentlylabel the sensory experience that was most predominant from moment-to-moment (i.e. seeing, hearing, feeling or thinking)(Fronsdal, 2008).Before the experiment, novices performed a short noting practice session
19
(~30 s) in which they verbalized the noting practice out loud to confirmthat the participants understood the instructions. Next, they completed ashort silent practice session (~30 s). Exact instructions for the notingpractice and the practice session are provided in Supplementary Text S1.Experienced meditators performed the meditation practice in which itwas easiest for them to foster effortless awareness. Exact instructions forthe experienced meditators are also provided in Supplementary Text S1.Meditation was performed with eyes open, with the gaze fixated on afixation cross.
1.3. EEG
1.3.1. Technical setupThe participants sat in a quiet room and watched a flat-panel monitor
with a viewing distance of 70 cm. Electroencephalography data wererecorded with a high-density EEG system using a cap with 128 activeelectrodes (BioSemi, Amsterdam, The Netherlands). For off-line hori-zontal electrooculography (EOG) assessment, two electrodes were placedat the outer canthus of the left and right eye, respectively. For off-linevertical EOG assessment two electrodes were placed infra- and supra-orbitally at the right eye, respectively. Signals were digitized on-line by acomputer at a rate of 2048 Hz.
1.3.2. Task design and experimental procedureEach run started with a 30 s baseline task during which participants
viewed trait-adjectives and assessed if the words described themselves(adapted from (Kelley et al., 2002)). After completing the baseline task,participants performed effortless awareness meditation for 3.5 min. Thisprocedure was part of a larger test battery, which is described in detail in(Van Lutterveld et al., 2017). The baseline task was included to famil-iarize participants with it as it was an essential component of the othertasks in the test battery. To familiarize themselves with the task and theresearch setting, participants performed an initial run of the paradigm.After this, the main run was performed.
1.4. EEG analysis
1.4.1. PreprocessingFor keeping in line with the previous MST literature (that reports on
19 to 21 electrodes), we will focus on a subset of nineteen scalp elec-trodes in similar locations (Engels et al., 2015; Utianski et al., 2016; vanDellen et al., 2015). As the 128-electrode Biosemi system does not exactlyfollow the 10/20 system, for four out of nineteen electrodes the

R. van Lutterveld et al. NeuroImage 158 (2017) 18–25
electrodes closest to the 10/20 configuration were included. A detailedvisual representation is provided in Supplementary Fig. S2. Data pre-processing was performed using the BrainVision Analyzer software suite(BrainProducts, Munich, Germany) and in-house developed Matlabscripts (Natick, MA, USA). First, data of the meditation part of the runwas visually inspected for bad channels. Subsequently, data from badchannels was recreated from the surrounding leads in the 128-channelconfiguration (no more than 2 channels for any subject). Data werefiltered between 0.5 and 100 Hz using a Butterworth Infinite ImpulseResponse (IIR) filter (48 dB/octave). Eye blinks were detected bycreating a bipolar vertical EOG channel by subtracting activity in theinfraorbitally placed electrode from the superorbitally placed electrode.Horizontal eye movements were detected by creating a bipolar horizontalEOG channel by subtracting activity in the electrode placed at the outercanthus of the left eye from the electrode placed at the outer canthus ofthe right eye. Ocular correction was performed using Gratton and Colesalgorithm (Gratton et al., 1983). After this, data of the meditation part ofthe run were segmented in 2 s epochs. Artifact rejection was performed intwo stages. First, automated artifact rejection took place using thefollowing parameters: 1) maximal allowed voltage step: 50 μV/ms, 2)maximal allowed difference of values in 200 ms intervals: 200 μV, 3)minimal allowed amplitude: �100 μV and maximal allowed amplitude:100 μV, 4) lowest allowed activity in 100ms intervals: 0.5 μV. Second, allsegments surviving automated artifact rejection were visually inspectedfor undetected artifacts by two EEG researchers (RvL and HY). Hereafter,twenty artifact-free segments per EEG were randomly selected for furtheranalysis. To avoid carry-over effects of the baseline task into the medi-tation task, no segments were selected from the first 10 s of the medi-tation part of each run.
1.4.2. Stability analysis of number of selected segmentsTo verify that the number of segments was sufficient to reach a stable
measure of functional connectivity, we plotted the average PLI value ofthe functional connectivity matrix for the range of 2–20 segments foreach frequency band (see Supplementary Fig. S3).
1.4.3. Graph analysisBrain Wave (version 0.9.152.2.17) software was used for graph
analysis (http://home.kpn.nl/stam7883/). Data were filtered in thefollowing frequency bands: theta (4–8 Hz); alpha (8–13 Hz); and beta(13–20 Hz). Oscillations under 4 Hz and above 20 Hz were not analyzedbecause of expected muscle artifact contamination (Hagemann andNaumann, 2001; Whitham et al., 2007; Yuval-Greenberg et al., 2008). Anaverage reference was applied.
1.4.4. Functional connectivityFunctional connectivity between EEG time-series of all 19 electrode
pairs was calculated using the Phase Lag Index (PLI). Briefly, the PLI is ameasure for phase synchronization between time series. It is based on theconsistency of the nonzero phase lag between those time series and canbe calculated from a time series of phase differences Δφ(tk), k ¼ 1… N inthe following way:
PLI ¼ j<sign[sin(Δϕ(tk))]>jThe advantage of the PLI is that it is less likely to be contaminated by
volume conduction (Porz et al., 2014; Stam et al., 2007). The PLI rangesbetween 0 (no phase synchronization) and 1 (complete phase synchro-nization). The PLI has been used extensively to characterize functionalconnectivity using EEG (e.g. Engels et al., 2015; Utianski et al., 2016; vanDellen et al., 2015). An extensive description of the PLI and its mathe-matical theory is provided by Stam et al. (2007). Average functionalconnectivity was calculated by calculating the arithmetic mean betweenall pairwise PLI measurements.
20
1.4.5. Minimum spanning tree (MST) and graph measuresNetwork topology of the PLI functional connectivity matrix was
characterized using graph theory. In this approach, every electrodeconstitutes a node in the network and each connection between twoelectrodes constitutes an edge representing functional connectivitystrength between those two electrodes. The network was further char-acterized using the minimum spanning tree (MST)(Stam et al., 2014).The MST is a subgraph of the weighted graph, which connects all nodessuch that the strongest connections in the weighted graph are included,while avoiding loops. This results in an unweighted backbone graph (i.e.binarized graph containing edge weights of 0 and 1) that is considered toreflect the functional core of the network (Stam et al., 2014). Impor-tantly, the MST is thought to avoid several methodological biases incomparing graphs between populations, such as the utilization of anarbitrary threshold for unweighted graph analysis, and differences inaverage connectivity strength between groups for weighted graph anal-ysis (Tewarie et al., 2015; van Wijk et al., 2010). Fig. 1 shows a graphicalrepresentation of MST calculation. The MST was used to assess networktopology using several key graph measures indicating network integra-tion. Table 2 shows definitions and interpretations of these measures(Utianski et al., 2016), while Fig. 2 shows more information on MSTs andits association to network integration and graph measures. Summarizing,the MST is a structure that is considered to reflect the structural backboneof the functional connectivity network. Importantly, the structure of theMST is based on the spatial distribution of the underlying functionalconnectivity network. This means that two networks that have the sameaverage functional connectivity (i.e., the arithmetic mean of all pairwisePLI values), but do not have the same pairwise PLI values at each pair ofelectrodes, the two networks can have different MSTs, leading todifferent values of graph measures. Supplementary Fig. S4 providesan example.
1.5. Control analyses
1.5.1. Eye blinksAs participants meditated with their eyes open, and regressing out
eye-blinks can theoretically influence the underlying connectivity ma-trix, we investigated whether excluding segments with eye-blinks wouldaffect results. In this analysis, per participant the first ten segmentswithout eye-blinks were selected from the original twenty segments tokeep the number of segments consistent across participants. Participantswere excluded in this analysis if there were less than 10 segments thatcontained no eye-blinks.
1.5.2. Interpolation of bad leads 1As recreation of bad channels influences the underlying connectivity
matrix, we investigated whether excluding the bad channels in MSTcalculation and subsequent graph measures for the datasets that had badchannels would affect group results. Six out of 16 datasets for novicemeditators and for 4 out of 16 datasets for experienced meditators con-tained either 1 or 2 bad leads. Importantly, as calculation of MST graphmeasures in the BrainWave software suite includes application of anormalization factor to account for graph size, graph measures can bestatistically tested across different graph sizes. Bad leads were excludedin MST and subsequent graph measures calculation. Thus, for thesedatasets the MST and subsequent graph measures were calculated basedon an 18 � 18 or a 17 � 17 matrix. For the datasets without bad leads,MST and subsequent graph measures calculation were performed on all19 channels. Differences across groups were then statistically analyzedidentical to the main analysis.
1.5.3. Interpolation of bad leads 2To further explore the effect of lead interpolation, we investigated
whether interpolating leads in a dataset that did not contain bad leadsaffected results. For this, one dataset was randomly picked. In the data-sets containing bad leads, they were observed in 1–2 positions in a total
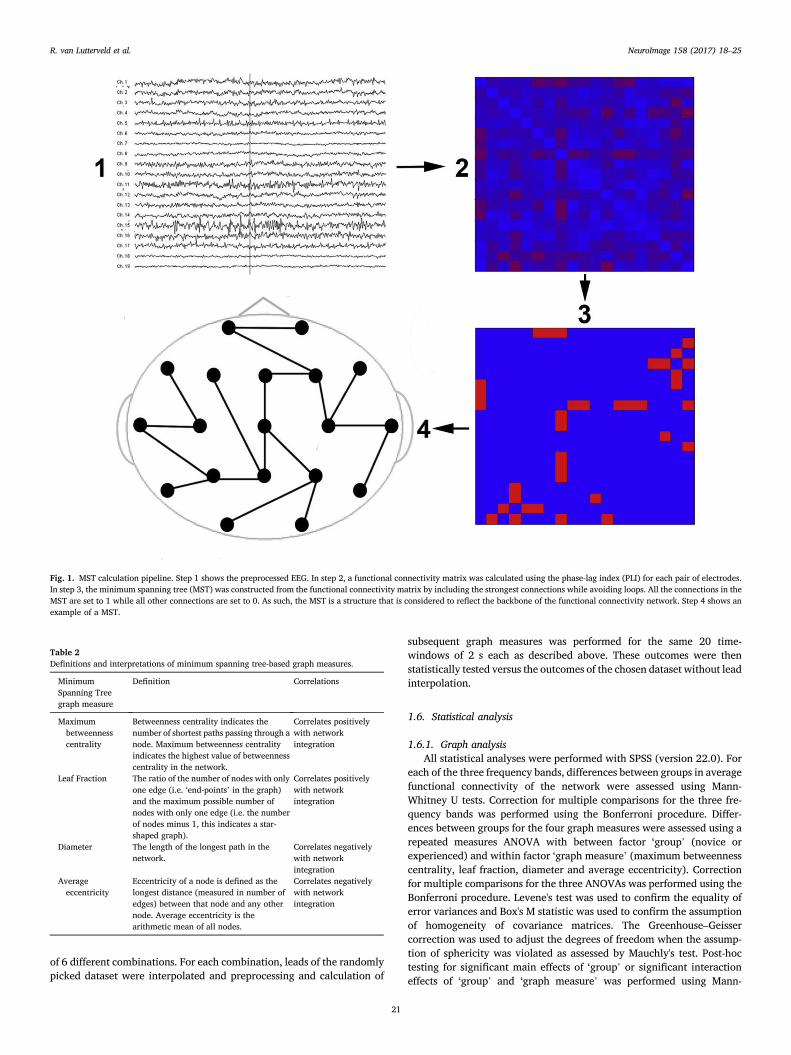
Fig. 1. MST calculation pipeline. Step 1 shows the preprocessed EEG. In step 2, a functional connectivity matrix was calculated using the phase-lag index (PLI) for each pair of electrodes.In step 3, the minimum spanning tree (MST) was constructed from the functional connectivity matrix by including the strongest connections while avoiding loops. All the connections in theMST are set to 1 while all other connections are set to 0. As such, the MST is a structure that is considered to reflect the backbone of the functional connectivity network. Step 4 shows anexample of a MST.
Table 2Definitions and interpretations of minimum spanning tree-based graph measures.
MinimumSpanning Treegraph measure
Definition Correlations
Maximumbetweennesscentrality
Betweenness centrality indicates thenumber of shortest paths passing through anode. Maximum betweenness centralityindicates the highest value of betweennesscentrality in the network.
Correlates positivelywith networkintegration
Leaf Fraction The ratio of the number of nodes with onlyone edge (i.e. ‘end-points’ in the graph)and the maximum possible number ofnodes with only one edge (i.e. the numberof nodes minus 1, this indicates a star-shaped graph).
Correlates positivelywith networkintegration
Diameter The length of the longest path in thenetwork.
Correlates negativelywith networkintegration
Averageeccentricity
Eccentricity of a node is defined as thelongest distance (measured in number ofedges) between that node and any othernode. Average eccentricity is thearithmetic mean of all nodes.
Correlates negativelywith networkintegration
R. van Lutterveld et al. NeuroImage 158 (2017) 18–25
of 6 different combinations. For each combination, leads of the randomlypicked dataset were interpolated and preprocessing and calculation of
21
subsequent graph measures was performed for the same 20 time-windows of 2 s each as described above. These outcomes were thenstatistically tested versus the outcomes of the chosen dataset without leadinterpolation.
1.6. Statistical analysis
1.6.1. Graph analysisAll statistical analyses were performed with SPSS (version 22.0). For
each of the three frequency bands, differences between groups in averagefunctional connectivity of the network were assessed using Mann-Whitney U tests. Correction for multiple comparisons for the three fre-quency bands was performed using the Bonferroni procedure. Differ-ences between groups for the four graph measures were assessed using arepeated measures ANOVA with between factor ‘group’ (novice orexperienced) and within factor ‘graph measure’ (maximum betweennesscentrality, leaf fraction, diameter and average eccentricity). Correctionfor multiple comparisons for the three ANOVAs was performed using theBonferroni procedure. Levene's test was used to confirm the equality oferror variances and Box's M statistic was used to confirm the assumptionof homogeneity of covariance matrices. The Greenhouse–Geissercorrection was used to adjust the degrees of freedom when the assump-tion of sphericity was violated as assessed by Mauchly's test. Post-hoctesting for significant main effects of ‘group’ or significant interactioneffects of ‘group’ and ‘graph measure’ was performed using Mann-

Fig. 2. Schematic representation of three minimum spanning trees (MSTs) consisting of nine nodes. MST structures can range between a path-like tree (i.e., less integrated network) to astar-like tree (i.e. more integrated network). The figure shows examples of a path-like (A), hierarchical (B) and star-like tree (C). Red nodes represent leaf nodes (i.e. end-nodes in thegraph). Blue nodes represent central nodes. In A, the blue node characteristics are: betweenness centrality ¼ 16 (indicating there are 16 “shortest-paths” connecting any two nodes throughthat node) and eccentricity ¼ 4 (indicating the longest distance between that node and any other node). Red node characteristics are: betweenness centrality ¼ 0 and eccentricity ¼ 8. Treecharacteristics are BCMax ¼ 16, leaf fraction ¼ 0.25 (indicating 2 leaf nodes divided by the potential maximum of 8 leaf nodes as can be observed in figure C), Diameter (i.e. the longestpath in the network) ¼ 8, average eccentricity ¼ 6.2. In B, blue node characteristics are: betweenness centrality ¼ 21 and eccentricity ¼ 2. Red node characteristics are betweennesscentrality ¼ 0 and eccentricity ¼ 4. Tree characteristics are BCMax ¼ 21, leaf fraction ¼ 0.625, diameter ¼ 4 and average eccentricity ¼ 3.4. In C, blue node characteristics are betweennesscentrality ¼ 28 and eccentricity ¼ 1. Red node characteristics are betweenness centrality ¼ 0 and eccentricity ¼ 2. Tree characteristics are BCMax ¼ 28, leaf fraction ¼ 1, diameter ¼ 2,average eccentricity ¼ 1.9. Path-like trees have the disadvantage of being inefficient in the transfer of information, while the star-like tree at the other side of the spectrum has theadvantage that information can spread easily across the network, but the central node might suffer from overloading of information. A hierarchical tree is a hypothesized optimal topology.Please note that the values described above indicate the raw graph values. In the present study, these values are normalized for network size, yielding graph measure values ranging from0 to 1. BCMax ¼ maximum betweenness centrality. Figure is adjusted from (Numan et al., 2017; van Dellen et al., 2014).
R. van Lutterveld et al. NeuroImage 158 (2017) 18–25
Whitney U-tests with a correction for multiple comparisons using theBonferroni procedure. Statistical significance was set at P < 0.05.
1.6.2. Control analysis
1.6.2.1. Eye blinksNine novice meditators and twelve experienced meditators met se-
lection criteria of at least 10 segments without eye-blinks in the twentysegments per EEG. Because of this relatively small, uneven number, non-parametric Mann-Whitney U tests were performed without correction formultiple comparisons.
1.6.2.2. Interpolation of bad leads 1Statistical analysis was performed identical to the main analysis.
1.6.2.3. Interpolation of bad leads 2Differences between the non-interpolated dataset and any of the 6
combinations of interpolation were assessed using separate repeatedmeasures ANOVAs for each frequency band (theta, alpha and beta) andfor each outcome measure (PLI, maximum betweenness centrality, leaffraction, diameter and average eccentricity). The Greenhouse–Geissercorrection was used to adjust the degrees of freedom when the assump-tion of sphericity was violated as assessed by Mauchly's test. Post-hoctesting was performed by comparing each measure of the interpolateddatasets to the non-interpolated dataset using Wilcoxon signed-ranktests. Importantly, to increase sensitivity of the statistical tests in thiscontrol analysis, no correction for multiple comparisons was performedfor the 15 ANOVAs and the post-hoc tests.
2. Results
2.1. Theta band
No significant difference in average functional connectivity wereobserved [median experienced: 0.232, median novice: 0.241, Mann-
22
Whitney U ¼ 95.000; P ¼ 0.214; Pcorrected ¼ 0.642]. For the graphmeasures, no main effect of ‘group’ was observed [F(1,30) ¼ 0.964,P ¼ 0.334, Pcorrected ¼ 1.000] and no significant interaction effects of‘group’ and ‘graph measure’ were observed [F(1.106,33.174) ¼ 0.052,P ¼ 0.845, Pcorrected ¼ 1.000]. These results show that novice andexperienced meditators were not significantly different across the fourgraph measures of network integration in the theta band. Fig. 3 shows agraphical representation of the network integration EEG measures foreach frequency band.
2.2. Alpha band
No significant difference in average functional connectivity wereobserved [median experienced: 0.271, median novice: 0.230; Mann-Whitney U ¼ 72.000; P ¼ 0.035; Pcorrected ¼ 0.105]. For the graphmeasures, no main effect of ‘group’ was observed [F(1,30) ¼ 0.911,P¼ 0.347, Pcorrected¼ 1.000]. A significant interaction effect of ‘group’and ‘graph measure’was observed [F(1.203,36.078)¼ 6.711, P ¼ 0.010,Pcorrected ¼ 0.030]. Post-hoc testing showed that maximum between-ness centrality was significantly higher in the experienced group than inthe novice group [median experienced: 0.737, median novice: 0.718;P ¼ 0.003; Pcorrected ¼ 0.012]. Leaf Fraction showed a trend towardbeing significantly higher in the experienced group than in the novicegroup [median experienced: 0.571, median novice: 0.542; P ¼ 0.014;Pcorrected¼ 0.056]. Diameter was significantly lower in the experiencedgroup than in the novice group [median experienced: 0.425, mediannovice: 0.449; P ¼ 0.004; Pcorrected ¼ 0.016]. Average eccentricity wasalso significantly lower in the experienced group [median experienced:0.336, median novice: 0.355; P ¼ 0.007; Pcorrected ¼ 0.028]. Theseresults show that the brain network in the alpha band is more integratedin experienced than in novice meditators during meditation. Fig. 3 showsa graphical representation of the network integration EEG measures foreach frequency band.

Fig. 3. Boxplots of the network integration graph measures. *: statistically significant at Pcorrected <0.05. BCMax: maximum betweenness centrality. Eccentricity: Average eccentricity.
R. van Lutterveld et al. NeuroImage 158 (2017) 18–25
2.3. Beta band
No significant difference in average functional connectivity wereobserved in the beta band [median experienced: 0.181, median novice:0.184, Mann-Whitney U ¼ 96.000; P ¼ 0.228, Pcorrected ¼ 0.684]. Forthe graph measures, no main effect of ‘group’ was observed[F(1,30) ¼ 1.293, P ¼ 0.265, Pcorrected ¼ 0.768] and no significantinteraction effects of ‘group’ and ‘graph measure’ were observed[F(1.239,37.156)¼ 0.305, P¼ 0.632, Pcorrected¼ 1.000]. These resultsshow that novice and experienced meditators were not significantlydifferent across the four graph measures of network integration in thebeta band. Fig. 3 shows a graphical representation of the network inte-gration EEG measures for each frequency band.
2.4. Stability analysis
Supplementary data S3 shows the stability analysis for the variousfrequency bands, indicating relative stability of average functional con-nectivity across frequency bands for the 20 segments used in this study.
2.5. Control analysis
2.5.1. Eye-blinksIn the analysis in which segments with eye-blinks were excluded, no
significant differences in average functional connectivity were observedin any of the three frequency bands, identical to the main analysis. Forthe theta band, no significant differences were observed for any of thefour graph measures, identical to the main analysis. For the alpha band,maximum betweenness centrality was significantly higher in the
23
experienced group than in the novice group, identical to the main anal-ysis [median experienced: 0.745, median novice: 0.707; P ¼ 0.007]. LeafFraction was significantly higher in the experienced group than in thenovice group, which was a trend in the same direction in the mainanalysis [median experienced: 0.583, median novice: 0.539; P ¼ 0.023].Diameter was significantly lower in the experienced group than in thenovice group, identical to the main analysis [median experienced: 0.422,median novice: 0.444; P ¼ 0.012]. Average eccentricity was also signif-icantly lower in the experienced group than in the novice group, identicalto the main analysis [median experienced: 0.335, median novice: 0.358;P ¼ 0.009]. For the beta band, Leaf Fraction was significantly higher inthe experienced group than in the novice group, which was non-significant in the main analysis [median experienced: 0.556, mediannovice: 0.528; P ¼ 0.034]. For the other measures in the beta band, nosignificant differences between groups were observed, which is identicalto the main analysis. These results show that the results in the alpha-bandare robust regarding the occurrence of eye-blinks. An overview of medianvalues and associated P-values is provided in Supplementary Table S5.
2.5.2. Interpolation of bad leads 1For the theta band, no significant differences in average functional
connectivity were observed, identical to the main analysis. In addition,no main effect of ‘group’ was observed and no significant interactioneffects of ‘group’ and ‘graphmeasure’was observed, identical to the mainanalysis. For the alpha band, no significant differences in functionalconnectivity were observed, identical to the main analysis. A significantinteraction effect of ‘group’ and ‘graph measure’ was observed, identicalto the main analysis [F(1.208,36.241) ¼ 6.870, P ¼ 0.009,Pcorrected ¼ 0.027]. Post-hoc testing showed that maximum

R. van Lutterveld et al. NeuroImage 158 (2017) 18–25
betweenness centrality was significantly higher in the experienced groupthan in the novice group, identical to the main analysis [median expe-rienced: 0.742, median novice: 0.716; P ¼ 0.004; Pcorrected ¼ 0.016].No significant differences in Leaf Fraction were observed across groups,which showed a trend in the main analysis [median experienced: 0.571,median novice: 0.552; P ¼ 0.035; Pcorrected ¼ 0.105]. Diameter wassignificantly lower in the experienced group than in the novice group,identical to the main analysis [median experienced: 0.426, mediannovice: 0.450; P ¼ 0.003; Pcorrected ¼ 0.012]. Average eccentricity wasalso significantly lower in the experienced group, identical to the mainanalysis [median experienced: 0.343, median novice: 0.361; P ¼ 0.004;Pcorrected ¼ 0.016]. For the beta band, no significant differences inaverage functional connectivity were observed, identical to the mainanalysis. In addition, no main effect of ‘group’ was observed and nosignificant interaction effects of ‘group’, identical to the main analysis.These results suggest that the results in the main analysis are relativelyrobust to the interpolation of bad leads performed. An overview of me-dian values and associated P-values is provided in Supplemen-tary Table S6.
2.5.3. Interpolation of bad leads 2No significant results were observed for any combination of fre-
quency band and functional connectivity and graph measure. These re-sults suggest that the outcome measures are relatively robust to theinterpolations performed in this study. An overview of median values andassociated P-values is provided in Supplementary Table S7.
3. Discussion
This is the first study assessing EEG measures of network integrationassociated with meditation using a minimal spanning tree approach. Wepartly confirmed our hypothesis that experienced meditators showedincreased EEG measures of network integration during meditation rela-tive to novice meditators. In the alpha band, three out of four measuresindicated increased network integration in experienced meditatorsrelative to novice meditators in the alpha band, while the fourth measureshowed the same trend nearing significance.
These results suggest that the alpha band functional connectivitynetwork is more integrated in experienced meditators than in novicemeditators, which could facilitate information exchange betweendifferent brain areas. Speculating, increased integration of brain net-works may underlie some of the beneficial effects of meditation, such asimproved cognition (for a recent meta-analysis see Sedlmeier et al.(2012)). For example, a recent study observed an association betweencognition and the same four MST EEG network integrationmeasures as inthe present study in Parkinson's patients with varying degrees of cogni-tive functioning (Utianski et al., 2016). Specifically, all sixteen correla-tions indicated positive (though small) relationships between networkintegration in alpha sub-bands and measures of cognition, from whichfour reached statistical significance. A longitudinal MEG study in Par-kinson's patients also observed a link between declining cognitive per-formance and decreasing MST network integration in an alpha sub-band(Olde Dubbelink et al., 2014). In addition, another study found correla-tions between MST EEG measures of network integration and measuresof cognition in patients with Dementia with Lewy Bodies (van Dellenet al., 2015). Together, these findings provide the groundwork for futurestudies that directly link these measures of network integration with thesalutary effects that are being found with various meditation practices.
To the best of our knowledge, to date one previous EEG study hasinvestigated the relationship between meditation and network integra-tion. This group observed that a meditation intervention increasednetwork efficiency (which can be considered a measure of networkintegration) in the theta band as assessed by the harmonic mean of theshortest path length between each pair of electrodes (Xue et al., 2014).Differences between this finding and the observation of no associationbetween meditation experience and network integration in the theta-
24
band in the present study may be explained by the present study'scross-sectional design, the present study's focus on effortless awarenessduring meditation, and the difference in network integration measuresused. Also, the Xue et al. study used synchronization likelihood tocalculate functional connectivity. A main issue with EEG functionalconnectivity calculation, such as synchronization likelihood, is that it issensitive to volume conduction, potentially interfering with accuratefunctional connectivity assessment (Stam et al., 2007).
3.1. Control analyses
An important issue in the present study regards the interpolation ofbad leads, as this can affect calculation of the functional connectivitymatrix and hence subsequent MST and graph measure calculation.Ideally, one would want clean data without bad leads. However, as thisstudy is a secondary data-analysis of an existing dataset, this was un-fortunately not feasible. To verify the validity of the results, a controlanalysis was conducted in which bad leads were excluded instead ofinterpolated, finding similar results as in the interpolation analysis. Inline with this finding was a second control analysis, showing no signifi-cant effects of interpolation on outcome measures. As such, the presentfindings seem to be relatively robust to the interpolations performed inthis study. Another important issue that could affect calculation of thefunctional connectivity matrix is the occurrence of eye-blinks. However,when only segments without eye-blinks were analyzed, similar results asin the main analysis were observed, which is suggestive of a relativerobustness of the outcome measures to the occurrence of eye-blinks.
Importantly, the results of this cross-sectional study provide therationale to investigate whether there is an association between thenetwork integration measures in the alpha band and the subjectiveexperience of meditation quality in real-time, similar to our previouslyreported link between 40 and 57 Hz gamma activity in the posteriorcingulate cortex and the subjective experience of effortless awareness(Van Lutterveld et al., 2017). If in future neurophenomenology experi-ments a temporal relation can be observed between these new measuresand the subjective experience of meditation quality, this would providethe rationale to investigate the efficacy of this measure in a neurofeed-back randomized controlled trial. Further, these measures could bestudied by themselves, or in combination with previously establishedmarkers to optimize specificity and sensitivity as the field homes in onmarkers not just of meditation itself, but specific aspects and qualitiestherein. Advances such as these are important for moving the field for-ward as our knowledge of different domains of meditative experience arefurther defined and elucidated (Lutz et al., 2015).
3.2. Limitations
We recruited our meditation sample from a variety of traditions asthis approach was intended to increase generalizability across meditationtraditions and techniques. Importantly, both novice and experiencedmeditators performed a meditation that supported effortless awareness.This approach was chosen as effortless awareness has been found to be amajor component of meditation practice across a variety of meditationtraditions, including Theravada, Zen, Catholic Contemplative andGelugpa of Tibetan Buddhism (Garrison et al., 2013b). Still, meditationpractices may vary in how much emphasis is placed on factors that un-derlie effortless awareness.
In addition, it should be noted that novice meditators performed ameditation practice (noting practice) that was different from the expe-rienced meditators, who performed an individually chosen meditationpractice that they considered most effortless. As such, group instructionswere different. However, in pilot studies we found that for novices,noting practice was the least effortful form of meditation. Moreover,novices are easily trained to proficiency in this meditation practice (VanLutterveld et al., 2017). In addition, in pilot experiments we observedthat experienced meditators who were proficient in a different

R. van Lutterveld et al. NeuroImage 158 (2017) 18–25
meditation practice than noting practice, actually found noting practicemore effortful than their own meditation practice. For this reason, wechose to implement instructions for both groups that focused on themethod that was most effortless for that group. An important consider-ation in the present study is that, although there is evidence that medi-tation induces effortless awareness in experienced meditators (Garrisonet al., 2013a) and in novice meditators (Van Lutterveld et al., 2017), itshould be noted that it is unclear to exactly what extent the notingpractice task induced the subjective experience of effortless awareness.Also, meditation practices typically also involve contextual components,such as for example intentions for practice, ethical consideration, relatedconceptual beliefs, and community support. As such, the interpretation ofcurrent results remains limited to that of effortless awareness meditationin a decontextualized research setting (Garrison et al., 2013a). It isimportant to note that we focused on a limited number of EEG electrodes.The prime rationale behind this was future scalability. The end-goal ofthis research is to develop new neurofeedback measures that can easilybe used to inform meditators on their meditation quality, i.e. outside ofresearch lab settings. As such, a limited number of electrodes is para-mount as this boosts future ease-of-use. In addition, this kept in line withthe previous MST literature (that reports on 19 to 21 electrodes) (Engelset al., 2015; Utianski et al., 2016; van Dellen et al., 2015) and facilitatedsegment selection. Another limitation of the current study is the rela-tively small sample size. However, all of our measures in the alpha bandshowed convergence in pointing toward increased network integration,providing confidence in the present results. An alternative design of thepresent study to identify a possible association between meditation andgraph measures of network integration would be a within-subjects designwith experienced meditators, contrasting the meditation state with aresting state. However, during piloting, several of the experiencedmeditators reported that their resting-state was actually a meditation-state, i.e. they had come to a point in their meditation practice wherethey were in a continuous meditative state. To be in a non-meditativestate would actually be effortful for them, as the meditative state hasbecome their ‘default state’ (Brewer et al., 2011). To be able to includethese very advanced practitioners, who constitute the end-goal of a po-tential neurofeedback paradigm, we felt a cross-section design would bemore appropriate. As well, self-report measures on the “effortlessness” ofthe meditations during the runs were not acquired, which could haveshed additional light on the present results. Finally, we conducted thisstudy in a hypothesis-driven way. Machine learning approaches could beemployed to identify other markers of meditation quality.
In sum, experienced meditators showed increased measures ofnetwork integration in the alpha band. These findings provide therationale to investigate the relation between these measures and depth ofmeditation in neurophenomenology experiments.
Acknowledgements
This research was supported by NIH/NCCIH grant R01 AT007922-01and UMASS Medical School institutional funds. Previous versions of thiswork were presented as a poster at the Neuroscience 2016 conference.
Appendix A. Supplementary data
Supplementary data related to this article can be found at http://dx.doi.org/10.1016/j.neuroimage.2017.06.071.
References
Brandmeyer, T., Delorme, A., 2013. Meditation and neurofeedback. Front. Psychol. 4,688.
25
Brewer, J.A., Worhunsky, P.D., Gray, J.R., Tang, Y.Y., Weber, J., Kober, H., 2011.Meditation experience is associated with differences in default mode network activityand connectivity. Proc. Natl. Acad. Sci. U. S. A. 108, 20254–20259.
Engels, M.M., Stam, C.J., van der Flier, W.M., Scheltens, P., de Waal, H., vanStraaten, E.C., 2015. Declining functional connectivity and changing hub locations inAlzheimer's disease: an EEG study. BMC Neurol. 15, 145.
Fronsdal, G., 2008. Mental Noting (Accessed August 3, 2015). http://www.insightmeditationcenter.org/books-articles/articles/mental-noting.
Garrison, K.A., Santoyo, J.F., Davis, J.H., Thornhill, T.A.t., Kerr, C.E., Brewer, J.A., 2013a.Effortless awareness: using real time neurofeedback to investigate correlates ofposterior cingulate cortex activity in meditators' self-report. Front. Hum. Neurosci. 7,440.
Garrison, K.A., Scheinost, D., Worhunsky, P.D., Elwafi, H.M., Thornhill, T.A.t.,Thompson, E., Saron, C., Desbordes, G., Kober, H., Hampson, M., Gray, J.R.,Constable, R.T., Papademetris, X., Brewer, J.A., 2013b. Real-time fMRI linkssubjective experience with brain activity during focused attention. Neuroimage 81,110–118.
Goyal, M., Singh, S., Sibinga, E.M., Gould, N.F., Rowland-Seymour, A., Sharma, R.,Berger, Z., Sleicher, D., Maron, D.D., Shihab, H.M., Ranasinghe, P.D., Linn, S.,Saha, S., Bass, E.B., Haythornthwaite, J.A., 2014. Meditation programs forpsychological stress and well-being: a systematic review and meta-analysis. JAMAIntern Med. 174, 357–368.
Gratton, G., Coles, M.G., Donchin, E., 1983. A new method for off-line removal of ocularartifact. Electroencephalogr. Clin. Neurophysiol. 55, 468–484.
Hagemann, D., Naumann, E., 2001. The effects of ocular artifacts on (lateralized)broadband power in the EEG. Clin. Neurophysiol. 112, 215–231.
Kelley, W.M., Macrae, C.N., Wyland, C.L., Caglar, S., Inati, S., Heatherton, T.F., 2002.Finding the self? An event-related fMRI study. J. Cognit. Neurosci. 14, 785–794.
Lomas, T., Ivtzan, I., Fu, C.H., 2015. A systematic review of the neurophysiology ofmindfulness on EEG oscillations. Neurosci. Biobehav. Rev. 57, 401–410.
Lutz, A., Jha, A.P., Dunne, J.D., Saron, C.D., 2015. Investigating the phenomenologicalmatrix of mindfulness-related practices from a neurocognitive perspective. Am.Psychol. 70, 632–658.
Numan, T., Slooter, A.J.C., van der Kooi, A.W., Hoekman, A.M.L., Suyker, W.J.L.,Stam, C.J., van Dellen, E., 2017. Functional connectivity and network analysis duringhypoactive delirium and recovery from anesthesia. Clin. Neurophysiol. 128,914–924.
Olde Dubbelink, K.T., Hillebrand, A., Stoffers, D., Deijen, J.B., Twisk, J.W., Stam, C.J.,Berendse, H.W., 2014. Disrupted brain network topology in Parkinson's disease: alongitudinal magnetoencephalography study. Brain 137, 197–207.
Porz, S., Kiel, M., Lehnertz, K., 2014. Can spurious indications for phase synchronizationdue to superimposed signals be avoided? Chaos 24, 033112.
Sedlmeier, P., Eberth, J., Schwarz, M., Zimmermann, D., Haarig, F., Jaeger, S., Kunze, S.,2012. The psychological effects of meditation: a meta-analysis. Psychol. Bull. 138,1139–1171.
Stam, C.J., Nolte, G., Daffertshofer, A., 2007. Phase lag index: assessment of functionalconnectivity from multi channel EEG and MEG with diminished bias from commonsources. Hum. Brain Mapp. 28, 1178–1193.
Stam, C.J., Tewarie, P., Van Dellen, E., van Straaten, E.C., Hillebrand, A., VanMieghem, P., 2014. The trees and the forest: characterization of complex brainnetworks with minimum spanning trees. Int. J. Psychophysiol. 92, 129–138.
Tewarie, P., van Dellen, E., Hillebrand, A., Stam, C.J., 2015. The minimum spanning tree:an unbiased method for brain network analysis. Neuroimage 104, 177–188.
Utianski, R.L., Caviness, J.N., van Straaten, E.C., Beach, T.G., Dugger, B.N., Shill, H.A.,Driver-Dunckley, E.D., Sabbagh, M.N., Mehta, S., Adler, C.H., Hentz, J.G., 2016.Graph theory network function in Parkinson's disease assessed withelectroencephalography. Clin. Neurophysiol. 127, 2228–2236.
van Dellen, E., de Waal, H., van der Flier, W.M., Lemstra, A.W., Slooter, A.J., Smits, L.L.,van Straaten, E.C., Stam, C.J., Scheltens, P., 2015. Loss of EEG network efficiency isrelated to cognitive impairment in dementia with Lewy bodies. Mov. Disord. 30,1785–1793.
van Dellen, E., Douw, L., Hillebrand, A., de Witt Hamer, P.C., Baayen, J.C., Heimans, J.J.,Reijneveld, J.C., Stam, C.J., 2014. Epilepsy surgery outcome and functional networkalterations in longitudinal MEG: a minimum spanning tree analysis. Neuroimage 86,354–363.
Van Lutterveld, R., Houlihan, S., Pal, P., Sacchet, M.D., McFarlane-Blake, C., Patel, P.,Sullivan, J.S., Ossadtchi, A., Druker, S., Bauer, C., Brewer, J., 2017. Source estimatedEEG neurofeedback links subjective experience with brain activity during meditation.Neuroimage 151, 117–127.
van Wijk, B.C., Stam, C.J., Daffertshofer, A., 2010. Comparing brain networks of differentsize and connectivity density using graph theory. PLoS ONE 5, e13701.
Whitham, E.M., Pope, K.J., Fitzgibbon, S.P., Lewis, T., Clark, C.R., Loveless, S.,Broberg, M., Wallace, A., DeLosAngeles, D., Lillie, P., Hardy, A., Fronsko, R.,Pulbrook, A., Willoughby, J.O., 2007. Scalp electrical recording during paralysis:quantitative evidence that EEG frequencies above 20 Hz are contaminated by EMG.Clin. Neurophysiol. 118, 1877–1888.
Xue, S.W., Tang, Y.Y., Tang, R., Posner, M.I., 2014. Short-term meditation induceschanges in brain resting EEG theta networks. Brain Cognit. 87, 1–6.
Yuval-Greenberg, S., Tomer, O., Keren, A.S., Nelken, I., Deouell, L.Y., 2008. Transientinduced gamma-band response in EEG as a manifestation of miniature saccades.Neuron 58, 429–441.