Embed Size (px)
Citation preview
Medium Term
Budget Policy Statement
2016
National Treasury
Republic of South Africa
26 October 2016
ii
ISBN: 978-0-621-44971-6 RP: 342/2016 The Medium Term Budget Policy Statement is compiled using the latest available information from departmental and other sources. Some of this information is unaudited or subject to revision. To obtain additional copies of this document, please contact:
Communications Directorate National Treasury Private Bag X115 Pretoria 0001 South Africa Tel: +27 12 315 5944 Fax: +27 12 406 9055
The document is also available on the internet at: www.treasury.gov.za.
iii
Foreword
World economics and politics are in a state of flux, marked by high levels of uncertainty. Anaemic growth and investment, in tandem with a widening trust deficit between ordinary people and elites, have brought global inequality into sharper focus.
The National Development Plan (NDP), our roadmap to rid South Africa of poverty and fight inequality, targets growth of 5.4 per cent. The 2012 Medium Term Budget Policy Statement (MTBPS) forecast that we would be growing at 3.5 per cent by 2016. But real GDP growth has slowed markedly, and the economy is now expected to record growth of just 0.5 per cent this year.
This is much too slow for us to radically remake South Africa into a society based on social justice and dignity for all.
In response to the new global reality and the need to scale up the pace of social transformation, we have been adjusting fiscal policy to achieve stability and sustainability. A stable and sustainable fiscus, alongside economic reforms and transparent monetary policy, will support a return to the growth rates needed to achieve the NDP’s goals. Our efforts have narrowed the budget deficit, even as gross debt and debt-service costs have grown. However, low levels of economic growth will require additional revenue measures and further spending cuts over the medium term. These actions should see net national debt stabilise at 47.9 per cent of GDP in 2019/20.
Economic growth is forecast to increase moderately over the next three years, but there are significant domestic risks to the outlook. New spending pressures also continue to materialise, and liquidity risks at some state-owned companies persist. What we need most right now is faster, inclusive, job-creating growth. All of us need to act with greater urgency and singularity of purpose to remove obstacles to growth in the economy and inefficiencies in public spending.
Government continues to strengthen its active collaboration with business and labour to revive investment growth, and is working to provide greater policy certainty and improve labour relations. Our efforts will continue to be multifaceted: promoting inclusive growth, cultivating business and consumer confidence, and spurring investment.
In the meantime, as these reforms make themselves felt, we face difficult choices about how best to use the limited resources we have, and how those resources will be shared in a time of great need.
Our constitutional mandate is unequivocal: public funds must be spent for the common good.
To that end, government proposes to enhance the investment in our future and protect the progress we have made towards realising the fundamental rights of all who live in South Africa. The proposals include sustaining spending on social services and economic infrastructure, and reallocating funds to reduce hardships faced by higher education students in financial need.
These and the other proposals that follow reflect the outcomes of extensive deliberations and suggestions from across government, as well as inputs from the President and my colleagues in Cabinet. I am immensely grateful to Deputy Minister Mcebisi Jonas, Director-General Lungisa Fuzile and the staff at the National Treasury for their hard work and diligence in the preparation of this policy statement.
Pravin J Gordhan Minister of Finance
iv
Contents
Chapter 1 Act together for a better future ...................................................................... 1 Introduction ....................................................................................................... 1 Building a coalition for faster growth ................................................................. 2 A measured fiscal consolidation ....................................................................... 4 Funding post-school education and training ..................................................... 6 Institutions and inclusive transformation ........................................................... 8 Conclusion ........................................................................................................ 8 Chapter 2 Economic outlook ........................................................................................... 9 Economic growth and transformation ............................................................... 9 Global outlook ................................................................................................... 10 Domestic outlook and developments ................................................................ 12 Reforms advancing economic transformation ................................................... 17 Conclusion ........................................................................................................ 22 Chapter 3 Fiscal policy .................................................................................................... 23 Creating conditions for faster growth ................................................................ 23 Stabilising debt and encouraging investment.................................................... 24 Medium-term considerations ............................................................................. 26 The fiscal framework ......................................................................................... 29 National debt outlook ........................................................................................ 30 Managing risks to the fiscal strategy ................................................................. 30 Conclusion ........................................................................................................ 32 Chapter 4 Expenditure priorities and division of revenue ............................................ 33 Budget priorities and fiscal restraint .................................................................. 33 Improving the quality of spending ..................................................................... 35 Medium-term spending proposals ..................................................................... 37 Division of revenue ........................................................................................... 45 Conclusion ........................................................................................................ 46 Annexures Fiscal risk statement ...................................................................................... 49 Introduction ....................................................................................................... 49 Institutional strengths and fiscal risk ................................................................. 50 Macroeconomic risks ........................................................................................ 51 Policy and budget execution risks ..................................................................... 54 Contingent and accrued liability risks ................................................................ 55 Long-term fiscal risks ........................................................................................ 56 Conclusion ........................................................................................................ 57 Technical annexure ........................................................................................ 59 Introduction ....................................................................................................... 59 Assumptions for the macroeconomic forecast .................................................. 59 The fiscal framework ......................................................................................... 60 Financing the borrowing requirement and national debt outlook ...................... 65 2015/16 outcomes and 2016/17 mid-year estimates ........................................ 67 Adjusted Estimates of National Expenditure ..................................................... 68 Division of revenue ........................................................................................... 69 Glossary .......................................................................................................... 75
v
Tables
1.1 Macroeconomic projections .............................. 3 1.2 Consolidated government fiscal framework ...... 5 1.3 Consolidated government expenditure ............. 6 2.1 Annual percentage change in GDP and consumer
price inflation, selected regions/countries ......... 11 2.2 Macroeconomic projections .............................. 14 2.3 Distribution of South African exports by
country/region ................................................... 15 3.1 Announced consolidation measures ................. 25 3.2 Consolidated current and capital balances ....... 26 3.3 Real GDP growth projections ............................ 27 3.4 Consolidated fiscal framework .......................... 29 4.1 Baseline reductions to support new priorities ... 35 4.2 Consolidated expenditure by function ............... 38 4.3 Consolidated expenditure by economic classification ...................................................... 39 4.4 Additions to support universities and students . 40 4.5 Division of revenue ............................................ 45 T.1 Assumptions underpinning the macroeconomic
forecast ............................................................. 59 T.2 Total tax and consolidated budget revenue ...... 60 T.3 Financial transactions receipts and payments .. 61 T.4 Tax revenue outcomes, projections and
assumptions ...................................................... 62 T.5 Main budget expenditure ceiling ....................... 63 T.6 Consolidated fiscal framework .......................... 64 T.7 Selected items of goods and services and capital spending: national and provincial government ....................................................... 65 T.8 Financing of national government borrowing
requirement ....................................................... 66 T.9 Total national government debt ........................ 67 T.10 Performance against strategic portfolio risk
benchmarks ....................................................... 67 T.11 National and provincial expenditure: 2015/16
outcomes and 2016/17 mid-year estimates ...... 68 T.12 Main budget framework .................................... 70 T.13 Changes to division of revenue ......................... 70 T.14 Provincial equitable share ................................. 72 T.15 Expenditure by vote .......................................... 73 T.16 Expenditure by province ................................... 74
Figures 1.1 Trend economic growth ....................................... 2 1.2 Main budget spending per capita in 2015 prices . 4 1.3 Index of budget allocations in real terms ............. 7 1.4 Post-school education and training budget as a share of GDP ....................................................... 7 2.1 GDP growth and business confidence ................. 10 2.2 Growth in sub-Saharan Africa .............................. 12 2.3 Contribution to economic growth by sector .......... 13 2.4 Import-price inflation and nominal exchange rate depreciation .......................................................... 17 3.1 Gross debt of South African government, households and non-financial corporations ......... 24 3.2 Main budget primary balance ............................... 26 3.3 National and provincial headcount ....................... 28 3.4 Real growth of main budget non-interest spending ............................................................... 28 3.5 National gross and net debt outlook .................... 30 4.1 Real spending growth in selected goods and services ................................................................ 36 4.2 Nominal growth in expenditure ............................ 37 A.1 Government’s fiscal risk framework ..................... 49 A.2 Downward revisions to growth forecast ............... 51 A.3 Gross tax buoyancy ............................................. 51 A.4 Growth scenarios and results .............................. 53 A.5 Maturity profile of government debt, 30 September 2016 .............................................. 54
vi
What is the Medium Term Budget Policy Statement? The Medium Term Budget Policy Statement (MTBPS) is a government policy document that communicates to Parliament and the country the economic context in which the forthcoming budget will be presented, along with fiscal policy objectives and spending priorities over the three-year expenditure period.
The policy statement is an important part of South Africa’s open and accountable budget process. It empowers Parliament to discuss and shape government’s approach to the budget.
The Money Bills Amendment Procedure and Related Matters Act (2009) requires government to table the MTBPS in Parliament at least three months before the national budget is presented. The statement must include:
A revised fiscal framework for the current financial year and the proposed fiscal framework for the next three years.
An explanation of the macroeconomic and fiscal policy position, and macroeconomic projections and assumptions underpinning the fiscal framework.
The spending priorities of government for the next three years.
The proposed division of revenue between national, provincial and local government for the next three years.
Any substantial proposed adjustments to conditional grant allocations to provinces and local governments.
A review of spending by each national department and each provincial government between 1 April and 30 September of the current financial year.
Parliament’s finance committees consider the revised fiscal framework for the current year, the proposed medium-term fiscal framework, the explanation of the macroeconomic and fiscal policy position, and the projections and assumptions. The appropriation committees examine national spending priorities for the next three years, the proposed division of revenue and adjustments to conditional grant allocations.
These committees report to their respective houses of Parliament on the proposed fiscal framework and division of revenue. A report may include amendments to the proposed fiscal framework and division of revenue. The adopted reports serve as a mandate for government to prepare the forthcoming budget in accordance with the policy approach of the MTBPS.
1
1 Act together for a better future
The aim of the National Development Plan is to create a virtuous circle of growth and transformation to eliminate poverty and reduce inequality. But since the plan’s adoption, economic circumstances have changed. Sustaining progress towards the vision of national development requires a new approach and a greater sense of urgency.
The 2016 Medium Term Budget Policy Statement (MTBPS) assumes that the economic cycle has reached its lowest point. Necessary adjustments have been painful, but a recession has been avoided and a recovery is emerging. Rapid implementation of decisions to promote faster growth will boost confidence, investment and employment. Without decisive action, the recovery is likely to be weak and ineffectual.
Difficult decisions will be made to ensure sustainable public finances. The MTBPS puts forward measured proposals to narrow the budget deficit and stabilise debt. Without taking these steps, we risk opening the door to rapid capital outflows and further economic disruption, setting back transformation, and leading to higher unemployment and social distress.
Citizens are registering their concerns. They want government to talk less and achieve more, act decisively against corruption and waste, contribute to growth and job creation, and speed up inclusive transformation and social justice. Much depends on joint action to restore confidence and mobilise private investment to avoid a low-growth trap.
Introduction
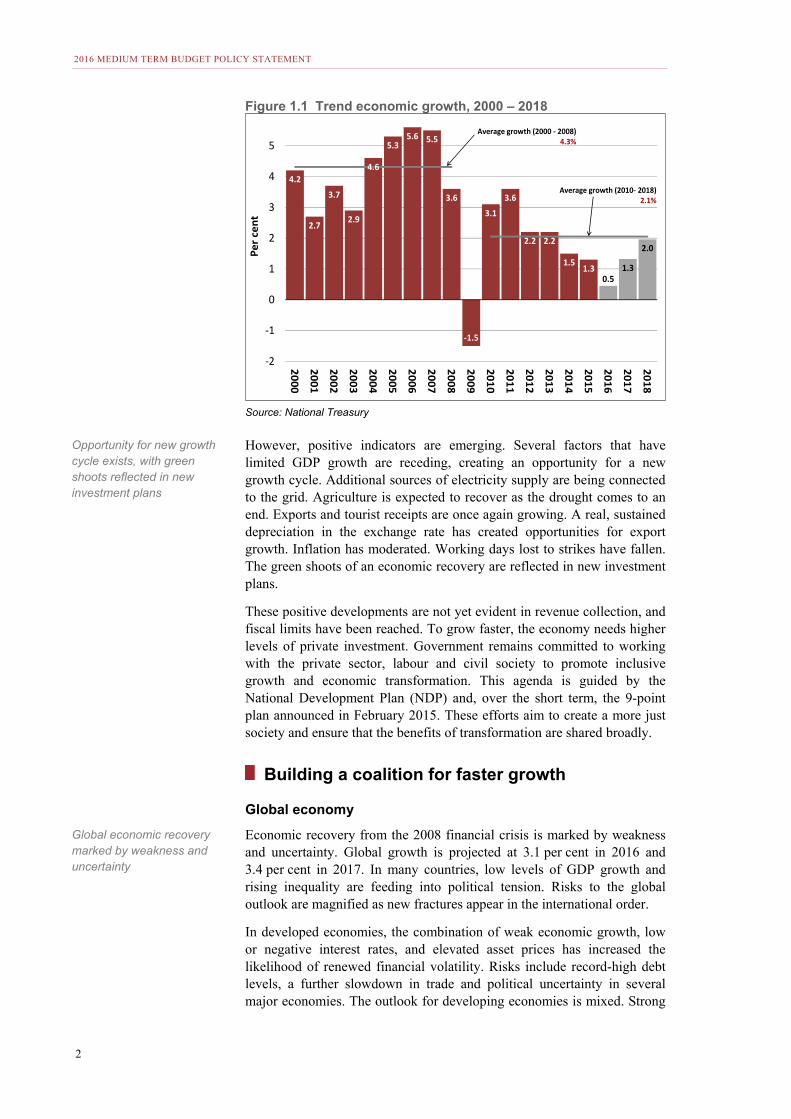
outh Africa is undergoing a difficult economic transition. The trend growth rate – that is, the long-term average rate of GDP growth – has fallen from 4 per cent a decade ago to 2 per cent today.
This partly reflects global realities – a protracted slowdown in trade, lower commodity prices and a high risk of external volatility. It is also the result of continued structural constraints and low levels of investor confidence in the domestic economy, which have led to rising unemployment. Perceptions of elevated political risk, and concerns about the ability of public institutions to make decisions on difficult trade-offs and manage change, have undermined confidence.
S Structural constraints and low levels of investor confidence hold back economic growth
2016 MEDIUM TERM BUDGET POLICY STATEMENT
2
Figure 1.1 Trend economic growth, 2000 – 2018
Source: National Treasury
However, positive indicators are emerging. Several factors that have limited GDP growth are receding, creating an opportunity for a new growth cycle. Additional sources of electricity supply are being connected to the grid. Agriculture is expected to recover as the drought comes to an end. Exports and tourist receipts are once again growing. A real, sustained depreciation in the exchange rate has created opportunities for export growth. Inflation has moderated. Working days lost to strikes have fallen. The green shoots of an economic recovery are reflected in new investment plans.
These positive developments are not yet evident in revenue collection, and fiscal limits have been reached. To grow faster, the economy needs higher levels of private investment. Government remains committed to working with the private sector, labour and civil society to promote inclusive growth and economic transformation. This agenda is guided by the National Development Plan (NDP) and, over the short term, the 9-point plan announced in February 2015. These efforts aim to create a more just society and ensure that the benefits of transformation are shared broadly.
Building a coalition for faster growth
Global economy
Economic recovery from the 2008 financial crisis is marked by weakness and uncertainty. Global growth is projected at 3.1 per cent in 2016 and 3.4 per cent in 2017. In many countries, low levels of GDP growth and rising inequality are feeding into political tension. Risks to the global outlook are magnified as new fractures appear in the international order.
In developed economies, the combination of weak economic growth, low or negative interest rates, and elevated asset prices has increased the likelihood of renewed financial volatility. Risks include record-high debt levels, a further slowdown in trade and political uncertainty in several major economies. The outlook for developing economies is mixed. Strong
4.2
2.7
3.7
2.9
4.6
5.35.6 5.5
3.6
-1.5
3.1
3.6
2.2 2.2
1.51.3
0.51.3
2.0
-2
-1
0
1
2
3
4
5
2000
2001
2002
2003
2004
2005
2006
2007
2008
2009
2010
2011
2012
2013
2014
2015
2016
2017
2018
Per c
ent
Average growth (2000 - 2008)4.3%
Average growth (2010- 2018)2.1%
Opportunity for new growth cycle exists, with green shoots reflected in new investment plans
Global economic recovery marked by weakness and uncertainty
CHAPTER 1: ACT TOGETHER FOR A BETTER FUTURE
3
GDP growth is projected in India and China, but there is a risk that China’s difficult economic transition could lead to lower growth, with global repercussions. The outlook for sub-Saharan Africa is marked by low commodity prices and falling export revenues. Growth of only 1.4 per cent is expected in the region for 2016.
Small, open economies like South Africa are vulnerable to global shocks. Insufficient fiscal policy space and inability to address financial weaknesses could expose them to sudden capital flow reversals. Economic weakness on the African continent affects South Africa directly. Slower growth in the region and global trade weakness limit export potential.
Restoring domestic confidence
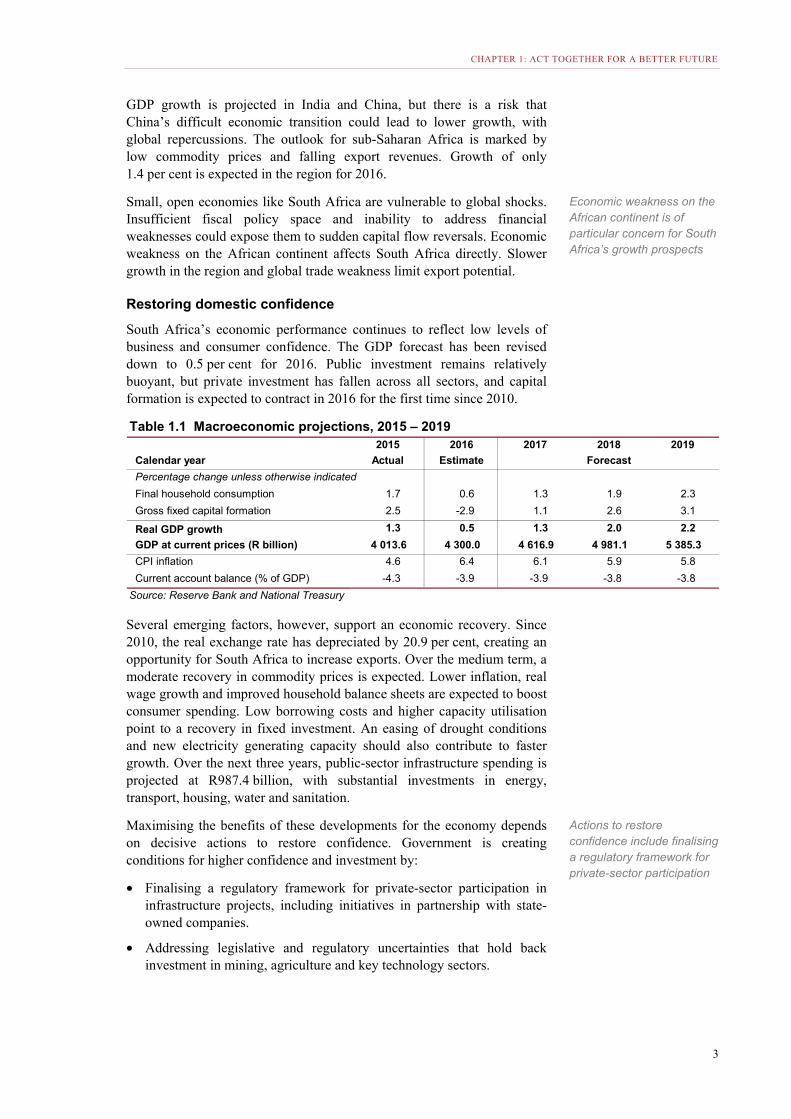
South Africa’s economic performance continues to reflect low levels of business and consumer confidence. The GDP forecast has been revised down to 0.5 per cent for 2016. Public investment remains relatively buoyant, but private investment has fallen across all sectors, and capital formation is expected to contract in 2016 for the first time since 2010.
Several emerging factors, however, support an economic recovery. Since 2010, the real exchange rate has depreciated by 20.9 per cent, creating an opportunity for South Africa to increase exports. Over the medium term, a moderate recovery in commodity prices is expected. Lower inflation, real wage growth and improved household balance sheets are expected to boost consumer spending. Low borrowing costs and higher capacity utilisation point to a recovery in fixed investment. An easing of drought conditions and new electricity generating capacity should also contribute to faster growth. Over the next three years, public-sector infrastructure spending is projected at R987.4 billion, with substantial investments in energy, transport, housing, water and sanitation.
Maximising the benefits of these developments for the economy depends on decisive actions to restore confidence. Government is creating conditions for higher confidence and investment by:
• Finalising a regulatory framework for private-sector participation in infrastructure projects, including initiatives in partnership with state-owned companies.
• Addressing legislative and regulatory uncertainties that hold back investment in mining, agriculture and key technology sectors.
2015 2016 2017 2018 2019
Calendar year Actual Estimate Forecast
Percentage change unless otherwise indicated
Final household consumption 1.7 0.6 1.3 1.9 2.3
Gross fixed capital formation 2.5 -2.9 1.1 2.6 3.1
Real GDP growth 1.3 0.5 1.3 2.0 2.2
GDP at current prices (R billion) 4 013.6 4 300.0 4 616.9 4 981.1 5 385.3
CPI inflation 4.6 6.4 6.1 5.9 5.8
Current account balance (% of GDP) -4.3 -3.9 -3.9 -3.8 -3.8
Source: Reserve Bank and National Treasury
Table 1.1 Macroeconomic projections, 2015 – 2019
Economic weakness on the African continent is of particular concern for South Africa’s growth prospects
Actions to restore confidence include finalising a regulatory framework for private-sector participation
2016 MEDIUM TERM BUDGET POLICY STATEMENT
4
• Rationalising, closing or selling off public assets that are no longer relevant to government’s development agenda, and strengthening those that are central to achieving NDP objectives.
• Concluding labour market reforms.
Government is working in partnership with business and labour to build a foundation for faster growth. This work is directed at encouraging investment in network infrastructure, streamlining investment approvals and improving policy certainty. The Presidential Business Working Group and the CEO Initiative are generating targeted support to the economy by creating funds to support small business and offering internships to 1 million young work seekers. The Independent Power Producer Programme in renewable energy has attracted investments of R194 billion. The programme, which will continue and expand, is an example of the kind of partnerships needed for national development.
Over the medium term, public-sector infrastructure investment will continue to support domestic demand, bolster productive capacity and contribute to social inclusion. It is essential that private investment is encouraged to complement these efforts.
A measured fiscal consolidation
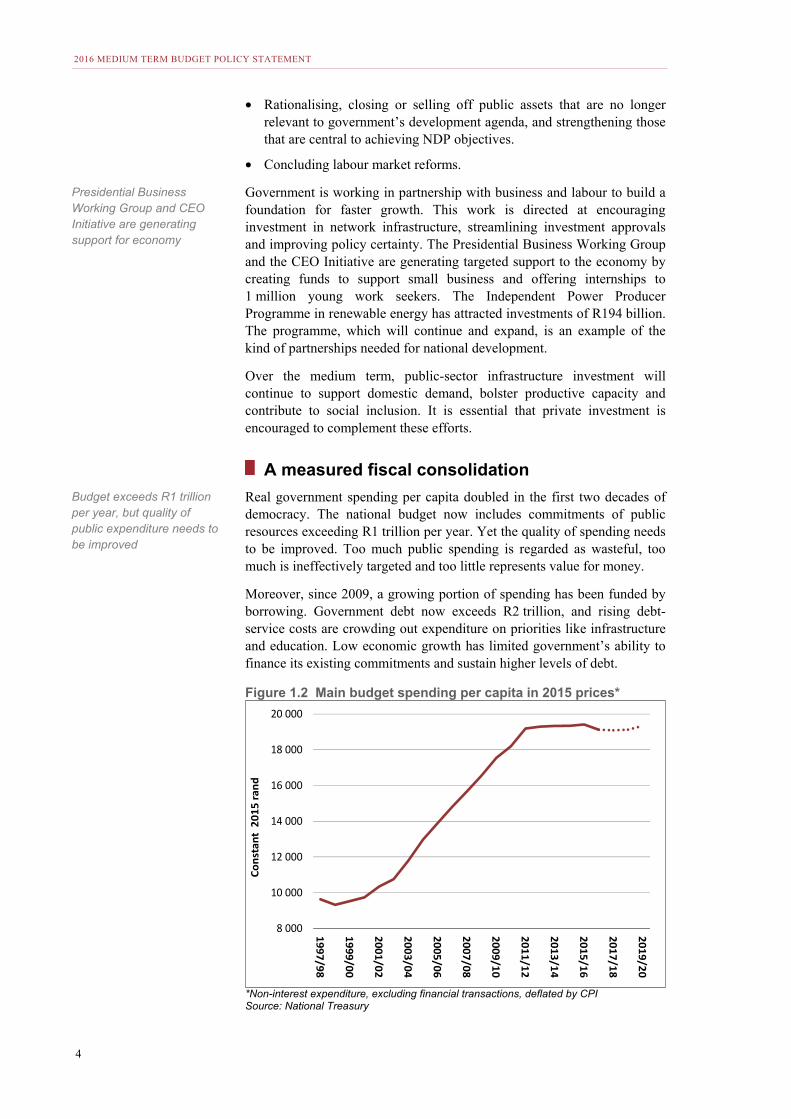
Real government spending per capita doubled in the first two decades of democracy. The national budget now includes commitments of public resources exceeding R1 trillion per year. Yet the quality of spending needs to be improved. Too much public spending is regarded as wasteful, too much is ineffectively targeted and too little represents value for money.
Moreover, since 2009, a growing portion of spending has been funded by borrowing. Government debt now exceeds R2 trillion, and rising debt-service costs are crowding out expenditure on priorities like infrastructure and education. Low economic growth has limited government’s ability to finance its existing commitments and sustain higher levels of debt.
Figure 1.2 Main budget spending per capita in 2015 prices*
*Non-interest expenditure, excluding financial transactions, deflated by CPI Source: National Treasury
8 000
10 000
12 000
14 000
16 000
18 000
20 000
1997/98
1999/00
2001/02
2003/04
2005/06
2007/08
2009/10
2011/12
2013/14
2015/16
2017/18
2019/20
Cons
tant
201
5 ra
nd
Presidential Business Working Group and CEO Initiative are generating support for economy
Budget exceeds R1 trillion per year, but quality of public expenditure needs to be improved
CHAPTER 1: ACT TOGETHER FOR A BETTER FUTURE
5
Medium term: avoiding a low-growth trap
Since the 2009 recession, fiscal and monetary policy have been supportive of the economic recovery. Over the medium term, fiscal policy aims to stabilise debt, so that higher levels of spending can be sustained.
But further deterioration of the economy could lead South Africa into a low-growth trap. In this scenario, weak GDP growth produces less tax revenue. Aggressive fiscal consolidation – in other words, steps to contain the deficit and stabilise debt – may bolster confidence, but can undermine the economy. Taking no action could result in ratings downgrades, capital flight, rapid exchange rate depreciation and a spike in interest rates. Such developments would throw up greater challenges for private and public investment plans, and could result in even lower growth outcomes.
To avoid this trap, government proposes a balanced consolidation. Proposals include a combination of tax policy measures that will raise an additional R43 billion over the next two years, and a reduction in the expenditure ceiling of R26 billion. These steps follow consolidation measures announced in the 2015 and 2016 Budgets. If these necessary trade-offs are accompanied by higher levels of economic growth – which is possible if fresh impetus is given to private investment – it will create more space for flexibility on fiscal targets over the medium term. Conversely, continued uncertainty on major factors that affect the economy will narrow fiscal room to manoeuvre.
Long term: realistic trade-offs required
The Constitution requires government to pursue a progressive expansion of access to public services within its available resources. To realise these aspirations, South Africa needs to accelerate the pace of economic growth. The National Treasury’s modelling indicates that if the trend rate of economic growth remains below 2 per cent for an extended period, government may not be able to sustain its current policy commitments. Choices will need to be made about which programmes can be maintained.
At the same time, proposals have been tabled for a substantial expansion of spending commitments in health, education, defence, social development and infrastructure. There are clear benefits associated with each of these proposals. However, if implemented simultaneously, the costs would be incompatible with fiscal sustainability. The limited space available to increase taxation cannot accommodate all of these aims. Even
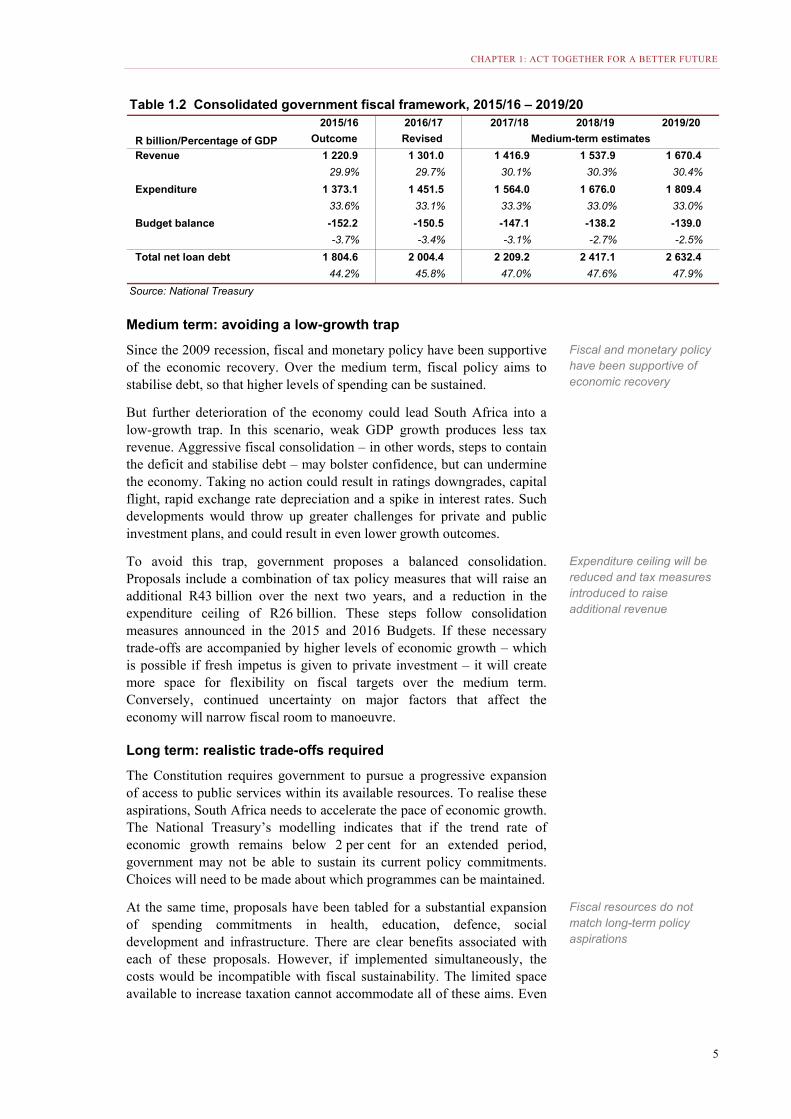
2015/16 2016/17 2017/18 2018/19 2019/20
R billion/Percentage of GDP Outcome Revised Medium-term estimates
Revenue 1 220.9 1 301.0 1 416.9 1 537.9 1 670.4
29.9% 29.7% 30.1% 30.3% 30.4%
Expenditure 1 373.1 1 451.5 1 564.0 1 676.0 1 809.4
33.6% 33.1% 33.3% 33.0% 33.0%
Budget balance -152.2 -150.5 -147.1 -138.2 -139.0
-3.7% -3.4% -3.1% -2.7% -2.5%
Total net loan debt 1 804.6 2 004.4 2 209.2 2 417.1 2 632.4
44.2% 45.8% 47.0% 47.6% 47.9%
Source: National Treasury
Table 1.2 Consolidated government fiscal framework, 2015/16 – 2019/20
Fiscal and monetary policy have been supportive of economic recovery
Expenditure ceiling will be reduced and tax measures introduced to raise additional revenue
Fiscal resources do not match long-term policy aspirations
2016 MEDIUM TERM BUDGET POLICY STATEMENT
6
in the most optimistic growth scenario, a phased approach to implementation based on a clear choice of priorities is required.
Difficult trade-offs are needed to resume the expansion of public resources available for social and economic development. For now, however, long-term policy aspirations far exceed available resources.
Funding post-school education and training
The movement of university students demanding “fees must fall” has placed the issue of education funding at the centre of the policy debate. It has also generated welcome suggestions on how to fund tertiary education.
Two concerns lie at the heart of the issue. First, despite massive increases in allocations to the National Student Financial Aid Scheme (NSFAS), the enrolment of academically deserving students from poor communities has grown faster than available funding. Second, there is no clear national framework for financing students who – although not affluent – are above the modest threshold established by the NSFAS means test. As a result, many students face financial hardships that undermine their ability to succeed academically.
Government has significantly expanded funding of education over the past 20 years. Basic education is the largest item in the national budget. But the education system is not achieving the desired outcomes. Priorities for government in the years ahead include expanding access to and the quality of early childhood development, overcoming institutional weaknesses in basic education, broadening access to effective vocational and technical skills, and improving the impact of resources devoted to vocational training. In all these areas, additional resources may be needed – and strong interventions to unblock institutional constraints are required.
Government’s current policy framework calls for the progressive expansion of post-school education within available resources. The largest gains in student access are envisaged in technical and vocational colleges.
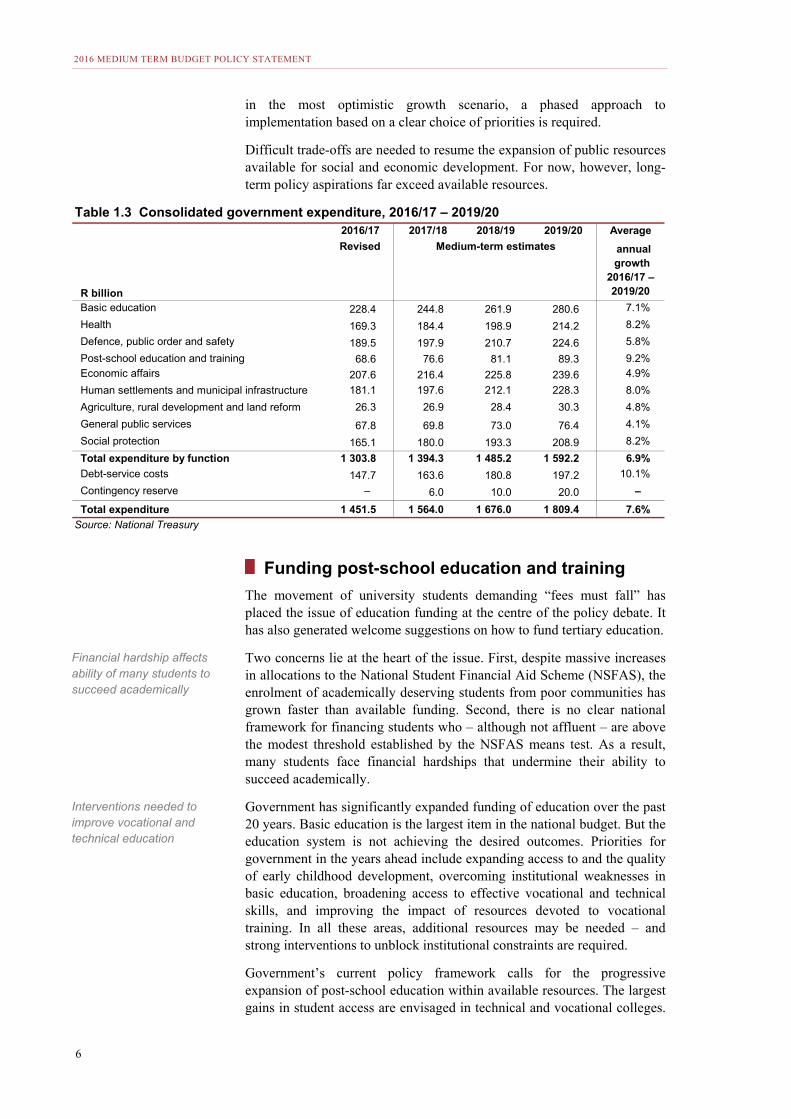
2016/17 2017/18 2018/19 2019/20 Average
R billion
Revised Medium-term estimates annual growth
2016/17 –2019/20
Basic education 228.4 244.8 261.9 280.6 7.1%
Health 169.3 184.4 198.9 214.2 8.2%
Defence, public order and safety 189.5 197.9 210.7 224.6 5.8%
Post-school education and training 68.6 76.6 81.1 89.3 9.2%Economic affairs 207.6 216.4 225.8 239.6 4.9%
Human settlements and municipal infrastructure 181.1 197.6 212.1 228.3 8.0%
Agriculture, rural development and land reform 26.3 26.9 28.4 30.3 4.8%
General public services 67.8 69.8 73.0 76.4 4.1%
Social protection 165.1 180.0 193.3 208.9 8.2%
Total expenditure by function 1 303.8 1 394.3 1 485.2 1 592.2 6.9%
Debt-service costs 147.7 163.6 180.8 197.2 10.1%
Contingency reserve – 6.0 10.0 20.0 –
Total expenditure 1 451.5 1 564.0 1 676.0 1 809.4 7.6%
Source: National Treasury
Table 1.3 Consolidated government expenditure, 2016/17 – 2019/20
Financial hardship affects ability of many students to succeed academically
Interventions needed to improve vocational and technical education
CHAPTER 1: ACT TOGETHER FOR A BETTER FUTURE
7
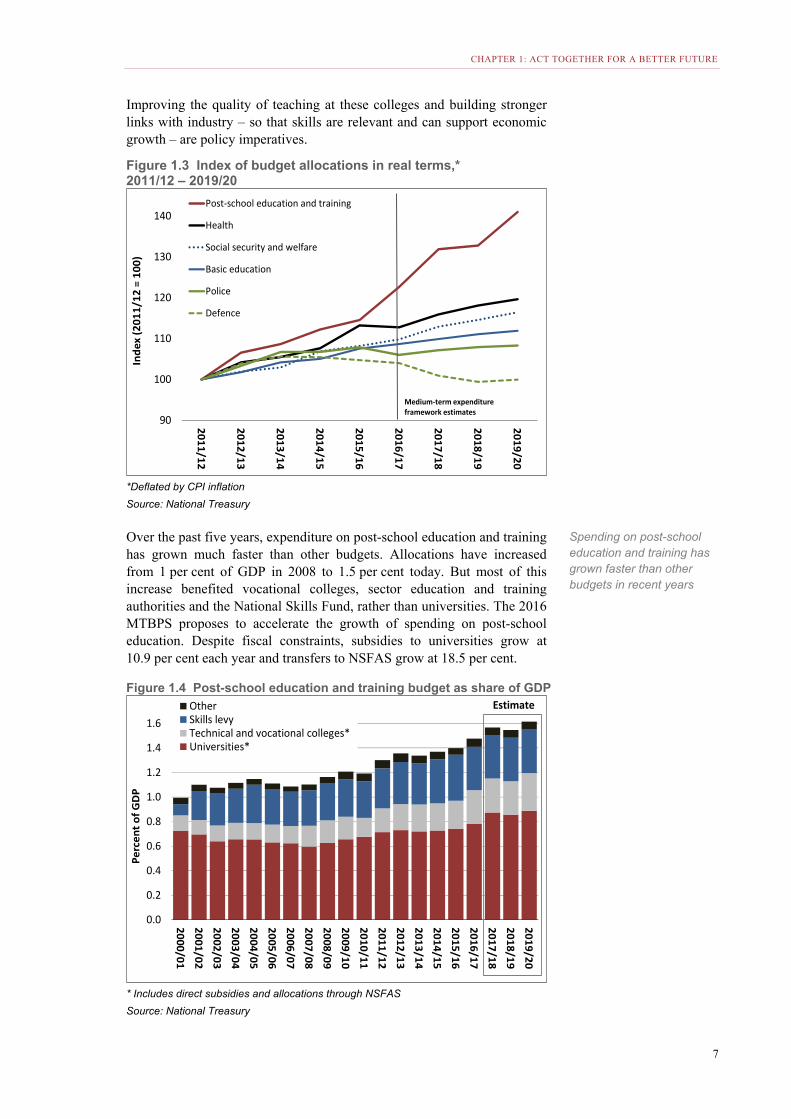
Improving the quality of teaching at these colleges and building stronger links with industry – so that skills are relevant and can support economic growth – are policy imperatives.
Figure 1.3 Index of budget allocations in real terms,* 2011/12 – 2019/20
*Deflated by CPI inflation
Source: National Treasury
Over the past five years, expenditure on post-school education and training has grown much faster than other budgets. Allocations have increased from 1 per cent of GDP in 2008 to 1.5 per cent today. But most of this increase benefited vocational colleges, sector education and training authorities and the National Skills Fund, rather than universities. The 2016 MTBPS proposes to accelerate the growth of spending on post-school education. Despite fiscal constraints, subsidies to universities grow at 10.9 per cent each year and transfers to NSFAS grow at 18.5 per cent.
Figure 1.4 Post-school education and training budget as share of GDP
* Includes direct subsidies and allocations through NSFAS
Source: National Treasury
90
100
110
120
130
140
2011/12
2012/13
2013/14
2014/15
2015/16
2016/17
2017/18
2018/19
2019/20
Inde
x (2
011/
12 =
100
)
Post-school education and training
Health
Social security and welfare
Basic education
Police
Defence
Medium-term expenditure framework estimates
0.0
0.2
0.4
0.6
0.8
1.0
1.2
1.4
1.6
2000/012001/022002/032003/042004/052005/062006/072007/082008/092009/102010/112011/122012/132013/142014/152015/162016/172017/182018/192019/20
Perc
ent o
f GD
P
OtherSkills levyTechnical and vocational colleges*Universities*
Estimate
Spending on post-school education and training has grown faster than other budgets in recent years
2016 MEDIUM TERM BUDGET POLICY STATEMENT
8
Building on the successful expansion of access to higher education, government acknowledges the need to correct its course and increase the number of graduates, while improving teaching and research. A roadmap is needed to fully finance the costs of study for students from poor and working-class families. The plan needs to consider the impact of different education interventions to maximise social and economic transformation.
University education benefits society. It also improves graduates’ income and employment prospects. Those who go on to become affluent citizens have a responsibility to contribute a share of these gains to the next generation. In higher education, as in all areas of public policy, decisions and trade-offs are required to ensure balanced, sustainable development that meets the vast needs of the population using available resources.
Institutions and inclusive transformation
South Africa’s ability to sustain social and economic progress is supported by the sound institutional framework established by the Constitution and a vibrant civil society. The Auditor-General, the Reserve Bank, the Independent Electoral Commission, the Public Protector and the courts are among the many institutions that are effective and independent. Policy-making is rooted in the Constitution, which sets out the basic values and principles of public administration, including:
• A high standard of professional ethics
• Efficient, economic and effective use of resources
• An orientation toward development
• The impartial, fair, equitable and bias-free provision of services
• Transparency.
The Constitution assigns the National Treasury with the responsibility to ensure transparency and expenditure control in each sphere of government, and to enforce compliance with these objectives. It also states that public procurement must be fair, equitable, transparent and cost-effective. While corruption has always existed in the public and private sectors, there are perceptions that state corruption and rent seeking have grown in recent years. Such practices, if not combated with vigour, threaten to corrode trust in institutions and set back national development. Government is committed to promoting inclusive economic transformation through fair, transparent processes. The benefits of empowerment should be accessible on an equal basis, not limited to connected insiders.
Forthcoming procurement regulations will support this objective, while balancing transformational imperatives with the need for efficient, rapid delivery. Over the past year, the Office of the Chief Procurement Officer has strengthened reforms aimed at ensuring greater value for money and combating corruption across the public sector. During 2017, new national procurement legislation will be tabled in Parliament.
Conclusion
With decisive action, South Africa will emerge from a period of economic weakness. This will enable government to provide greater support to the economy and boost employment.
Clear roadmap needed to finance study costs of poor and working-class students
Basic values and principles of public administration include transparency, efficiency and impartiality
Public perception is that state corruption and rent seeking have grown
9
2 Economic outlook
In brief • The economic growth estimate for 2016 has been revised down to 0.5 per cent from 0.9 per cent.
• The National Treasury forecasts a moderate recovery over the next three years, with GDP growth reaching 2.2 per cent in 2019 as supply-side constraints become less binding, the global economy recovers, and business and consumer confidence rebound.
• The inflation forecast has been revised down to 6.4 per cent for 2016. Inflation is expected to remain close to 6 per cent annually over the medium term, with upward pressure from electricity prices.
• Household consumption expenditure growth is projected to reach 2.3 per cent in 2019.
• Investment by general government is expected to average 4.8 per cent growth over the medium term, with investment by public corporations reaching 2.3 per cent growth in 2019.
• Government has budgeted R987.4 billion for infrastructure over the next three years, with large investments continuing in energy, transport and telecommunications.
• Fiscal and monetary policy support a sustainable recovery in economic activity. Rapid progress on National Development Plan reforms can bolster confidence and promote investment.
Economic growth and transformation
o achieve the goal of economic transformation and build an equitable society, South Africa requires higher growth. Without decisive action, a protracted period of low growth will set back the
country’s ability to realise the constitutional vision to “improve the quality of life of all citizens and free the potential of each person”. The National Development Plan (NDP) recognises that faster, broad-based growth is needed to transform the economy, create jobs, and reduce poverty and inequality.
While global economic weakness plays a large role in South Africa’s economic growth performance, domestic constraints stand in the way of investment, output and trade. The slow pace of finalising policy interventions in areas such as land reform, immigration, labour relations, mining and communications undermines confidence, which is a key determinant of economic activity. Government must demonstrate more rapid implementation to restore confidence and give hope to citizens.
T Low growth threatens to block South Africa’s economic transformation
2016 MEDIUM TERM BUDGET POLICY STATEMENT
10
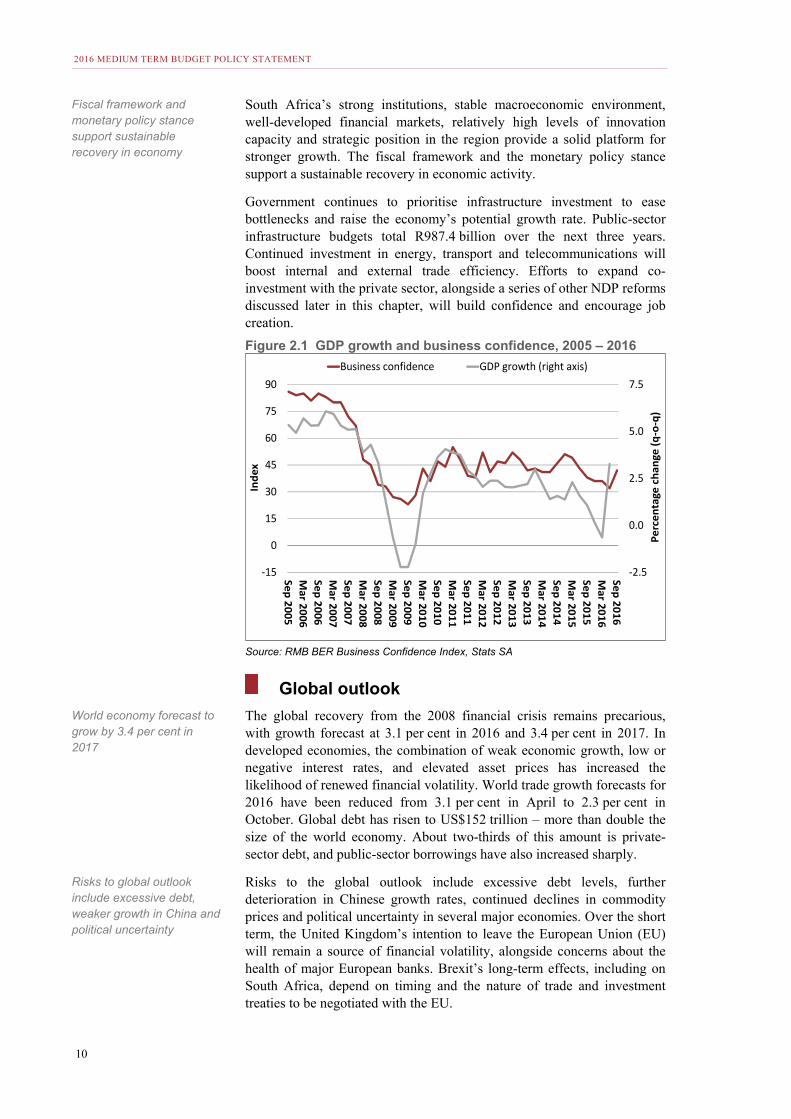
South Africa’s strong institutions, stable macroeconomic environment, well-developed financial markets, relatively high levels of innovation capacity and strategic position in the region provide a solid platform for stronger growth. The fiscal framework and the monetary policy stance support a sustainable recovery in economic activity.
Government continues to prioritise infrastructure investment to ease bottlenecks and raise the economy’s potential growth rate. Public-sector infrastructure budgets total R987.4 billion over the next three years. Continued investment in energy, transport and telecommunications will boost internal and external trade efficiency. Efforts to expand co-investment with the private sector, alongside a series of other NDP reforms discussed later in this chapter, will build confidence and encourage job creation.
Figure 2.1 GDP growth and business confidence, 2005 – 2016
Source: RMB BER Business Confidence Index, Stats SA
Global outlook
The global recovery from the 2008 financial crisis remains precarious, with growth forecast at 3.1 per cent in 2016 and 3.4 per cent in 2017. In developed economies, the combination of weak economic growth, low or negative interest rates, and elevated asset prices has increased the likelihood of renewed financial volatility. World trade growth forecasts for 2016 have been reduced from 3.1 per cent in April to 2.3 per cent in October. Global debt has risen to US$152 trillion – more than double the size of the world economy. About two-thirds of this amount is private-sector debt, and public-sector borrowings have also increased sharply.
Risks to the global outlook include excessive debt levels, further deterioration in Chinese growth rates, continued declines in commodity prices and political uncertainty in several major economies. Over the short term, the United Kingdom’s intention to leave the European Union (EU) will remain a source of financial volatility, alongside concerns about the health of major European banks. Brexit’s long-term effects, including on South Africa, depend on timing and the nature of trade and investment treaties to be negotiated with the EU.
-2.5
0.0
2.5
5.0
7.5
-15
0
15
30
45
60
75
90
Sep 2005M
ar 2006Sep 2006M
ar 2007Sep 2007M
ar 2008Sep 2008M
ar 2009Sep 2009M
ar 2010Sep 2010M
ar 2011Sep 2011M
ar 2012Sep 2012M
ar 2013Sep 2013M
ar 2014Sep 2014M
ar 2015Sep 2015M
ar 2016Sep 2016
Perc
enta
ge c
hang
e (q
-o-q
)
Inde
x
Business confidence GDP growth (right axis)
Fiscal framework and monetary policy stance support sustainable recovery in economy
World economy forecast to grow by 3.4 per cent in 2017
Risks to global outlook include excessive debt, weaker growth in China and political uncertainty
CHAPTER 2: ECONOMIC OUTLOOK
11
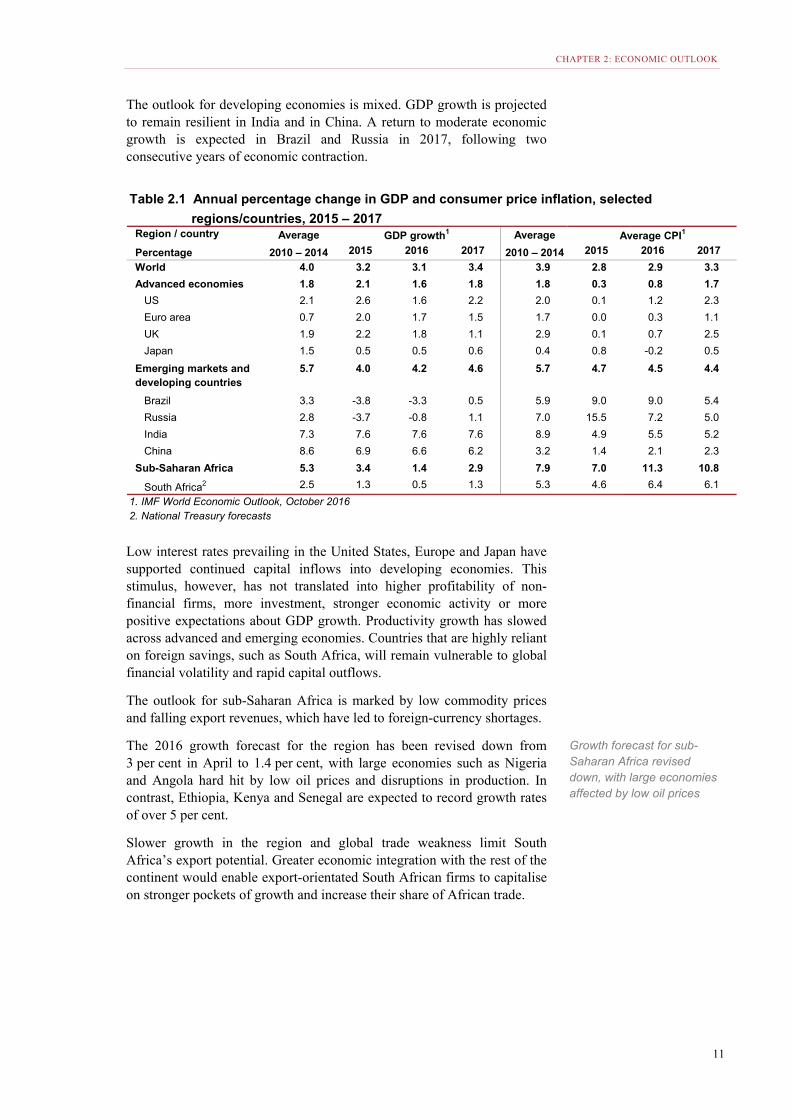
The outlook for developing economies is mixed. GDP growth is projected to remain resilient in India and in China. A return to moderate economic growth is expected in Brazil and Russia in 2017, following two consecutive years of economic contraction.
Low interest rates prevailing in the United States, Europe and Japan have supported continued capital inflows into developing economies. This stimulus, however, has not translated into higher profitability of non-financial firms, more investment, stronger economic activity or more positive expectations about GDP growth. Productivity growth has slowed across advanced and emerging economies. Countries that are highly reliant on foreign savings, such as South Africa, will remain vulnerable to global financial volatility and rapid capital outflows.
The outlook for sub-Saharan Africa is marked by low commodity prices and falling export revenues, which have led to foreign-currency shortages.
The 2016 growth forecast for the region has been revised down from 3 per cent in April to 1.4 per cent, with large economies such as Nigeria and Angola hard hit by low oil prices and disruptions in production. In contrast, Ethiopia, Kenya and Senegal are expected to record growth rates of over 5 per cent.
Slower growth in the region and global trade weakness limit South Africa’s export potential. Greater economic integration with the rest of the continent would enable export-orientated South African firms to capitalise on stronger pockets of growth and increase their share of African trade.
Table 2.1 Annual percentage change in GDP and consumer price inflation, selected
regions/countries, 2015 – 2017Region / country Average Average
Percentage 2010 – 2014 2015 2016 2017 2010 – 2014 2015 2016 2017
World 4.0 3.2 3.1 3.4 3.9 2.8 2.9 3.3
Advanced economies 1.8 2.1 1.6 1.8 1.8 0.3 0.8 1.7
US 2.1 2.6 1.6 2.2 2.0 0.1 1.2 2.3
Euro area 0.7 2.0 1.7 1.5 1.7 0.0 0.3 1.1
UK 1.9 2.2 1.8 1.1 2.9 0.1 0.7 2.5
Japan 1.5 0.5 0.5 0.6 0.4 0.8 -0.2 0.5
Emerging markets and developing countries
5.7 4.0 4.2 4.6 5.7 4.7 4.5 4.4
Brazil 3.3 -3.8 -3.3 0.5 5.9 9.0 9.0 5.4
Russia 2.8 -3.7 -0.8 1.1 7.0 15.5 7.2 5.0
India 7.3 7.6 7.6 7.6 8.9 4.9 5.5 5.2
China 8.6 6.9 6.6 6.2 3.2 1.4 2.1 2.3
Sub-Saharan Africa 5.3 3.4 1.4 2.9 7.9 7.0 11.3 10.8
South Africa2 2.5 1.3 0.5 1.3 5.3 4.6 6.4 6.1
1. IMF World Economic Outlook, October 20162. National Treasury forecasts
Average CPI1GDP growth1
Growth forecast for sub-Saharan Africa revised down, with large economies affected by low oil prices
2016 MEDIUM TERM BUDGET POLICY STATEMENT
12
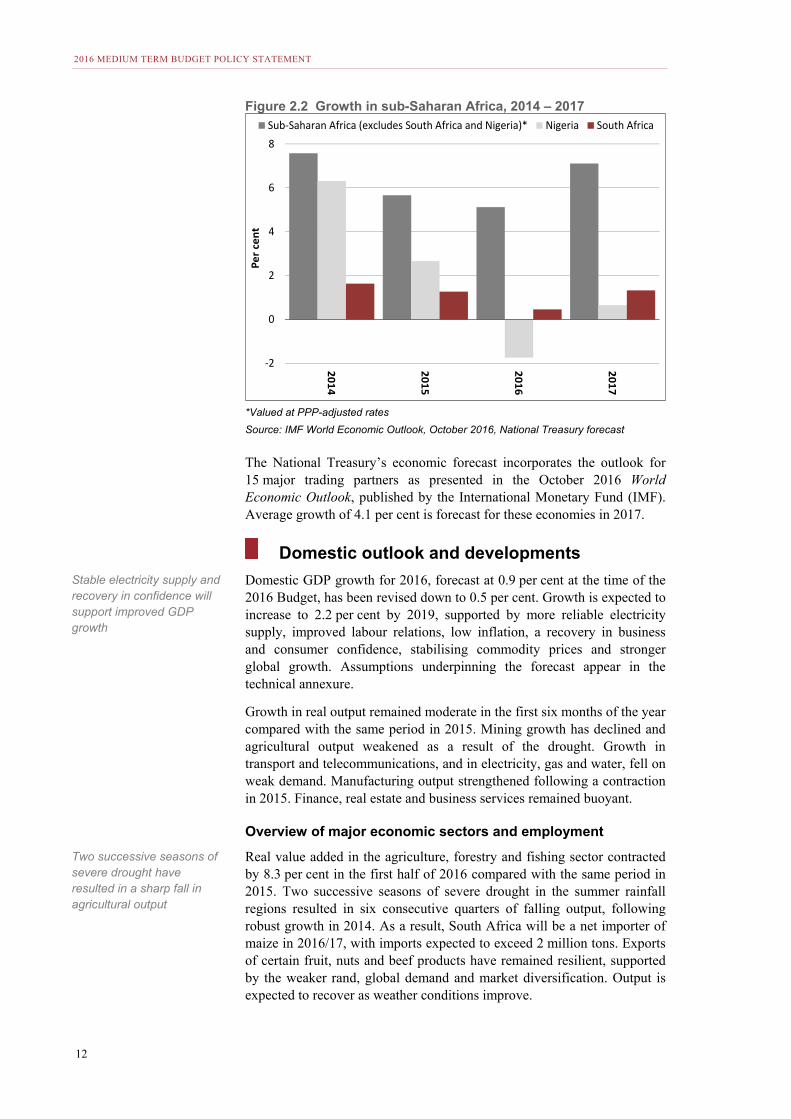
Figure 2.2 Growth in sub-Saharan Africa, 2014 – 2017
*Valued at PPP-adjusted rates
Source: IMF World Economic Outlook, October 2016, National Treasury forecast
The National Treasury’s economic forecast incorporates the outlook for 15 major trading partners as presented in the October 2016 World Economic Outlook, published by the International Monetary Fund (IMF). Average growth of 4.1 per cent is forecast for these economies in 2017.
Domestic outlook and developments
Domestic GDP growth for 2016, forecast at 0.9 per cent at the time of the 2016 Budget, has been revised down to 0.5 per cent. Growth is expected to increase to 2.2 per cent by 2019, supported by more reliable electricity supply, improved labour relations, low inflation, a recovery in business and consumer confidence, stabilising commodity prices and stronger global growth. Assumptions underpinning the forecast appear in the technical annexure.
Growth in real output remained moderate in the first six months of the year compared with the same period in 2015. Mining growth has declined and agricultural output weakened as a result of the drought. Growth in transport and telecommunications, and in electricity, gas and water, fell on weak demand. Manufacturing output strengthened following a contraction in 2015. Finance, real estate and business services remained buoyant.
Overview of major economic sectors and employment
Real value added in the agriculture, forestry and fishing sector contracted by 8.3 per cent in the first half of 2016 compared with the same period in 2015. Two successive seasons of severe drought in the summer rainfall regions resulted in six consecutive quarters of falling output, following robust growth in 2014. As a result, South Africa will be a net importer of maize in 2016/17, with imports expected to exceed 2 million tons. Exports of certain fruit, nuts and beef products have remained resilient, supported by the weaker rand, global demand and market diversification. Output is expected to recover as weather conditions improve.
-2
0
2
4
6
8
2014
2015
2016
2017
Per c
ent
Sub-Saharan Africa (excludes South Africa and Nigeria)* Nigeria South Africa
Stable electricity supply and recovery in confidence will support improved GDP growth
Two successive seasons of severe drought have resulted in a sharp fall in agricultural output
CHAPTER 2: ECONOMIC OUTLOOK
13
Mining production was down 8.3 per cent in the first half of 2016 compared with the same period in 2015. High operating costs, safety stoppages, low commodity prices and weak global demand made for a difficult operating environment. Over the medium term, improved demand and increased electricity supply should boost production. In addition, a moderate rise in commodity prices that began in 2016 is expected to continue.
Manufacturing has contributed 0.2 per cent to gross value added in the first half of 2016, with performance varying across subsectors. Petrochemicals, wood and paper, and food and beverages posted growth rates of 6.5, 5.3 and 0.9 per cent, respectively. In contrast, metals products and motor vehicles contracted by 3.6 per cent and 0.5 per cent respectively. Overall capacity utilisation improved in the first half of 2016.
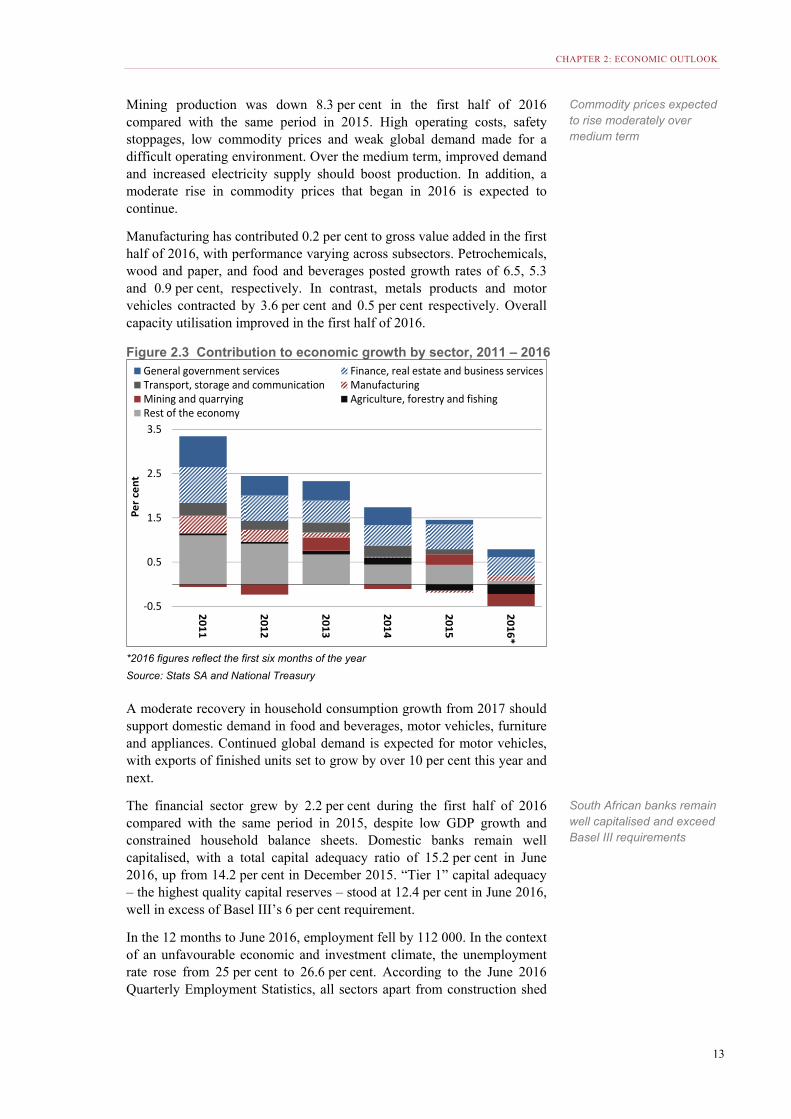
Figure 2.3 Contribution to economic growth by sector, 2011 – 2016
*2016 figures reflect the first six months of the year
Source: Stats SA and National Treasury
A moderate recovery in household consumption growth from 2017 should support domestic demand in food and beverages, motor vehicles, furniture and appliances. Continued global demand is expected for motor vehicles, with exports of finished units set to grow by over 10 per cent this year and next.
The financial sector grew by 2.2 per cent during the first half of 2016 compared with the same period in 2015, despite low GDP growth and constrained household balance sheets. Domestic banks remain well capitalised, with a total capital adequacy ratio of 15.2 per cent in June 2016, up from 14.2 per cent in December 2015. “Tier 1” capital adequacy – the highest quality capital reserves – stood at 12.4 per cent in June 2016, well in excess of Basel III’s 6 per cent requirement.
In the 12 months to June 2016, employment fell by 112 000. In the context of an unfavourable economic and investment climate, the unemployment rate rose from 25 per cent to 26.6 per cent. According to the June 2016 Quarterly Employment Statistics, all sectors apart from construction shed
-0.5
0.5
1.5
2.5
3.5
2011
2012
2013
2014
2015
2016*
Per c
ent
General government services Finance, real estate and business servicesTransport, storage and communication ManufacturingMining and quarrying Agriculture, forestry and fishingRest of the economy
Commodity prices expected to rise moderately over medium term
South African banks remain well capitalised and exceed Basel III requirements
2016 MEDIUM TERM BUDGET POLICY STATEMENT
14
jobs in the second quarter of 2016. A return to employment growth requires higher economic growth and renewed private-sector investment.
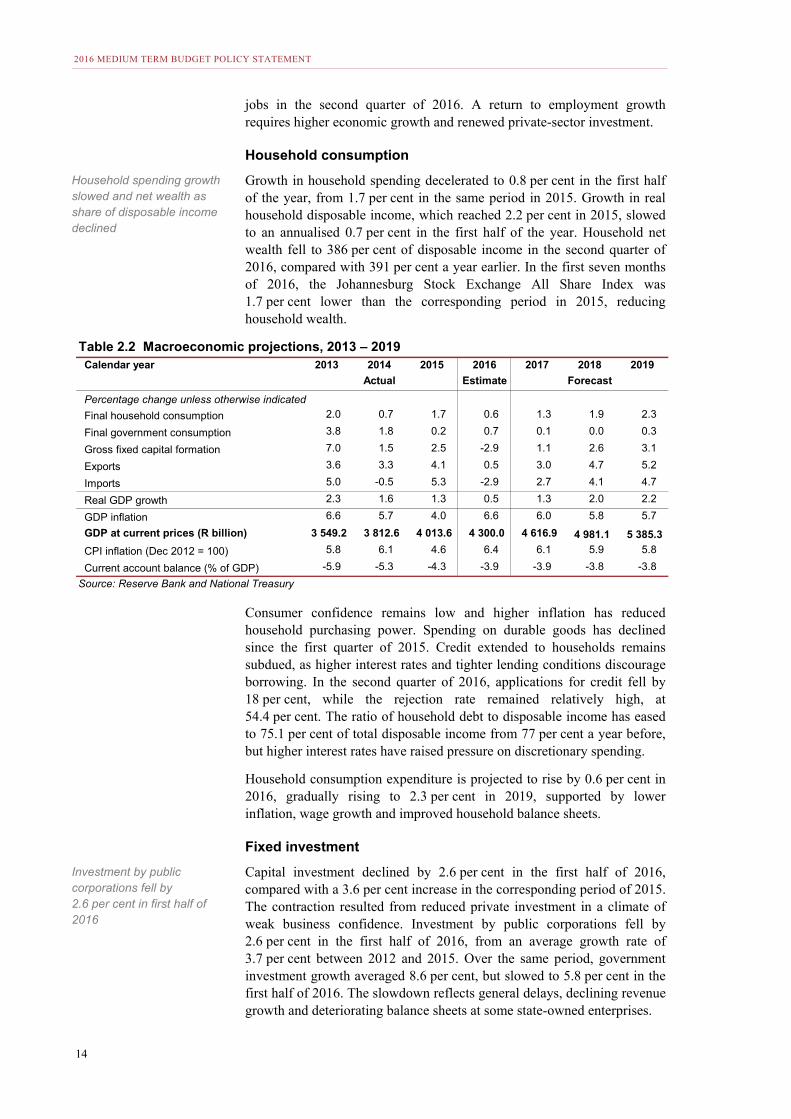
Household consumption
Growth in household spending decelerated to 0.8 per cent in the first half of the year, from 1.7 per cent in the same period in 2015. Growth in real household disposable income, which reached 2.2 per cent in 2015, slowed to an annualised 0.7 per cent in the first half of the year. Household net wealth fell to 386 per cent of disposable income in the second quarter of 2016, compared with 391 per cent a year earlier. In the first seven months of 2016, the Johannesburg Stock Exchange All Share Index was 1.7 per cent lower than the corresponding period in 2015, reducing household wealth.
Consumer confidence remains low and higher inflation has reduced household purchasing power. Spending on durable goods has declined since the first quarter of 2015. Credit extended to households remains subdued, as higher interest rates and tighter lending conditions discourage borrowing. In the second quarter of 2016, applications for credit fell by 18 per cent, while the rejection rate remained relatively high, at 54.4 per cent. The ratio of household debt to disposable income has eased to 75.1 per cent of total disposable income from 77 per cent a year before, but higher interest rates have raised pressure on discretionary spending.
Household consumption expenditure is projected to rise by 0.6 per cent in 2016, gradually rising to 2.3 per cent in 2019, supported by lower inflation, wage growth and improved household balance sheets.
Fixed investment
Capital investment declined by 2.6 per cent in the first half of 2016, compared with a 3.6 per cent increase in the corresponding period of 2015. The contraction resulted from reduced private investment in a climate of weak business confidence. Investment by public corporations fell by 2.6 per cent in the first half of 2016, from an average growth rate of 3.7 per cent between 2012 and 2015. Over the same period, government investment growth averaged 8.6 per cent, but slowed to 5.8 per cent in the first half of 2016. The slowdown reflects general delays, declining revenue growth and deteriorating balance sheets at some state-owned enterprises.
Calendar year 2013 2014 2015 2016 2017 2018 2019
Actual Estimate
Percentage change unless otherwise indicated
Final household consumption 2.0 0.7 1.7 0.6 1.3 1.9 2.3
Final government consumption 3.8 1.8 0.2 0.7 0.1 0.0 0.3
Gross fixed capital formation 7.0 1.5 2.5 -2.9 1.1 2.6 3.1
Exports 3.6 3.3 4.1 0.5 3.0 4.7 5.2
Imports 5.0 -0.5 5.3 -2.9 2.7 4.1 4.7
Real GDP growth 2.3 1.6 1.3 0.5 1.3 2.0 2.2
GDP inflation 6.6 5.7 4.0 6.6 6.0 5.8 5.7
GDP at current prices (R billion) 3 549.2 3 812.6 4 013.6 4 300.0 4 616.9 4 981.1 5 385.3
CPI inflation (Dec 2012 = 100) 5.8 6.1 4.6 6.4 6.1 5.9 5.8
Current account balance (% of GDP) -5.9 -5.3 -4.3 -3.9 -3.9 -3.8 -3.8
Source: Reserve Bank and National Treasury
Table 2.2 Macroeconomic projections, 2013 – 2019
Forecast
Household spending growth slowed and net wealth as share of disposable income declined
Investment by public corporations fell by 2.6 per cent in first half of 2016
CHAPTER 2: ECONOMIC OUTLOOK
15
The pattern of reduced investment is widespread. In the first half of 2016, capital formation in manufacturing contracted by 10.3 per cent, while in transport services, investment fell by 6.3 per cent. Investment continued to grow in electricity and social services as a result of capital outlays on renewable energy and public infrastructure.
Energy and infrastructure investment provide a platform for higher growth. To increase output, however, the economy requires investment in other productive assets. Spending on machinery and equipment has declined sharply. If investment is insufficient to replace worn assets, the resulting capital erosion can weaken the economy’s growth potential, with negative consequences for job creation. There has been a consistent decline in manufacturing fixed-capital stock, which fell by 11.3 per cent between 2008 and 2015, signalling an erosion of the manufacturing asset base.
Several indicators – a more competitive exchange rate, increased manufacturing capacity utilisation, strong corporate balance sheets and generally low borrowing costs – point to higher investment over the medium term. Although investment is expected to contract in 2016, it should grow in 2017. Investment by general government is expected to average 4.8 per cent growth over the next three years. Investment by public corporations is expected to reach 2.3 per cent growth in 2019.
South Africa’s competitiveness ranking improves South Africa’s position in the Global Competitiveness Index improved by six spots to 47 out of 138 in the past three years. The country is the second-most competitive in sub-Saharan Africa, after Mauritius (45th). South Africa maintains its regional leadership in financial markets, technological readiness, innovation and business sophistication, supporting competitiveness. South Africa’s rankings for ease of access to loans, enhanced local competition and better use of talent in terms of how pay reflects productivity have improved significantly.
There were notable declines in several institutional categories, including public trust in politicians (down 11 spots to 109), favouritism in decisions of government officials (down 10 to 115) and reliability of police services (down 13 to 115). In addition, South Africa scores poorly in labour-employer relations (138), hiring and firing practices (135) and flexibility in wage determination (135).
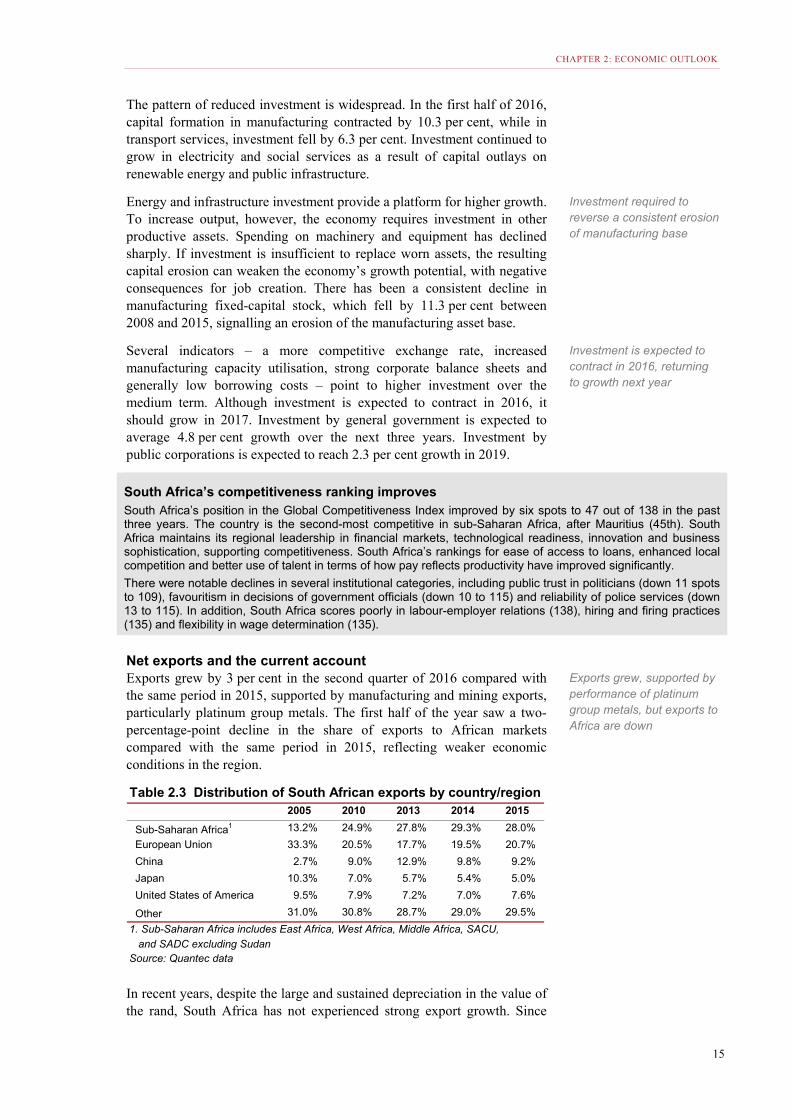
Net exports and the current account Exports grew by 3 per cent in the second quarter of 2016 compared with the same period in 2015, supported by manufacturing and mining exports, particularly platinum group metals. The first half of the year saw a two-percentage-point decline in the share of exports to African markets compared with the same period in 2015, reflecting weaker economic conditions in the region.
In recent years, despite the large and sustained depreciation in the value of the rand, South Africa has not experienced strong export growth. Since
Table 2.3 Distribution of South African exports by country/region2005 2010 2013 2014 2015
Sub-Saharan Africa1 13.2% 24.9% 27.8% 29.3% 28.0%
European Union 33.3% 20.5% 17.7% 19.5% 20.7%
China 2.7% 9.0% 12.9% 9.8% 9.2%
Japan 10.3% 7.0% 5.7% 5.4% 5.0%
United States of America 9.5% 7.9% 7.2% 7.0% 7.6%
Other 31.0% 30.8% 28.7% 29.0% 29.5%
1. Sub-Saharan Africa includes East Africa, West Africa, Middle Africa, SACU,
and SADC excluding SudanSource: Quantec data
Investment required to reverse a consistent erosion of manufacturing base
Investment is expected to contract in 2016, returning to growth next year
Exports grew, supported by performance of platinum group metals, but exports to Africa are down
2016 MEDIUM TERM BUDGET POLICY STATEMENT
16
2010, the real effective exchange rate has depreciated by 20.9 per cent. Yet the main factor in export growth is global demand, which has been moderate. A one-percentage-point increase in global demand could add as much as 0.3 percentage points to medium-term growth.
Soft domestic demand was reflected in the decreased volume of imports, which fell by 3.1 per cent in the first half of the year compared with the same period in 2015. Notable exceptions included vegetable products, oils and fats, where increases of between 43 and 60 per cent reflected the effects of the drought. Over the medium term, improved domestic demand should support import growth, but the weaker currency will limit the expansion of volumes. Imports are expected to contract in the current year and grow by 2.7 per cent in 2017.
The current account deficit narrowed in the second quarter as net exports increased and the trade account recorded a surplus, despite some weakening of the terms of trade. The deficit was funded through an increase in net portfolio investment, mainly into government bonds, and a rise in net foreign direct investment. Over the next three years, the current account deficit is expected to average 3.9 per cent, down from an average of 5.2 per cent between 2013 and 2015. The forecast does not project any major gains in the terms of trade.
Inflation
Consumer price index (CPI) inflation breached the upper limit of the 3 to 6 per cent target band in the first half of 2016, mainly as a result of higher petrol and food prices. Core inflation remained relatively flat and within the target band. In response to higher inflation and rising inflation expectations, the Reserve Bank has raised the rate at which it lends to commercial banks by 0.75 percentage points since January 1.
The inflation forecast has been revised down to 6.4 per cent for 2016 due to lower-than-expected electricity and import-price inflation. A further decline to 6.1 per cent is expected in 2017. Inflation is expected to stay within the target band in 2018 and 2019. Electricity price increases are forecast to average 9.1 per cent per year over the period, with food inflation stabilising at 5.4 per cent in the outer years. Rising unit labour costs, higher import-price inflation and inflation expectations are upside risks to the forecast.
According to a Bureau for Economic Research survey, inflation expectations have consistently hovered around the high end of the target band over the past five years, feeding into wage demands and price increases. The Andrew Levy wage settlement survey for the first half of 2016 shows an average wage increase of 7.7 per cent, marginally lower than 7.8 per cent in the first half of 2015.
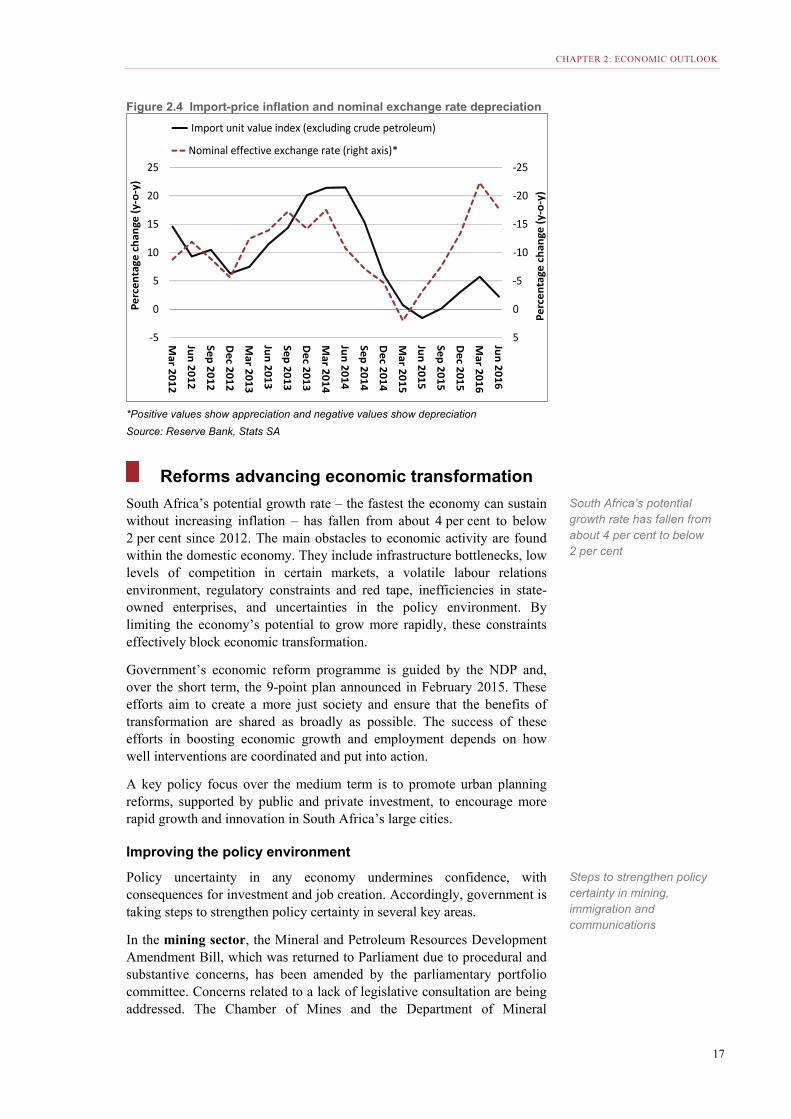
Figure 2.4 shows that import-price inflation has been significantly lower than the nominal effective exchange rate depreciation. Importers have not increased prices as much as the depreciation in the exchange rate, reducing price pressures in South Africa.
Soft domestic demand reflected in decreased import volumes
Narrowing current account deficit expected to average 3.9 per cent over medium term
Higher petrol and food prices pushed inflation out of target band
Inflation expectations hover near high end of target band, affecting wage demands and bond yields
CHAPTER 2: ECONOMIC OUTLOOK
17
Figure 2.4 Import-price inflation and nominal exchange rate depreciation
*Positive values show appreciation and negative values show depreciation
Source: Reserve Bank, Stats SA
Reforms advancing economic transformation
South Africa’s potential growth rate – the fastest the economy can sustain without increasing inflation – has fallen from about 4 per cent to below 2 per cent since 2012. The main obstacles to economic activity are found within the domestic economy. They include infrastructure bottlenecks, low levels of competition in certain markets, a volatile labour relations environment, regulatory constraints and red tape, inefficiencies in state-owned enterprises, and uncertainties in the policy environment. By limiting the economy’s potential to grow more rapidly, these constraints effectively block economic transformation.
Government’s economic reform programme is guided by the NDP and, over the short term, the 9-point plan announced in February 2015. These efforts aim to create a more just society and ensure that the benefits of transformation are shared as broadly as possible. The success of these efforts in boosting economic growth and employment depends on how well interventions are coordinated and put into action.
A key policy focus over the medium term is to promote urban planning reforms, supported by public and private investment, to encourage more rapid growth and innovation in South Africa’s large cities.
Improving the policy environment
Policy uncertainty in any economy undermines confidence, with consequences for investment and job creation. Accordingly, government is taking steps to strengthen policy certainty in several key areas.
In the mining sector, the Mineral and Petroleum Resources Development Amendment Bill, which was returned to Parliament due to procedural and substantive concerns, has been amended by the parliamentary portfolio committee. Concerns related to a lack of legislative consultation are being addressed. The Chamber of Mines and the Department of Mineral
-25
-20
-15
-10
-5
0
5-5
0
5
10
15
20
25
Mar 2012
Jun 2012
Sep 2012
Dec 2012
Mar 2013
Jun 2013
Sep 2013
Dec 2013
Mar 2014
Jun 2014
Sep 2014
Dec 2014
Mar 2015
Jun 2015
Sep 2015
Dec 2015
Mar 2016
Jun 2016
Perc
enta
ge c
hang
e (y
-o-y
)
Perc
enta
ge c
hang
e (y
-o-y
) Import unit value index (excluding crude petroleum)
Nominal effective exchange rate (right axis)*
South Africa’s potential growth rate has fallen from about 4 per cent to below 2 per cent
Steps to strengthen policy certainty in mining, immigration and communications
2016 MEDIUM TERM BUDGET POLICY STATEMENT
18
Resources are negotiating an out-of-court settlement on the “once empowered, always empowered” principle in the Mining Charter. The impact on the mining sector will depend on how and when these issues are resolved, removing uncertainty from the investment equation. Under the auspices of the Presidential Business Working Group, a single application system for all licenses, including environmental authorisations for mining, is under consideration.
Immigration reforms to speed visa processing and boost tourism are under consideration. These include a long-term multiple entry visa that would be available to frequent travellers, business people and academics, and visas on arrival for some categories of travellers. Since January, 10-year multiple-entry business visas have been available to visitors from Brazil, Russia, India and China. Accelerating immigration reform would reduce the cost of doing business.
The August 2016 Cabinet lekgotla resolved to improve coordination of broadband spectrum allocation policy and rationalise state-owned companies in this area. The information and communications technology white paper is out for public comment. Combined public and private investment to upgrade telecommunications infrastructure is expected to total R26 billion in 2016. Rapid resolution of the dispute between the Independent Communications Authority of South Africa and the Ministry of Telecommunications and Postal Services on the auctioning of high-speed broadband spectrum will improve certainty in the sector.
Socioeconomic impact assessment reports have begun to reduce legislative and regulatory duplication, and improve policy design. Earlier this year, for example, the departments of Agriculture, Forestry and Fisheries, and Environmental Affairs proposed two overlapping bills dealing with marine affairs. The assessment process helped to ensure their combination into the Marine Spatial Planning Bill.
Investing in network infrastructure
Since 2009, the public sector has invested more than R1.6 trillion in infrastructure. This has alleviated pressure on network industries and expanded capacity. In line with the NDP, investment in infrastructure remains a policy priority. Public-sector infrastructure investment plans total R987.4 billion over the medium term, of which R334 billion is in transport and logistics, and R137 billion in water and sanitation. Investment in energy infrastructure totals R243 billion over the period.
Accelerating immigration reform would reduce the cost of doing business
Structural reforms in Mexico and India
Both India and Mexico are implementing structural reforms to promote economic growth and development. The reforms are designed to remove supply bottlenecks, promote higher investment, make it easier to do business and improve access to finance.
Partly as a result of its reforms, Mexico is experiencing rising investment in natural gas, electricity, and telecommunications. Financial reforms have strengthened consumer protection, improved the collection of credit information, and allowed more competition in the banking sector. The IMF estimates that these reforms will support growth of 2.9 per cent over the medium term, up from 2.1 per cent in 2016.
In India, economic growth has risen from 6.6 per cent in 2013 to 7.6 per cent in 2015. The government has targeted reforms in mining, to allow competitive bidding for mining leases; in electricity, to permit debt restructuring among state electricity distribution companies; and in agriculture, amending crop insurance to benefit farmers. Reforms also facilitate more flexible labour and product markets, promote foreign investment and enhance financial inclusion. The IMF projects strong growth in India over the medium term.
CHAPTER 2: ECONOMIC OUTLOOK
19
Lack of adequate electricity supply has imposed severe costs on the economy. Government has worked to stabilise Eskom and increase the participation of independent power producers (IPPs), which was initially focused in renewable technologies. The IPP programme, which involves large investments by the private sector, will continue, and will expand to include private investment in coal and gas.
Further expansion of electricity generation capacity will be guided by the Integrated Resource Plan and the Integrated Energy Plan, which should be alert to the risk of over-investment. Idle electricity capacity will require higher electricity prices, with negative consequences for economic growth. In addition, integrated resource planning should take into account the falling cost of renewables and their possible use in generating baseload electricity, as discussed in the box below.
Eskom has scaled up its maintenance work. Energy availability improved from 70 per cent in October 2015 to 81 per cent in June 2016. The Medupi and Kusile plants are expected to be completed by May 2020 and September 2022 respectively. Three units of Ingula are already in commercial operation, and the fourth will come on line in the first half of 2017.
Over the past three years, Transnet has significantly increased its capacity through investment in new locomotives and rail infrastructure. Capacity has grown by 26.4 million tons in the general freight business, 9 million tons on the export coal line and 7.2 million tons on the export iron ore line. Transnet expects to invest a total of R30 billion in its new multi-product pipeline, which is expected to be completed in 2022/23. The pipeline will boost capacity by 3.5 billion litres per year.
Renewable energy trends and the independent power producer programme According to the 2016 Renewables Global Status Report, investment in renewable generation has exceeded investment in new fossil fuel generation globally since 2014. The United Nations Environment Programme reports that developing countries accounted for 55 per cent of investment in renewable energy in 2015. Declining costs for renewable energy and the movement towards modular build options has made financing more readily available.
South Africa’s independent power producer (IPP) programme has successfully introduced renewable power to the electricity grid. Of the 6 376MW of renewable power procured to date by the Department of Energy, 2 220MW has come on stream. IPPs have attracted R194 billion of investment and created just under 27 000 jobs. Since programme inception, the average price per kilowatt hour has declined by 67.4 per cent. According to the Department of Energy’s IPP office, wind and solar photovoltaic generation is now cost competitive when compared with new-build options such as gas and coal.
The success of the IPP programme can be replicated in other sectors. Between 2019 and 2025, the Gas-to-Power Programme will procure 3 726MW of capacity, stimulating the gas industry and associated infrastructure development. Another 1 000MW will be added to the initial 800MW that was originally projected by industry co-generation. The Coal Baseload IPP Programme aims to procure 2 500MW of electricity from coal-fired power stations. The first bid winners, announced in October, will provide 863.3MW of capacity in the next five years.
Case studies in Australia, Denmark, Portugal and the UK have shown that it is possible for renewables to meet energy demand, including baseload power. Although wind and solar technologies generally provide power intermittently, this can be overcome by connecting geographically dispersed plants to the grid. Flexible technologies such as gas turbines can be used to fill in gaps. The Council for Scientific and Industrial Research has similar findings for South Africa.
IPP programme, which involves large investments by the private sector, will continue
Medupi and Kusile are expected to be fully completed by 2020 and 2022 respectively
2016 MEDIUM TERM BUDGET POLICY STATEMENT
20
South Africa’s large development finance organisations are also investing in infrastructure and economic development. The Development Bank of Southern Africa disbursed a record R17.1 billion during 2015/16, of which R8.1 billion went to municipalities. Over 250 000 households benefited from energy and water and sanitation projects. The Industrial Development Corporation approved loans of R4.9 billion and R2.9 billion for black-empowered companies and black industrialists respectively to support greater participation of black people in the economy.
Encouraging private-sector investment
Expanded investment by the private sector will improve productive capacity and grow the economy. Tackling corruption will discourage rent-seeking, lower transaction costs, reduce uncertainty, and prevent the wastage of both public and private resources. Initiatives that are under way include the following:
• Easing the regulatory burden and making it easier to invest. InvestSA has set up a one-stop shop to help investors with the procedures required to start up and run a business.
• Reducing time spent on compliance and paperwork. As a result of increased automation at the Companies and Intellectual Property Commission, it now takes less than a day to register a firm. Title deeds are now available within seven days at the Deeds Office. And the Department of Justice has streamlined contract enforcement, introducing court mediation to reduce legal costs.
• Strengthening competition law. Sections of the Competition Amendment Act that came into effect earlier this year make it a criminal offence for directors or managers of a firm to collude with their competitors to fix prices or collude in tenders. This should reduce prices and increase market access.
• Enhancing the environment for small business. The Department of Small Business Development is updating legislation to improve support for small businesses. Government has targeted support to small firms, and is encouraging large businesses to contract more work from small companies.
Government’s approach has begun to yield greater private investment in several areas – notably in the successful IPP programme. In addition, automotive assembly firms have pledged investments of R15.4 billion, which would create an estimated 4 675 jobs. In June 2016, the Centre for High Performance Computing launched the first petascale computing system on the African continent. Construction of the 64-dish Meerkat radio telescope array in the Karoo is due to be completed by the end of 2017. And public and private investment totalling R17 billion has been targeted towards “oceans economy” initiatives over the past two years, creating about 5 000 jobs. Investments support shipbuilding and training of marine engineers and artisans.
Complementary efforts support both commercial agriculture and emerging farmers. Efforts to diversify markets, for example, have boosted apple exports to China by 77 per cent. The recently signed Southern African Development Community – EU trade agreement improves access to European markets for sugar, ethanol and wine.
Development finance organisations investing in infrastructure and supporting black empowerment
Government working to promote greater private investment in a range of sectors
Support for commercial agriculture and developing farmers includes market diversification initiatives
CHAPTER 2: ECONOMIC OUTLOOK
21
Despite a significant reduction in borrowing costs over the last 20 years, availability of funding remains an obstacle to business development. Government remains committed to working with the financial sector and development financial institutions to reduce funding constraints to business expansion and job creation.
Improving the ease of doing business in large metros The Cities Support Programme is working with local governments in nine participating cities to develop action plans to improve their performance in the World Bank’s 2018 Doing Business in South Africa survey. The country was ranked 73 out of 189 participating countries for 2016, down four places from the year before. The rankings for 2017 are to be published at the end of October 2016.
The work focuses on three business regulatory indicators – dealing with construction permits, getting electricity and registering property – for which cities have the greatest responsibility. Johannesburg, South Africa’s representative in the global Doing Business survey, is receiving specific targeted support to improve its processes and ranking. City-level reforms complement national reforms being implemented by the Department of Trade and Industry in partnership with the National Treasury.
Reviewing incentive programmes
Government provides a range of direct support to business. For example, the Clothing and Textiles Competitiveness Programme has helped to stabilise the sector. The Manufacturing Competitiveness Enhancement Programme has approved projects worth about R28 billion, supporting an estimated 200 000 jobs. The Automotive Production and Development Programme has contributed to increased exports.
Given increased pressures on the fiscus, these incentives, including direct transfers, tax and tariff rebates and concessional financing are being reviewed. The review is intended to assess performance, determine value for money, and analyse how the system as a whole supports the economy and job creation. The review is expected to be completed by October 2017.
Building a platform for collective action
To promote a faster-growing, more inclusive economy, government has strengthened its active collaboration with business, trade unions and civil society to restore confidence and reduce constraints to growth. The Presidential Business Working Group and the CEO Initiative are generating targeted support for the economy.
Initiatives include a R1.5 billion fund to support small firms with the ability to scale up and create jobs, and a private-sector programme to create 1 million internships over a three-year period, focused on improving the job-readiness of young work seekers. To complement these efforts, government will strengthen its agencies that support small business.
Fostering better labour relations
Government continues talks with business and labour to reduce workplace conflict and protracted strikes. An independent panel has been established to support work on a national minimum wage. Government has proposed to extend the employment tax incentive and the learnership allowance, and will continue to monitor the impact of these incentives.
Government, business, labour and civil society working to restore confidence
Employment tax incentive and learnership allowance to be extended
2016 MEDIUM TERM BUDGET POLICY STATEMENT
22
Conclusion
The National Treasury forecasts a moderate recovery over the next three years, with GDP growth reaching 2.2 per cent in 2019 as supply-side constraints become less binding, the global economy recovers, and business and consumer confidence rebound. Decisive measures to speed implementation of NDP reforms and reduce policy uncertainty can support accelerated and broad-based economic growth.
23
3 Fiscal policy
In brief • The consolidated budget deficit for 2016/17 is projected at 3.4 per cent of GDP, marginally higher than
the 2016 Budget estimate of 3.2 per cent.
• A combination of the declining GDP growth rate and lower tax buoyancy has reduced the in-year tax estimate by R23 billion. The shortfall is offset by drawdowns on the contingency reserve, declared savings and projected underspending. As a result, the shortfall declines to about R11.5 billion, limiting its impact on the budget balance.
• Without policy adjustments, gross tax revenue is projected to fall short of February estimates by R36 billion in 2017/18 and R52 billion in 2018/19.
• The Medium Term Budget Policy Statement proposes R26 billion in reductions to the expenditure ceiling over the next two years. Proposed tax measures amount to R13 billion in 2017/18. Combined with higher taxes signalled in the 2016 Budget, total revenue increases amount to R43 billion over the next two years.
• These adjustments result in net national debt stabilising at 47.9 per cent of GDP in 2019/20.
Creating conditions for faster growth
o create the conditions for more rapid growth, fiscal policy aims to deliver a measured consolidation that avoids a sharp contraction in expenditure, continues to prioritise capital investment and stabilises
national debt as a share of GDP. Government’s efforts to reduce borrowing have been frustrated by consistent downward adjustments to growth and tax revenue. Slowing household consumption and falling private-sector investment reflect profound uncertainty about the global and domestic economic outlook. In the current environment, building confidence and ensuring a sustainable outlook for the public finances require additional fiscal consolidation – in other words, steps to contain the budget deficit and slow the pace of debt accumulation.
The consolidation measures proposed in this MTBPS are likely to have some dampening effect on economic activity. But over the medium term, a further loss of confidence and a ratings downgrade – which could prompt higher interest rates and large capital outflows – remain greater risks to the economy than the likely effects of fiscal consolidation.
Accordingly, government proposes:
T Government proposes additional measures to contain budget deficit and reduce debt accumulation
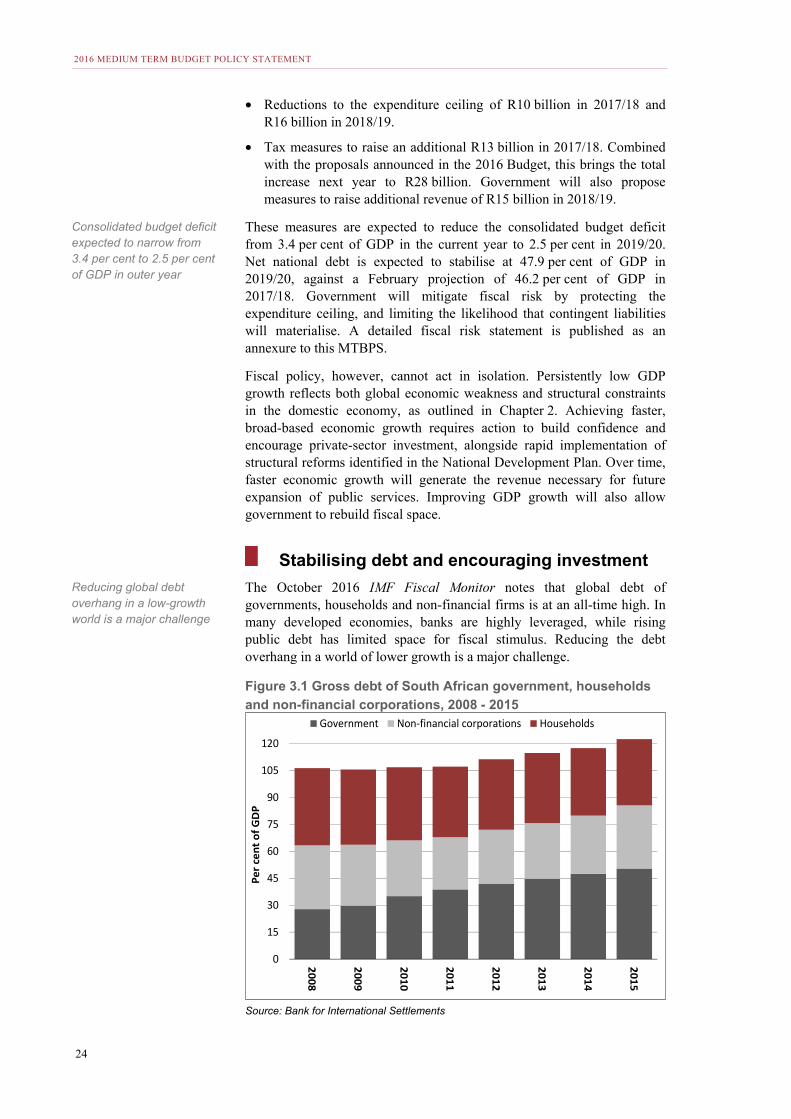
2016 MEDIUM TERM BUDGET POLICY STATEMENT
24
• Reductions to the expenditure ceiling of R10 billion in 2017/18 and R16 billion in 2018/19.
• Tax measures to raise an additional R13 billion in 2017/18. Combined with the proposals announced in the 2016 Budget, this brings the total increase next year to R28 billion. Government will also propose measures to raise additional revenue of R15 billion in 2018/19.
These measures are expected to reduce the consolidated budget deficit from 3.4 per cent of GDP in the current year to 2.5 per cent in 2019/20. Net national debt is expected to stabilise at 47.9 per cent of GDP in 2019/20, against a February projection of 46.2 per cent of GDP in 2017/18. Government will mitigate fiscal risk by protecting the expenditure ceiling, and limiting the likelihood that contingent liabilities will materialise. A detailed fiscal risk statement is published as an annexure to this MTBPS.
Fiscal policy, however, cannot act in isolation. Persistently low GDP growth reflects both global economic weakness and structural constraints in the domestic economy, as outlined in Chapter 2. Achieving faster, broad-based economic growth requires action to build confidence and encourage private-sector investment, alongside rapid implementation of structural reforms identified in the National Development Plan. Over time, faster economic growth will generate the revenue necessary for future expansion of public services. Improving GDP growth will also allow government to rebuild fiscal space.
Stabilising debt and encouraging investment
The October 2016 IMF Fiscal Monitor notes that global debt of governments, households and non-financial firms is at an all-time high. In many developed economies, banks are highly leveraged, while rising public debt has limited space for fiscal stimulus. Reducing the debt overhang in a world of lower growth is a major challenge.
Figure 3.1 Gross debt of South African government, households
and non-financial corporations, 2008 - 2015
Source: Bank for International Settlements
0
15
30
45
60
75
90
105
120
2008
2009
2010
2011
2012
2013
2014
2015
Per c
ent o
f GD
P
Government Non-financial corporations Households
Consolidated budget deficit expected to narrow from 3.4 per cent to 2.5 per cent of GDP in outer year
Reducing global debt overhang in a low-growth world is a major challenge
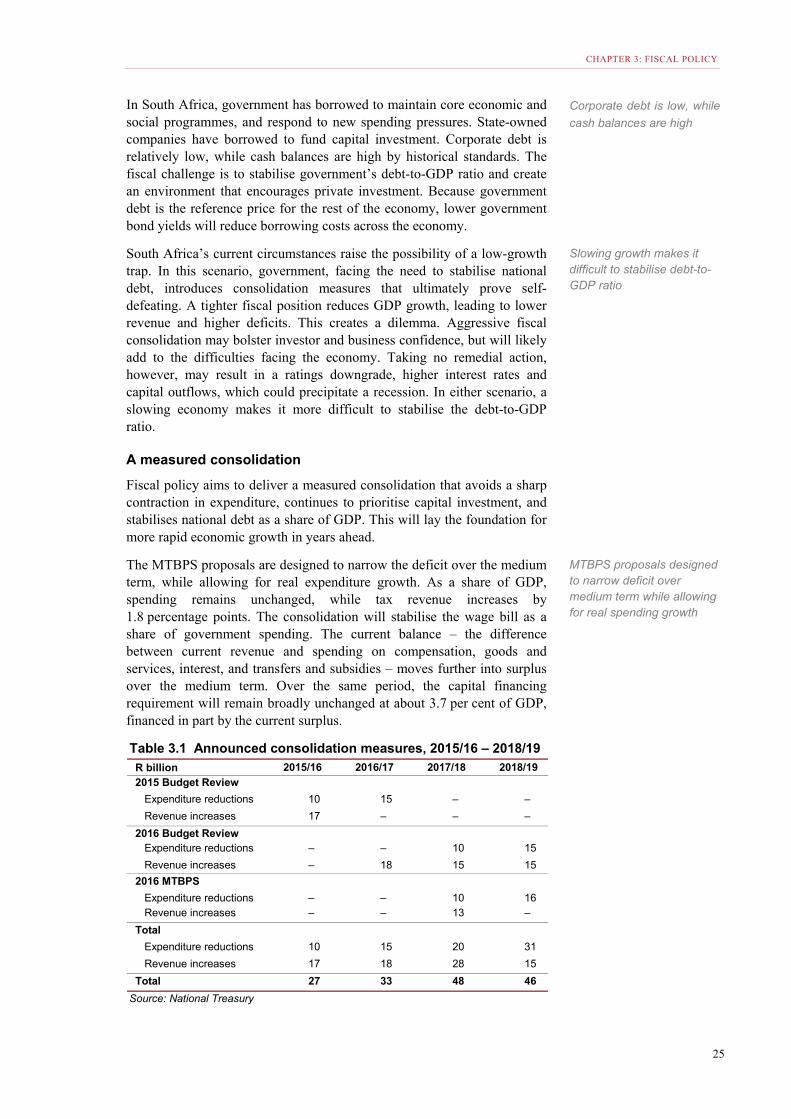
CHAPTER 3: FISCAL POLICY
25
In South Africa, government has borrowed to maintain core economic and social programmes, and respond to new spending pressures. State-owned companies have borrowed to fund capital investment. Corporate debt is relatively low, while cash balances are high by historical standards. The fiscal challenge is to stabilise government’s debt-to-GDP ratio and create an environment that encourages private investment. Because government debt is the reference price for the rest of the economy, lower government bond yields will reduce borrowing costs across the economy.
South Africa’s current circumstances raise the possibility of a low-growth trap. In this scenario, government, facing the need to stabilise national debt, introduces consolidation measures that ultimately prove self-defeating. A tighter fiscal position reduces GDP growth, leading to lower revenue and higher deficits. This creates a dilemma. Aggressive fiscal consolidation may bolster investor and business confidence, but will likely add to the difficulties facing the economy. Taking no remedial action, however, may result in a ratings downgrade, higher interest rates and capital outflows, which could precipitate a recession. In either scenario, a slowing economy makes it more difficult to stabilise the debt-to-GDP ratio.
A measured consolidation
Fiscal policy aims to deliver a measured consolidation that avoids a sharp contraction in expenditure, continues to prioritise capital investment, and stabilises national debt as a share of GDP. This will lay the foundation for more rapid economic growth in years ahead.
The MTBPS proposals are designed to narrow the deficit over the medium term, while allowing for real expenditure growth. As a share of GDP, spending remains unchanged, while tax revenue increases by 1.8 percentage points. The consolidation will stabilise the wage bill as a share of government spending. The current balance – the difference between current revenue and spending on compensation, goods and services, interest, and transfers and subsidies – moves further into surplus over the medium term. Over the same period, the capital financing requirement will remain broadly unchanged at about 3.7 per cent of GDP, financed in part by the current surplus.
Table 3.1 Announced consolidation measures, 2015/16 – 2018/19R billion 2015/16 2016/17 2017/18 2018/19
2015 Budget Review
Expenditure reductions 10 15 – –
Revenue increases 17 – – –
2016 Budget ReviewExpenditure reductions – – 10 15
Revenue increases – 18 15 15
2016 MTBPS
Expenditure reductions – – 10 16 Revenue increases – – 13 –
Total
Expenditure reductions 10 15 20 31
Revenue increases 17 18 28 15
Total 27 33 48 46
Source: National Treasury
Corporate debt is low, while
cash balances are high
Slowing growth makes it difficult to stabilise debt-to-GDP ratio
MTBPS proposals designed to narrow deficit over medium term while allowing for real spending growth
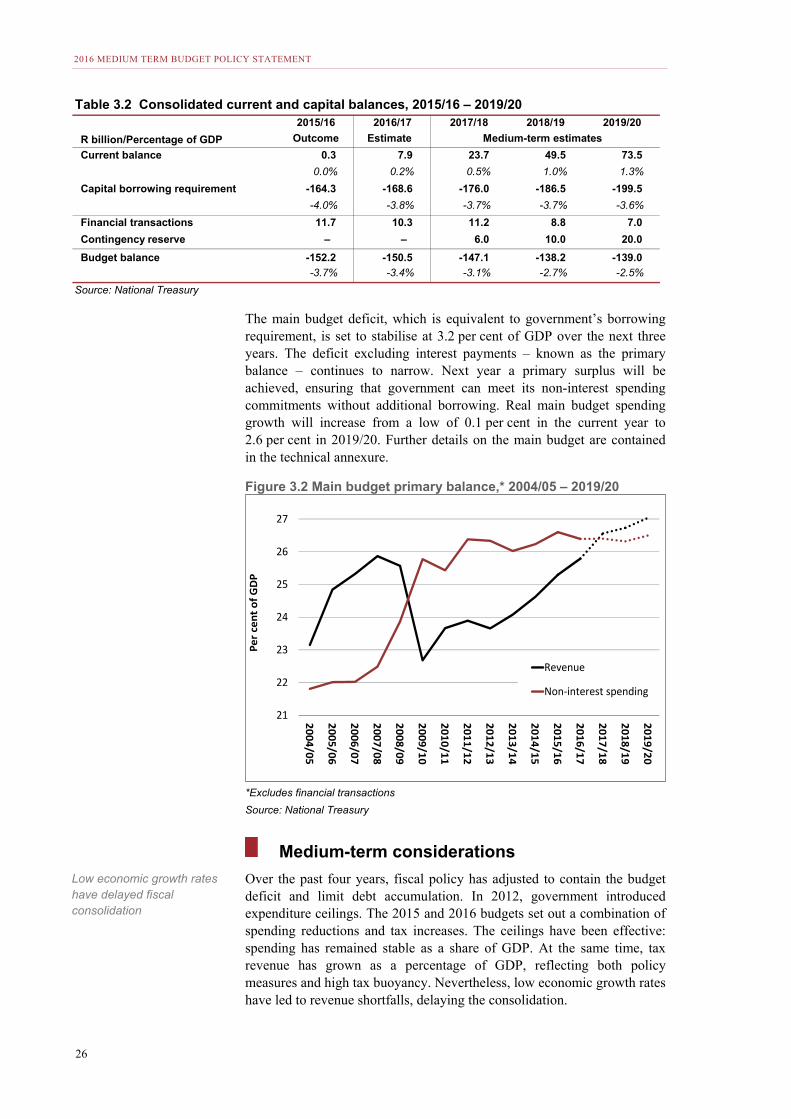
2016 MEDIUM TERM BUDGET POLICY STATEMENT
26
The main budget deficit, which is equivalent to government’s borrowing requirement, is set to stabilise at 3.2 per cent of GDP over the next three years. The deficit excluding interest payments – known as the primary balance – continues to narrow. Next year a primary surplus will be achieved, ensuring that government can meet its non-interest spending commitments without additional borrowing. Real main budget spending growth will increase from a low of 0.1 per cent in the current year to 2.6 per cent in 2019/20. Further details on the main budget are contained in the technical annexure.
Figure 3.2 Main budget primary balance,* 2004/05 – 2019/20
*Excludes financial transactions
Source: National Treasury
Medium-term considerations
Over the past four years, fiscal policy has adjusted to contain the budget deficit and limit debt accumulation. In 2012, government introduced expenditure ceilings. The 2015 and 2016 budgets set out a combination of spending reductions and tax increases. The ceilings have been effective: spending has remained stable as a share of GDP. At the same time, tax revenue has grown as a percentage of GDP, reflecting both policy measures and high tax buoyancy. Nevertheless, low economic growth rates have led to revenue shortfalls, delaying the consolidation.
2015/16 2016/17 2017/18 2018/19 2019/20
R billion/Percentage of GDP Outcome Estimate
Current balance 0.3 7.9 23.7 49.5 73.5
0.0% 0.2% 0.5% 1.0% 1.3%
Capital borrowing requirement -164.3 -168.6 -176.0 -186.5 -199.5
-4.0% -3.8% -3.7% -3.7% -3.6%
Financial transactions 11.7 10.3 11.2 8.8 7.0
Contingency reserve – – 6.0 10.0 20.0
Budget balance -152.2 -150.5 -147.1 -138.2 -139.0
-3.7% -3.4% -3.1% -2.7% -2.5%
Source: National Treasury
Table 3.2 Consolidated current and capital balances, 2015/16 – 2019/20
Medium-term estimates
21
22
23
24
25
26
27
2004/05
2005/06
2006/07
2007/08
2008/09
2009/10
2010/11
2011/12
2012/13
2013/14
2014/15
2015/16
2016/17
2017/18
2018/19
2019/20
Per c
ent o
f GD
P
Revenue
Non-interest spending
Low economic growth rates have delayed fiscal consolidation
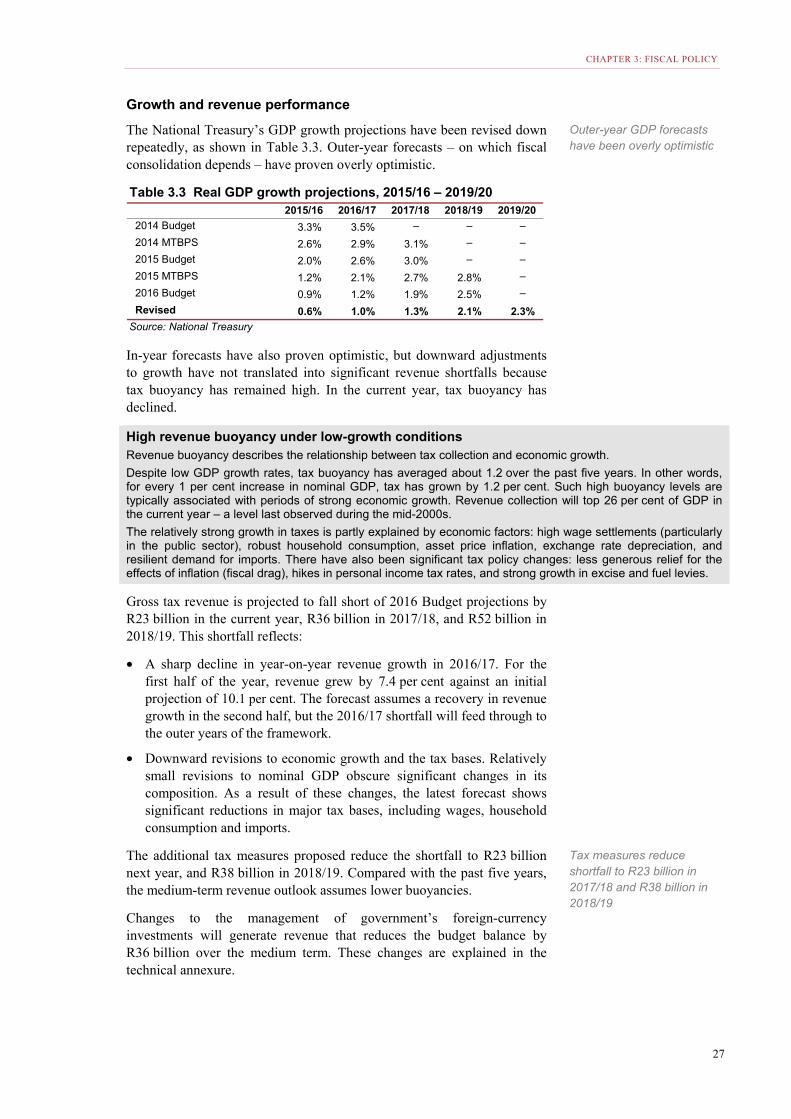
CHAPTER 3: FISCAL POLICY
27
Growth and revenue performance
The National Treasury’s GDP growth projections have been revised down repeatedly, as shown in Table 3.3. Outer-year forecasts – on which fiscal consolidation depends – have proven overly optimistic.
In-year forecasts have also proven optimistic, but downward adjustments to growth have not translated into significant revenue shortfalls because tax buoyancy has remained high. In the current year, tax buoyancy has declined.
High revenue buoyancy under low-growth conditions Revenue buoyancy describes the relationship between tax collection and economic growth.
Despite low GDP growth rates, tax buoyancy has averaged about 1.2 over the past five years. In other words, for every 1 per cent increase in nominal GDP, tax has grown by 1.2 per cent. Such high buoyancy levels are typically associated with periods of strong economic growth. Revenue collection will top 26 per cent of GDP in the current year – a level last observed during the mid-2000s.
The relatively strong growth in taxes is partly explained by economic factors: high wage settlements (particularly in the public sector), robust household consumption, asset price inflation, exchange rate depreciation, and resilient demand for imports. There have also been significant tax policy changes: less generous relief for the effects of inflation (fiscal drag), hikes in personal income tax rates, and strong growth in excise and fuel levies.
Gross tax revenue is projected to fall short of 2016 Budget projections by R23 billion in the current year, R36 billion in 2017/18, and R52 billion in 2018/19. This shortfall reflects:
• A sharp decline in year-on-year revenue growth in 2016/17. For the first half of the year, revenue grew by 7.4 per cent against an initial projection of 10.1 per cent. The forecast assumes a recovery in revenue growth in the second half, but the 2016/17 shortfall will feed through to the outer years of the framework.
• Downward revisions to economic growth and the tax bases. Relatively small revisions to nominal GDP obscure significant changes in its composition. As a result of these changes, the latest forecast shows significant reductions in major tax bases, including wages, household consumption and imports.
The additional tax measures proposed reduce the shortfall to R23 billion next year, and R38 billion in 2018/19. Compared with the past five years, the medium-term revenue outlook assumes lower buoyancies.
Changes to the management of government’s foreign-currency investments will generate revenue that reduces the budget balance by R36 billion over the medium term. These changes are explained in the technical annexure.
2015/16 2016/17 2017/18 2018/19 2019/20
2014 Budget 3.3% 3.5% – – –
2014 MTBPS 2.6% 2.9% 3.1% – –
2015 Budget 2.0% 2.6% 3.0% – –
2015 MTBPS 1.2% 2.1% 2.7% 2.8% –
2016 Budget 0.9% 1.2% 1.9% 2.5% –
Revised 0.6% 1.0% 1.3% 2.1% 2.3%
Source: National Treasury
Table 3.3 Real GDP growth projections, 2015/16 – 2019/20
Outer-year GDP forecasts have been overly optimistic
Tax measures reduce shortfall to R23 billion in 2017/18 and R38 billion in 2018/19
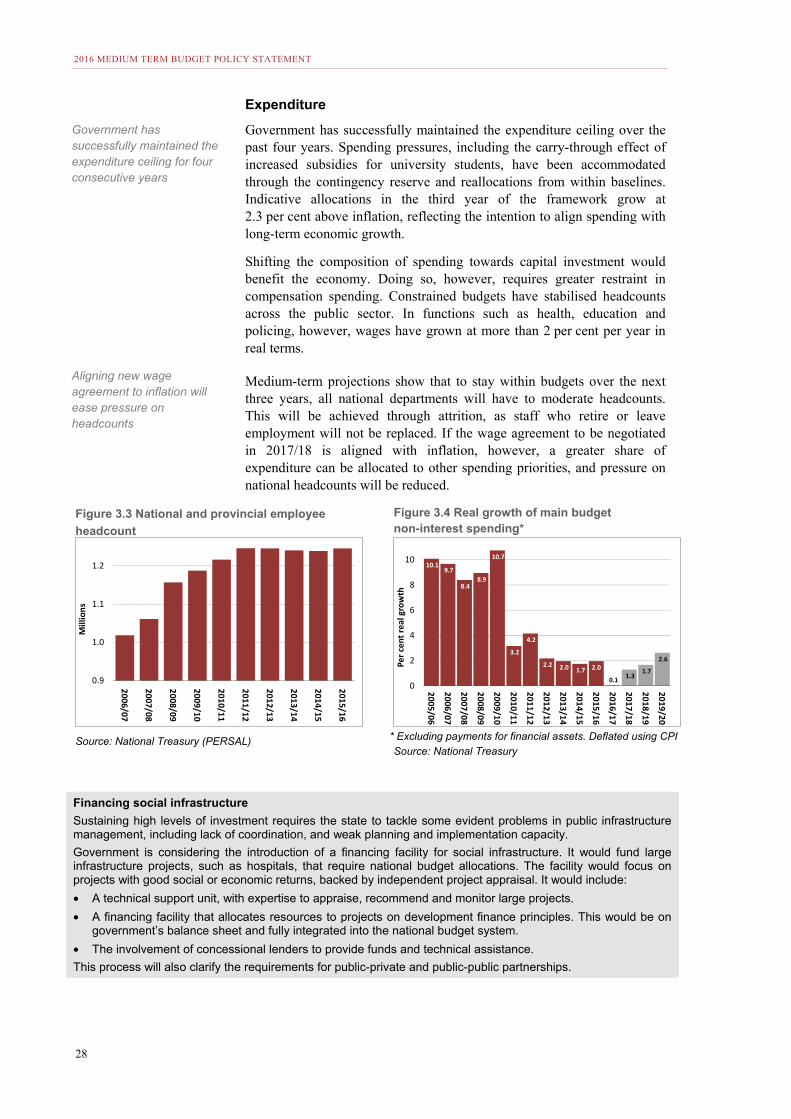
2016 MEDIUM TERM BUDGET POLICY STATEMENT
28
Expenditure
Government has successfully maintained the expenditure ceiling over the past four years. Spending pressures, including the carry-through effect of increased subsidies for university students, have been accommodated through the contingency reserve and reallocations from within baselines. Indicative allocations in the third year of the framework grow at 2.3 per cent above inflation, reflecting the intention to align spending with long-term economic growth.
Shifting the composition of spending towards capital investment would benefit the economy. Doing so, however, requires greater restraint in compensation spending. Constrained budgets have stabilised headcounts across the public sector. In functions such as health, education and policing, however, wages have grown at more than 2 per cent per year in real terms.
Medium-term projections show that to stay within budgets over the next three years, all national departments will have to moderate headcounts. This will be achieved through attrition, as staff who retire or leave employment will not be replaced. If the wage agreement to be negotiated in 2017/18 is aligned with inflation, however, a greater share of expenditure can be allocated to other spending priorities, and pressure on national headcounts will be reduced.
Figure 3.3 National and provincial employee
headcount
Figure 3.4 Real growth of main budget non-interest spending*
Source: National Treasury (PERSAL) * Excluding payments for financial assets. Deflated using CPI
Source: National Treasury
Financing social infrastructure
Sustaining high levels of investment requires the state to tackle some evident problems in public infrastructure management, including lack of coordination, and weak planning and implementation capacity.
Government is considering the introduction of a financing facility for social infrastructure. It would fund large infrastructure projects, such as hospitals, that require national budget allocations. The facility would focus on projects with good social or economic returns, backed by independent project appraisal. It would include:
• A technical support unit, with expertise to appraise, recommend and monitor large projects.
• A financing facility that allocates resources to projects on development finance principles. This would be on government’s balance sheet and fully integrated into the national budget system.
• The involvement of concessional lenders to provide funds and technical assistance.
This process will also clarify the requirements for public-private and public-public partnerships.
0.9
1.0
1.1
1.2
2006/07
2007/08
2008/09
2009/10
2010/11
2011/12
2012/13
2013/14
2014/15
2015/16
Mill
ions
10.1 9.7
8.4 8.9
10.7
3.2
4.2
2.2 2.0 1.7 2.0
0.1 1.3 1.7
2.6
0
2
4
6
8
10
2005/06
2006/07
2007/08
2008/09
2009/10
2010/11
2011/12
2012/13
2013/14
2014/15
2015/16
2016/17
2017/18
2018/19
2019/20
Per c
ent r
eal g
row
th
Government has successfully maintained the expenditure ceiling for four consecutive years
Aligning new wage agreement to inflation will ease pressure on headcounts
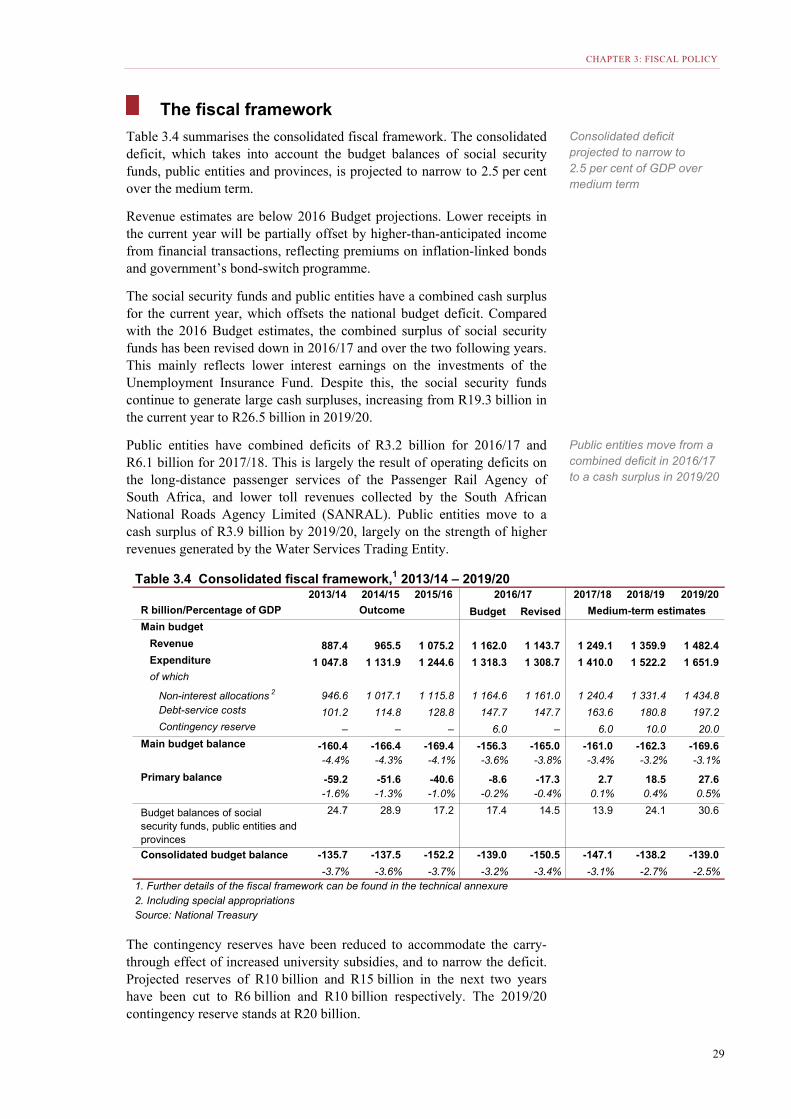
CHAPTER 3: FISCAL POLICY
29
The fiscal framework
Table 3.4 summarises the consolidated fiscal framework. The consolidated deficit, which takes into account the budget balances of social security funds, public entities and provinces, is projected to narrow to 2.5 per cent over the medium term.
Revenue estimates are below 2016 Budget projections. Lower receipts in the current year will be partially offset by higher-than-anticipated income from financial transactions, reflecting premiums on inflation-linked bonds and government’s bond-switch programme.
The social security funds and public entities have a combined cash surplus for the current year, which offsets the national budget deficit. Compared with the 2016 Budget estimates, the combined surplus of social security funds has been revised down in 2016/17 and over the two following years. This mainly reflects lower interest earnings on the investments of the Unemployment Insurance Fund. Despite this, the social security funds continue to generate large cash surpluses, increasing from R19.3 billion in the current year to R26.5 billion in 2019/20.
Public entities have combined deficits of R3.2 billion for 2016/17 and R6.1 billion for 2017/18. This is largely the result of operating deficits on the long-distance passenger services of the Passenger Rail Agency of South Africa, and lower toll revenues collected by the South African National Roads Agency Limited (SANRAL). Public entities move to a cash surplus of R3.9 billion by 2019/20, largely on the strength of higher revenues generated by the Water Services Trading Entity.
The contingency reserves have been reduced to accommodate the carry-through effect of increased university subsidies, and to narrow the deficit. Projected reserves of R10 billion and R15 billion in the next two years have been cut to R6 billion and R10 billion respectively. The 2019/20 contingency reserve stands at R20 billion.
2013/14 2014/15 2015/16 2017/18 2018/19 2019/20
R billion/Percentage of GDP Outcome Budget Revised
Main budget
Revenue 887.4 965.5 1 075.2 1 162.0 1 143.7 1 249.1 1 359.9 1 482.4 Expenditure 1 047.8 1 131.9 1 244.6 1 318.3 1 308.7 1 410.0 1 522.2 1 651.9 of which
Non-interest allocations 2 946.6 1 017.1 1 115.8 1 164.6 1 161.0 1 240.4 1 331.4 1 434.8 Debt-service costs 101.2 114.8 128.8 147.7 147.7 163.6 180.8 197.2 Contingency reserve – – – 6.0 – 6.0 10.0 20.0
Main budget balance -160.4 -166.4 -169.4 -156.3 -165.0 -161.0 -162.3 -169.6-4.4% -4.3% -4.1% -3.6% -3.8% -3.4% -3.2% -3.1%
Primary balance -59.2 -51.6 -40.6 -8.6 -17.3 2.7 18.5 27.6 -1.6% -1.3% -1.0% -0.2% -0.4% 0.1% 0.4% 0.5%
Budget balances of social security funds, public entities and provinces
24.7 28.9 17.2 17.4 14.5 13.9 24.1 30.6
Consolidated budget balance -135.7 -137.5 -152.2 -139.0 -150.5 -147.1 -138.2 -139.0
-3.7% -3.6% -3.7% -3.2% -3.4% -3.1% -2.7% -2.5%1. Further details of the fiscal framework can be found in the technical annexure 2. Including special appropriationsSource: National Treasury
Table 3.4 Consolidated fiscal framework,1 2013/14 – 2019/202016/17
Medium-term estimates
Consolidated deficit projected to narrow to 2.5 per cent of GDP over medium term
Public entities move from a combined deficit in 2016/17 to a cash surplus in 2019/20
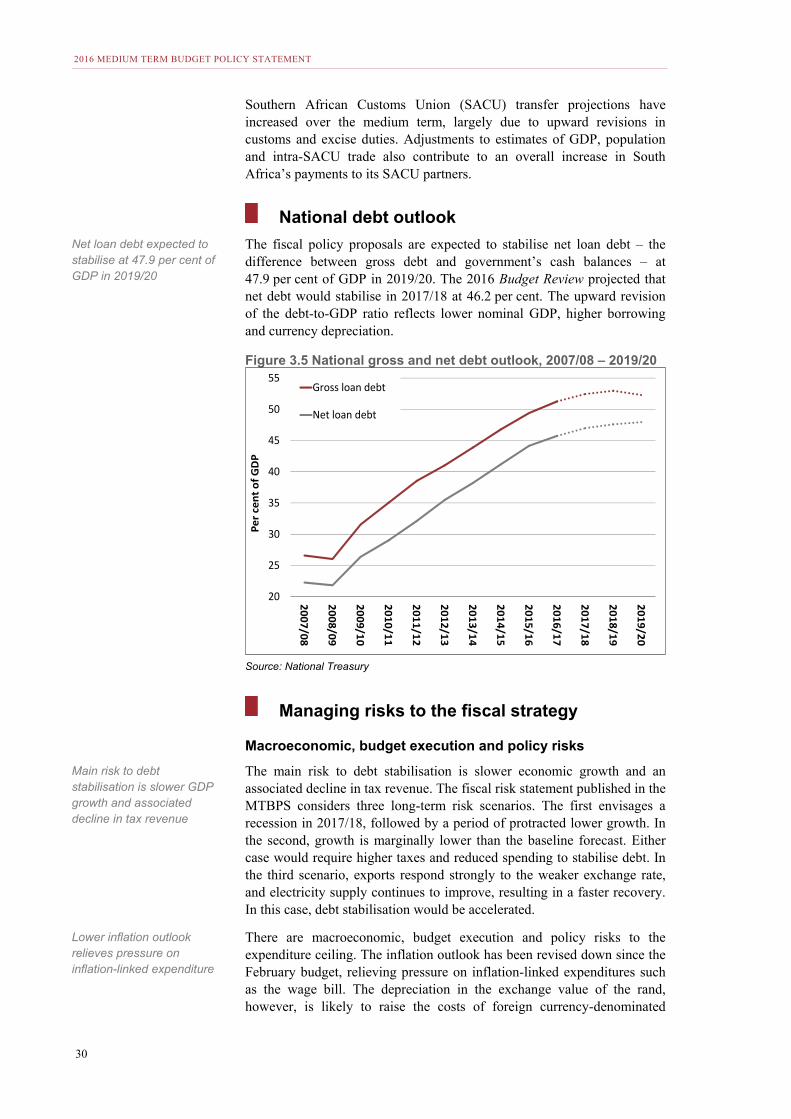
2016 MEDIUM TERM BUDGET POLICY STATEMENT
30
Southern African Customs Union (SACU) transfer projections have increased over the medium term, largely due to upward revisions in customs and excise duties. Adjustments to estimates of GDP, population and intra-SACU trade also contribute to an overall increase in South Africa’s payments to its SACU partners.
National debt outlook
The fiscal policy proposals are expected to stabilise net loan debt – the difference between gross debt and government’s cash balances – at 47.9 per cent of GDP in 2019/20. The 2016 Budget Review projected that net debt would stabilise in 2017/18 at 46.2 per cent. The upward revision of the debt-to-GDP ratio reflects lower nominal GDP, higher borrowing and currency depreciation.
Figure 3.5 National gross and net debt outlook, 2007/08 – 2019/20
Source: National Treasury
Managing risks to the fiscal strategy
Macroeconomic, budget execution and policy risks
The main risk to debt stabilisation is slower economic growth and an associated decline in tax revenue. The fiscal risk statement published in the MTBPS considers three long-term risk scenarios. The first envisages a recession in 2017/18, followed by a period of protracted lower growth. In the second, growth is marginally lower than the baseline forecast. Either case would require higher taxes and reduced spending to stabilise debt. In the third scenario, exports respond strongly to the weaker exchange rate, and electricity supply continues to improve, resulting in a faster recovery. In this case, debt stabilisation would be accelerated.
There are macroeconomic, budget execution and policy risks to the expenditure ceiling. The inflation outlook has been revised down since the February budget, relieving pressure on inflation-linked expenditures such as the wage bill. The depreciation in the exchange value of the rand, however, is likely to raise the costs of foreign currency-denominated
20
25
30
35
40
45
50
55
2007/08
2008/09
2009/10
2010/11
2011/12
2012/13
2013/14
2014/15
2015/16
2016/17
2017/18
2018/19
2019/20
Per c
ent o
f GD
P
Gross loan debt
Net loan debt
Net loan debt expected to stabilise at 47.9 per cent of GDP in 2019/20
Main risk to debt stabilisation is slower GDP growth and associated decline in tax revenue
Lower inflation outlook relieves pressure on inflation-linked expenditure
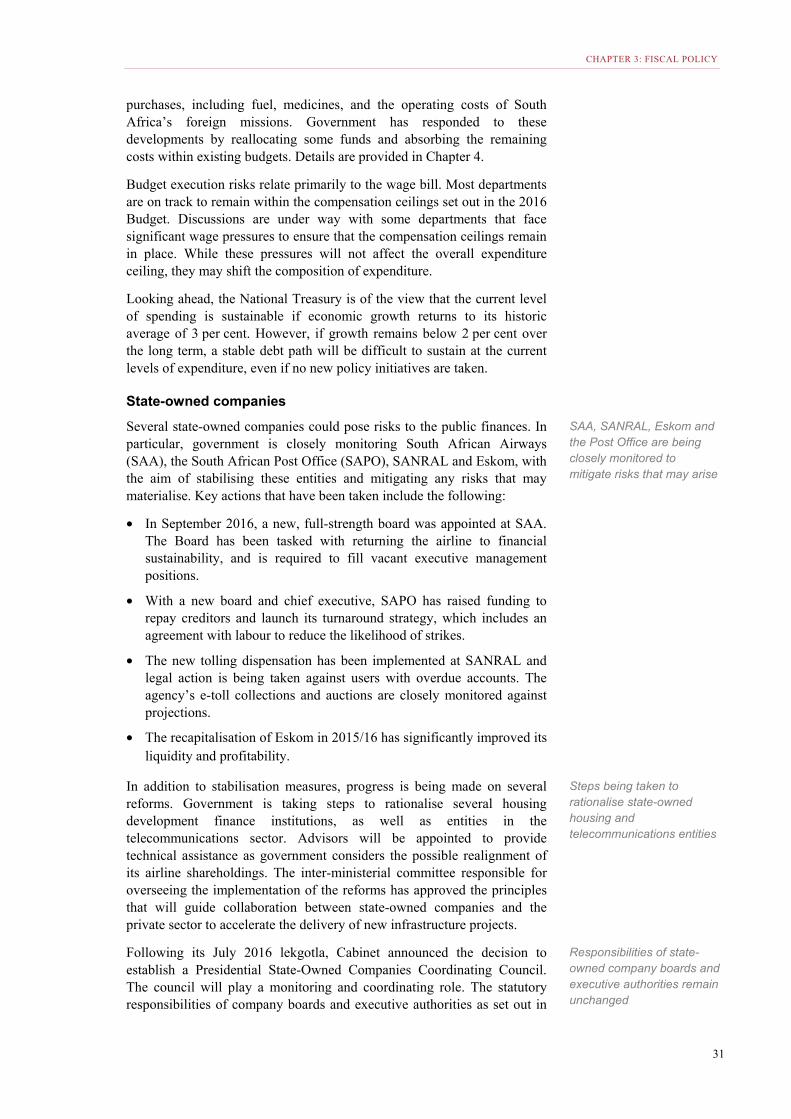
CHAPTER 3: FISCAL POLICY
31
purchases, including fuel, medicines, and the operating costs of South Africa’s foreign missions. Government has responded to these developments by reallocating some funds and absorbing the remaining costs within existing budgets. Details are provided in Chapter 4.
Budget execution risks relate primarily to the wage bill. Most departments are on track to remain within the compensation ceilings set out in the 2016 Budget. Discussions are under way with some departments that face significant wage pressures to ensure that the compensation ceilings remain in place. While these pressures will not affect the overall expenditure ceiling, they may shift the composition of expenditure.
Looking ahead, the National Treasury is of the view that the current level of spending is sustainable if economic growth returns to its historic average of 3 per cent. However, if growth remains below 2 per cent over the long term, a stable debt path will be difficult to sustain at the current levels of expenditure, even if no new policy initiatives are taken.
State-owned companies
Several state-owned companies could pose risks to the public finances. In particular, government is closely monitoring South African Airways (SAA), the South African Post Office (SAPO), SANRAL and Eskom, with the aim of stabilising these entities and mitigating any risks that may materialise. Key actions that have been taken include the following:
• In September 2016, a new, full-strength board was appointed at SAA. The Board has been tasked with returning the airline to financial sustainability, and is required to fill vacant executive management positions.
• With a new board and chief executive, SAPO has raised funding to repay creditors and launch its turnaround strategy, which includes an agreement with labour to reduce the likelihood of strikes.
• The new tolling dispensation has been implemented at SANRAL and legal action is being taken against users with overdue accounts. The agency’s e-toll collections and auctions are closely monitored against projections.
• The recapitalisation of Eskom in 2015/16 has significantly improved its liquidity and profitability.
In addition to stabilisation measures, progress is being made on several reforms. Government is taking steps to rationalise several housing development finance institutions, as well as entities in the telecommunications sector. Advisors will be appointed to provide technical assistance as government considers the possible realignment of its airline shareholdings. The inter-ministerial committee responsible for overseeing the implementation of the reforms has approved the principles that will guide collaboration between state-owned companies and the private sector to accelerate the delivery of new infrastructure projects.
Following its July 2016 lekgotla, Cabinet announced the decision to establish a Presidential State-Owned Companies Coordinating Council. The council will play a monitoring and coordinating role. The statutory responsibilities of company boards and executive authorities as set out in
SAA, SANRAL, Eskom and the Post Office are being closely monitored to mitigate risks that may arise
Steps being taken to rationalise state-owned housing and telecommunications entities
Responsibilities of state-owned company boards and executive authorities remain unchanged
2016 MEDIUM TERM BUDGET POLICY STATEMENT
32
the Companies Act (2008) and Public Finance Management Act (1999) remain unchanged.
Over the medium term, any requests for fiscal support will be informed by the principles set out in the 2015 Budget Review:
• Intervention to support state-owned companies must be consistent with sustainable public finances.
• Capitalisation cannot have an impact on the budget deficit.
• Entities receiving support are required to demonstrate sound business plans, improve governance and address operational efficiencies.
Conclusion
South Africa’s major challenge remains low economic growth. The fiscal policy framework will help to reduce interest rates and improve conditions for investment. Fiscal policy, however, cannot act in isolation. Achieving faster, broad-based economic growth requires government to rapidly implement structural reforms identified in the National Development Plan, and remove constraints to growth. Over time, faster economic growth will generate the revenue necessary for future expansion of public services.
Fiscal policy framework will help to reduce interest rates and create conditions for investment
33
4 Expenditure priorities and division of revenue
In brief • Given lower-than-projected economic growth and revenue collection, government proposes reductions
to the spending ceiling of R10 billion in 2017/18 and R16 billion in 2018/19.
• Over the medium term, spending on core social and economic priorities will be sustained. In some cases, funds will be reallocated to ensure priorities are met in response to rising budgetary pressures.
• Government proposes an additional R17.6 billion to post-school education and training in the 2017 Budget. Total allocations to these institutions over the medium term grow at 11 per cent each year.
• Further moderation in employment levels will be required across government as compensation crowds out spending on essential items in budget baselines.
Budget priorities and fiscal restraint
overnment’s medium-term spending plans take into account the downward revision in economic growth and fiscal policy challenges set out in Chapters 2 and 3. They include proposed
reductions in the expenditure ceiling of R10 billion in 2017/18 and R16 billion in 2018/19. Within this framework, the 2017 Budget will sustain spending on core priorities and shift existing resources to critical needs. Non-interest expenditure will grow by an annual average of 1.2 per cent in real terms over the medium-term expenditure framework (MTEF) period, from R1.25 trillion in 2017/18 to R1.45 trillion in 2019/20.
Most of the spending growth will be directed towards core programmes such as social services and infrastructure to boost economic growth. Allocations to post-school education and training will be the fastest-growing element of the budget. University subsidies will grow at an annual average rate of 10.9 per cent and allocations to the National Student Financial Aid Scheme (NSFAS) at 18.5 per cent, providing support to underfunded university students. Public works programmes that contribute directly to employment will continue to grow rapidly. Grants that support people living with HIV/AIDS will increase by an annual average of
Non-interest expenditure to grow at 1.2 per cent in real terms over the medium term G
Spending growth focused in core programmes such as social services and infrastructure
2016 MEDIUM TERM BUDGET POLICY STATEMENT
34
13.6 per cent each year. Greater emphasis will be placed on improving spending quality and implementing cost-containment measures.
Rising pressure on budgets
Spending pressures are mounting across the public finances:
• The 2015 public-sector wage settlement continues to limit the availability of funds for crucial public services.
• In the health sector, higher salaries, rising utilisation of services and higher import prices for medicines are straining budgets.
• The local equitable share, which funds free basic electricity and water for the poor, is more thinly stretched as utility prices outpace inflation.
• Congestion is growing on the national road network and the condition of many provincial roads is deteriorating, but there is uncertainty about the funding model for expansion and maintenance.
• As basic social infrastructure is extended further into rural areas, unit connection costs are rising.
• The depreciation of the exchange rate will make it more expensive to run South Africa’s international missions.
Additional funding requirements include a higher allocation to the national school nutrition programme grant to offset the rising price of food. The value of the child support grant is also raised by R10 to R360 to keep pace with inflation. An additional R17.6 billion is needed for higher education, which is discussed in the section on post-school education and training below.
Rising compensation costs have put acute pressure on government departments. Over the past year, Cabinet has introduced strict limits on the compensation budgets and associated planning of national departments. Similar measures are under way in provincial governments. Departments now submit, as part of their budget documents, clear plans that reconcile compensation ceilings with headcount management and recruitment.
Stronger budget control has stabilised headcounts. However, further moderation in employment levels will be required across government in the years ahead, with much of this reduction achieved through attrition. The current public-sector wage agreement expires in March 2018. If government and public-sector workers are able to reach a balanced agreement on wages and productivity, compensation pressures could moderate beginning in April 2018. This would allow departments to plan for additional staff and make resources available to fund new policy priorities.
Finding resources within budgets
To fund critical requirements and stay within the reduced expenditure ceiling, government will have to make available R16.7 billion in 2017/18 and R23.2 billion in 2018/19 from existing budgets. A drawdown on the contingency reserve will contribute to these requirements, and a number of provisional allocations made in the previous budget will be rescinded. A portion of the resources to support university students will be found elsewhere from within the post-school education system.
Spending pressures include rising healthcare salaries, and funding to expand and maintain provincial roads
Child support grant is increased by R10 to R360 to keep pace with inflation
Headcounts have stabilised, but further moderation required
Drawdown on contingency reserve will contribute to resource mobilisation
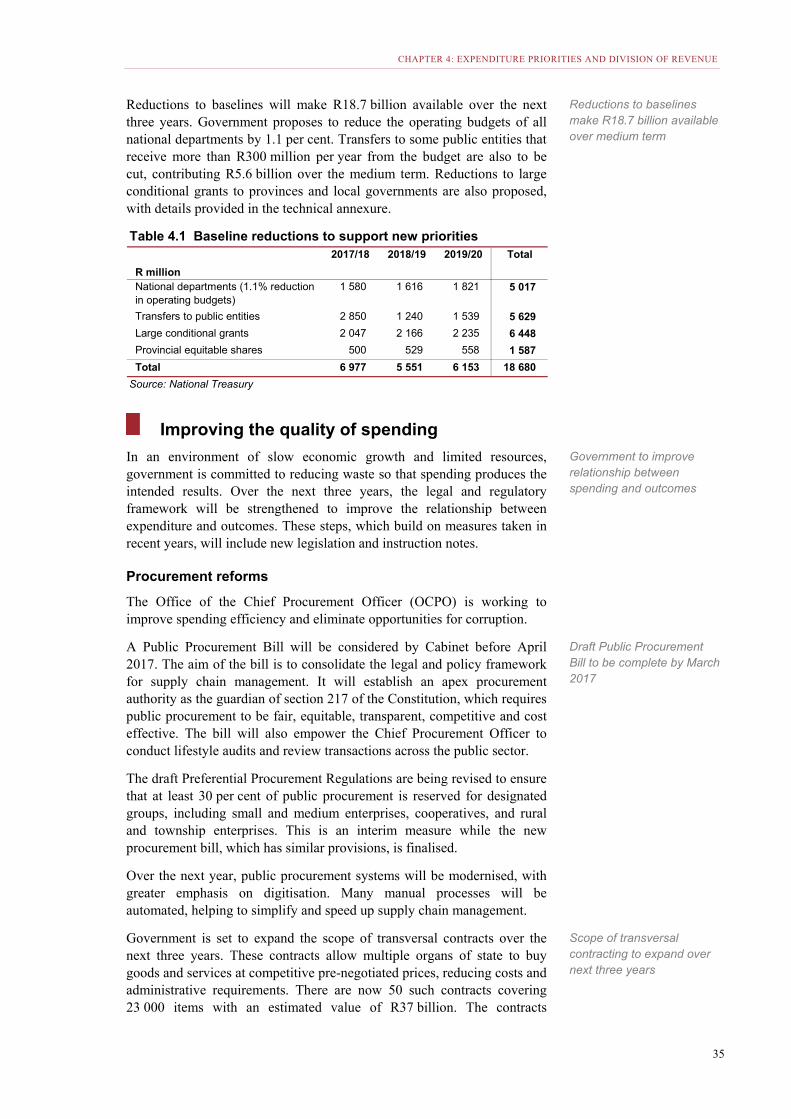
CHAPTER 4: EXPENDITURE PRIORITIES AND DIVISION OF REVENUE
35
Reductions to baselines will make R18.7 billion available over the next three years. Government proposes to reduce the operating budgets of all national departments by 1.1 per cent. Transfers to some public entities that receive more than R300 million per year from the budget are also to be cut, contributing R5.6 billion over the medium term. Reductions to large conditional grants to provinces and local governments are also proposed, with details provided in the technical annexure.
Improving the quality of spending
In an environment of slow economic growth and limited resources, government is committed to reducing waste so that spending produces the intended results. Over the next three years, the legal and regulatory framework will be strengthened to improve the relationship between expenditure and outcomes. These steps, which build on measures taken in recent years, will include new legislation and instruction notes.
Procurement reforms
The Office of the Chief Procurement Officer (OCPO) is working to improve spending efficiency and eliminate opportunities for corruption.
A Public Procurement Bill will be considered by Cabinet before April 2017. The aim of the bill is to consolidate the legal and policy framework for supply chain management. It will establish an apex procurement authority as the guardian of section 217 of the Constitution, which requires public procurement to be fair, equitable, transparent, competitive and cost effective. The bill will also empower the Chief Procurement Officer to conduct lifestyle audits and review transactions across the public sector.
The draft Preferential Procurement Regulations are being revised to ensure that at least 30 per cent of public procurement is reserved for designated groups, including small and medium enterprises, cooperatives, and rural and township enterprises. This is an interim measure while the new procurement bill, which has similar provisions, is finalised.
Over the next year, public procurement systems will be modernised, with greater emphasis on digitisation. Many manual processes will be automated, helping to simplify and speed up supply chain management.
Government is set to expand the scope of transversal contracts over the next three years. These contracts allow multiple organs of state to buy goods and services at competitive pre-negotiated prices, reducing costs and administrative requirements. There are now 50 such contracts covering 23 000 items with an estimated value of R37 billion. The contracts
Table 4.1 Baseline reductions to support new priorities2017/18 2018/19 2019/20 Total
R millionNational departments (1.1% reduction in operating budgets)
1 580 1 616 1 821 5 017
Transfers to public entities 2 850 1 240 1 539 5 629
Large conditional grants 2 047 2 166 2 235 6 448
Provincial equitable shares 500 529 558 1 587
Total 6 977 5 551 6 153 18 680
Source: National Treasury
Reductions to baselines make R18.7 billion available over medium term
Government to improve relationship between spending and outcomes
Draft Public Procurement Bill to be complete by March 2017
Scope of transversal contracting to expand over next three years
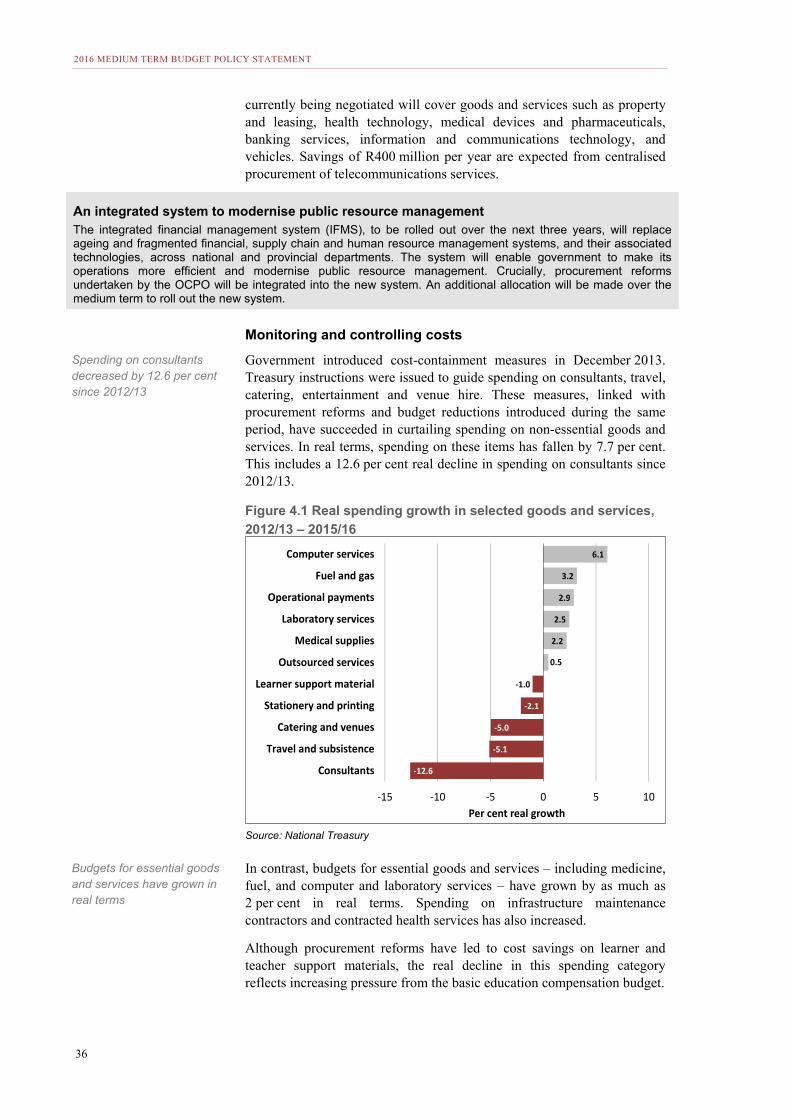
2016 MEDIUM TERM BUDGET POLICY STATEMENT
36
currently being negotiated will cover goods and services such as property and leasing, health technology, medical devices and pharmaceuticals, banking services, information and communications technology, and vehicles. Savings of R400 million per year are expected from centralised procurement of telecommunications services.
An integrated system to modernise public resource management The integrated financial management system (IFMS), to be rolled out over the next three years, will replace ageing and fragmented financial, supply chain and human resource management systems, and their associated technologies, across national and provincial departments. The system will enable government to make its operations more efficient and modernise public resource management. Crucially, procurement reforms undertaken by the OCPO will be integrated into the new system. An additional allocation will be made over the medium term to roll out the new system.
Monitoring and controlling costs
Government introduced cost-containment measures in December 2013. Treasury instructions were issued to guide spending on consultants, travel, catering, entertainment and venue hire. These measures, linked with procurement reforms and budget reductions introduced during the same period, have succeeded in curtailing spending on non-essential goods and services. In real terms, spending on these items has fallen by 7.7 per cent. This includes a 12.6 per cent real decline in spending on consultants since 2012/13.
Figure 4.1 Real spending growth in selected goods and services,
2012/13 – 2015/16
Source: National Treasury
In contrast, budgets for essential goods and services – including medicine, fuel, and computer and laboratory services – have grown by as much as 2 per cent in real terms. Spending on infrastructure maintenance contractors and contracted health services has also increased.
Although procurement reforms have led to cost savings on learner and teacher support materials, the real decline in this spending category reflects increasing pressure from the basic education compensation budget.
-12.6
-5.1
-5.0
-2.1
-1.0
0.5
2.2
2.5
2.9
3.2
6.1
-15 -10 -5 0 5 10
Consultants
Travel and subsistence
Catering and venues
Stationery and printing
Learner support material
Outsourced services
Medical supplies
Laboratory services
Operational payments
Fuel and gas
Computer services
Per cent real growth
Spending on consultants decreased by 12.6 per cent since 2012/13
Budgets for essential goods and services have grown in real terms
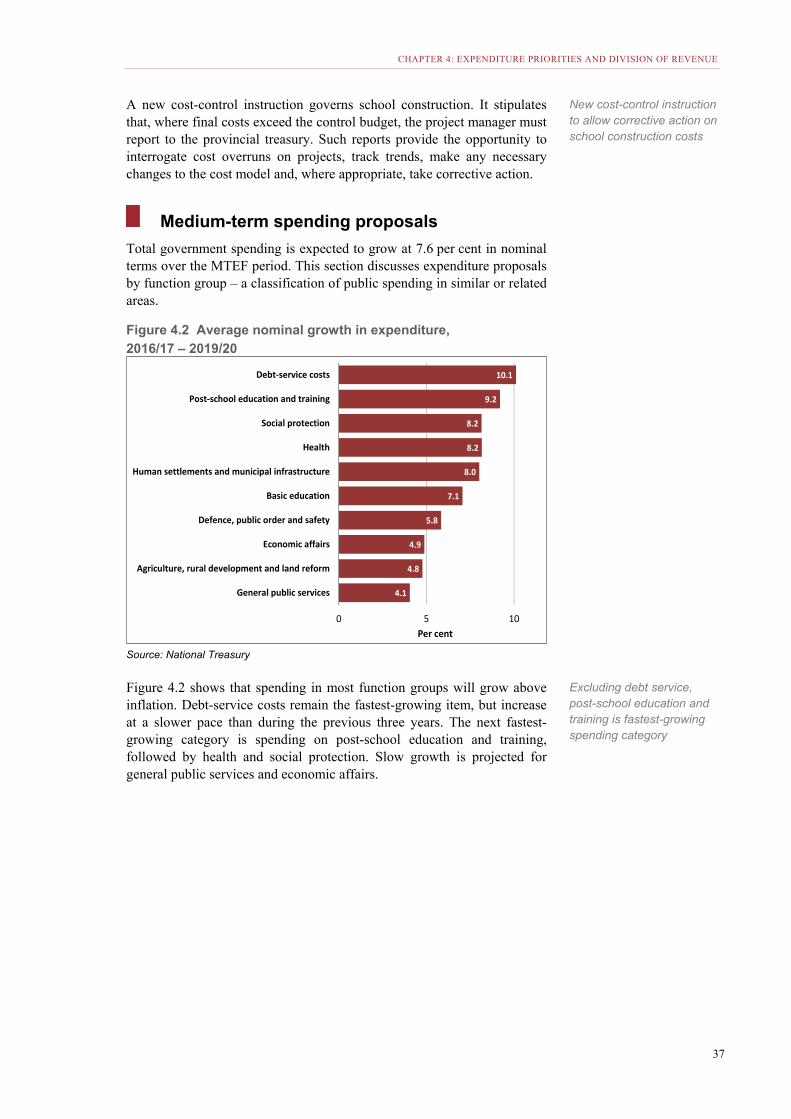
CHAPTER 4: EXPENDITURE PRIORITIES AND DIVISION OF REVENUE
37
A new cost-control instruction governs school construction. It stipulates that, where final costs exceed the control budget, the project manager must report to the provincial treasury. Such reports provide the opportunity to interrogate cost overruns on projects, track trends, make any necessary changes to the cost model and, where appropriate, take corrective action.
Medium-term spending proposals
Total government spending is expected to grow at 7.6 per cent in nominal terms over the MTEF period. This section discusses expenditure proposals by function group – a classification of public spending in similar or related areas.
Figure 4.2 Average nominal growth in expenditure,
2016/17 – 2019/20
Source: National Treasury
Figure 4.2 shows that spending in most function groups will grow above inflation. Debt-service costs remain the fastest-growing item, but increase at a slower pace than during the previous three years. The next fastest-growing category is spending on post-school education and training, followed by health and social protection. Slow growth is projected for general public services and economic affairs.
4.1
4.8
4.9
5.8
7.1
8.0
8.2
8.2
9.2
10.1
0 5 10
General public services
Agriculture, rural development and land reform
Economic affairs
Defence, public order and safety
Basic education
Human settlements and municipal infrastructure
Health
Social protection
Post-school education and training
Debt-service costs
Per cent
New cost-control instruction to allow corrective action on school construction costs
Excluding debt service, post-school education and training is fastest-growing spending category
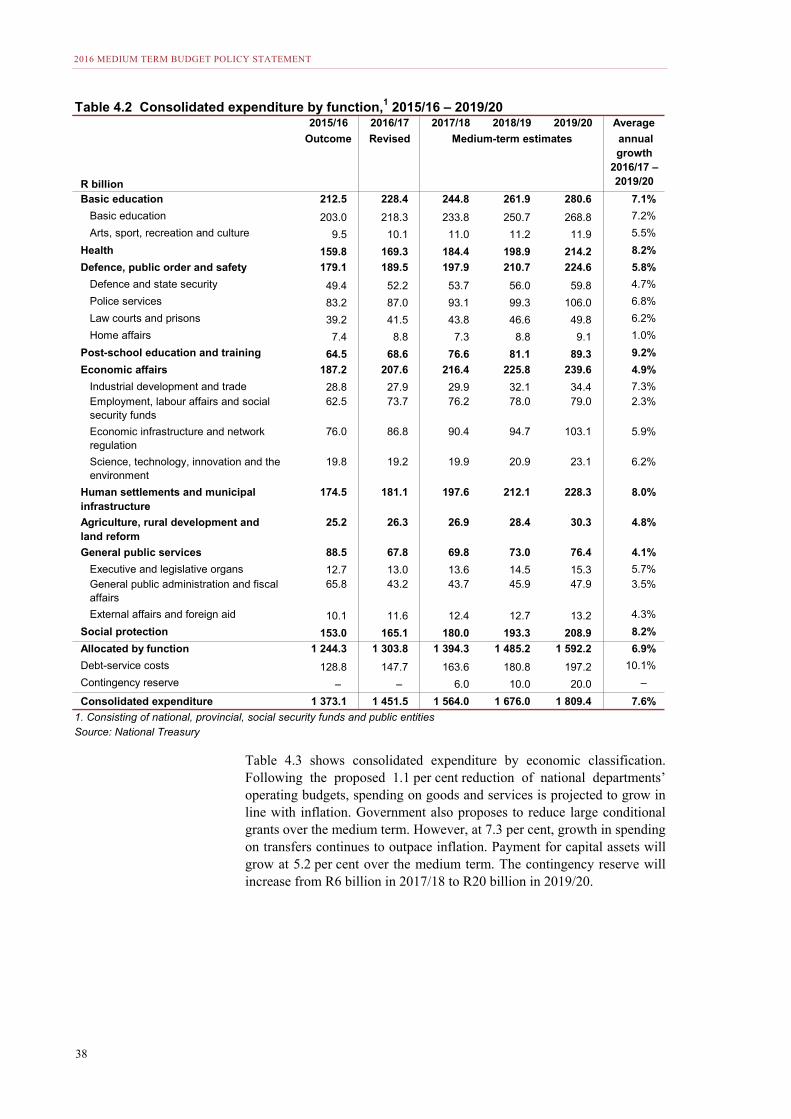
2016 MEDIUM TERM BUDGET POLICY STATEMENT
38
Table 4.3 shows consolidated expenditure by economic classification. Following the proposed 1.1 per cent reduction of national departments’ operating budgets, spending on goods and services is projected to grow in line with inflation. Government also proposes to reduce large conditional grants over the medium term. However, at 7.3 per cent, growth in spending on transfers continues to outpace inflation. Payment for capital assets will grow at 5.2 per cent over the medium term. The contingency reserve will increase from R6 billion in 2017/18 to R20 billion in 2019/20.
Table 4.2 Consolidated expenditure by function,1 2015/16 – 2019/202015/16 2016/17 2017/18 2018/19 2019/20 Average
R billion
Outcome Revised Medium-term estimates annual growth
2016/17 – 2019/20
Basic education 212.5 228.4 244.8 261.9 280.6 7.1%
Basic education 203.0 218.3 233.8 250.7 268.8 7.2%
Arts, sport, recreation and culture 9.5 10.1 11.0 11.2 11.9 5.5%
Health 159.8 169.3 184.4 198.9 214.2 8.2%
Defence, public order and safety 179.1 189.5 197.9 210.7 224.6 5.8%
Defence and state security 49.4 52.2 53.7 56.0 59.8 4.7%
Police services 83.2 87.0 93.1 99.3 106.0 6.8%
Law courts and prisons 39.2 41.5 43.8 46.6 49.8 6.2%
Home affairs 7.4 8.8 7.3 8.8 9.1 1.0%
Post-school education and training 64.5 68.6 76.6 81.1 89.3 9.2%
Economic affairs 187.2 207.6 216.4 225.8 239.6 4.9%
Industrial development and trade 28.8 27.9 29.9 32.1 34.4 7.3%Employment, labour affairs and social security funds
62.5 73.7 76.2 78.0 79.0 2.3%
Economic infrastructure and network regulation
76.0 86.8 90.4 94.7 103.1 5.9%
Science, technology, innovation and the environment
19.8 19.2 19.9 20.9 23.1 6.2%
Human settlements and municipal infrastructure
174.5 181.1 197.6 212.1 228.3 8.0%
Agriculture, rural development and land reform
25.2 26.3 26.9 28.4 30.3 4.8%
General public services 88.5 67.8 69.8 73.0 76.4 4.1%
Executive and legislative organs 12.7 13.0 13.6 14.5 15.3 5.7%General public administration and fiscal affairs
65.8 43.2 43.7 45.9 47.9 3.5%
External affairs and foreign aid 10.1 11.6 12.4 12.7 13.2 4.3%
Social protection 153.0 165.1 180.0 193.3 208.9 8.2%
Allocated by function 1 244.3 1 303.8 1 394.3 1 485.2 1 592.2 6.9%
Debt-service costs 128.8 147.7 163.6 180.8 197.2 10.1%
Contingency reserve – – 6.0 10.0 20.0 –
Consolidated expenditure 1 373.1 1 451.5 1 564.0 1 676.0 1 809.4 7.6%
1. Consisting of national, provincial, social security funds and public entitiesSource: National Treasury
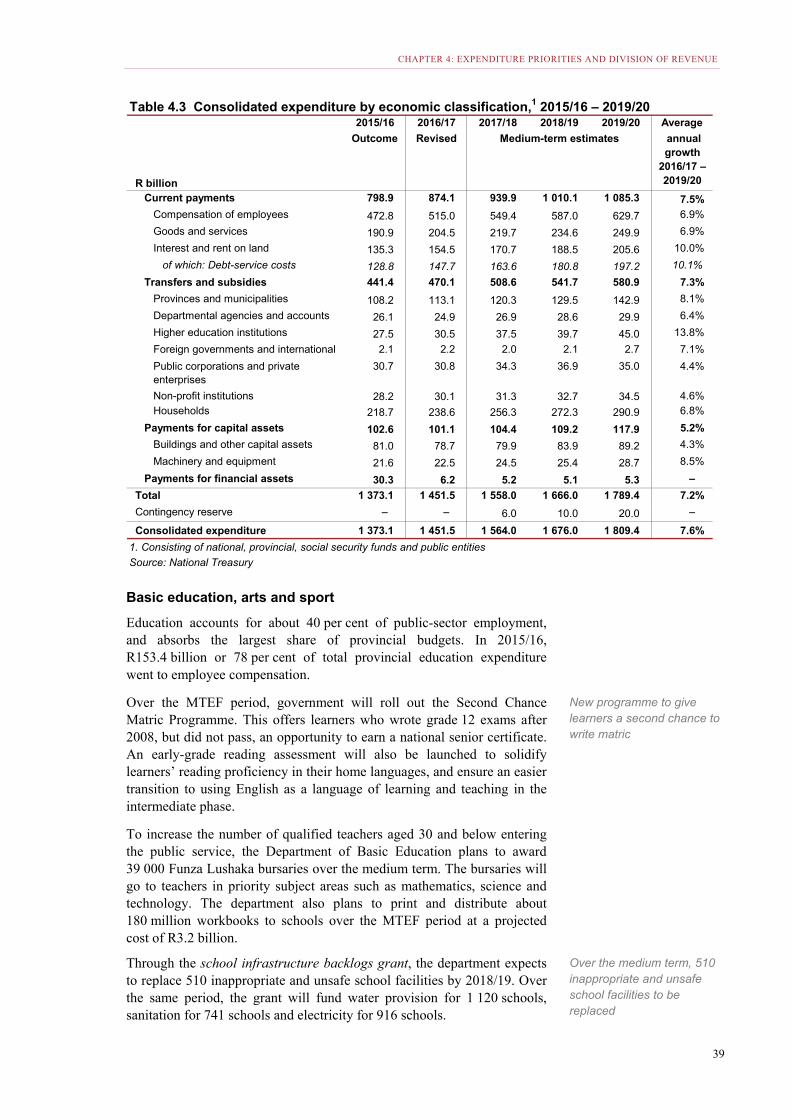
CHAPTER 4: EXPENDITURE PRIORITIES AND DIVISION OF REVENUE
39
Basic education, arts and sport
Education accounts for about 40 per cent of public-sector employment, and absorbs the largest share of provincial budgets. In 2015/16, R153.4 billion or 78 per cent of total provincial education expenditure went to employee compensation.
Over the MTEF period, government will roll out the Second Chance Matric Programme. This offers learners who wrote grade 12 exams after 2008, but did not pass, an opportunity to earn a national senior certificate. An early-grade reading assessment will also be launched to solidify learners’ reading proficiency in their home languages, and ensure an easier transition to using English as a language of learning and teaching in the intermediate phase.
To increase the number of qualified teachers aged 30 and below entering the public service, the Department of Basic Education plans to award 39 000 Funza Lushaka bursaries over the medium term. The bursaries will go to teachers in priority subject areas such as mathematics, science and technology. The department also plans to print and distribute about 180 million workbooks to schools over the MTEF period at a projected cost of R3.2 billion.
Through the school infrastructure backlogs grant, the department expects to replace 510 inappropriate and unsafe school facilities by 2018/19. Over the same period, the grant will fund water provision for 1 120 schools, sanitation for 741 schools and electricity for 916 schools.
Table 4.3 Consolidated expenditure by economic classification,1 2015/16 – 2019/202015/16 2016/17 2017/18 2018/19 2019/20 Average
R billion
Outcome Revised Medium-term estimates annual growth
2016/17 – 2019/20
Current payments 798.9 874.1 939.9 1 010.1 1 085.3 7.5%
Compensation of employees 472.8 515.0 549.4 587.0 629.7 6.9%
Goods and services 190.9 204.5 219.7 234.6 249.9 6.9%
Interest and rent on land 135.3 154.5 170.7 188.5 205.6 10.0%
of which: Debt-service costs 128.8 147.7 163.6 180.8 197.2 10.1%
Transfers and subsidies 441.4 470.1 508.6 541.7 580.9 7.3%
Provinces and municipalities 108.2 113.1 120.3 129.5 142.9 8.1%
Departmental agencies and accounts 26.1 24.9 26.9 28.6 29.9 6.4%
Higher education institutions 27.5 30.5 37.5 39.7 45.0 13.8%
Foreign governments and international 2.1 2.2 2.0 2.1 2.7 7.1%
Public corporations and private enterprises
30.7 30.8 34.3 36.9 35.0 4.4%
Non-profit institutions 28.2 30.1 31.3 32.7 34.5 4.6%Households 218.7 238.6 256.3 272.3 290.9 6.8%
Payments for capital assets 102.6 101.1 104.4 109.2 117.9 5.2%
Buildings and other capital assets 81.0 78.7 79.9 83.9 89.2 4.3%
Machinery and equipment 21.6 22.5 24.5 25.4 28.7 8.5%
Payments for financial assets 30.3 6.2 5.2 5.1 5.3 –
Total 1 373.1 1 451.5 1 558.0 1 666.0 1 789.4 7.2%
Contingency reserve – – 6.0 10.0 20.0 –
Consolidated expenditure 1 373.1 1 451.5 1 564.0 1 676.0 1 809.4 7.6%
1. Consisting of national, provincial, social security funds and public entities
Source: National Treasury
New programme to give learners a second chance to write matric
Over the medium term, 510 inappropriate and unsafe school facilities to be replaced
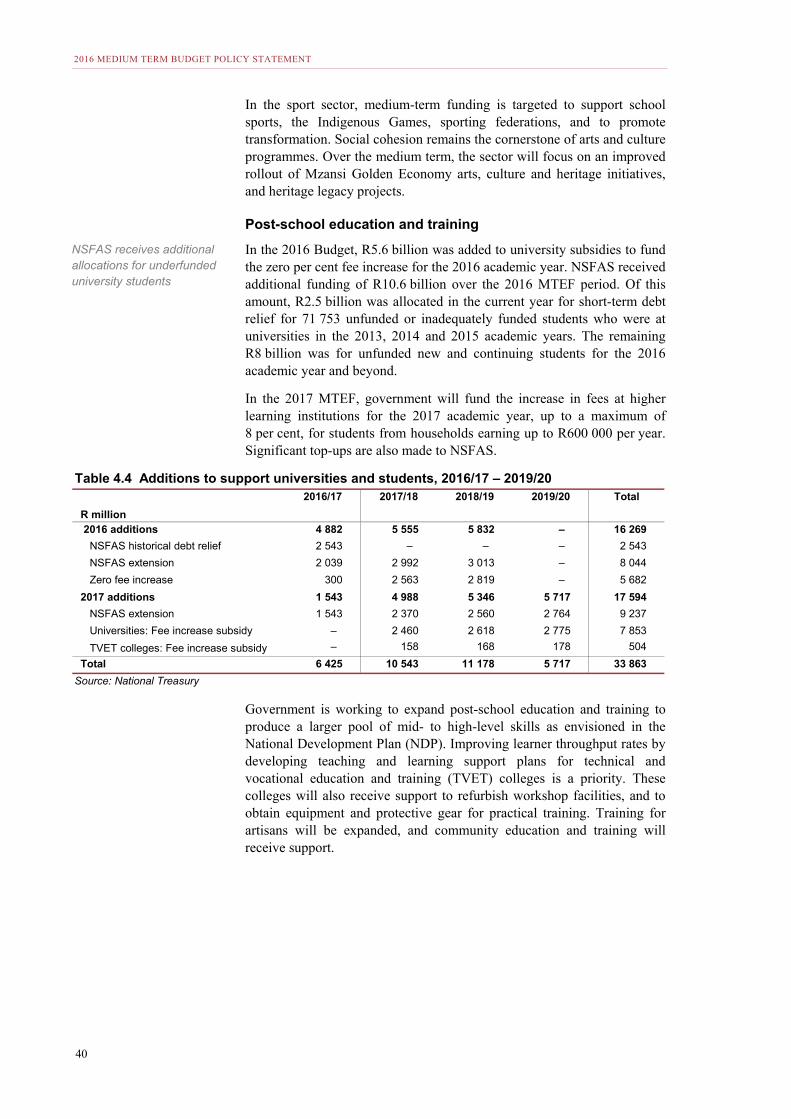
2016 MEDIUM TERM BUDGET POLICY STATEMENT
40
In the sport sector, medium-term funding is targeted to support school sports, the Indigenous Games, sporting federations, and to promote transformation. Social cohesion remains the cornerstone of arts and culture programmes. Over the medium term, the sector will focus on an improved rollout of Mzansi Golden Economy arts, culture and heritage initiatives, and heritage legacy projects.
Post-school education and training
In the 2016 Budget, R5.6 billion was added to university subsidies to fund the zero per cent fee increase for the 2016 academic year. NSFAS received additional funding of R10.6 billion over the 2016 MTEF period. Of this amount, R2.5 billion was allocated in the current year for short-term debt relief for 71 753 unfunded or inadequately funded students who were at universities in the 2013, 2014 and 2015 academic years. The remaining R8 billion was for unfunded new and continuing students for the 2016 academic year and beyond.
In the 2017 MTEF, government will fund the increase in fees at higher learning institutions for the 2017 academic year, up to a maximum of 8 per cent, for students from households earning up to R600 000 per year. Significant top-ups are also made to NSFAS.
Government is working to expand post-school education and training to produce a larger pool of mid- to high-level skills as envisioned in the National Development Plan (NDP). Improving learner throughput rates by developing teaching and learning support plans for technical and vocational education and training (TVET) colleges is a priority. These colleges will also receive support to refurbish workshop facilities, and to obtain equipment and protective gear for practical training. Training for artisans will be expanded, and community education and training will receive support.
Table 4.4 Additions to support universities and students, 2016/17 – 2019/202016/17 2017/18 2018/19 2019/20 Total
R million 2016 additions 4 882 5 555 5 832 – 16 269
NSFAS historical debt relief 2 543 – – – 2 543
NSFAS extension 2 039 2 992 3 013 – 8 044
Zero fee increase 300 2 563 2 819 – 5 682
2017 additions 1 543 4 988 5 346 5 717 17 594
NSFAS extension 1 543 2 370 2 560 2 764 9 237
Universities: Fee increase subsidy – 2 460 2 618 2 775 7 853
TVET colleges: Fee increase subsidy – 158 168 178 504
Total 6 425 10 543 11 178 5 717 33 863
Source: National Treasury
NSFAS receives additional allocations for underfunded university students
CHAPTER 4: EXPENDITURE PRIORITIES AND DIVISION OF REVENUE
41
Public expenditure reviews On 31 October, the National Treasury will publish the results of 27 performance and expenditure reviews, which were co-initiated with the Department of Planning, Monitoring and Evaluation in 2013. The reviews scrutinise expenditure and programme performance data to assess and improve the cost effectiveness of public policy and budget planning. A key observation emerging from the studies is that policies are sometimes designed with unrealistic expectations regarding the availability of funding.
The reviews, compiled by consultants, should be considered advisory submissions that do not necessarily reflect government’s views or assessment. Sample observations from the reviews include the following:
• Housing – A comparison of six housing programmes funded through the human settlement development grant shows that only 123 000 housing units are delivered per year, against the published number of 254 000 units. The full cost of an RDP house is calculated at R169 000, compared with a subsidy of just R90 000 at the time of the study. The additional costs are largely met from municipal infrastructure funding. Mobilisation of private finance is insufficient. At the present pace of delivery, it would take 30 years to eradicate the estimated backlog of 2 million housing unit using the RDP and informal settlement model of delivery, at a cost of R600 billion.
• Water and sanitation – A study covering four municipalities found that weak revenue management, a failure to bill consumers, low payment levels and ineffective debt collection undermine the sustainability of water services. Should non-revenue water be reduced to 25 per cent through repairs, maintenance and refurbishment, the municipalities in the study could realise an additional R800 million per year.
• TVET colleges – From 2010 to 2014, enrolments in TVET colleges nearly doubled, from 358 393 to 702 383. Colleges receive over 85 per cent of their funding from government. In 2013, the estimated throughput rate for the National Certificate Vocational was just 10.6 per cent, which means that for every 10 students that enrol in a certificate course, only one completes the course after six years.
• Partnering of science councils with private sector – As a group, the science councils are not effective in partnering with the private sector. Mintek and the Council for Scientific and Industrial Research (CSIR) are exceptions. For every R1 that government invests in the science councils, only R0.62 in private income is generated, compared with the global norm of 1:1.
• Cost drivers in foreign missions – Over the past three years, the rate of spending growth at foreign missions has exceeded the rate of rand depreciation. Spending growth was driven largely by higher property costs, allowances for South African staff, and growth in the number of locally recruited personnel. Cost-of-living allowances for South African staff at missions are exceptionally generous, ranging from R600 000 to R1.3 million per year, and are paid on top of full salaries, accommodation, education and other allowances.
Health
Spending growth in health is mainly to support the expansion of the HIV/AIDS programme, in particular antiretroviral treatment, which now reaches 3.5 million people. A significant increase in antiretroviral therapy is expected with the implementation of universal test-and-treat (treatment initiation in all age groups regardless of CD4 count) in September of this year. Government has also adopted the 90-90-90 HIV and AIDS targets (90 per cent of people living with HIV know their status, 90 per cent of those who know their status have been introduced to antiretroviral therapy, and 90 per cent of those receiving treatment have suppressed viral loads).
Health-sector budgets are under pressure due to compensation costs, rising utilisation of public health services, higher import prices of medicines as a result of currency depreciation, and sector priorities that require additional funding. The latter includes the Nelson Mandela Children’s Hospital in Johannesburg, which is to be opened later this financial year and needs operational funding.
The health sector accounts for about 12 per cent of public expenditure and it is important to use these resources efficiently. The public health system is realising lower pharmaceutical costs as a result of centralised tendering, market intelligence, medicine stock surveillance and new distribution systems.
Antiretroviral treatment programme now reaches 3.5 million people
Compensation costs and growing utilisation have put pressure on healthcare budgets
2016 MEDIUM TERM BUDGET POLICY STATEMENT
42
The proposed sugar-sweetened beverage tax is expected to help reduce the incidence of non-communicable disease associated with high sugar intake, such as heart disease, stroke and type 2 diabetes. Health promotion interventions, including primary prevention and early detection of non-communicable diseases, will be implemented alongside the proposed tax.
Social protection
As announced in the 2016 Budget Speech, the old-age, disability and care dependency grants each increase by R10 in October 2016. Government has now decided to also increase the child support grant by R10 to R360 to offset the effects of high food inflation recorded earlier this year.
In addition, Cabinet has approved in principle an extended child support grant for orphans who have lost both parents but are in the care of extended family members. The grant, which could be implemented in 2018/19, brings the income protection afforded to these orphans closer to parity with that provided to orphans in foster care.
With effect from 2017/18, a new conditional grant to provinces will support the employment of social worker graduates from the national scholarship programme. Social workers will be employed by provinces and non-profit organisations. A second conditional grant will expand early childhood development services and the maintenance of related infrastructure. The National Treasury is working with the Department of Social Development on a strategy to guide future financing for early childhood development.
Agriculture, rural development and land reform
In line with the aims of maximising agriculture’s contribution to jobs and growth, and more efficient use of public resources, several government departments are working to improve coordination of farmer support programmes. This will eliminate existing overlaps and double-dipping of funding from the agriculture and rural development departments.
National and provincial government reprioritised R1.6 billion towards emergency funding for drought-relief initiatives between April 2015 and June 2016. The funding was used to provide water-tankering services and animal feed, and to refurbish and drill boreholes. The 2016 Adjusted Estimates of National Expenditure allocates a further R553.3 million for the acquisition of a mobile desalination plant and animal feed, ahead of rains expected later in the year.
Over the medium term, the agri-parks initiative will be rolled out. These parks are intended to help small farmers with production, processing, logistics, marketing and training within district municipalities. They are expected to contribute to rural job creation.
Science, technology and the environment
Over the medium term, the Department of Science and Technology will focus on increasing research and development. The CSIR will perform relevant research, strengthen the skills base, and transfer skills and technology. Each year the CSIR will fund research that will result in at least 25 new technology demonstrators and 15 new patents. National
Proposed sugar tax to be introduced alongside health promotion interventions
New conditional grant to expand early childhood development services to be introduced
Government provides a further R553.3 million for drought relief
National Research Foundation to grow number of masters students supported to 5 350
CHAPTER 4: EXPENDITURE PRIORITIES AND DIVISION OF REVENUE
43
Research Foundation funds will increase the number of masters students supported to 5 350 per year over the three-year period.
During the MTEF period, government will establish the Waste Bureau, which will be responsible for overseeing the implementation of industry waste management plans. This includes managing and disbursing revenue collected from waste management charges, and putting in place a new institutional arrangement to manage the recycling of tyres and associated revenue collection.
Employment, labour and social security funds
Spending in this area is aligned to medium-term strategic framework targets to be achieved by 2019: creating 6 million short- to medium-term jobs through the Expanded Public Works Programme, increasing statutory workplace inspections by the Department of Labour, and promoting industrial development and trade.
Government expects to roll out the Community Work Programme in every municipality by March 2017. Over the next three years, the Jobs Fund is expected to spend R3.7 billion on projects that create permanent jobs, and address structural constraints to growth and employment. While spending on the fund has been slow, it has created permanent employment at a cost of R52 000 per job, which compares favourably with other government programmes.
A proposed R45 billion will be allocated to promote industrialisation, economic transformation and sustainable resource management over the medium term. A significant portion of this amount will be provided through incentives, industry promotion, and assistance to small enterprises and cooperatives.
Human settlements and municipal infrastructure
Human settlements and municipal infrastructure investments are focused on improving access to housing, water, sanitation, electricity, and safe and reliable public transport. Over the medium term, funding will support water, sanitation and electrification infrastructure demand in rural areas, and improve mobility and access to shelter in urban areas.
To improve the provision of social housing subsidies, which help poor households access affordable rental housing, government proposes shifting funds from the human settlements development grant to the Social Housing Regulatory Authority. This shift is expected to speed up the delivery of 4 944 rental housing units for households with an income of below R3 500 per month.
Over the medium term, funds are shifted from the human settlements development grant to the Housing Development Agency for project planning of catalytic projects intended to change the structure of towns and cities. The projects are to be implemented between 2016 and 2030.
The NDP targets 2030 for universal access to electrification. With a focus on 27 underserviced districts, connection costs are increasing, because targeted areas are less accessible and further from the grid. Government is increasingly making use of advances in non-grid, renewable technology.
Bureau to oversee implementation of industry waste management plans to be established
Medium-term allocation of R45 billion to support industrialisation and transformation
Delivery of rental housing units for low-income households to be speeded up
2016 MEDIUM TERM BUDGET POLICY STATEMENT
44
Over the medium term, the Integrated National Electrification Programme expects to provide 772 650 households with access to electricity. An amount of R99.3 million will be reallocated from the programme to establish the National Radioactive Waste Disposal Institute, which is responsible for disposing waste at Koeberg and Pelindaba. The allocation is for the start-up costs as the institute’s operations are to be self-funded.
Above-inflation increases to bulk services and household growth increase municipal financial obligations significantly. As a result, R1 billion is added to the local government equitable share in 2018/19.
Economic infrastructure and network regulation
Government continues to invest in economic infrastructure in line with the NDP.
The baseline allocation of the South African National Roads Agency Limited includes planning for the construction of the N2 Wild Coast road, upgrades to the R573 Moloto Road, and the maintenance of 21 403km of the national road network. The N2 Wild Coast road is to be approximately 410km, of which 112km is new and includes nine bridges. Funding for the major bridges crossing the Msikaba and Mtentu river gorges will be from the budget and the road upgrades will be tolled. The project will reduce travel time between East London and Durban by up to three hours. In addition, a medium-term allocation to the provincial roads maintenance grant is expected to maintain 5 390km of provincial roads.
Government plans to begin connecting public buildings to high-speed internet over the MTEF period and will provide broadband to 6 135 government sites at a minimum speed of 10 megabits per second. Given delays as a result of litigation, government proposes to shift funds away from subsidies for set-top boxes in 2017/18. The funds will be reallocated to the dual illumination project, which will operate both digital and analogue signals for an interim period before shutting off the analogue signal as part of the migration to digital.
Funds are reassigned to support the capacity of the Ports Regulator, and to develop the capacity for rail economic regulation in anticipation of the proposed single transport economic regulator. To improve management of water resources and strengthen coordination with other institutions involved in water-related matters, funds are shifted to establish water catchment management agencies.
Defence, public order and safety
Over the medium term, the South African Police Service will strengthen implementation of its back-to-basics strategy. The strategy seeks to promote an approach to policing focused on every police officer doing the basics of policing properly and consistently.
Funds are to be reallocated within the Department of Defence to provide comprehensive health care to South African National Defence Force members, their dependents and military veterans. These funds will cover the increasing costs of essential medicine and medical supplies. Refurbishment of military hospitals will also limit outsourcing of these health services.
Over medium term, 772 650 households are to be connected to the grid
N2 Wild Coast road project to reduce travel time between Durban and East London
Funds shifted within Department of Defence for healthcare costs of defence force members
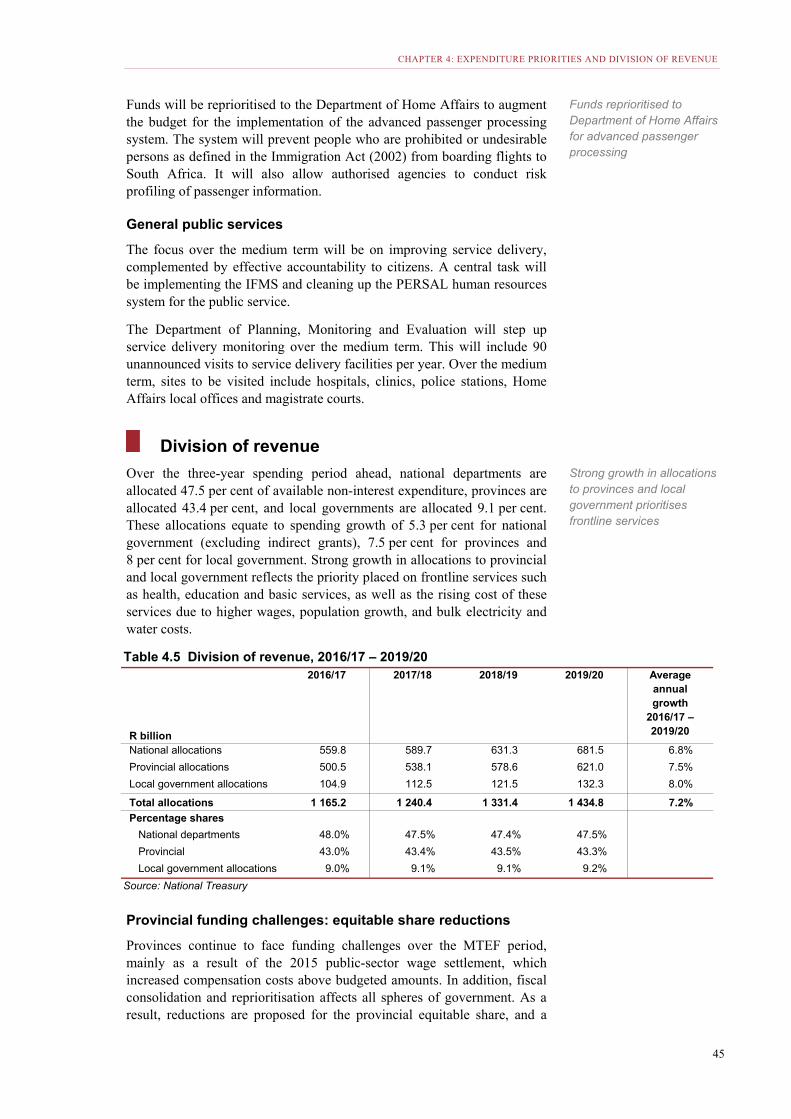
CHAPTER 4: EXPENDITURE PRIORITIES AND DIVISION OF REVENUE
45
Funds will be reprioritised to the Department of Home Affairs to augment the budget for the implementation of the advanced passenger processing system. The system will prevent people who are prohibited or undesirable persons as defined in the Immigration Act (2002) from boarding flights to South Africa. It will also allow authorised agencies to conduct risk profiling of passenger information.
General public services
The focus over the medium term will be on improving service delivery, complemented by effective accountability to citizens. A central task will be implementing the IFMS and cleaning up the PERSAL human resources system for the public service.
The Department of Planning, Monitoring and Evaluation will step up service delivery monitoring over the medium term. This will include 90 unannounced visits to service delivery facilities per year. Over the medium term, sites to be visited include hospitals, clinics, police stations, Home Affairs local offices and magistrate courts.
Division of revenue
Over the three-year spending period ahead, national departments are allocated 47.5 per cent of available non-interest expenditure, provinces are allocated 43.4 per cent, and local governments are allocated 9.1 per cent. These allocations equate to spending growth of 5.3 per cent for national government (excluding indirect grants), 7.5 per cent for provinces and 8 per cent for local government. Strong growth in allocations to provincial and local government reflects the priority placed on frontline services such as health, education and basic services, as well as the rising cost of these services due to higher wages, population growth, and bulk electricity and water costs.
Provincial funding challenges: equitable share reductions
Provinces continue to face funding challenges over the MTEF period, mainly as a result of the 2015 public-sector wage settlement, which increased compensation costs above budgeted amounts. In addition, fiscal consolidation and reprioritisation affects all spheres of government. As a result, reductions are proposed for the provincial equitable share, and a
Table 4.5 Division of revenue, 2016/17 – 2019/20
R billion
2016/17 2017/18 2018/19 2019/20 Average annual growth
2016/17 – 2019/20
National allocations 559.8 589.7 631.3 681.5 6.8%
Provincial allocations 500.5 538.1 578.6 621.0 7.5%
Local government allocations 104.9 112.5 121.5 132.3 8.0%
Total allocations 1 165.2 1 240.4 1 331.4 1 434.8 7.2%
Percentage shares
National departments 48.0% 47.5% 47.4% 47.5%
Provincial 43.0% 43.4% 43.5% 43.3%
Local government allocations 9.0% 9.1% 9.1% 9.2%
Source: National Treasury
Funds reprioritised to Department of Home Affairs for advanced passenger processing
Strong growth in allocations to provinces and local government prioritises frontline services
2016 MEDIUM TERM BUDGET POLICY STATEMENT
46
small number of provincial and municipal conditional grants. However, funds are added in the outer years of the MTEF period to compensate for rising costs in the services funded through the provincial and local government equitable shares.
The National Treasury, working with provincial treasuries, Statistics South Africa, Financial and Fiscal Commission and related national departments, has begun an in-depth review of the provincial equitable share formula. The first phase of this process is complete, and the review is expected to be completed in 2018.
Efficient municipal expenditure to support basic services
Newly elected municipal councils are responsible for drawing up integrated development plans that will guide their investments over the next five years. Given budgetary constraints, all municipalities need to focus on more efficient spending and value for money to improve basic service delivery. Rigorous financial management – including transparent procurement practices, effective billing and revenue collection, and timely payment of creditors – is a prerequisite for improving municipal performance. Measures to support municipalities and, where appropriate, enforce compliance, will be strengthened.
National government will also work with municipalities to plan their infrastructure investments in ways that promote economic growth and reverse apartheid spatial planning patterns. This requires coordinated action in the delivery of infrastructure, housing and public transport services to create denser, more inclusive and productive settlements. Initiatives to accelerate investment in fully subsidised and affordable housing, and to accelerate the integrated in-situ upgrading of informal settlements, will be introduced. These will complement work to prepare a pipeline of land development programmes in larger cities.
Measures to improve coordination of urban public transport systems will be introduced to complement ongoing investment in commuter rail and bus rapid transit systems. Government will also work with financially sound municipalities to expand their investment programmes on the strength of their own balance sheets. Programmes to this effect are under development in partnership with the private sector and development finance institutions.
Details of changes to transfers to provinces and local government over the MTEF period are contained in the technical annexure.
Conclusion
Downward revisions to revenue forecasts and new spending pressures have prompted revisions to spending plans, including reductions to operating budgets, and transfers to provinces and public entities. Headcounts have come down and future public-sector wage agreements, if balanced, could allow growth. Given the constrained fiscal environment, improving spending quality is a necessity.
Review of provincial equitable share formula to be completed in 2018
Coordinated action in infrastructure delivery key to promoting growth
47
Annexures
2016 MEDIUM TERM BUDGET POLICY STATEMENT
48
This page was left blank intentionally.
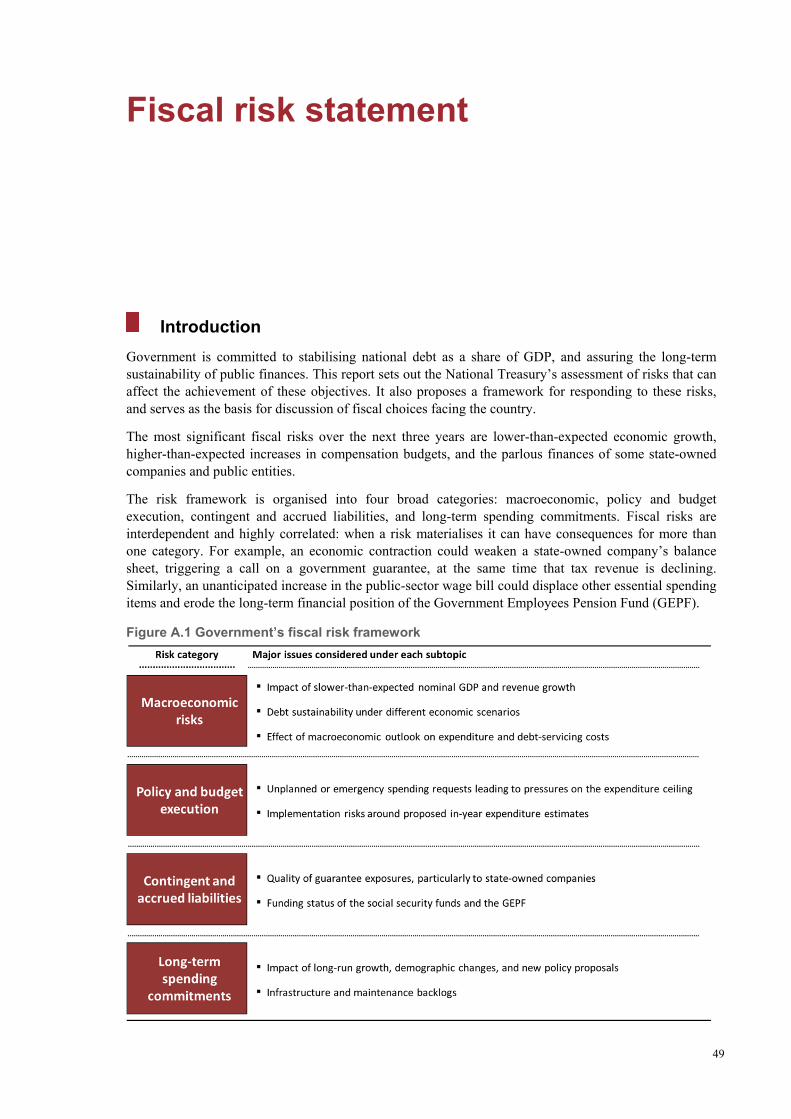
49
Fiscal risk statement
Introduction
Government is committed to stabilising national debt as a share of GDP, and assuring the long-term sustainability of public finances. This report sets out the National Treasury’s assessment of risks that can affect the achievement of these objectives. It also proposes a framework for responding to these risks, and serves as the basis for discussion of fiscal choices facing the country.
The most significant fiscal risks over the next three years are lower-than-expected economic growth, higher-than-expected increases in compensation budgets, and the parlous finances of some state-owned companies and public entities.
The risk framework is organised into four broad categories: macroeconomic, policy and budget execution, contingent and accrued liabilities, and long-term spending commitments. Fiscal risks are interdependent and highly correlated: when a risk materialises it can have consequences for more than one category. For example, an economic contraction could weaken a state-owned company’s balance sheet, triggering a call on a government guarantee, at the same time that tax revenue is declining. Similarly, an unanticipated increase in the public-sector wage bill could displace other essential spending items and erode the long-term financial position of the Government Employees Pension Fund (GEPF).
Figure A.1 Government’s fiscal risk framework
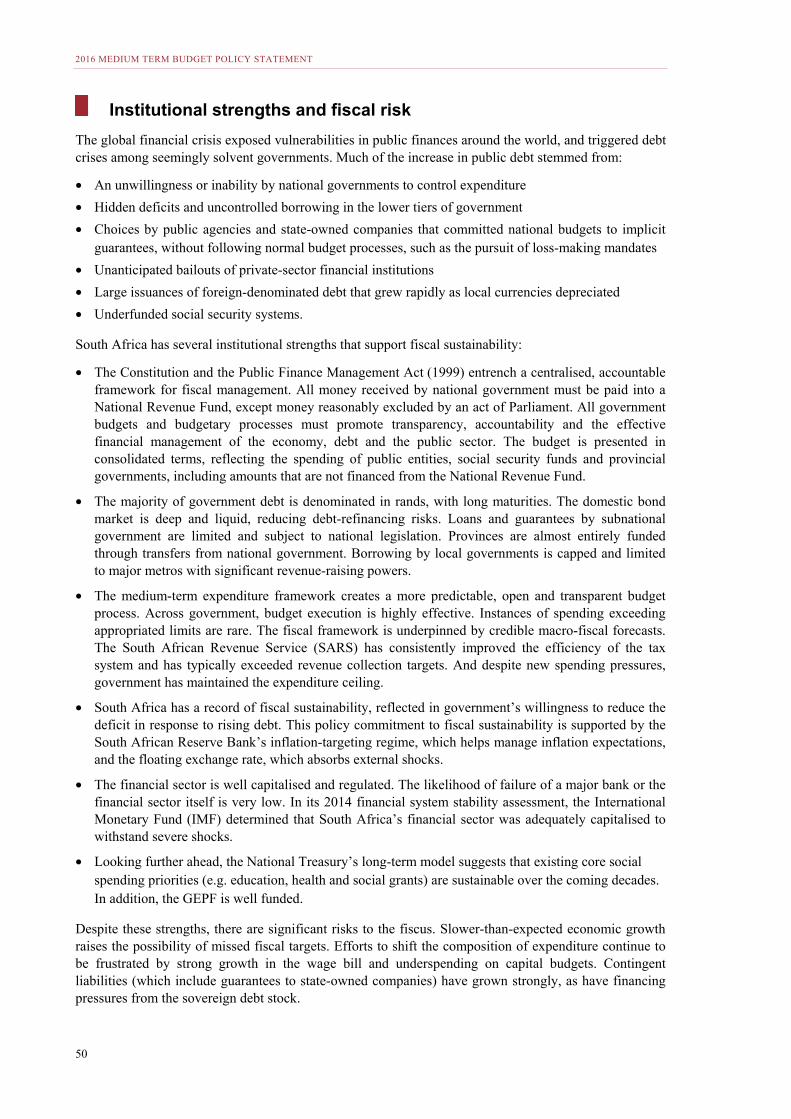
2016 MEDIUM TERM BUDGET POLICY STATEMENT
50
Institutional strengths and fiscal risk
The global financial crisis exposed vulnerabilities in public finances around the world, and triggered debt crises among seemingly solvent governments. Much of the increase in public debt stemmed from:
• An unwillingness or inability by national governments to control expenditure
• Hidden deficits and uncontrolled borrowing in the lower tiers of government
• Choices by public agencies and state-owned companies that committed national budgets to implicit guarantees, without following normal budget processes, such as the pursuit of loss-making mandates
• Unanticipated bailouts of private-sector financial institutions
• Large issuances of foreign-denominated debt that grew rapidly as local currencies depreciated
• Underfunded social security systems.
South Africa has several institutional strengths that support fiscal sustainability:
• The Constitution and the Public Finance Management Act (1999) entrench a centralised, accountable framework for fiscal management. All money received by national government must be paid into a National Revenue Fund, except money reasonably excluded by an act of Parliament. All government budgets and budgetary processes must promote transparency, accountability and the effective financial management of the economy, debt and the public sector. The budget is presented in consolidated terms, reflecting the spending of public entities, social security funds and provincial governments, including amounts that are not financed from the National Revenue Fund.
• The majority of government debt is denominated in rands, with long maturities. The domestic bond market is deep and liquid, reducing debt-refinancing risks. Loans and guarantees by subnational government are limited and subject to national legislation. Provinces are almost entirely funded through transfers from national government. Borrowing by local governments is capped and limited to major metros with significant revenue-raising powers.
• The medium-term expenditure framework creates a more predictable, open and transparent budget process. Across government, budget execution is highly effective. Instances of spending exceeding appropriated limits are rare. The fiscal framework is underpinned by credible macro-fiscal forecasts. The South African Revenue Service (SARS) has consistently improved the efficiency of the tax system and has typically exceeded revenue collection targets. And despite new spending pressures, government has maintained the expenditure ceiling.
• South Africa has a record of fiscal sustainability, reflected in government’s willingness to reduce the deficit in response to rising debt. This policy commitment to fiscal sustainability is supported by the South African Reserve Bank’s inflation-targeting regime, which helps manage inflation expectations, and the floating exchange rate, which absorbs external shocks.
• The financial sector is well capitalised and regulated. The likelihood of failure of a major bank or the financial sector itself is very low. In its 2014 financial system stability assessment, the International Monetary Fund (IMF) determined that South Africa’s financial sector was adequately capitalised to withstand severe shocks.
• Looking further ahead, the National Treasury’s long-term model suggests that existing core social spending priorities (e.g. education, health and social grants) are sustainable over the coming decades. In addition, the GEPF is well funded.
Despite these strengths, there are significant risks to the fiscus. Slower-than-expected economic growth raises the possibility of missed fiscal targets. Efforts to shift the composition of expenditure continue to be frustrated by strong growth in the wage bill and underspending on capital budgets. Contingent liabilities (which include guarantees to state-owned companies) have grown strongly, as have financing pressures from the sovereign debt stock.
FISCAL RISK STATEMENT
51
Macroeconomic risks
The main risk to fiscal consolidation in any country is slower-than-projected GDP growth. Consequently, inaccurate or biased economic forecasts undermine the fiscal outlook. A 2013 review by the Bureau for Economic Research at Stellenbosch University found that the National Treasury’s growth forecasts were on par with, or better than, those of private-sector economists, the IMF and the bureau’s own. The National Treasury’s GDP forecasts provide a credible basis for fiscal planning.
However, domestic growth forecasts have been revised downwards in each successive budget since 2011. Reasons for these revisions have included downward revisions of global projections by the IMF and lower-than-anticipated commodity prices. There have also been domestic shocks to growth such as electricity shortages, labour disruptions and drought. Downward revisions resulted in tax revenue collection underperforming against the forecasts. They have also made fiscal targets more difficult to achieve, because the targets are often expressed as a percentage of nominal GDP.
Figure A.2 Downward revisions to growth forecast
Source: National Treasury
Tax revenue projections are also affected by the relationship between each tax type and its base. Over the past four years, the aggregate tax-to-GDP buoyancy – the ratio of tax revenue growth to nominal GDP growth – has remained at about 1.2 or higher.
Figure A.3 Gross tax buoyancy
Source: National Treasury
-2
-1
0
1
2
3
4
5
6
2006
2007
2008
2009
2010
2011
2012
2013
2014
2015
2016
2017
2018
2019
Per c
ent
Budget 2010 Budget 2011 Budget 2012
Budget 2013 Budget 2014 Budget 2015
Budget 2016 MTBPS 2016 Outcome
-1.0
-0.5
0.0
0.5
1.0
1.5
2.0
2000/01
2001/02
2002/03
2003/04
2004/05
2005/06
2006/07
2007/08
2008/09
2009/10
2010/11
2011/12
2012/13
2013/14
2014/15
2015/16
Per c
ent
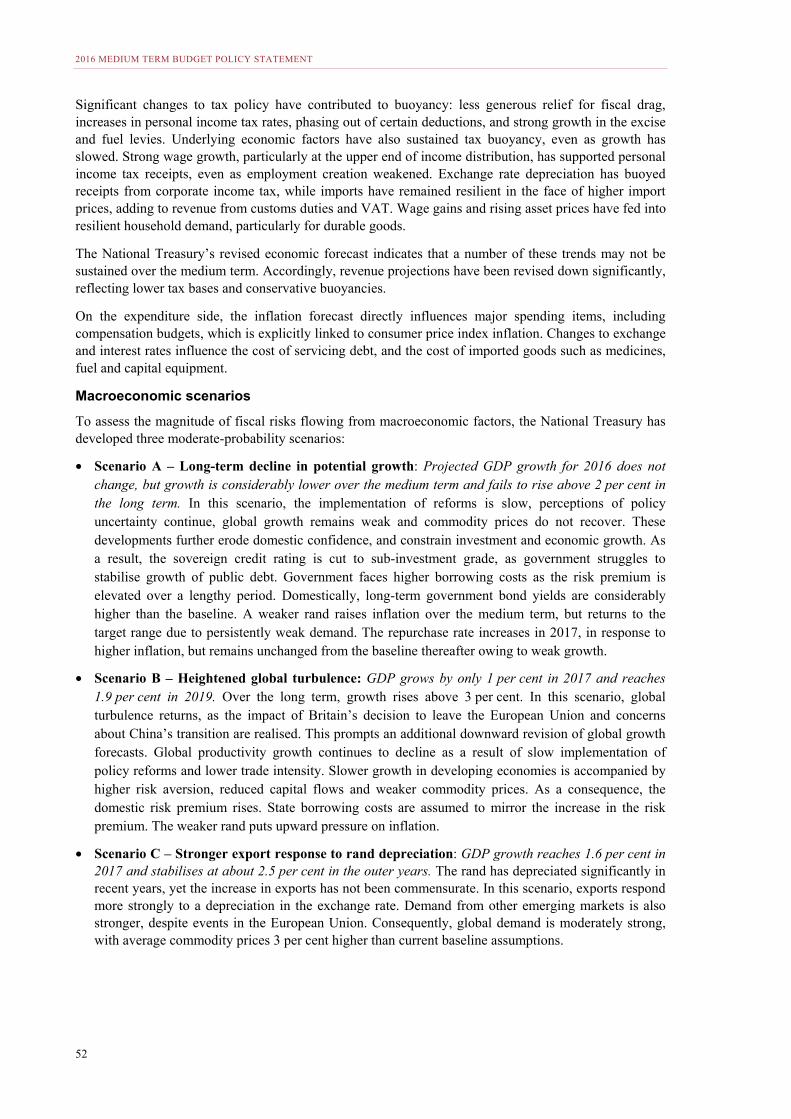
2016 MEDIUM TERM BUDGET POLICY STATEMENT
52
Significant changes to tax policy have contributed to buoyancy: less generous relief for fiscal drag, increases in personal income tax rates, phasing out of certain deductions, and strong growth in the excise and fuel levies. Underlying economic factors have also sustained tax buoyancy, even as growth has slowed. Strong wage growth, particularly at the upper end of income distribution, has supported personal income tax receipts, even as employment creation weakened. Exchange rate depreciation has buoyed receipts from corporate income tax, while imports have remained resilient in the face of higher import prices, adding to revenue from customs duties and VAT. Wage gains and rising asset prices have fed into resilient household demand, particularly for durable goods.
The National Treasury’s revised economic forecast indicates that a number of these trends may not be sustained over the medium term. Accordingly, revenue projections have been revised down significantly, reflecting lower tax bases and conservative buoyancies.
On the expenditure side, the inflation forecast directly influences major spending items, including compensation budgets, which is explicitly linked to consumer price index inflation. Changes to exchange and interest rates influence the cost of servicing debt, and the cost of imported goods such as medicines, fuel and capital equipment.
Macroeconomic scenarios
To assess the magnitude of fiscal risks flowing from macroeconomic factors, the National Treasury has developed three moderate-probability scenarios:
• Scenario A – Long-term decline in potential growth: Projected GDP growth for 2016 does not change, but growth is considerably lower over the medium term and fails to rise above 2 per cent in the long term. In this scenario, the implementation of reforms is slow, perceptions of policy uncertainty continue, global growth remains weak and commodity prices do not recover. These developments further erode domestic confidence, and constrain investment and economic growth. As a result, the sovereign credit rating is cut to sub-investment grade, as government struggles to stabilise growth of public debt. Government faces higher borrowing costs as the risk premium is elevated over a lengthy period. Domestically, long-term government bond yields are considerably higher than the baseline. A weaker rand raises inflation over the medium term, but returns to the target range due to persistently weak demand. The repurchase rate increases in 2017, in response to higher inflation, but remains unchanged from the baseline thereafter owing to weak growth.
• Scenario B – Heightened global turbulence: GDP grows by only 1 per cent in 2017 and reaches 1.9 per cent in 2019. Over the long term, growth rises above 3 per cent. In this scenario, global turbulence returns, as the impact of Britain’s decision to leave the European Union and concerns about China’s transition are realised. This prompts an additional downward revision of global growth forecasts. Global productivity growth continues to decline as a result of slow implementation of policy reforms and lower trade intensity. Slower growth in developing economies is accompanied by higher risk aversion, reduced capital flows and weaker commodity prices. As a consequence, the domestic risk premium rises. State borrowing costs are assumed to mirror the increase in the risk premium. The weaker rand puts upward pressure on inflation.
• Scenario C – Stronger export response to rand depreciation: GDP growth reaches 1.6 per cent in 2017 and stabilises at about 2.5 per cent in the outer years. The rand has depreciated significantly in recent years, yet the increase in exports has not been commensurate. In this scenario, exports respond more strongly to a depreciation in the exchange rate. Demand from other emerging markets is also stronger, despite events in the European Union. Consequently, global demand is moderately strong, with average commodity prices 3 per cent higher than current baseline assumptions.
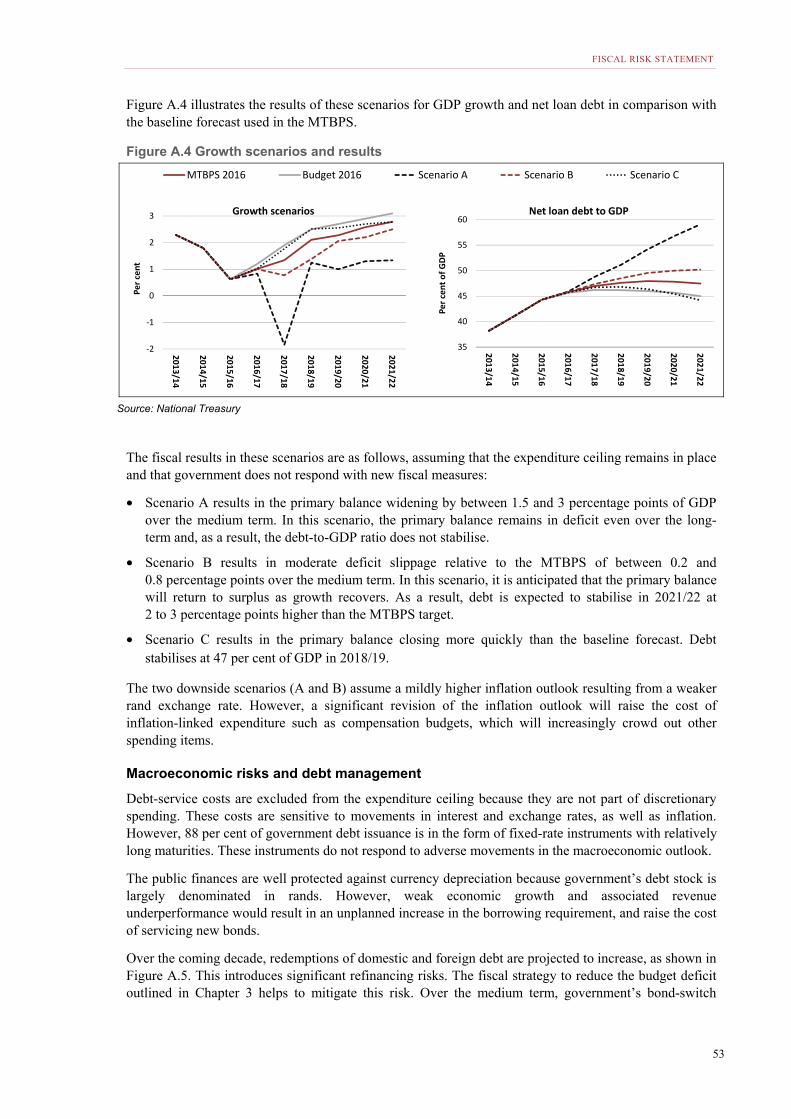
FISCAL RISK STATEMENT
53
Figure A.4 illustrates the results of these scenarios for GDP growth and net loan debt in comparison with the baseline forecast used in the MTBPS.
Figure A.4 Growth scenarios and results
Source: National Treasury
The fiscal results in these scenarios are as follows, assuming that the expenditure ceiling remains in place and that government does not respond with new fiscal measures:
• Scenario A results in the primary balance widening by between 1.5 and 3 percentage points of GDP over the medium term. In this scenario, the primary balance remains in deficit even over the long-term and, as a result, the debt-to-GDP ratio does not stabilise.
• Scenario B results in moderate deficit slippage relative to the MTBPS of between 0.2 and 0.8 percentage points over the medium term. In this scenario, it is anticipated that the primary balance will return to surplus as growth recovers. As a result, debt is expected to stabilise in 2021/22 at 2 to 3 percentage points higher than the MTBPS target.
• Scenario C results in the primary balance closing more quickly than the baseline forecast. Debt stabilises at 47 per cent of GDP in 2018/19.
The two downside scenarios (A and B) assume a mildly higher inflation outlook resulting from a weaker rand exchange rate. However, a significant revision of the inflation outlook will raise the cost of inflation-linked expenditure such as compensation budgets, which will increasingly crowd out other spending items.
Macroeconomic risks and debt management
Debt-service costs are excluded from the expenditure ceiling because they are not part of discretionary spending. These costs are sensitive to movements in interest and exchange rates, as well as inflation. However, 88 per cent of government debt issuance is in the form of fixed-rate instruments with relatively long maturities. These instruments do not respond to adverse movements in the macroeconomic outlook.
The public finances are well protected against currency depreciation because government’s debt stock is largely denominated in rands. However, weak economic growth and associated revenue underperformance would result in an unplanned increase in the borrowing requirement, and raise the cost of servicing new bonds.
Over the coming decade, redemptions of domestic and foreign debt are projected to increase, as shown in Figure A.5. This introduces significant refinancing risks. The fiscal strategy to reduce the budget deficit outlined in Chapter 3 helps to mitigate this risk. Over the medium term, government’s bond-switch
MTBPS 2016 Budget 2016 Scenario A Scenario B Scenario C
-2
-1
0
1
2
3
2013/14
2014/15
2015/16
2016/17
2017/18
2018/19
2019/20
2020/21
2021/22
Per c
ent
Growth scenarios
35
40
45
50
55
60
2013/14
2014/15
2015/16
2016/17
2017/18
2018/19
2019/20
2020/21
2021/22
Per c
ent o
f GDP
Net loan debt to GDP
2016 MEDIUM TERM BUDGET POLICY STATEMENT
54
programme – which exchanges short-term for longer-term debt – and increasing cash balances will further mitigate this risk.
Figure A.5 Maturity profile of government debt, 30 September 2016
Source: National Treasury
The structure of South Africa’s sovereign debt stock is sustainable and comfortably within global best-practice benchmarks. International investors hold about 35 per cent of total outstanding debt securities (including domestic issuances), indicating a moderate susceptibility to capital flight. Nonetheless, the depth of the domestic market reduces the likelihood of a liquidity crisis. The short-term rollover risk emanating from the Treasury bill portfolio is monitored through a benchmark limit of 15 per cent of domestic debt. Currently, Treasury bills are below this limit. More detail on sovereign debt is provided in the 2015/16 debt management report, available on the National Treasury website.
Policy and budget execution risks
Policy risks include unplanned or emergency spending requests that could breach the expenditure ceiling. Budget execution risks emerge when departments or entities do not achieve spending targets. At the aggregate level, budget execution has been good. Spending outcomes averaged 0.2 per cent over the initial estimate since the introduction of the non-interest expenditure ceiling. There are, however, budget execution risks associated with the 2016 MTBPS proposals. These include:
• Wage bill pressures – Between 2009/10 and 2012/13, strong growth in the public-sector wage bill increased compensation as a share of national and provincial non-interest spending. Salaries in health, education and policing are growing at more than 2 per cent in real terms – well above total spending growth. The current three-year wage agreement comes to an end in 2017/18, and there is potential for the assumptions about wage-bill growth to change once a new agreement is reached.
• Infrastructure underspending – National government spending on infrastructure was 5 per cent below published infrastructure budgets in 2015/16. The pattern was more pronounced in local government and state-owned companies, which spent 81 and 93 per cent of their infrastructure budgets respectively. Underspending strains existing infrastructure, accelerates wear and tear, and limits service-delivery capacity.
• Exchange rate pressures – The depreciation of the rand places pressure on departments that procure goods and services in foreign currency. If not well managed, this risk may shift the composition of spending further towards goods and services. If one of the downside scenarios considered in this statement materialises, sharper rand depreciation may place even greater pressure on budgets.
0
20
40
60
80
100
120
2016/17
2018/19
2020/21
2022/23
2024/25
2026/27
2028/29
2030/31
R bi
llion
Domestic bonds Foreign bonds
FISCAL RISK STATEMENT
55
Over the medium term, policy risks are mainly associated with unanticipated spending requests. In higher education, for example, the MTBPS projects additional funding of the post-school education and training sector. Further spending demands, similar to those that have arisen in the last two budget cycles, will place additional pressure on spending limits.
These risks, if they materialise, are more likely to change the composition of spending than threaten the expenditure ceiling. Departments typically respond to wage bill pressures by moving funds from non-core goods and services, and from capital budgets to compensation. While government will maintain its expenditure targets, a higher wage bill may crowd out resources available for complementary inputs, eroding the quality of service delivery. Similarly, a zero per cent university fee increase in 2018 would likely result in a shift of resources from other priorities towards higher education.
Contingent and accrued liability risks
Government’s major explicit contingent liabilities are its guarantees, which stood at R469.9 billion at the end of 2015/16. Total guarantee exposure was R263 billion at the end of 2015/16, because several entities had not fully used their available guarantee facilities. The largest guarantee exposure – more than R170 billion – supports Eskom’s capital investment programme. An exposure of R200 billion relates to the IPPs. Eskom is obliged to purchase power from these independent producers over a 20-year period based on a power-purchase agreement approved by the National Energy Regulator of South Africa. Should Eskom be unable to do this, government must purchase the power on Eskom’s behalf.
The most recent recapitalisation – combined with governance reforms and operational recovery – has improved Eskom’s liquidity and profitability. The risk of default with the IPP guarantee is low as the regulator fully provides for IPP costs in the Eskom tariff determinations. These factors mitigate the risk arising from these guarantees. However, a deterioration in Eskom’s financial position would increase the risk of both exposures.
Other key contingent liability risks are as follows:
• Passenger Rail Agency of South Africa – The fiscus has committed R53 billion to fund PRASA’s purchase of new rolling stock and signalling equipment. The Auditor General and the Public Protector have found weak expenditure controls and contract management in this programme. This raises concern that PRASA will not be able to complete the programme on time and within budget. In addition, projected declines in PRASA’s fare revenue and ridership numbers raise concerns about the company’s sustainability.
• South African National Roads Agency Limited – Fiscal exposure to SANRAL debt stood at R35 billion as at 31 March 2016. The guarantee was put in place to support the expansion of the agency’s toll roads portfolio. The new tolling dispensation has been implemented for phase 1 of the Gauteng Freeway Improvement Project. A 60 per cent discount was offered to road users between November 2015 and May 2016 on the settlement of the outstanding amounts. E-toll collections and auctions are still closely monitored against projected collection levels to ensure recovery. Over the medium term, national government and the Gauteng provincial government will supplement e-toll revenue. More generally, if government does not proceed with tolling to fund major freeways, difficult trade-offs will need to be confronted to avoid a deterioration in the national road network.
• South African Airways – Government has issued a R19.1 billion guarantee facility to SAA to ensure the company can continue to operate as a going concern. The carrier continues to post losses. There is currently a R14.3 billion exposure against the facility. Without the guarantees, SAA is technically insolvent. A new, full-strength board has been appointed and tasked with returning the airline to financial sustainability. The board has also been tasked with quickly filling vacant executive management positions.
2016 MEDIUM TERM BUDGET POLICY STATEMENT
56
• South African Post Office – Currently, government has a R4.4 billion guarantee exposure to the South African Post Office. A new board and CEO were appointed, and the company has been able to raise funding to repay creditors, implement a turnaround plan and reach a settlement with labour to mitigate the possibility of strike action.
• Land Bank – Government provided the Land Bank with a R6.6 billion guarantee in 2014/15, of which R5.3 billion has been drawn down as at 31 March 2016. The guarantee has helped the bank expand its lending by 10 per cent in 2015/16, despite a weak operating environment, and chart a path to stabilisation. The relatively short maturities of the bank’s funding liabilities are gradually becoming longer, relieving pressure on the institution’s cash flows, but they do still pose moderate risk to the fiscus. The bank is conducting an internal review to improve operational efficiency and developmental effectiveness. Lenders have highlighted the bank’s strong governance and relationship with the shareholder as reasons to continue supporting its funding programme.
• The Road Accident Fund – RAF liabilities at the end of March 2016 were revised up to R155 billion
from the R132 billion reported in the 2016 Budget. These liabilities are projected to grow to R345 billion in 2019/20. The RAF has been insolvent for over 30 years, despite having a dedicated revenue stream in place to settle claims. Government has not yet tabled legislation to create a new equitable and affordable benefit arrangement to replace the fund. Various options exist to reduce the RAF contingent liability, including increases in the RAF fuel levy. The new replacement scheme will be structured to ensure sustainability.
Government maintains its policy stance that any intervention to support state-owned companies must be deficit neutral. Entities receiving support from government will be required to provide sound business plans, improve governance and address operational inefficiencies.
Long-term fiscal risks
The National Treasury regularly updates its long-term fiscal model to determine the sustainability of its major social spending commitments. In general, the current commitments appear sustainable over the long term. However, the sustainability of existing programmes is heavily influenced by changes to demographic and GDP growth estimates.
Changes to the level and age structure of the population have significant implications for the costs of social programmes such as social grants. Population estimates have changed significantly over the past few years. The National Development Plan (NDP) made use of the model released by the Actuarial Society of South Africa in 2011, calculating a base population of 50.6 million for 2012. The 2011 Census estimated the 2012 population at 51.8 million. The NDP projected the population would be between 58.2 million and 61.5 million by 2030. However, the latest actuarial projections put the population at 65 million in 2030. In general, a larger and older population will place greater pressure on social spending.
Lower long-term GDP growth would make the financing of large-scale new policy proposals more difficult. The current level of spending is sustainable if economic growth returns to its historic average of 3 per cent. However, if growth remains stuck below 2 per cent over the long term, a stable debt path will be difficult to sustain at the current levels of expenditure, even if no new policy initiatives are taken.
Ensuring fiscal sustainability while implementing new initiatives currently on government’s agenda would require a significant acceleration of economic growth to boost tax revenue; policy measures to increase the structural levels of taxation, with rates raised across all major tax types; and/or shifting resources from other priorities.
Another long-term risk stems from municipal finances. Insufficient spending on infrastructure and maintenance raises the long-term cost of replacement infrastructure or maintenance, and shortens the
FISCAL RISK STATEMENT
57
useful life of capital assets. Furthermore, weak municipal financial management creates risks for the broader public sector because municipalities do not settle their financial obligations on time. A decline in municipal own-revenue sources would increase their dependence on fiscal transfers, with deleterious consequences for service delivery. To mitigate this risk, government has made changes to the municipal infrastructure grant to prioritise maintenance and strengthen infrastructure planning. Changes have been made to the municipal systems improvement grant to enhance operational efficiency. And government has initiated a review of the municipal pensions system.
Conclusion
The outlook for the period ahead suggests that fiscal risk is elevated, primarily because the potential for weaker-than-expected economic performance threatens the revenue forecast. The outlook for contingent liabilities is also a source of vulnerability. The macroeconomic and fiscal policies outlined in Chapters 2 and 3 are, in part, designed to reduce these risks, and ensure that government’s fiscal targets are achieved.
2016 MEDIUM TERM BUDGET POLICY STATEMENT
58
This page was left blank intentionally.
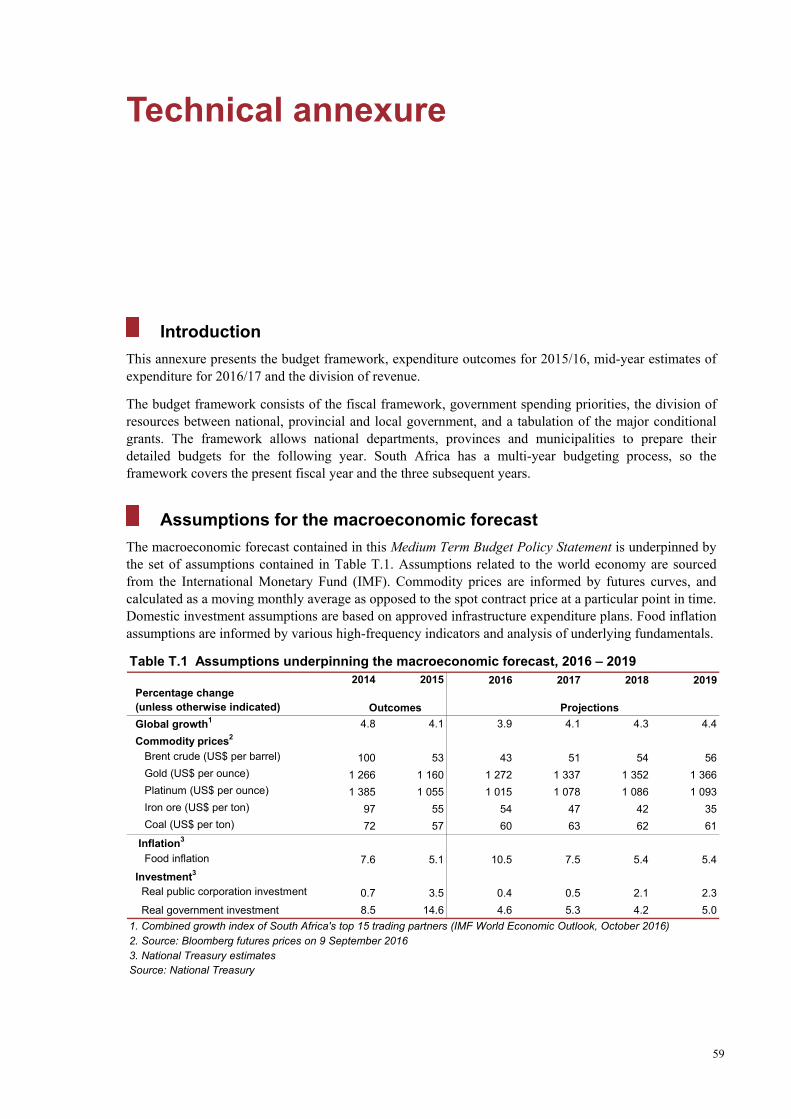
59
Technical annexure
Introduction
This annexure presents the budget framework, expenditure outcomes for 2015/16, mid-year estimates of expenditure for 2016/17 and the division of revenue.
The budget framework consists of the fiscal framework, government spending priorities, the division of resources between national, provincial and local government, and a tabulation of the major conditional grants. The framework allows national departments, provinces and municipalities to prepare their detailed budgets for the following year. South Africa has a multi-year budgeting process, so the framework covers the present fiscal year and the three subsequent years.
Assumptions for the macroeconomic forecast
The macroeconomic forecast contained in this Medium Term Budget Policy Statement is underpinned by the set of assumptions contained in Table T.1. Assumptions related to the world economy are sourced from the International Monetary Fund (IMF). Commodity prices are informed by futures curves, and calculated as a moving monthly average as opposed to the spot contract price at a particular point in time. Domestic investment assumptions are based on approved infrastructure expenditure plans. Food inflation assumptions are informed by various high-frequency indicators and analysis of underlying fundamentals.
Table T.1 Assumptions underpinning the macroeconomic forecast, 2016 – 20192014 2015 2016 2017 2018 2019
Percentage change(unless otherwise indicated) Projections
Global growth1 4.8 4.1 3.9 4.1 4.3 4.4
Commodity prices2
Brent crude (US$ per barrel) 100 53 43 51 54 56
Gold (US$ per ounce) 1 266 1 160 1 272 1 337 1 352 1 366
Platinum (US$ per ounce) 1 385 1 055 1 015 1 078 1 086 1 093
Iron ore (US$ per ton) 97 55 54 47 42 35
Coal (US$ per ton) 72 57 60 63 62 61
Inflation3
Food inflation 7.6 5.1 10.5 7.5 5.4 5.4
Investment3
Real public corporation investment 0.7 3.5 0.4 0.5 2.1 2.3
Real government investment 8.5 14.6 4.6 5.3 4.2 5.0
1. Combined growth index of South Africa's top 15 trading partners (IMF World Economic Outlook, October 2016)2. Source: Bloomberg futures prices on 9 September 20163. National Treasury estimatesSource: National Treasury
Outcomes
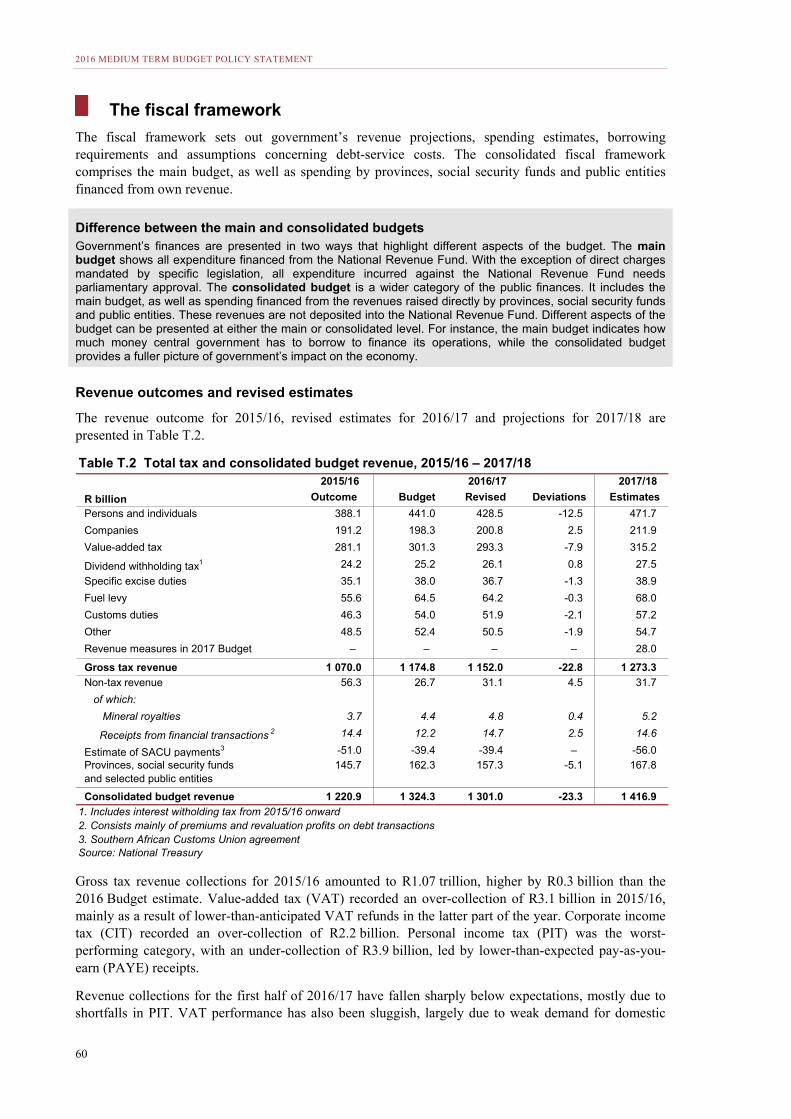
2016 MEDIUM TERM BUDGET POLICY STATEMENT
60
The fiscal framework
The fiscal framework sets out government’s revenue projections, spending estimates, borrowing requirements and assumptions concerning debt-service costs. The consolidated fiscal framework comprises the main budget, as well as spending by provinces, social security funds and public entities financed from own revenue.
Revenue outcomes and revised estimates
The revenue outcome for 2015/16, revised estimates for 2016/17 and projections for 2017/18 are presented in Table T.2.
Gross tax revenue collections for 2015/16 amounted to R1.07 trillion, higher by R0.3 billion than the 2016 Budget estimate. Value-added tax (VAT) recorded an over-collection of R3.1 billion in 2015/16, mainly as a result of lower-than-anticipated VAT refunds in the latter part of the year. Corporate income tax (CIT) recorded an over-collection of R2.2 billion. Personal income tax (PIT) was the worst-performing category, with an under-collection of R3.9 billion, led by lower-than-expected pay-as-you-earn (PAYE) receipts.
Revenue collections for the first half of 2016/17 have fallen sharply below expectations, mostly due to shortfalls in PIT. VAT performance has also been sluggish, largely due to weak demand for domestic
Table T.2 Total tax and consolidated budget revenue, 2015/16 – 2017/18 2015/16 2016/17 2017/18
R billion Outcome Budget Revised Deviations Estimates
Persons and individuals 388.1 441.0 428.5 -12.5 471.7
Companies 191.2 198.3 200.8 2.5 211.9
Value-added tax 281.1 301.3 293.3 -7.9 315.2
Dividend withholding tax1 24.2 25.2 26.1 0.8 27.5
Specific excise duties 35.1 38.0 36.7 -1.3 38.9
Fuel levy 55.6 64.5 64.2 -0.3 68.0
Customs duties 46.3 54.0 51.9 -2.1 57.2
Other 48.5 52.4 50.5 -1.9 54.7
Revenue measures in 2017 Budget – – – – 28.0
Gross tax revenue 1 070.0 1 174.8 1 152.0 -22.8 1 273.3
Non-tax revenue 56.3 26.7 31.1 4.5 31.7
of which:
Mineral royalties 3.7 4.4 4.8 0.4 5.2
Receipts from financial transactions 2 14.4 12.2 14.7 2.5 14.6
Estimate of SACU payments3 -51.0 -39.4 -39.4 – -56.0Provinces, social security fundsand selected public entities
145.7 162.3 157.3 -5.1 167.8
Consolidated budget revenue 1 220.9 1 324.3 1 301.0 -23.3 1 416.9
1. Includes interest witholding tax from 2015/16 onward2. Consists mainly of premiums and revaluation profits on debt transactions3. Southern African Customs Union agreementSource: National Treasury
Difference between the main and consolidated budgets Government’s finances are presented in two ways that highlight different aspects of the budget. The main budget shows all expenditure financed from the National Revenue Fund. With the exception of direct charges mandated by specific legislation, all expenditure incurred against the National Revenue Fund needs parliamentary approval. The consolidated budget is a wider category of the public finances. It includes the main budget, as well as spending financed from the revenues raised directly by provinces, social security funds and public entities. These revenues are not deposited into the National Revenue Fund. Different aspects of the budget can be presented at either the main or consolidated level. For instance, the main budget indicates how much money central government has to borrow to finance its operations, while the consolidated budget provides a fuller picture of government’s impact on the economy.
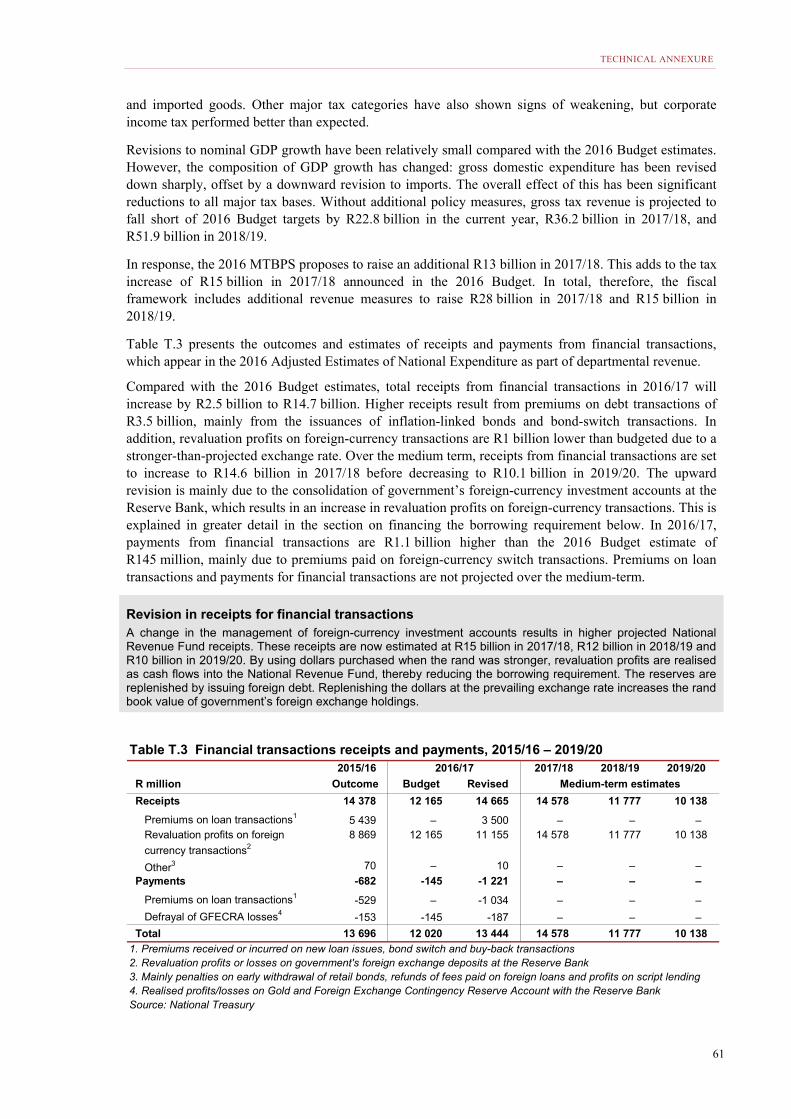
TECHNICAL ANNEXURE
61
and imported goods. Other major tax categories have also shown signs of weakening, but corporate income tax performed better than expected.
Revisions to nominal GDP growth have been relatively small compared with the 2016 Budget estimates. However, the composition of GDP growth has changed: gross domestic expenditure has been revised down sharply, offset by a downward revision to imports. The overall effect of this has been significant reductions to all major tax bases. Without additional policy measures, gross tax revenue is projected to fall short of 2016 Budget targets by R22.8 billion in the current year, R36.2 billion in 2017/18, and R51.9 billion in 2018/19.
In response, the 2016 MTBPS proposes to raise an additional R13 billion in 2017/18. This adds to the tax increase of R15 billion in 2017/18 announced in the 2016 Budget. In total, therefore, the fiscal framework includes additional revenue measures to raise R28 billion in 2017/18 and R15 billion in 2018/19.
Table T.3 presents the outcomes and estimates of receipts and payments from financial transactions, which appear in the 2016 Adjusted Estimates of National Expenditure as part of departmental revenue.
Compared with the 2016 Budget estimates, total receipts from financial transactions in 2016/17 will increase by R2.5 billion to R14.7 billion. Higher receipts result from premiums on debt transactions of R3.5 billion, mainly from the issuances of inflation-linked bonds and bond-switch transactions. In addition, revaluation profits on foreign-currency transactions are R1 billion lower than budgeted due to a stronger-than-projected exchange rate. Over the medium term, receipts from financial transactions are set to increase to R14.6 billion in 2017/18 before decreasing to R10.1 billion in 2019/20. The upward revision is mainly due to the consolidation of government’s foreign-currency investment accounts at the Reserve Bank, which results in an increase in revaluation profits on foreign-currency transactions. This is explained in greater detail in the section on financing the borrowing requirement below. In 2016/17, payments from financial transactions are R1.1 billion higher than the 2016 Budget estimate of R145 million, mainly due to premiums paid on foreign-currency switch transactions. Premiums on loan transactions and payments for financial transactions are not projected over the medium-term.
Revision in receipts for financial transactions A change in the management of foreign-currency investment accounts results in higher projected National Revenue Fund receipts. These receipts are now estimated at R15 billion in 2017/18, R12 billion in 2018/19 and R10 billion in 2019/20. By using dollars purchased when the rand was stronger, revaluation profits are realised as cash flows into the National Revenue Fund, thereby reducing the borrowing requirement. The reserves are replenished by issuing foreign debt. Replenishing the dollars at the prevailing exchange rate increases the rand book value of government’s foreign exchange holdings.
Table T.3 Financial transactions receipts and payments, 2015/16 – 2019/20 2015/16 2016/17 2017/18 2018/19 2019/20
R million Outcome Budget Revised
Receipts 14 378 12 165 14 665 14 578 11 777 10 138
Premiums on loan transactions1 5 439 – 3 500 – – – Revaluation profits on foreign
currency transactions2
8 869 12 165 11 155 14 578 11 777 10 138
Other3 70 – 10 – – –
Payments -682 -145 -1 221 – – –
Premiums on loan transactions1 -529 – -1 034 – – –
Defrayal of GFECRA losses4 -153 -145 -187 – – –
Total 13 696 12 020 13 444 14 578 11 777 10 138
1. Premiums received or incurred on new loan issues, bond switch and buy-back transactions2. Revaluation profits or losses on government's foreign exchange deposits at the Reserve Bank 3. Mainly penalties on early withdrawal of retail bonds, refunds of fees paid on foreign loans and profits on script lending4. Realised profits/losses on Gold and Foreign Exchange Contingency Reserve Account with the Reserve BankSource: National Treasury
Medium-term estimates
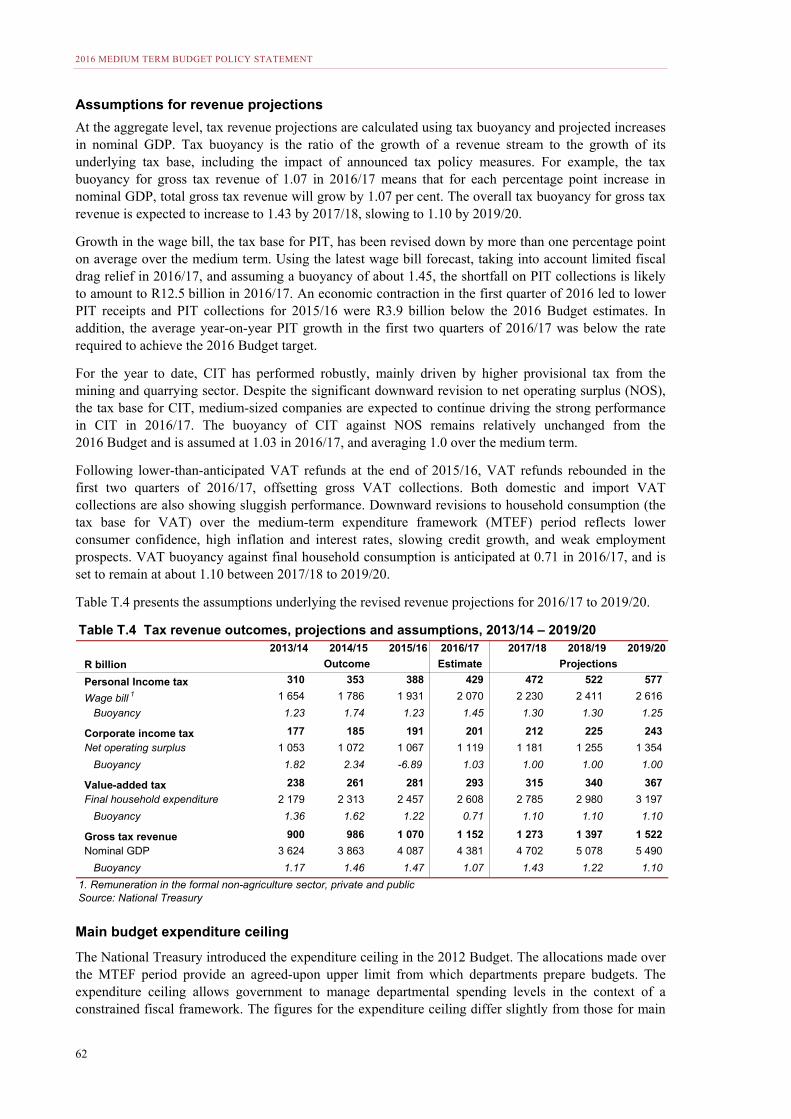
2016 MEDIUM TERM BUDGET POLICY STATEMENT
62
Assumptions for revenue projections
At the aggregate level, tax revenue projections are calculated using tax buoyancy and projected increases in nominal GDP. Tax buoyancy is the ratio of the growth of a revenue stream to the growth of its underlying tax base, including the impact of announced tax policy measures. For example, the tax buoyancy for gross tax revenue of 1.07 in 2016/17 means that for each percentage point increase in nominal GDP, total gross tax revenue will grow by 1.07 per cent. The overall tax buoyancy for gross tax revenue is expected to increase to 1.43 by 2017/18, slowing to 1.10 by 2019/20.
Growth in the wage bill, the tax base for PIT, has been revised down by more than one percentage point on average over the medium term. Using the latest wage bill forecast, taking into account limited fiscal drag relief in 2016/17, and assuming a buoyancy of about 1.45, the shortfall on PIT collections is likely to amount to R12.5 billion in 2016/17. An economic contraction in the first quarter of 2016 led to lower PIT receipts and PIT collections for 2015/16 were R3.9 billion below the 2016 Budget estimates. In addition, the average year-on-year PIT growth in the first two quarters of 2016/17 was below the rate required to achieve the 2016 Budget target.
For the year to date, CIT has performed robustly, mainly driven by higher provisional tax from the mining and quarrying sector. Despite the significant downward revision to net operating surplus (NOS), the tax base for CIT, medium-sized companies are expected to continue driving the strong performance in CIT in 2016/17. The buoyancy of CIT against NOS remains relatively unchanged from the 2016 Budget and is assumed at 1.03 in 2016/17, and averaging 1.0 over the medium term.
Following lower-than-anticipated VAT refunds at the end of 2015/16, VAT refunds rebounded in the first two quarters of 2016/17, offsetting gross VAT collections. Both domestic and import VAT collections are also showing sluggish performance. Downward revisions to household consumption (the tax base for VAT) over the medium-term expenditure framework (MTEF) period reflects lower consumer confidence, high inflation and interest rates, slowing credit growth, and weak employment prospects. VAT buoyancy against final household consumption is anticipated at 0.71 in 2016/17, and is set to remain at about 1.10 between 2017/18 to 2019/20.
Table T.4 presents the assumptions underlying the revised revenue projections for 2016/17 to 2019/20.
Main budget expenditure ceiling
The National Treasury introduced the expenditure ceiling in the 2012 Budget. The allocations made over the MTEF period provide an agreed-upon upper limit from which departments prepare budgets. The expenditure ceiling allows government to manage departmental spending levels in the context of a constrained fiscal framework. The figures for the expenditure ceiling differ slightly from those for main
Table T.4 Tax revenue outcomes, projections and assumptions, 2013/14 – 2019/202013/14 2014/15 2015/16 2016/17 2017/18 2018/19 2019/20
R billion Estimate Projections
Personal Income tax 310 353 388 429 472 522 577
Wage bill 1 1 654 1 786 1 931 2 070 2 230 2 411 2 616
Buoyancy 1.23 1.74 1.23 1.45 1.30 1.30 1.25
Corporate income tax 177 185 191 201 212 225 243
Net operating surplus 1 053 1 072 1 067 1 119 1 181 1 255 1 354
Buoyancy 1.82 2.34 -6.89 1.03 1.00 1.00 1.00
Value-added tax 238 261 281 293 315 340 367
Final household expenditure 2 179 2 313 2 457 2 608 2 785 2 980 3 197
Buoyancy 1.36 1.62 1.22 0.71 1.10 1.10 1.10
Gross tax revenue 900 986 1 070 1 152 1 273 1 397 1 522
Nominal GDP 3 624 3 863 4 087 4 381 4 702 5 078 5 490
Buoyancy 1.17 1.46 1.47 1.07 1.43 1.22 1.10
1. Remuneration in the formal non-agriculture sector, private and publicSource: National Treasury
Outcome
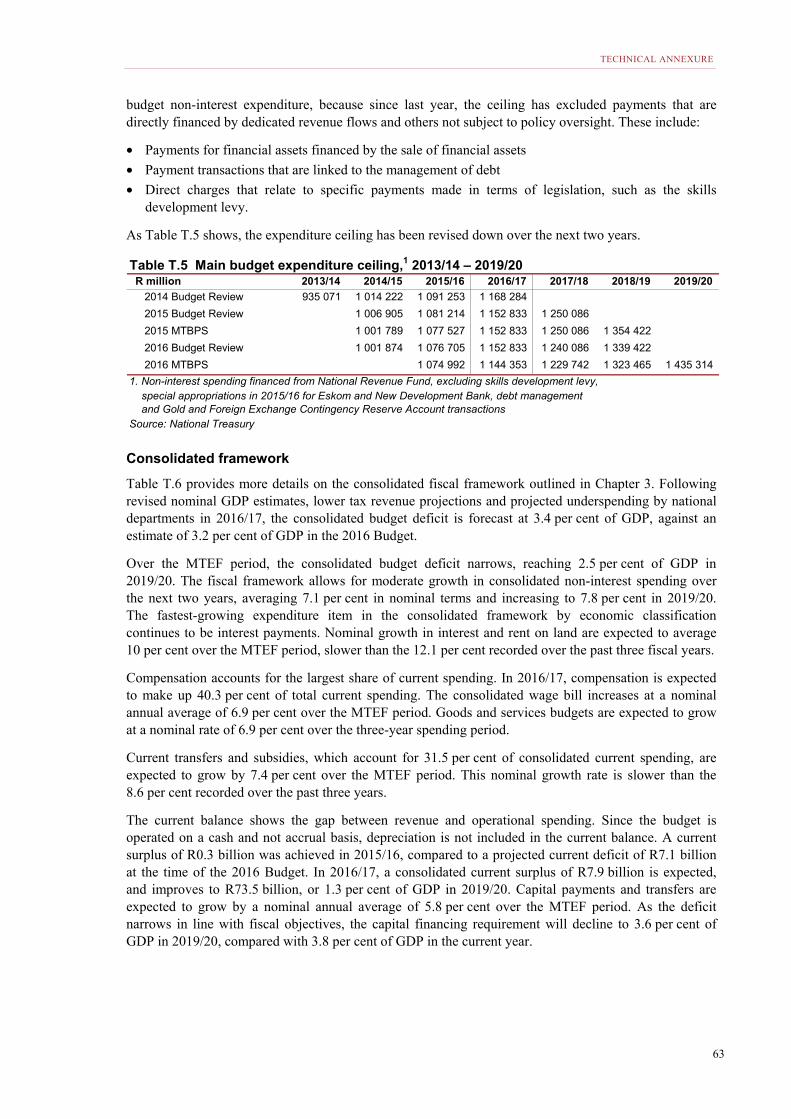
TECHNICAL ANNEXURE
63
budget non-interest expenditure, because since last year, the ceiling has excluded payments that are directly financed by dedicated revenue flows and others not subject to policy oversight. These include:
• Payments for financial assets financed by the sale of financial assets
• Payment transactions that are linked to the management of debt
• Direct charges that relate to specific payments made in terms of legislation, such as the skills development levy.
As Table T.5 shows, the expenditure ceiling has been revised down over the next two years.
Consolidated framework
Table T.6 provides more details on the consolidated fiscal framework outlined in Chapter 3. Following revised nominal GDP estimates, lower tax revenue projections and projected underspending by national departments in 2016/17, the consolidated budget deficit is forecast at 3.4 per cent of GDP, against an estimate of 3.2 per cent of GDP in the 2016 Budget.
Over the MTEF period, the consolidated budget deficit narrows, reaching 2.5 per cent of GDP in 2019/20. The fiscal framework allows for moderate growth in consolidated non-interest spending over the next two years, averaging 7.1 per cent in nominal terms and increasing to 7.8 per cent in 2019/20. The fastest-growing expenditure item in the consolidated framework by economic classification continues to be interest payments. Nominal growth in interest and rent on land are expected to average 10 per cent over the MTEF period, slower than the 12.1 per cent recorded over the past three fiscal years.
Compensation accounts for the largest share of current spending. In 2016/17, compensation is expected to make up 40.3 per cent of total current spending. The consolidated wage bill increases at a nominal annual average of 6.9 per cent over the MTEF period. Goods and services budgets are expected to grow at a nominal rate of 6.9 per cent over the three-year spending period.
Current transfers and subsidies, which account for 31.5 per cent of consolidated current spending, are expected to grow by 7.4 per cent over the MTEF period. This nominal growth rate is slower than the 8.6 per cent recorded over the past three years.
The current balance shows the gap between revenue and operational spending. Since the budget is operated on a cash and not accrual basis, depreciation is not included in the current balance. A current surplus of R0.3 billion was achieved in 2015/16, compared to a projected current deficit of R7.1 billion at the time of the 2016 Budget. In 2016/17, a consolidated current surplus of R7.9 billion is expected, and improves to R73.5 billion, or 1.3 per cent of GDP in 2019/20. Capital payments and transfers are expected to grow by a nominal annual average of 5.8 per cent over the MTEF period. As the deficit narrows in line with fiscal objectives, the capital financing requirement will decline to 3.6 per cent of GDP in 2019/20, compared with 3.8 per cent of GDP in the current year.
R million 2013/14 2014/15 2015/16 2016/17 2017/18 2018/19 2019/20
2014 Budget Review 935 071 1 014 222 1 091 253 1 168 284
2015 Budget Review 1 006 905 1 081 214 1 152 833 1 250 086
2015 MTBPS 1 001 789 1 077 527 1 152 833 1 250 086 1 354 422
2016 Budget Review 1 001 874 1 076 705 1 152 833 1 240 086 1 339 422
2016 MTBPS 1 074 992 1 144 353 1 229 742 1 323 465 1 435 314
1. Non-interest spending financed from National Revenue Fund, excluding skills development levy, special appropriations in 2015/16 for Eskom and New Development Bank, debt management and Gold and Foreign Exchange Contingency Reserve Account transactionsSource: National Treasury
Table T.5 Main budget expenditure ceiling,1 2013/14 – 2019/20
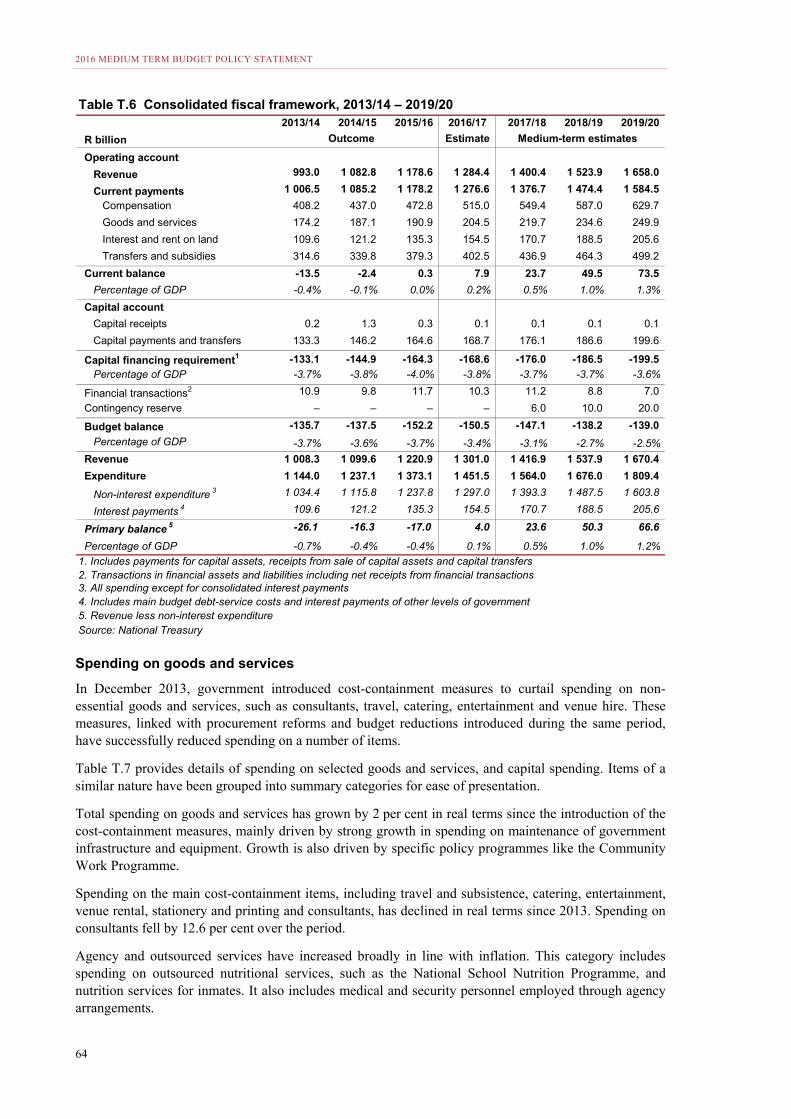
2016 MEDIUM TERM BUDGET POLICY STATEMENT
64
Spending on goods and services
In December 2013, government introduced cost-containment measures to curtail spending on non-essential goods and services, such as consultants, travel, catering, entertainment and venue hire. These measures, linked with procurement reforms and budget reductions introduced during the same period, have successfully reduced spending on a number of items.
Table T.7 provides details of spending on selected goods and services, and capital spending. Items of a similar nature have been grouped into summary categories for ease of presentation.
Total spending on goods and services has grown by 2 per cent in real terms since the introduction of the cost-containment measures, mainly driven by strong growth in spending on maintenance of government infrastructure and equipment. Growth is also driven by specific policy programmes like the Community Work Programme.
Spending on the main cost-containment items, including travel and subsistence, catering, entertainment, venue rental, stationery and printing and consultants, has declined in real terms since 2013. Spending on consultants fell by 12.6 per cent over the period.
Agency and outsourced services have increased broadly in line with inflation. This category includes spending on outsourced nutritional services, such as the National School Nutrition Programme, and nutrition services for inmates. It also includes medical and security personnel employed through agency arrangements.
2013/14 2014/15 2015/16 2016/17 2017/18 2018/19 2019/20
R billion Outcome Estimate Medium-term estimates
Operating account
Revenue 993.0 1 082.8 1 178.6 1 284.4 1 400.4 1 523.9 1 658.0
Current payments 1 006.5 1 085.2 1 178.2 1 276.6 1 376.7 1 474.4 1 584.5
Compensation 408.2 437.0 472.8 515.0 549.4 587.0 629.7
Goods and services 174.2 187.1 190.9 204.5 219.7 234.6 249.9
Interest and rent on land 109.6 121.2 135.3 154.5 170.7 188.5 205.6
Transfers and subsidies 314.6 339.8 379.3 402.5 436.9 464.3 499.2
Current balance -13.5 -2.4 0.3 7.9 23.7 49.5 73.5
Percentage of GDP -0.4% -0.1% 0.0% 0.2% 0.5% 1.0% 1.3%
Capital account
Capital receipts 0.2 1.3 0.3 0.1 0.1 0.1 0.1
Capital payments and transfers 133.3 146.2 164.6 168.7 176.1 186.6 199.6
Capital financing requirement1 -133.1 -144.9 -164.3 -168.6 -176.0 -186.5 -199.5
Percentage of GDP -3.7% -3.8% -4.0% -3.8% -3.7% -3.7% -3.6%
Financial transactions2 10.9 9.8 11.7 10.3 11.2 8.8 7.0
Contingency reserve – – – – 6.0 10.0 20.0
Budget balance -135.7 -137.5 -152.2 -150.5 -147.1 -138.2 -139.0
Percentage of GDP -3.7% -3.6% -3.7% -3.4% -3.1% -2.7% -2.5%
Revenue 1 008.3 1 099.6 1 220.9 1 301.0 1 416.9 1 537.9 1 670.4
Expenditure 1 144.0 1 237.1 1 373.1 1 451.5 1 564.0 1 676.0 1 809.4
Non-interest expenditure 3 1 034.4 1 115.8 1 237.8 1 297.0 1 393.3 1 487.5 1 603.8
Interest payments 4 109.6 121.2 135.3 154.5 170.7 188.5 205.6
Primary balance 5 -26.1 -16.3 -17.0 4.0 23.6 50.3 66.6
Percentage of GDP -0.7% -0.4% -0.4% 0.1% 0.5% 1.0% 1.2%
1. Includes payments for capital assets, receipts from sale of capital assets and capital transfers2. Transactions in financial assets and liabilities including net receipts from financial transactions3. All spending except for consolidated interest payments4. Includes main budget debt-service costs and interest payments of other levels of government5. Revenue less non-interest expenditureSource: National Treasury
Table T.6 Consolidated fiscal framework, 2013/14 – 2019/20
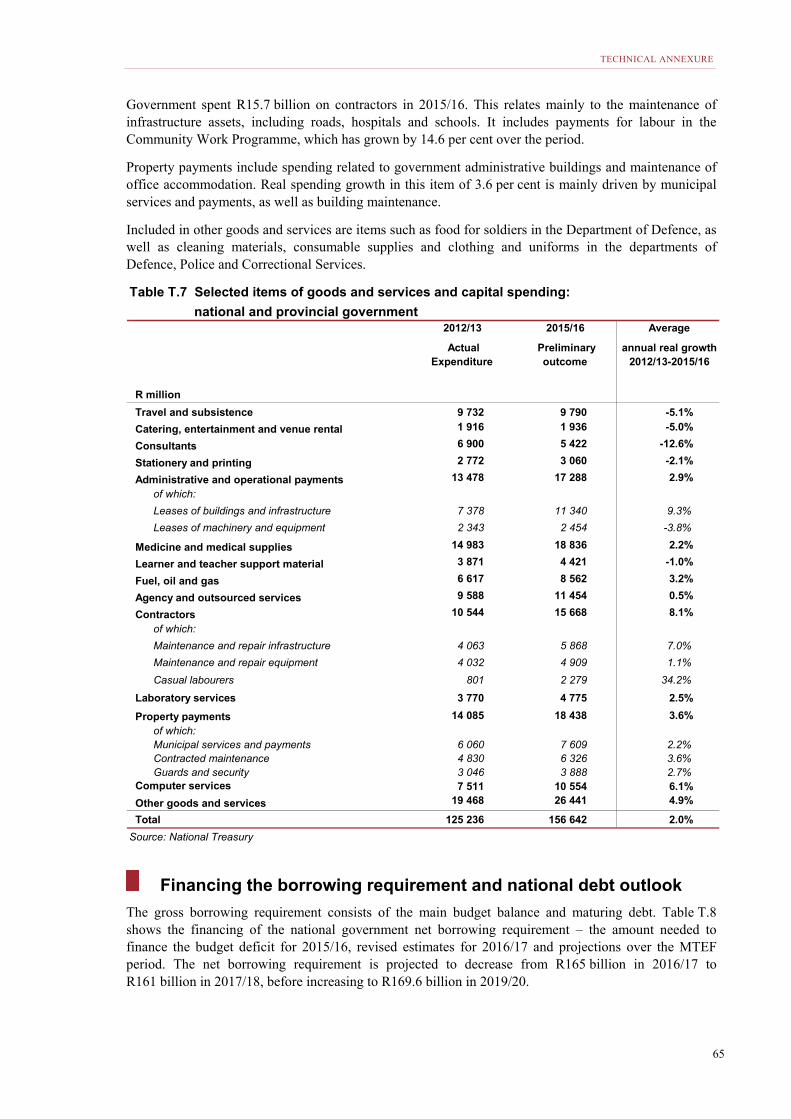
TECHNICAL ANNEXURE
65
Government spent R15.7 billion on contractors in 2015/16. This relates mainly to the maintenance of infrastructure assets, including roads, hospitals and schools. It includes payments for labour in the Community Work Programme, which has grown by 14.6 per cent over the period.
Property payments include spending related to government administrative buildings and maintenance of office accommodation. Real spending growth in this item of 3.6 per cent is mainly driven by municipal services and payments, as well as building maintenance.
Included in other goods and services are items such as food for soldiers in the Department of Defence, as well as cleaning materials, consumable supplies and clothing and uniforms in the departments of Defence, Police and Correctional Services.
Financing the borrowing requirement and national debt outlook
The gross borrowing requirement consists of the main budget balance and maturing debt. Table T.8 shows the financing of the national government net borrowing requirement – the amount needed to finance the budget deficit for 2015/16, revised estimates for 2016/17 and projections over the MTEF period. The net borrowing requirement is projected to decrease from R165 billion in 2016/17 to R161 billion in 2017/18, before increasing to R169.6 billion in 2019/20.
Table T.7 Selected items of goods and services and capital spending:
national and provincial government2012/13 2015/16 Average
Actual Expenditure
Preliminary outcome
annual real growth 2012/13-2015/16
R million
Travel and subsistence 9 732 9 790 -5.1%
Catering, entertainment and venue rental 1 916 1 936 -5.0%
Consultants 6 900 5 422 -12.6%
Stationery and printing 2 772 3 060 -2.1%
Administrative and operational payments 13 478 17 288 2.9%
of which:
Leases of buildings and infrastructure 7 378 11 340 9.3%
Leases of machinery and equipment 2 343 2 454 -3.8%
Medicine and medical supplies 14 983 18 836 2.2%
Learner and teacher support material 3 871 4 421 -1.0%
Fuel, oil and gas 6 617 8 562 3.2%
Agency and outsourced services 9 588 11 454 0.5%
Contractors 10 544 15 668 8.1%
of which:
Maintenance and repair infrastructure 4 063 5 868 7.0%
Maintenance and repair equipment 4 032 4 909 1.1%
Casual labourers 801 2 279 34.2%
Laboratory services 3 770 4 775 2.5%
Property payments 14 085 18 438 3.6%
of which:Municipal services and payments 6 060 7 609 2.2%Contracted maintenance 4 830 6 326 3.6%Guards and security 3 046 3 888 2.7%
Computer services 7 511 10 554 6.1%
Other goods and services 19 468 26 441 4.9%
Total 125 236 156 642 2.0%
Source: National Treasury
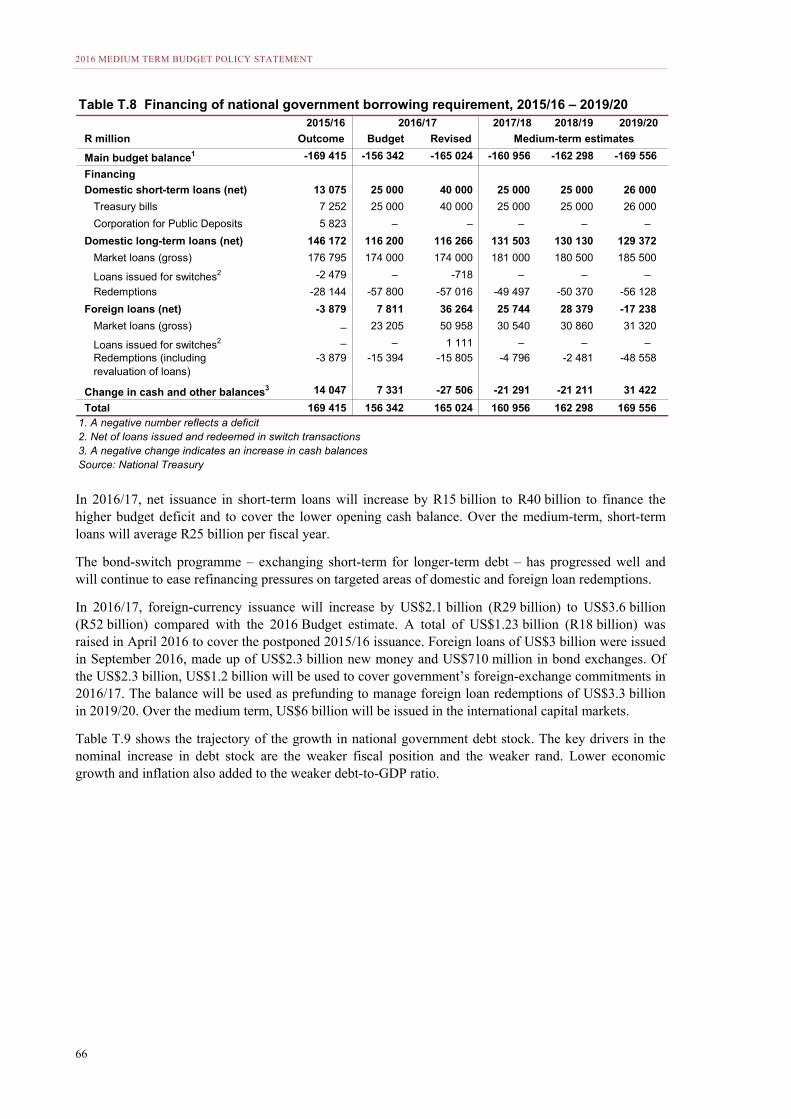
2016 MEDIUM TERM BUDGET POLICY STATEMENT
66
In 2016/17, net issuance in short-term loans will increase by R15 billion to R40 billion to finance the higher budget deficit and to cover the lower opening cash balance. Over the medium-term, short-term loans will average R25 billion per fiscal year.
The bond-switch programme – exchanging short-term for longer-term debt – has progressed well and will continue to ease refinancing pressures on targeted areas of domestic and foreign loan redemptions.
In 2016/17, foreign-currency issuance will increase by US$2.1 billion (R29 billion) to US$3.6 billion (R52 billion) compared with the 2016 Budget estimate. A total of US$1.23 billion (R18 billion) was raised in April 2016 to cover the postponed 2015/16 issuance. Foreign loans of US$3 billion were issued in September 2016, made up of US$2.3 billion new money and US$710 million in bond exchanges. Of the US$2.3 billion, US$1.2 billion will be used to cover government’s foreign-exchange commitments in 2016/17. The balance will be used as prefunding to manage foreign loan redemptions of US$3.3 billion in 2019/20. Over the medium term, US$6 billion will be issued in the international capital markets.
Table T.9 shows the trajectory of the growth in national government debt stock. The key drivers in the nominal increase in debt stock are the weaker fiscal position and the weaker rand. Lower economic growth and inflation also added to the weaker debt-to-GDP ratio.
2015/16 2016/17 2017/18 2018/19 2019/20
R million Outcome Budget Revised
Main budget balance1 -169 415 -156 342 -165 024 -160 956 -162 298 -169 556
Financing
Domestic short-term loans (net) 13 075 25 000 40 000 25 000 25 000 26 000
Treasury bills 7 252 25 000 40 000 25 000 25 000 26 000
Corporation for Public Deposits 5 823 – – – – –
Domestic long-term loans (net) 146 172 116 200 116 266 131 503 130 130 129 372
Market loans (gross) 176 795 174 000 174 000 181 000 180 500 185 500
Loans issued for switches2 -2 479 – -718 – – –
Redemptions -28 144 -57 800 -57 016 -49 497 -50 370 -56 128
Foreign loans (net) -3 879 7 811 36 264 25 744 28 379 -17 238
Market loans (gross) – 23 205 50 958 30 540 30 860 31 320
Loans issued for switches2 – – 1 111 – – – Redemptions (including revaluation of loans)
-3 879 -15 394 -15 805 -4 796 -2 481 -48 558
Change in cash and other balances3 14 047 7 331 -27 506 -21 291 -21 211 31 422
Total 169 415 156 342 165 024 160 956 162 298 169 556 1. A negative number reflects a deficit2. Net of loans issued and redeemed in switch transactions3. A negative change indicates an increase in cash balancesSource: National Treasury
Table T.8 Financing of national government borrowing requirement, 2015/16 – 2019/20
Medium-term estimates
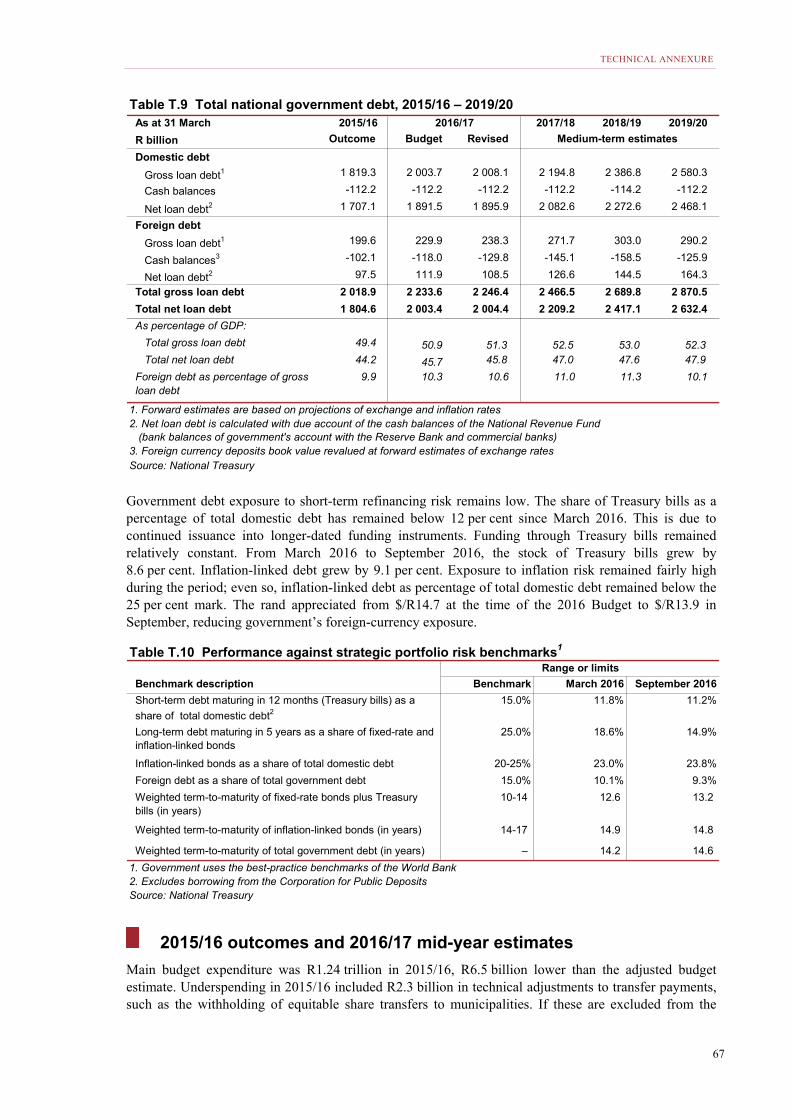
TECHNICAL ANNEXURE
67
Government debt exposure to short-term refinancing risk remains low. The share of Treasury bills as a percentage of total domestic debt has remained below 12 per cent since March 2016. This is due to continued issuance into longer-dated funding instruments. Funding through Treasury bills remained relatively constant. From March 2016 to September 2016, the stock of Treasury bills grew by 8.6 per cent. Inflation-linked debt grew by 9.1 per cent. Exposure to inflation risk remained fairly high during the period; even so, inflation-linked debt as percentage of total domestic debt remained below the 25 per cent mark. The rand appreciated from $/R14.7 at the time of the 2016 Budget to $/R13.9 in September, reducing government’s foreign-currency exposure.
2015/16 outcomes and 2016/17 mid-year estimates
Main budget expenditure was R1.24 trillion in 2015/16, R6.5 billion lower than the adjusted budget estimate. Underspending in 2015/16 included R2.3 billion in technical adjustments to transfer payments, such as the withholding of equitable share transfers to municipalities. If these are excluded from the
As at 31 March 2015/16 2017/18 2018/19 2019/20
R billion Outcome Budget Revised
Domestic debt
Gross loan debt1 1 819.3 2 003.7 2 008.1 2 194.8 2 386.8 2 580.3
Cash balances -112.2 -112.2 -112.2 -112.2 -114.2 -112.2
Net loan debt2 1 707.1 1 891.5 1 895.9 2 082.6 2 272.6 2 468.1
Foreign debt
Gross loan debt1 199.6 229.9 238.3 271.7 303.0 290.2
Cash balances3 -102.1 -118.0 -129.8 -145.1 -158.5 -125.9
Net loan debt2 97.5 111.9 108.5 126.6 144.5 164.3
Total gross loan debt 2 018.9 2 233.6 2 246.4 2 466.5 2 689.8 2 870.5
Total net loan debt 1 804.6 2 003.4 2 004.4 2 209.2 2 417.1 2 632.4
As percentage of GDP:
Total gross loan debt 49.4 50.9 51.3 52.5 53.0 52.3 Total net loan debt 44.2 45.7 45.8 47.0 47.6 47.9
Foreign debt as percentage of gross loan debt
9.9 10.3 10.6 11.0 11.3 10.1
1. Forward estimates are based on projections of exchange and inflation rates2. Net loan debt is calculated with due account of the cash balances of the National Revenue Fund (bank balances of government's account with the Reserve Bank and commercial banks)3. Foreign currency deposits book value revalued at forward estimates of exchange ratesSource: National Treasury
Table T.9 Total national government debt, 2015/16 – 2019/202016/17
Medium-term estimates
Table T.10 Performance against strategic portfolio risk benchmarks1
Benchmark description Benchmark March 2016 September 2016
Short-term debt maturing in 12 months (Treasury bills) as a
share of total domestic debt215.0% 11.8% 11.2%
Long-term debt maturing in 5 years as a share of fixed-rate and inflation-linked bonds
25.0% 18.6% 14.9%
Inflation-linked bonds as a share of total domestic debt 20-25% 23.0% 23.8%
Foreign debt as a share of total government debt 15.0% 10.1% 9.3%
Weighted term-to-maturity of fixed-rate bonds plus Treasury bills (in years)
10-14 12.6 13.2
Weighted term-to-maturity of inflation-linked bonds (in years) 14-17 14.9 14.8
Weighted term-to-maturity of total government debt (in years) – 14.2 14.6
1. Government uses the best-practice benchmarks of the World Bank2. Excludes borrowing from the Corporation for Public DepositsSource: National Treasury
Range or limits
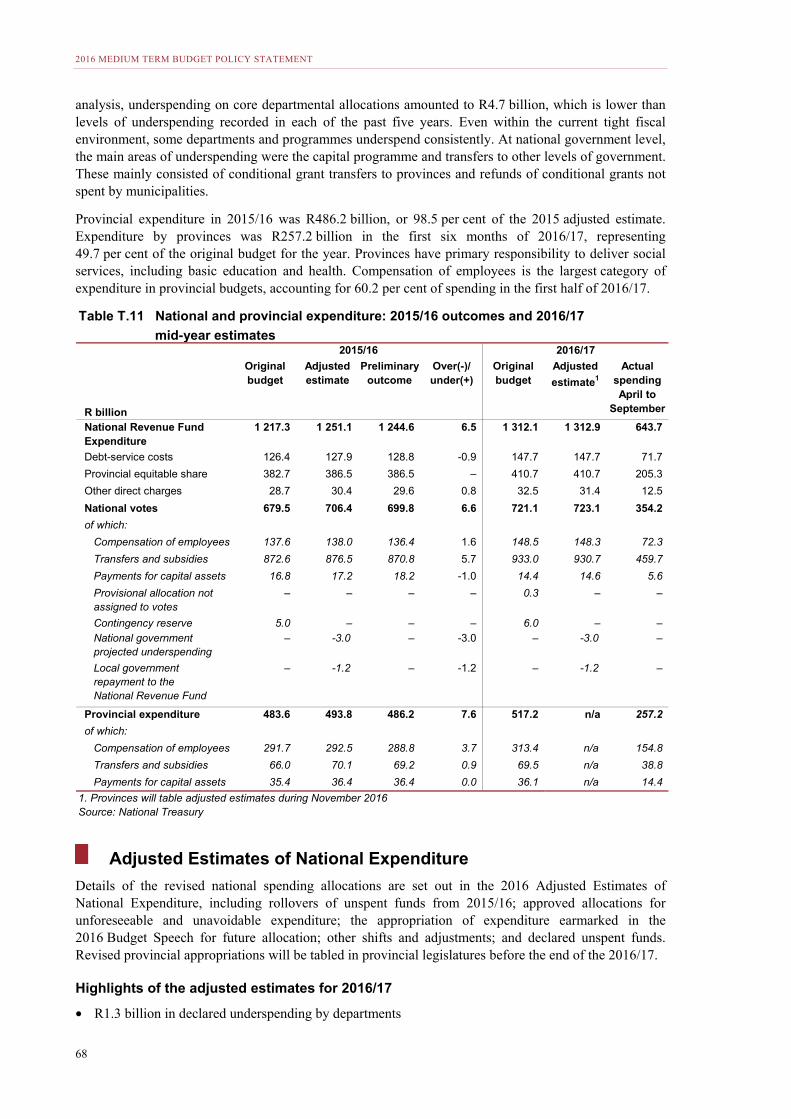
2016 MEDIUM TERM BUDGET POLICY STATEMENT
68
analysis, underspending on core departmental allocations amounted to R4.7 billion, which is lower than levels of underspending recorded in each of the past five years. Even within the current tight fiscal environment, some departments and programmes underspend consistently. At national government level, the main areas of underspending were the capital programme and transfers to other levels of government. These mainly consisted of conditional grant transfers to provinces and refunds of conditional grants not spent by municipalities.
Provincial expenditure in 2015/16 was R486.2 billion, or 98.5 per cent of the 2015 adjusted estimate. Expenditure by provinces was R257.2 billion in the first six months of 2016/17, representing 49.7 per cent of the original budget for the year. Provinces have primary responsibility to deliver social services, including basic education and health. Compensation of employees is the largest category of expenditure in provincial budgets, accounting for 60.2 per cent of spending in the first half of 2016/17.
Adjusted Estimates of National Expenditure
Details of the revised national spending allocations are set out in the 2016 Adjusted Estimates of National Expenditure, including rollovers of unspent funds from 2015/16; approved allocations for unforeseeable and unavoidable expenditure; the appropriation of expenditure earmarked in the 2016 Budget Speech for future allocation; other shifts and adjustments; and declared unspent funds. Revised provincial appropriations will be tabled in provincial legislatures before the end of the 2016/17.
Highlights of the adjusted estimates for 2016/17
• R1.3 billion in declared underspending by departments
mid-year estimates2015/16 2016/17
R billion
Originalbudget
Adjusted estimate
Preliminary outcome
Over(-)/ under(+)
Originalbudget
Adjusted
estimate1
Actual spending April to
September
National Revenue Fund Expenditure
1 217.3 1 251.1 1 244.6 6.5 1 312.1 1 312.9 643.7
Debt-service costs 126.4 127.9 128.8 -0.9 147.7 147.7 71.7
Provincial equitable share 382.7 386.5 386.5 – 410.7 410.7 205.3
Other direct charges 28.7 30.4 29.6 0.8 32.5 31.4 12.5
National votes 679.5 706.4 699.8 6.6 721.1 723.1 354.2
of which:
Compensation of employees 137.6 138.0 136.4 1.6 148.5 148.3 72.3
Transfers and subsidies 872.6 876.5 870.8 5.7 933.0 930.7 459.7
Payments for capital assets 16.8 17.2 18.2 -1.0 14.4 14.6 5.6
Provisional allocation not assigned to votes
– – – – 0.3 – –
Contingency reserve 5.0 – – – 6.0 – – National governmentprojected underspending
– -3.0 – -3.0 – -3.0 –
Local governmentrepayment to theNational Revenue Fund
– -1.2 – -1.2 – -1.2 –
Provincial expenditure 483.6 493.8 486.2 7.6 517.2 n/a 257.2 of which:
Compensation of employees 291.7 292.5 288.8 3.7 313.4 n/a 154.8
Transfers and subsidies 66.0 70.1 69.2 0.9 69.5 n/a 38.8
Payments for capital assets 35.4 36.4 36.4 0.0 36.1 n/a 14.4
1. Provinces will table adjusted estimates during November 2016Source: National Treasury
Table T.11 National and provincial expenditure: 2015/16 outcomes and 2016/17
TECHNICAL ANNEXURE
69
• A further R3 billion in projected underspending
• R290.7 million for a packaged mobile desalination plant to be used in coastal areas and R50.6 million for water tankering and storage for drought-stricken areas
• R950 million for the Department of International Relations and Cooperation to compensate for the difference in forecast foreign-currency exchange rates and actual rates at time of payment
• R212 million to procure fodder for animal feed for drought-stricken areas
• R71.3 million for the Electoral Commission for salaries and equipment warehousing costs incurred due to the shifting of the date of the 2016 local government elections from May to August 2016
• R1.1 billion in self-financing expenditure by various departments.
Key revisions to provincial allocations
• KwaZulu-Natal is granted a rollover of R275.7 million on the provincial roads maintenance grant.
• Funds are allocated to the education infrastructure grant for the rehabilitation of schools damaged over the course of the year. In addition, funds are added to the national school nutrition programme. Some funds from the school infrastructure backlogs grant are converted to the direct education infrastructure grant for the Western Cape as the grant’s implementing agent. Moreover, funds are reprioritised in-year from the school infrastructure backlogs grant to the national school nutrition programme grant to alleviate food inflation pressures.
• The direct national health insurance grant will be increased by R9 million to fund the strengthening of health information systems in KwaZulu-Natal and Western Cape. This is funded by the shifting of funds earmarked for the diagnostic related group on the National Department of Health’s budget. A further R10 million will be reprioritised from the indirect national health insurance grant, human papilloma virus vaccines component to the health professionals contracting component.
• There is a R212 million addition to comprehensive agriculture support programme grant to provide drought relief to farmers. This drought relief addition will be indirectly administered on behalf of the provinces by the Department of Agriculture, Forestry and Fisheries.
Revisions to local government allocations
• To fund the provision of emergency water supplies to drought-affected communities, R50.6 million is added to the indirect water services infrastructure grant.
Division of revenue
The largest share of the consolidated fiscal framework is the main budget, made up of all spending financed from the National Revenue Fund. The main budget is shared between national, provincial and local government. This section outlines the proposed substantial adjustments to provincial and local government allocations not already discussed in Chapter 4.
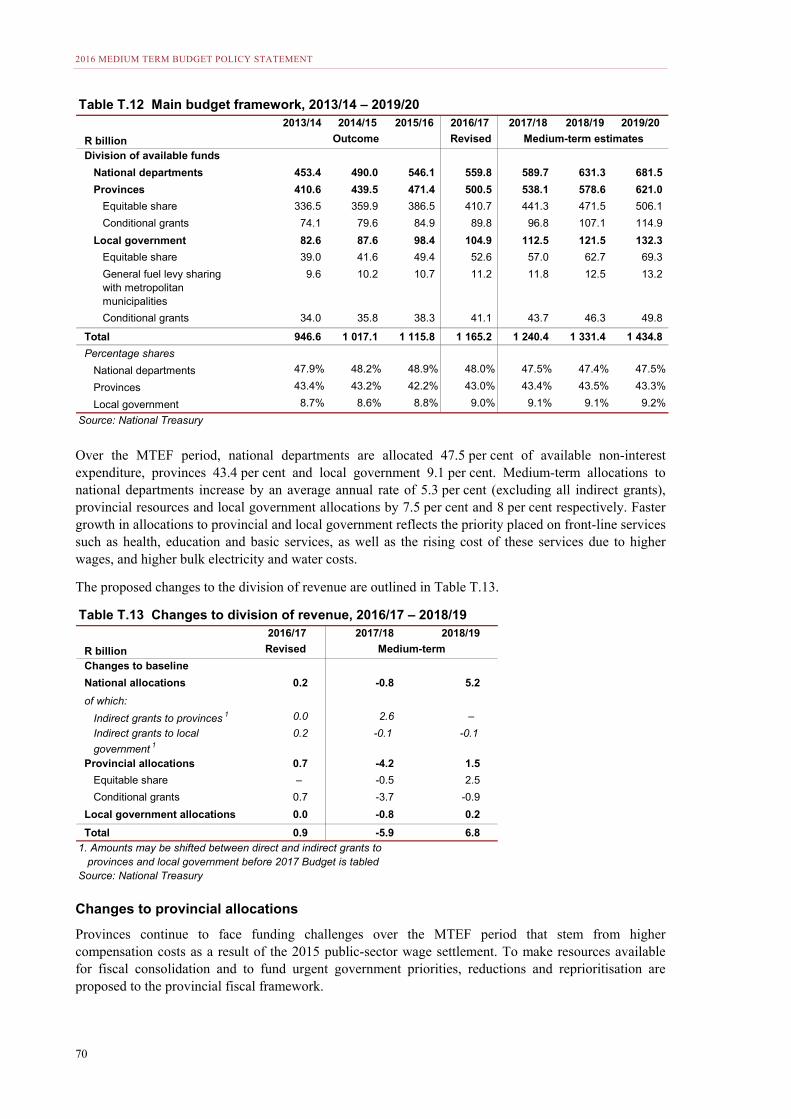
2016 MEDIUM TERM BUDGET POLICY STATEMENT
70
Over the MTEF period, national departments are allocated 47.5 per cent of available non-interest expenditure, provinces 43.4 per cent and local government 9.1 per cent. Medium-term allocations to national departments increase by an average annual rate of 5.3 per cent (excluding all indirect grants), provincial resources and local government allocations by 7.5 per cent and 8 per cent respectively. Faster growth in allocations to provincial and local government reflects the priority placed on front-line services such as health, education and basic services, as well as the rising cost of these services due to higher wages, and higher bulk electricity and water costs.
The proposed changes to the division of revenue are outlined in Table T.13.
Changes to provincial allocations
Provinces continue to face funding challenges over the MTEF period that stem from higher compensation costs as a result of the 2015 public-sector wage settlement. To make resources available for fiscal consolidation and to fund urgent government priorities, reductions and reprioritisation are proposed to the provincial fiscal framework.
2013/14 2014/15 2015/16 2016/17 2017/18 2018/19 2019/20
R billion Outcome Revised Medium-term estimates
Division of available funds
National departments 453.4 490.0 546.1 559.8 589.7 631.3 681.5
Provinces 410.6 439.5 471.4 500.5 538.1 578.6 621.0
Equitable share 336.5 359.9 386.5 410.7 441.3 471.5 506.1
Conditional grants 74.1 79.6 84.9 89.8 96.8 107.1 114.9
Local government 82.6 87.6 98.4 104.9 112.5 121.5 132.3
Equitable share 39.0 41.6 49.4 52.6 57.0 62.7 69.3
General fuel levy sharing with metropolitan municipalities
9.6 10.2 10.7 11.2 11.8 12.5 13.2
Conditional grants 34.0 35.8 38.3 41.1 43.7 46.3 49.8
Total 946.6 1 017.1 1 115.8 1 165.2 1 240.4 1 331.4 1 434.8
Percentage shares
National departments 47.9% 48.2% 48.9% 48.0% 47.5% 47.4% 47.5%
Provinces 43.4% 43.2% 42.2% 43.0% 43.4% 43.5% 43.3%
Local government 8.7% 8.6% 8.8% 9.0% 9.1% 9.1% 9.2%
Source: National Treasury
Table T.12 Main budget framework, 2013/14 – 2019/20
2016/17 2017/18 2018/19
R billion Revised
Changes to baseline
National allocations 0.2 -0.8 5.2
of which:
Indirect grants to provinces 1 0.0 2.6 –
Indirect grants to local
government 1
0.2 -0.1 -0.1
Provincial allocations 0.7 -4.2 1.5
Equitable share – -0.5 2.5
Conditional grants 0.7 -3.7 -0.9
Local government allocations 0.0 -0.8 0.2
Total 0.9 -5.9 6.8
1. Amounts may be shifted between direct and indirect grants to provinces and local government before 2017 Budget is tabledSource: National Treasury
Table T.13 Changes to division of revenue, 2016/17 – 2018/19
Medium-term
TECHNICAL ANNEXURE
71
For the 2017 MTEF period, the data used in the provincial equitable share formula will be updated for population flows using Statistics South Africa’s 2016 Mid-Year Population Estimates; regional GDP using Statistics South Africa’s estimates; enrolment data supplied by the Department of Basic Education; patient load data from the Department of Health; and data on the number of people with medical aid cover using the Statistics South Africa’s General Household Survey estimator.
The provincial equitable share is reduced by R500 million in 2017/18 as a contribution to fiscal consolidation. To address pressures in education and health, a net R7.2 billion is added in 2018/19 and 2019/20. This should enable the appointment of additional teachers to reduce class sizes, ensure delivery of learner and teacher support materials, and alleviate growing pressures in the health sector.
The national school nutrition programme grant, a special purpose grant to provide learners in quintile 1-3 schools a daily nutritious meal, has come under increasing pressure due to soaring cost of food. The grant receives additional amounts of R120 million, R130 million and R140 million over the three respective years of the spending period ahead. A new grant that will allow provinces to accede to the court order for the provision of education to learners with profound intellectual disabilities comes into effect in 2017/18.
A new grant for social workers comes to effect in 2017/18. This grant is funded through a reprioritisation from within the social development sector. In spite of improving numbers of trained social workers through a bursary scheme, there has been a gap in funding to ensure that trained social workers are employed where they are needed. In order to employ 861 social workers, allocations of R181.3 million, R196.8 million and R212.7 million are proposed over the MTEF years.
The comprehensive HIV, AIDS and TB grant is reduced by 0.57 per cent. The performance of this grant is unlikely to be impacted as it is one of the fastest-growing grants in the system and the number of tested and treated patients is below the target.
The maths, science and technology grant is reduced by R20 million in 2017/18 and R21 million in 2018/19, as it slowly gains traction in outcomes.
The early childhood development grant is reduced by R4.2 million and R4.3 million in 2017/18 and 2018/19 respectively. The funds are reallocated towards the management and monitoring of this new grant, which comes into effect in 2017/18. In the arts and culture sector, the community library services grant is reduced by R20.8 million in 2017/18, R23.4 million 2018/19. Spending on this grant has been sluggish.
A number of provincial infrastructure grants will also be reduced. The education infrastructure grant and the health facility revitalisation grant are reduced by similar amounts in 2017/18 and 2018/19.
For the 2016 MTEF, the education infrastructure grant was merged with the school infrastructure backlogs grant. However, there were a number of remnant projects in the pipeline. As a result, the latter grant has been extended for a year, with R2.6 billion redirected from the education infrastructure grant.
The human settlements development grant has a total amount of R660 million reprioritised over the 2017 MTEF. Of this amount, R600 million is reallocated to the Social Housing Regulatory Authority to promote consolidated subsidies for social housing. The balance will fund the Housing Development Agency’s catalytic projects operations. As part of fiscal consolidation, the human settlements development grant will be reduced by R871 million in 2017/18 and by R946.6 million in 2018/19. This grant continues to underperform. Efficiency interventions will help to improve results.
Savings were found from the comprehensive agriculture support programme grant as some provinces failed to meet the grant conditions, and submit business plans, in order to access grant funds. Savings found from the grant amounted to R60 million in 2017/18 and R50 million in 2018/19. In addition, the grant is further reduced by R32.8 million in both 2017/18 and 2018/19, while the roles and responsibilities of key stakeholders in the sector are clarified for better outcomes. A small amount is reprioritised from the expanded public works programme integrated grant for 2017/18 and 2018/19.
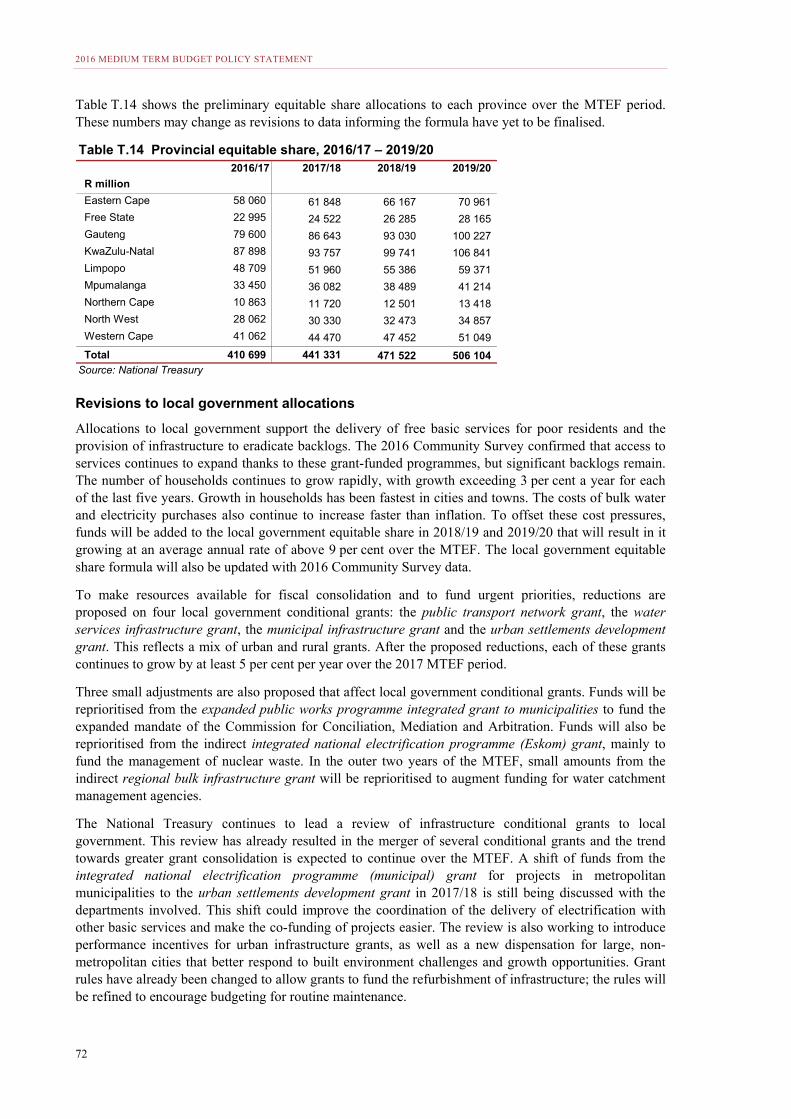
2016 MEDIUM TERM BUDGET POLICY STATEMENT
72
Table T.14 shows the preliminary equitable share allocations to each province over the MTEF period. These numbers may change as revisions to data informing the formula have yet to be finalised.
Revisions to local government allocations
Allocations to local government support the delivery of free basic services for poor residents and the provision of infrastructure to eradicate backlogs. The 2016 Community Survey confirmed that access to services continues to expand thanks to these grant-funded programmes, but significant backlogs remain. The number of households continues to grow rapidly, with growth exceeding 3 per cent a year for each of the last five years. Growth in households has been fastest in cities and towns. The costs of bulk water and electricity purchases also continue to increase faster than inflation. To offset these cost pressures, funds will be added to the local government equitable share in 2018/19 and 2019/20 that will result in it growing at an average annual rate of above 9 per cent over the MTEF. The local government equitable share formula will also be updated with 2016 Community Survey data.
To make resources available for fiscal consolidation and to fund urgent priorities, reductions are proposed on four local government conditional grants: the public transport network grant, the water services infrastructure grant, the municipal infrastructure grant and the urban settlements development grant. This reflects a mix of urban and rural grants. After the proposed reductions, each of these grants continues to grow by at least 5 per cent per year over the 2017 MTEF period.
Three small adjustments are also proposed that affect local government conditional grants. Funds will be reprioritised from the expanded public works programme integrated grant to municipalities to fund the expanded mandate of the Commission for Conciliation, Mediation and Arbitration. Funds will also be reprioritised from the indirect integrated national electrification programme (Eskom) grant, mainly to fund the management of nuclear waste. In the outer two years of the MTEF, small amounts from the indirect regional bulk infrastructure grant will be reprioritised to augment funding for water catchment management agencies.
The National Treasury continues to lead a review of infrastructure conditional grants to local government. This review has already resulted in the merger of several conditional grants and the trend towards greater grant consolidation is expected to continue over the MTEF. A shift of funds from the integrated national electrification programme (municipal) grant for projects in metropolitan municipalities to the urban settlements development grant in 2017/18 is still being discussed with the departments involved. This shift could improve the coordination of the delivery of electrification with other basic services and make the co-funding of projects easier. The review is also working to introduce performance incentives for urban infrastructure grants, as well as a new dispensation for large, non-metropolitan cities that better respond to built environment challenges and growth opportunities. Grant rules have already been changed to allow grants to fund the refurbishment of infrastructure; the rules will be refined to encourage budgeting for routine maintenance.
2016/17 2017/18 2018/19 2019/20
R million
Eastern Cape 58 060 61 848 66 167 70 961
Free State 22 995 24 522 26 285 28 165
Gauteng 79 600 86 643 93 030 100 227
KwaZulu-Natal 87 898 93 757 99 741 106 841
Limpopo 48 709 51 960 55 386 59 371
Mpumalanga 33 450 36 082 38 489 41 214
Northern Cape 10 863 11 720 12 501 13 418
North West 28 062 30 330 32 473 34 857
Western Cape 41 062 44 470 47 452 51 049
Total 410 699 441 331 471 522 506 104 Source: National Treasury
Table T.14 Provincial equitable share, 2016/17 – 2019/20
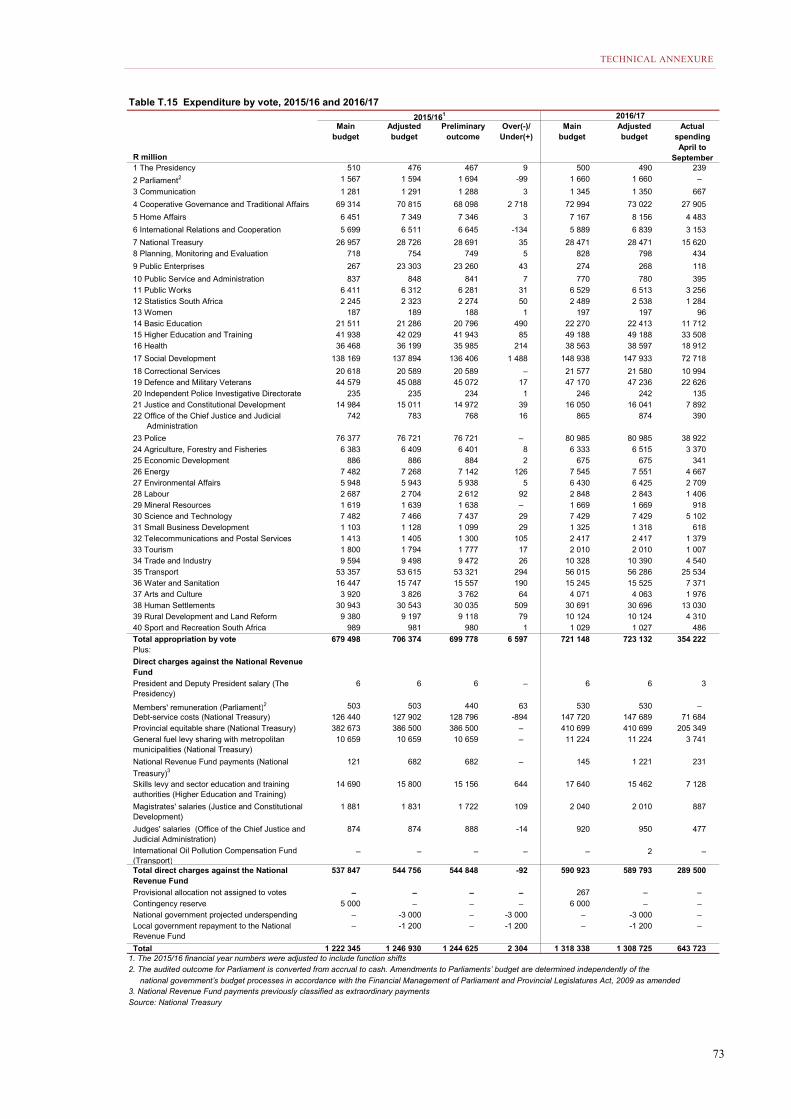
TECHNICAL ANNEXURE
73
2015/161
R million
Main budget
Adjusted budget
Preliminaryoutcome
Over(-)/ Under(+)
Main budget
Adjusted budget
Actual spending April to
September1 The Presidency 510 476 467 9 500 490 239
2 Parliament2 1 567 1 594 1 694 -99 1 660 1 660 –
3 Communication 1 281 1 291 1 288 3 1 345 1 350 667
4 Cooperative Governance and Traditional Affairs 69 314 70 815 68 098 2 718 72 994 73 022 27 905
5 Home Affairs 6 451 7 349 7 346 3 7 167 8 156 4 483
6 International Relations and Cooperation 5 699 6 511 6 645 -134 5 889 6 839 3 153
7 National Treasury 26 957 28 726 28 691 35 28 471 28 471 15 620 8 Planning, Monitoring and Evaluation 718 754 749 5 828 798 434
9 Public Enterprises 267 23 303 23 260 43 274 268 118
10 Public Service and Administration 837 848 841 7 770 780 395 11 Public Works 6 411 6 312 6 281 31 6 529 6 513 3 256 12 Statistics South Africa 2 245 2 323 2 274 50 2 489 2 538 1 284 13 Women 187 189 188 1 197 197 96 14 Basic Education 21 511 21 286 20 796 490 22 270 22 413 11 712 15 Higher Education and Training 41 938 42 029 41 943 85 49 188 49 188 33 508 16 Health 36 468 36 199 35 985 214 38 563 38 597 18 912
17 Social Development 138 169 137 894 136 406 1 488 148 938 147 933 72 718
18 Correctional Services 20 618 20 589 20 589 – 21 577 21 580 10 994 19 Defence and Military Veterans 44 579 45 088 45 072 17 47 170 47 236 22 626 20 Independent Police Investigative Directorate 235 235 234 1 246 242 135 21 Justice and Constitutional Development 14 984 15 011 14 972 39 16 050 16 041 7 892 22 Office of the Chief Justice and Judicial Administration
742 783 768 16 865 874 390
23 Police 76 377 76 721 76 721 – 80 985 80 985 38 922 24 Agriculture, Forestry and Fisheries 6 383 6 409 6 401 8 6 333 6 515 3 370 25 Economic Development 886 886 884 2 675 675 341 26 Energy 7 482 7 268 7 142 126 7 545 7 551 4 667 27 Environmental Affairs 5 948 5 943 5 938 5 6 430 6 425 2 709 28 Labour 2 687 2 704 2 612 92 2 848 2 843 1 406 29 Mineral Resources 1 619 1 639 1 638 – 1 669 1 669 918 30 Science and Technology 7 482 7 466 7 437 29 7 429 7 429 5 102 31 Small Business Development 1 103 1 128 1 099 29 1 325 1 318 618 32 Telecommunications and Postal Services 1 413 1 405 1 300 105 2 417 2 417 1 379 33 Tourism 1 800 1 794 1 777 17 2 010 2 010 1 007 34 Trade and Industry 9 594 9 498 9 472 26 10 328 10 390 4 540 35 Transport 53 357 53 615 53 321 294 56 015 56 286 25 534 36 Water and Sanitation 16 447 15 747 15 557 190 15 245 15 525 7 371 37 Arts and Culture 3 920 3 826 3 762 64 4 071 4 063 1 976 38 Human Settlements 30 943 30 543 30 035 509 30 691 30 696 13 030 39 Rural Development and Land Reform 9 380 9 197 9 118 79 10 124 10 124 4 310 40 Sport and Recreation South Africa 989 981 980 1 1 029 1 027 486
Total appropriation by vote 679 498 706 374 699 778 6 597 721 148 723 132 354 222 Plus:
Direct charges against the National Revenue Fund
President and Deputy President salary (The Presidency)
6 6 6 – 6 6 3
Members' remuneration (Parliament)2 503 503 440 63 530 530 – Debt-service costs (National Treasury) 126 440 127 902 128 796 -894 147 720 147 689 71 684 Provincial equitable share (National Treasury) 382 673 386 500 386 500 – 410 699 410 699 205 349 General fuel levy sharing with metropolitan municipalities (National Treasury)
10 659 10 659 10 659 – 11 224 11 224 3 741
National Revenue Fund payments (National
Treasury)3
121 682 682 – 145 1 221 231
Skills levy and sector education and training authorities (Higher Education and Training)
14 690 15 800 15 156 644 17 640 15 462 7 128
Magistrates' salaries (Justice and Constitutional Development)
1 881 1 831 1 722 109 2 040 2 010 887
Judges' salaries (Office of the Chief Justice and Judicial Administration)
874 874 888 -14 920 950 477
International Oil Pollution Compensation Fund (Transport)
– – – – – 2 –
Total direct charges against the National Revenue Fund
537 847 544 756 544 848 -92 590 923 589 793 289 500
Provisional allocation not assigned to votes – – – – 267 – – Contingency reserve 5 000 – – – 6 000 – – National government projected underspending – -3 000 – -3 000 – -3 000 – Local government repayment to the National Revenue Fund
– -1 200 – -1 200 – -1 200 –
Total 1 222 345 1 246 930 1 244 625 2 304 1 318 338 1 308 725 643 723 1. The 2015/16 financial year numbers were adjusted to include function shifts2. The audited outcome for Parliament is converted from accrual to cash. Amendments to Parliaments’ budget are determined independently of the
national government’s budget processes in accordance with the Financial Management of Parliament and Provincial Legislatures Act, 2009 as amended3. National Revenue Fund payments previously classified as extraordinary paymentsSource: National Treasury
Table T.15 Expenditure by vote, 2015/16 and 2016/172016/17
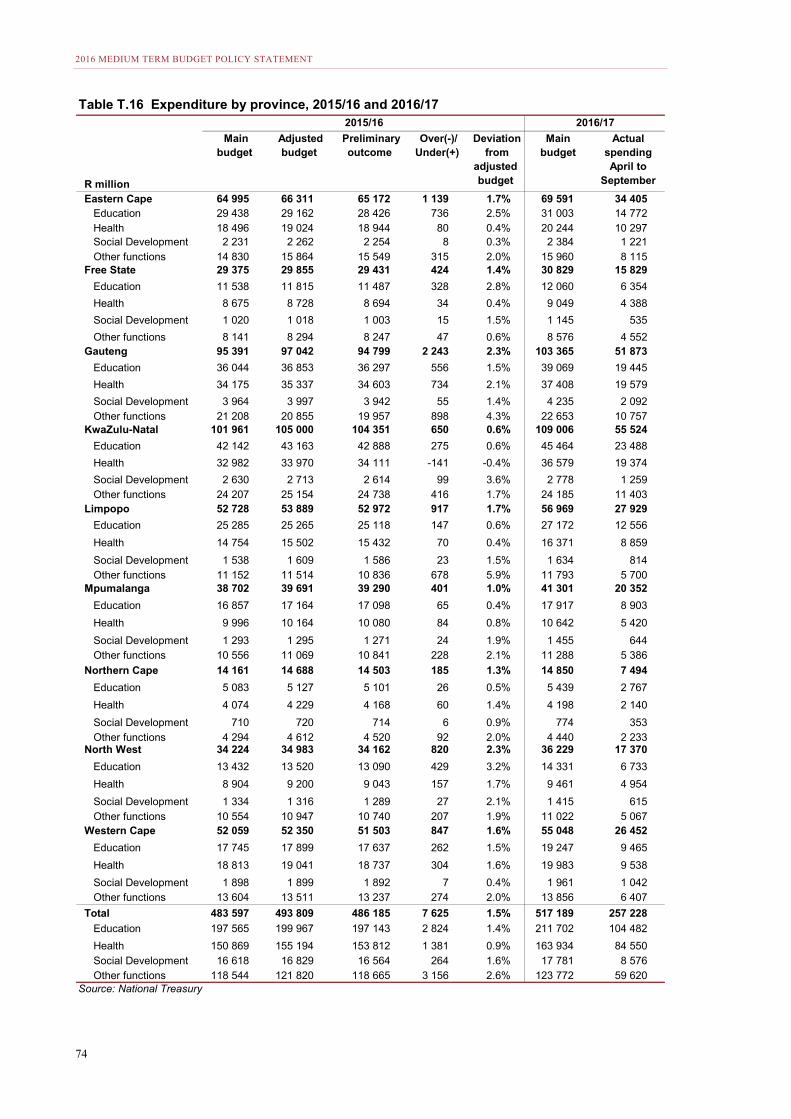
2016 MEDIUM TERM BUDGET POLICY STATEMENT
74
2015/16
R million
Main budget
Adjusted budget
Preliminary outcome
Over(-)/ Under(+)
Deviation from
adjusted budget
Main budget
Actual spending April to
September
Eastern Cape 64 995 66 311 65 172 1 139 1.7% 69 591 34 405 Education 29 438 29 162 28 426 736 2.5% 31 003 14 772 Health 18 496 19 024 18 944 80 0.4% 20 244 10 297 Social Development 2 231 2 262 2 254 8 0.3% 2 384 1 221 Other functions 14 830 15 864 15 549 315 2.0% 15 960 8 115
Free State 29 375 29 855 29 431 424 1.4% 30 829 15 829
Education 11 538 11 815 11 487 328 2.8% 12 060 6 354
Health 8 675 8 728 8 694 34 0.4% 9 049 4 388
Social Development 1 020 1 018 1 003 15 1.5% 1 145 535
Other functions 8 141 8 294 8 247 47 0.6% 8 576 4 552 Gauteng 95 391 97 042 94 799 2 243 2.3% 103 365 51 873
Education 36 044 36 853 36 297 556 1.5% 39 069 19 445
Health 34 175 35 337 34 603 734 2.1% 37 408 19 579
Social Development 3 964 3 997 3 942 55 1.4% 4 235 2 092 Other functions 21 208 20 855 19 957 898 4.3% 22 653 10 757
KwaZulu-Natal 101 961 105 000 104 351 650 0.6% 109 006 55 524
Education 42 142 43 163 42 888 275 0.6% 45 464 23 488
Health 32 982 33 970 34 111 -141 -0.4% 36 579 19 374
Social Development 2 630 2 713 2 614 99 3.6% 2 778 1 259 Other functions 24 207 25 154 24 738 416 1.7% 24 185 11 403
Limpopo 52 728 53 889 52 972 917 1.7% 56 969 27 929
Education 25 285 25 265 25 118 147 0.6% 27 172 12 556
Health 14 754 15 502 15 432 70 0.4% 16 371 8 859
Social Development 1 538 1 609 1 586 23 1.5% 1 634 814 Other functions 11 152 11 514 10 836 678 5.9% 11 793 5 700
Mpumalanga 38 702 39 691 39 290 401 1.0% 41 301 20 352
Education 16 857 17 164 17 098 65 0.4% 17 917 8 903
Health 9 996 10 164 10 080 84 0.8% 10 642 5 420
Social Development 1 293 1 295 1 271 24 1.9% 1 455 644 Other functions 10 556 11 069 10 841 228 2.1% 11 288 5 386
Northern Cape 14 161 14 688 14 503 185 1.3% 14 850 7 494
Education 5 083 5 127 5 101 26 0.5% 5 439 2 767
Health 4 074 4 229 4 168 60 1.4% 4 198 2 140
Social Development 710 720 714 6 0.9% 774 353 Other functions 4 294 4 612 4 520 92 2.0% 4 440 2 233
North West 34 224 34 983 34 162 820 2.3% 36 229 17 370
Education 13 432 13 520 13 090 429 3.2% 14 331 6 733
Health 8 904 9 200 9 043 157 1.7% 9 461 4 954
Social Development 1 334 1 316 1 289 27 2.1% 1 415 615 Other functions 10 554 10 947 10 740 207 1.9% 11 022 5 067
Western Cape 52 059 52 350 51 503 847 1.6% 55 048 26 452
Education 17 745 17 899 17 637 262 1.5% 19 247 9 465
Health 18 813 19 041 18 737 304 1.6% 19 983 9 538
Social Development 1 898 1 899 1 892 7 0.4% 1 961 1 042 Other functions 13 604 13 511 13 237 274 2.0% 13 856 6 407
Total 483 597 493 809 486 185 7 625 1.5% 517 189 257 228
Education 197 565 199 967 197 143 2 824 1.4% 211 702 104 482
Health 150 869 155 194 153 812 1 381 0.9% 163 934 84 550 Social Development 16 618 16 829 16 564 264 1.6% 17 781 8 576 Other functions 118 544 121 820 118 665 3 156 2.6% 123 772 59 620
Source: National Treasury
Table T.16 Expenditure by province, 2015/16 and 2016/172016/17
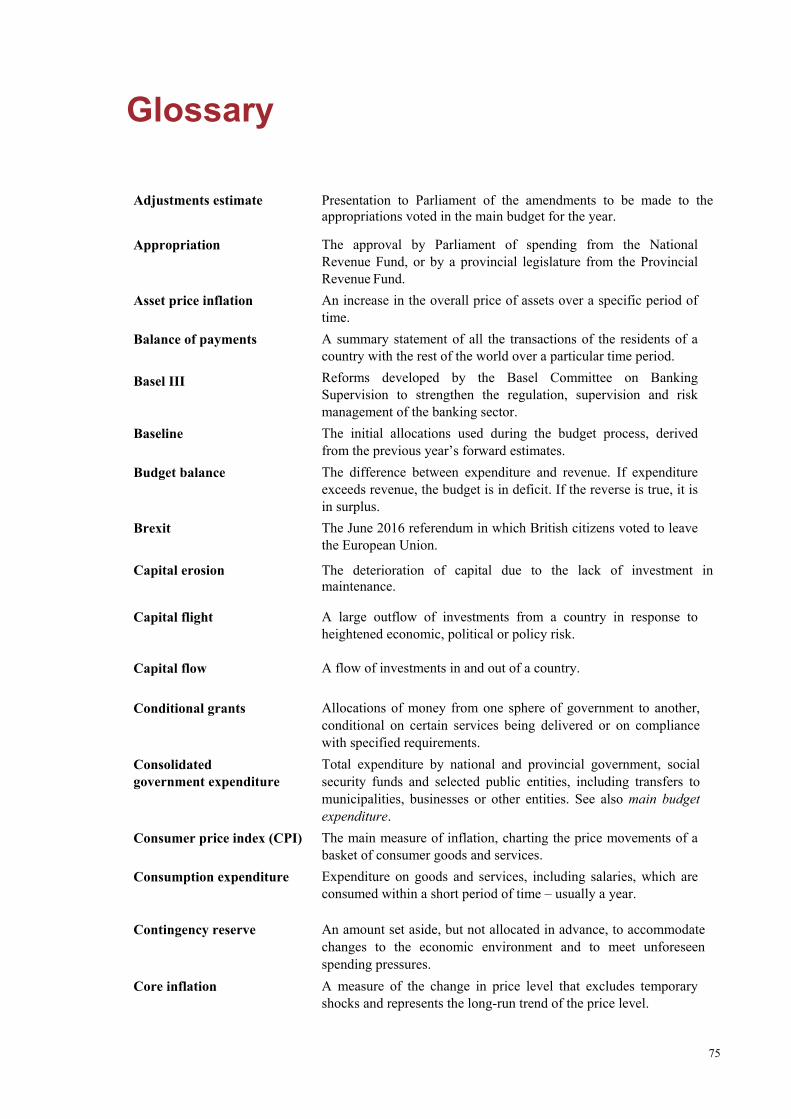
75
Glossary
Adjustments estimate Presentation to Parliament of the amendments to be made to the appropriations voted in the main budget for the year.
Appropriation The approval by Parliament of spending from the National Revenue Fund, or by a provincial legislature from the Provincial Revenue Fund.
Asset price inflation An increase in the overall price of assets over a specific period of time.
Balance of payments A summary statement of all the transactions of the residents of a country with the rest of the world over a particular time period.
Basel III Reforms developed by the Basel Committee on Banking Supervision to strengthen the regulation, supervision and risk management of the banking sector.
Baseline The initial allocations used during the budget process, derived from the previous year’s forward estimates.
Budget balance The difference between expenditure and revenue. If expenditure exceeds revenue, the budget is in deficit. If the reverse is true, it is in surplus.
Brexit The June 2016 referendum in which British citizens voted to leave the European Union.
Capital erosion The deterioration of capital due to the lack of investment in maintenance.
Capital flight A large outflow of investments from a country in response to heightened economic, political or policy risk.
Capital flow A flow of investments in and out of a country.
Conditional grants Allocations of money from one sphere of government to another, conditional on certain services being delivered or on compliance with specified requirements.
Consolidated government expenditure
Total expenditure by national and provincial government, social security funds and selected public entities, including transfers to municipalities, businesses or other entities. See also main budget expenditure.
Consumer price index (CPI) The main measure of inflation, charting the price movements of a basket of consumer goods and services.
Consumption expenditure Expenditure on goods and services, including salaries, which are consumed within a short period of time – usually a year.
Contingency reserve An amount set aside, but not allocated in advance, to accommodate changes to the economic environment and to meet unforeseen spending pressures.
Core inflation A measure of the change in price level that excludes temporary shocks and represents the long-run trend of the price level.
2016 MEDIUM TERM BUDGET POLICY STATEMENT
76
Countercyclical fiscal policy Policy that has the opposite effect on economic activity to that caused by the business cycle, such as slowing spending growth in a boom period and accelerating spending in a recession.
Credit rating An indicator of the risk of default by a borrower or the riskiness of a financial instrument. Grades such as AAA, Baa2 and D are given, signifying the extent of the borrower’s capacity to meet its financial obligations or the probability that the value of the financial instrument will be realised. See also rating agency.
Crowding-in Increase of private investment as a result of government spending.
Crowding-out A fall in private investment or consumption as a result of increased government expenditure.
Current account (of the balance of payments)
The difference between total exports and imports, including service payments and receipts, interest, dividends and transfers. This account can be in deficit or surplus. See also trade balance.
Current balance The difference between revenue and current expenditure, which consists of compensation of employees, goods and services, and interest and rent on land.
Debt-service cost The cost of interest on government debt.
Debt redemption Repayment of the principal and any outstanding interest on a bond.
Depreciation (capital) A reduction in the value of fixed capital as a result of wear and tear or redundancy.
Depreciation (exchange rate) A reduction in the external value of a currency.
Division of revenue The allocation of funds between national, provincial and local government as required by the Constitution.
Economic cost The cost of an alternative forgone to pursue a certain action.
Employment tax incentive An incentive meant to encourage the creation of jobs for youths by allowing employers to claim a reduction in employees’ tax.
Equitable share The allocation of revenue to national, provincial and local government as required by the Constitution.
External imbalance An excessively positive or negative current account balance, reflecting an excess or deficit of domestic investment over domestic savings.
Financial account (of the balance of payments)
A statement of all financial transactions between a country and the rest of the world, including portfolio and fixed investment flows, and movements in foreign reserves.
Financial and Fiscal Commission
An independent body established in terms of the Constitution to make recommendations to Parliament and provincial legislatures about financial issues affecting the three spheres of government.
Financial year The 12 months according to which companies and organisations budget and account. Government’s financial year runs from 1 April to 31 March.
Fiscal drag The tendency of inflation and earnings growth to push taxpayers into higher tax brackets.
Fiscal policy Policy on taxation, spending and borrowing by government.
GLOSSARY
77
Fiscal space The ability of a government’s budget to provide additional resources without jeopardising fiscal sustainability.
Flexible exchange rate Determination of currency exchange rates by market forces.
Foreign direct investment The acquisition of long-term business interests in another country, usually involving management, technology and financial participation.
GDP inflation A measure of the total increase in prices in the whole economy. Unlike CPI inflation, GDP inflation includes price increases in goods that are exported and intermediate goods such as machines, but excludes imported goods.
Gold and foreign exchange account
A Reserve Bank account that reflects its losses and profits on holdings of foreign currency and gold reserves, driven by changes in the rand-dollar exchange rate and the gold price.
Gross domestic product (GDP)
A measure of total national output, income and expenditure in the economy.
Gross fixed capital formation
The addition to a country’s fixed capital stock over a specific period, before provision for depreciation.
Headline inflation A measure of the increase in price level that includes temporary price shocks to the economy, such as one-time price changes.
Integrated financial management system (IFMS) project
A project to review, upgrade and integrate government’s financial management information technology systems.
Independent power producer
A private-sector producer of power for the national grid.
Indirect grant A grant allowing a national department to perform a function on behalf of a province or municipality. No funds are transferred, but the end-product of the grant, such as infrastructure built, is generally transferred to provincial or municipal ownership.
Inflation An increase in the general level of prices.
Inflation targeting A monetary policy framework intended to achieve price stability over a certain period of time. The Reserve Bank and government agree on a target rate or range of inflation to be maintained.
Labour force participation The ratio of employed and unemployed workers (the labour force) relative to the working age population.
Main budget expenditure National government expenditure and transfers to provincial and local government financed from the National Revenue Fund, excluding revenues and spending related to social security funds, extra-budgetary institutions and provincial own revenue. See also consolidated government expenditure.
Medium-term Expenditure Committee
The committee responsible for evaluating the budget submissions of national departments and recommending allocations.
Medium-term expenditure framework (MTEF)
The three-year spending plans of national and provincial governments published at the time of the Budget.

2016 MEDIUM TERM BUDGET POLICY STATEMENT
78
Medium-term strategic framework
The five-year strategy of government coinciding with the electoral term.
Monetary policy The actions taken by a country’s monetary authority (e.g. the Reserve Bank), normally focused around money supply and interest rates.
Money supply The total stock of money in an economy.
National budget The projected revenue and expenditure flowing through the National Revenue fund. It does not include spending by provinces or local government from their own revenues.
National Development Plan (NDP)
A national strategy to eliminate poverty and reduce inequality.
National Revenue Fund The consolidated account of national government into which all taxes, fees and charges collected by the South African Revenue Service and departmental revenue must be paid.
Net asset position The total value of a company’s assets minus its liabilities.
Nominal exchange rate The current rate of exchange between the rand and foreign currencies.
Non-interest expenditure Total expenditure by government less debt-service costs.
Primary deficit/surplus The difference between total revenue and non-interest expenditure. When revenue exceeds non-interest expenditure there is a surplus.
Primary expenditure Non-interest expenditure by government.
Primary sector The agricultural and mining sectors of the economy.
Private-sector credit extension
Credit provided to the private sector by banks. This includes all loans, credit card balances and leases.
Productivity A measure of the amount of output generated from every unit of input over a period of time. Typically used to measure changes in labour efficiency.
Protectionism When a country restricts international trade to protect domestic industries.
Public entities Companies, agencies, funds and accounts that are fully or partly owned by government or public authorities and regulated by law.
Public-private partnership (PPP)
A contractual arrangement in which a private party performs part of a government function and assumes the associated risks. In return, the private party receives a fee based on predefined performance criteria.
Public-sector borrowing requirement
The consolidated cash borrowing requirement of general government and non-financial public enterprises.
Purchasing managers’ index (PMI)
A composite index measuring the change in manufacturing activity compared with the previous month.
Rating agency A company that evaluates the ability of countries or other borrowers to honour their debt obligations. Credit ratings are used by international investors as indications of sovereign risk. See also credit rating.
Real effective exchange rate
A measure of the rate of exchange of the rand relative to a trade- weighted average of South Africa’s trading partners’ currencies, adjusted for price trends.
GLOSSARY
79
Real expenditure Expenditure measured in constant prices, i.e. after taking account of
inflation.
Real interest rate The level of interest after taking account of inflation.
Revaluation gain/loss The difference between the value of a foreign currency deposit from the original (historical) rate to execution of a trade based on the spot rate.
Repurchase (repo) rate The rate at which the Reserve Bank lends to commercial banks.
Reserves (foreign exchange)
Holdings of foreign exchange, either by the Reserve Bank only, or by the Reserve Bank and domestic banking institutions.
Rollover Funds not spent during a given financial year that flow into the following year’s budget.
Seasonally adjusted and annualised
The process of removing the seasonal volatility (monthly or quarterly) from a time series. This provides a measure of the underlying trend in the data. Annualised: to express a rate as if it were applied over one year.
Social wage Social benefits available to all individuals, funded wholly or partly by the state.
Southern African Customs Union (SACU) agreement
An agreement that allows for the unrestricted flow of goods and services, and a sharing of customs and excise revenue, between South Africa, Botswana, Lesotho, Namibia and Swaziland.
Southern African Development Community (SADC)
A regional intergovernmental organisation that promotes collaboration, economic integration and technical cooperation throughout Southern Africa.
Sovereign debt Debt issued by a government.
Special economic zone A designated area where infrastructure and incentives are provided to clusters of businesses to encourage private investment and employment growth.
Supply-side constraints A situation where a country’s productive capacity cannot keep up with rising demand.
Switch auction Auctions to exchange bonds to manage refinancing risk or improve tradability.
Tax buoyancy The ratio of the growth of a revenue stream to the growth of its underlying tax base.
Terms of trade An index measuring the ratio of export prices to import prices.
Trade balance The monetary record of a country’s net imports and exports of physical merchandise. See also current account.
Transversal term contract A fixed-term contract for the procurement of goods or services needed by more than one government department.
Treasury bills Short-term government debt instruments that yield no interest but are issued at a discount. Maturities vary from one day to 12 months.
Twin deficit A budget deficit in combination with a deficit on the current account.
Twin peaks An approach to organising financial sector regulation and supervision involving two regulators. One is responsible for ensuring financial services firms sell their products in an appropriate way. The other is responsible for ensuring financial firms remain financially sound and are generally prudent.
2016 MEDIUM TERM BUDGET POLICY STATEMENT
80
Undercapitalisation Lack of sufficient funds (capital) to conduct day-to-day operations.
Unit labour costs The cost of labour per unit of output, calculated by dividing average wages by productivity (output per worker per hour).
Unsecured lending A loan that is not backed or secured by any type of collateral to reduce the lender’s risk.
Yield A financial return or interest paid to buyers of government bonds.