Embed Size (px)
Citation preview
MTREF 2020/21 – 2022/23
0
MEDIUM TERM REVENUE AND EXPENDITURE
FRAMEWORK 2020/21 – 2022/23
MTREF 2020/21 – 2022/23
1
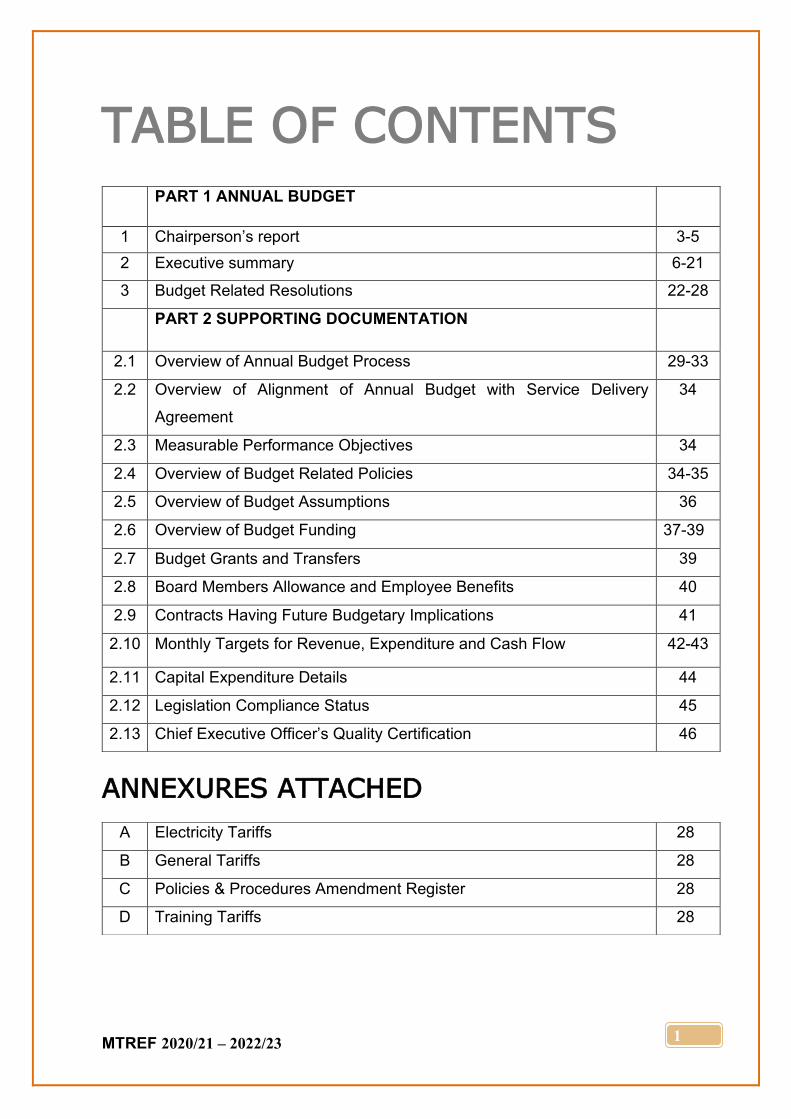
TABLE OF CONTENTS
ANNEXURES ATTACHED
PART 1 ANNUAL BUDGET
1 Chairperson’s report 3-5
2 Executive summary 6-21
3 Budget Related Resolutions 22-28
PART 2 SUPPORTING DOCUMENTATION
2.1 Overview of Annual Budget Process 29-33
2.2 Overview of Alignment of Annual Budget with Service Delivery
Agreement
34
2.3 Measurable Performance Objectives 34
2.4 Overview of Budget Related Policies 34-35
2.5 Overview of Budget Assumptions 36
2.6 Overview of Budget Funding 37-39
2.7 Budget Grants and Transfers 39
2.8 Board Members Allowance and Employee Benefits 40
2.9 Contracts Having Future Budgetary Implications 41
2.10 Monthly Targets for Revenue, Expenditure and Cash Flow 42-43
2.11 Capital Expenditure Details 44
2.12 Legislation Compliance Status 45
2.13 Chief Executive Officer’s Quality Certification 46
A Electricity Tariffs 28
B General Tariffs 28
C Policies & Procedures Amendment Register 28
D Training Tariffs 28
MTREF 2020/21 – 2022/23
2
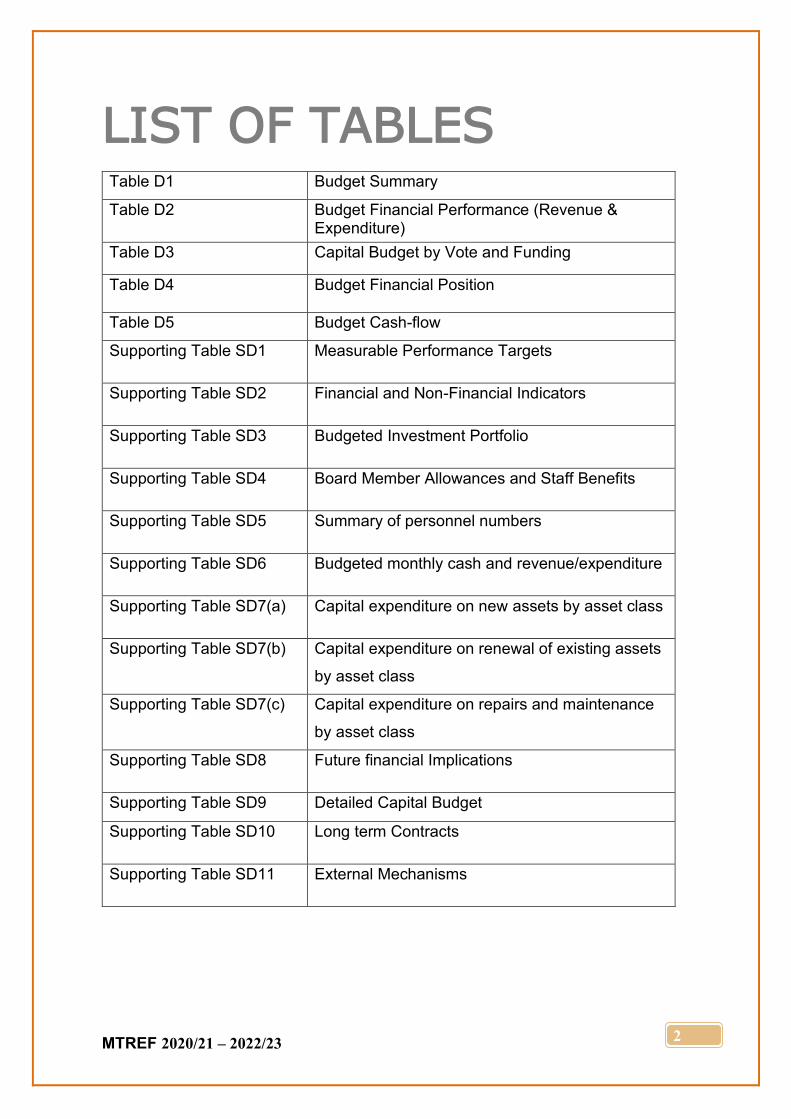
LIST OF TABLES
Table D1 Budget Summary
Table D2 Budget Financial Performance (Revenue & Expenditure)
Table D3 Capital Budget by Vote and Funding
Table D4 Budget Financial Position
Table D5 Budget Cash-flow
Supporting Table SD1 Measurable Performance Targets
Supporting Table SD2 Financial and Non-Financial Indicators
Supporting Table SD3 Budgeted Investment Portfolio
Supporting Table SD4 Board Member Allowances and Staff Benefits
Supporting Table SD5 Summary of personnel numbers
Supporting Table SD6 Budgeted monthly cash and revenue/expenditure
Supporting Table SD7(a) Capital expenditure on new assets by asset class
Supporting Table SD7(b) Capital expenditure on renewal of existing assets
by asset class
Supporting Table SD7(c) Capital expenditure on repairs and maintenance
by asset class
Supporting Table SD8 Future financial Implications
Supporting Table SD9 Detailed Capital Budget
Supporting Table SD10 Long term Contracts
Supporting Table SD11 External Mechanisms
MTREF 2020/21 – 2022/23
3
PART 1 – ANNUAL BUDGET
1. CHAIRPERSON’S REPORT
The slowdown in global economic growth has negative ripple effect in the domestic
economies felt more severely by emerging markets. “Real GDP for the current financial
year at end of May 2020 was 4.5 per cent and is estimated for 2020/21 to decrease by
7.25 per cent. Limited employment growth and household income constraints are holding
back consumption.” The country’s economic growth outlook was impossible to project
given the current pandemic. The Consolidated Medium Term Revenue and Expenditure
Framework (MTREF) Budget of 2020/21 - 2022/23 budget is thus compiled in the
environment of realignment of patterns with bias towards restraint. The impact of
COVID19 pandemic on the economy is not yet fully comprehended, but already
characterised a decreased effect on the GDP. This was described by Minister of Finance
as “going through the narrow rate”. The revenue collections are likely to be impacted by
the economic fall-out of COVID-19, and by implication reducing cash buffers in the entity,
this will have a profound impact on financial and operational sustainability going forward.
Reliable and affordable energy remains one of the strategic resources which can become
catalytic in sustaining the economy of the province. Supply from upstream has been
experience constraint with the negative impact on consumer confident and equipment.
Given the sluggish growth and weak demand, the entity will concentrate the resources
towards maintenance of the current network in order to minimise power outage and shorten
supply disruption. Expansion programme will be held back; however Service Delivery
imperative will be prioritised. Efforts to collect revenue will be strengthened and the entity
will adopt zero tolerance on electricity theft, non-payment of bills, misuse of resources and
network vandalism.
MTREF 2020/21 – 2022/23
4
The revenue for the MTREF budget totals to an amount or projected revenue of R 2,852
billion in 2020/21, representing a increase of R 31 million or 1,10% on that of 2019/20
Adjustment Budget (R 2,820 billion.) The allocation for the two outer years of the MTREF
period is R 2,891 billion in 2021/22 and R 3,031 billion in 2022/23.
The Operational Expenditure totals to projected expenditure of R 2,462 billion for 2020/21,
representing an increase of R 200 million or 8,40% increase from that of the 2019/20
Adjustments Budget of (R 2,255 billion). The allocation for the two outer years of the
MTREF period is R 2,582 billion for 2021/22 and R 2,736 billion for the 2022/23.
The Capital budget of the Entity herewith presented amount to R 169,724 million for
2020/21, representing increase of R 50 million or 29,79% from 2019/20 Adjustments
Budget of R 119,158 million. The allocation for the two outer years of the MTREF period
is projected at R 124,041 million for 2021/22 and R 129,048 million for 2022/23.
The table below illustrates the above:
All the projects are derived from the parent municipality’s integrated development plan and
will be consolidated in the Municipal Budget. The entity is positioned to continue perform
on its mandate of assisting the parent municipality achieve its goals of making energy
accessible to all communities within the metro boundaries.
DETAILS
APPROVED
BUDGET
2019/20
ADJUSTMENT
BUDGET
2019/20
Growth% MTREF 2020/21 MTREF 2021/22 MTREF
2022/23
Revenue 2,770,555,691 2,820,555,691 1.12% 2,852,030,223 2,891,536,250 3,031,257,899
Operating Expenditure 2,624,943,303 2,255,570,522 9.17% 2,462,421,919 2,582,982,087 2,736,897,865
(Surplus)/Deficit 145,612,388 564,985,169 -31.04% 389,608,304 308,554,163 294,360,034
Gains and Loss 344,360 344,360 4.60% 360,201 377,490 395,610
Capital Expenditure 145,638,821 119,158,821 42.44% 169,724,999 124,041,376 129,048,133
Surplus and or (Deficit) 317,927 446,170,708 -50.64% 220,243,505 184,890,277 165,707,511
MTREF 2020/21 – 2022/23
5
The 2020/21 MTREF is prepared within the parameters set by the Parent Municipality
including the guidelines (Circular No 98 and 99) provided by National Treasury and NERSA
on energy tariffs. Projects to accelerate service delivery and strengthen the Entity’s cash
flow position are addressed in the proposed MTREF. Projects to strengthen good
governance and firm internal controls are maintained to ensure the retention of improved
audit opinion from the Auditor General (AGSA) received in the previous year. The budget
further takes cognizance of, and address issues raised by the AGSA in the previous
financial years.
The 2020/21 budget of the entity is herewith presented to the parent municipality for
consideration in terms of MFMA 87 (2).
…………………………………….
Chairperson of the Board
MTREF 2020/21 – 2022/23
6
2. EXECUTIVE SUMMARY The purpose of the 2020/21 MTREF is to guide the entity’s allocated resources to achieve
its service delivery objectives as required by the Act MFMA (No 56 of 2003). The MTREF
is a financial plan to enable the Municipal Entity to achieve its vision and mission as
articulated in the Business Plan.
The Budget serves to bring to light the current priorities as outlined below:
• Financial sustainability
• Good Governance
• Refurbishment and upgrade of the network
• New infrastructure investment
The tabling of the budget is the start of a journey towards the final budget approval before
implementation in the start of the new financial year. The budget is an instrument which
the Municipality engages the communities of the Metro to ensure proper public
participation, and also to ensure that the community’s needs as captured in the Integrated
Development Plan (IDP) are translated into the budget for implementation. It serves to
initiate many processes both politically and administratively, amongst others, consultations
with communities throughout the municipal area.
MTREF 2020/21 – 2022/23
7
2.1 PAST AND CURRENT PERFORMANCE, ACHIEVEMENTS AND CHALLENGES (BUDGET IMPLEMENTATION)
2.1.1 PAST PERFORMANCE AND SPENDING LEVELS
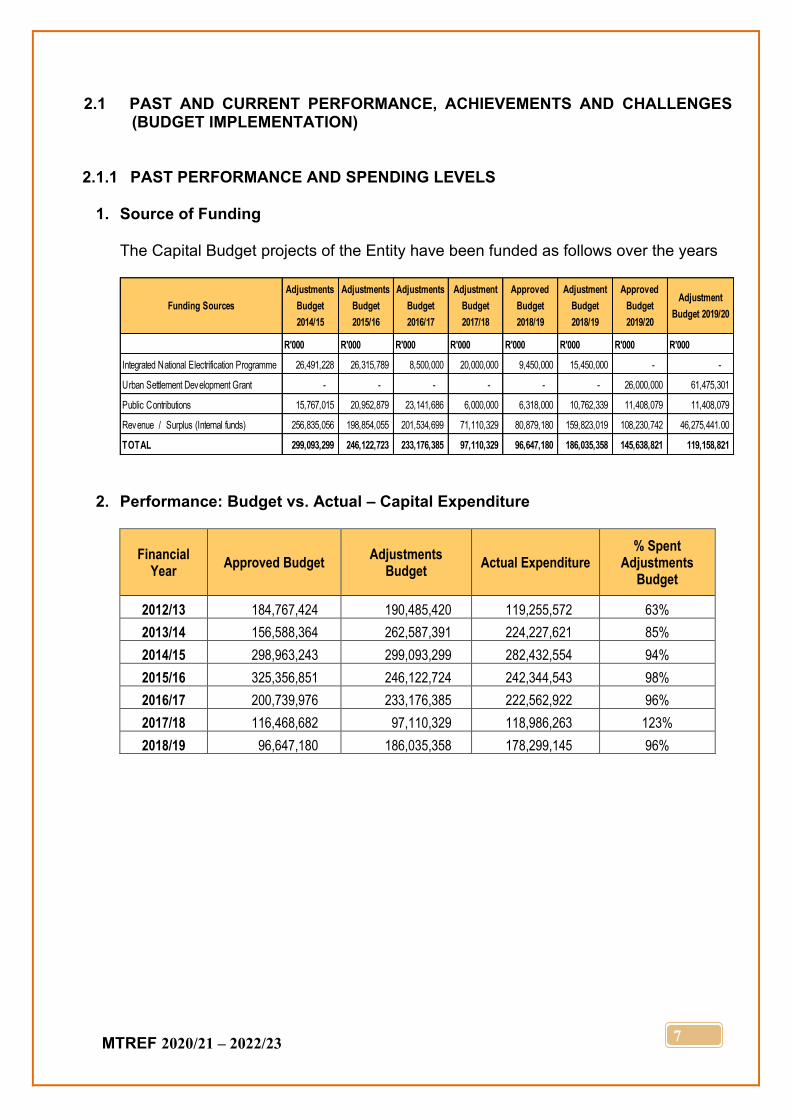
1. Source of Funding
The Capital Budget projects of the Entity have been funded as follows over the years
2. Performance: Budget vs. Actual – Capital Expenditure
Financial Year
Approved Budget Adjustments
Budget Actual Expenditure
% Spent Adjustments
Budget
2012/13 184,767,424 190,485,420 119,255,572 63%
2013/14 156,588,364 262,587,391 224,227,621 85%
2014/15 298,963,243 299,093,299 282,432,554 94%
2015/16 325,356,851 246,122,724 242,344,543 98%
2016/17 200,739,976 233,176,385 222,562,922 96%
2017/18 116,468,682 97,110,329 118,986,263 123%
2018/19 96,647,180 186,035,358 178,299,145 96%
Funding Sources
Adjustments
Budget
2014/15
Adjustments
Budget
2015/16
Adjustments
Budget
2016/17
Adjustment
Budget
2017/18
Approved
Budget
2018/19
Adjustment
Budget
2018/19
Approved
Budget
2019/20
Adjustment
Budget 2019/20
R'000 R'000 R'000 R'000 R'000 R'000 R'000 R'000
Integrated National Electrification Programme 26,491,228 26,315,789 8,500,000 20,000,000 9,450,000 15,450,000 - -
Urban Settlement Development Grant - - - - - - 26,000,000 61,475,301
Public Contributions 15,767,015 20,952,879 23,141,686 6,000,000 6,318,000 10,762,339 11,408,079 11,408,079
Revenue / Surplus (Internal funds) 256,835,056 198,854,055 201,534,699 71,110,329 80,879,180 159,823,019 108,230,742 46,275,441.00
TOTAL 299,093,299 246,122,723 233,176,385 97,110,329 96,647,180 186,035,358 145,638,821 119,158,821
MTREF 2020/21 – 2022/23
8
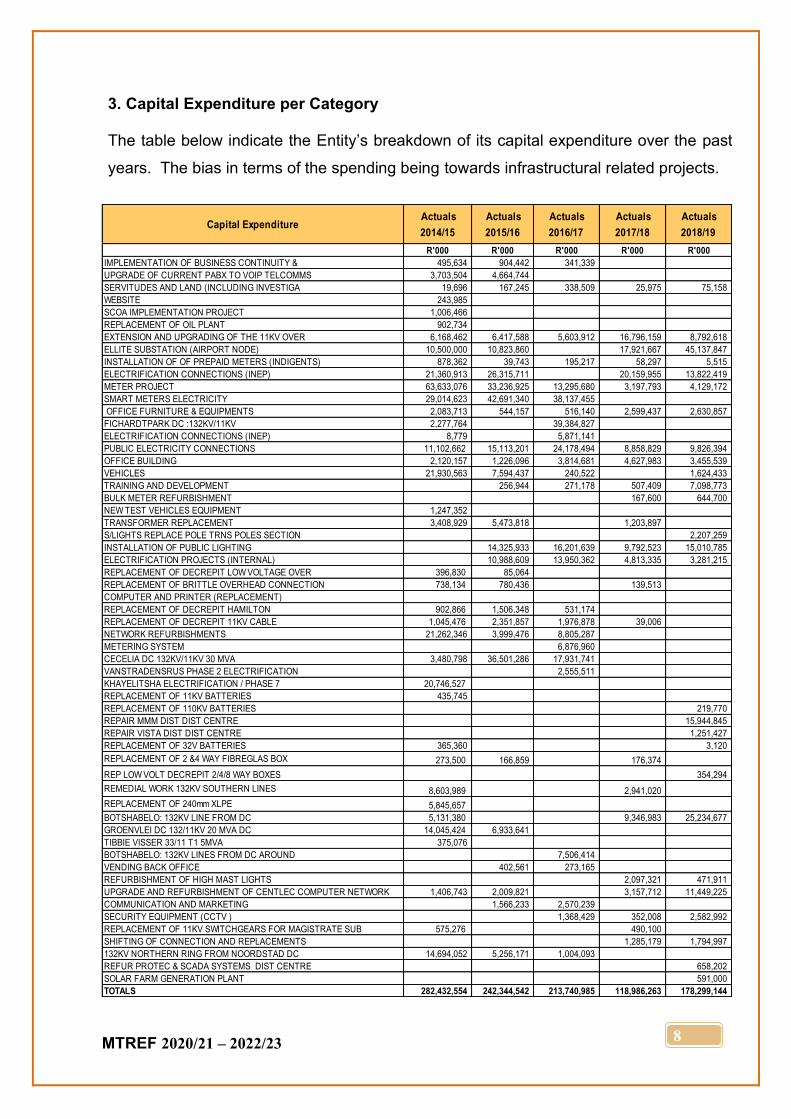
3. Capital Expenditure per Category
The table below indicate the Entity’s breakdown of its capital expenditure over the past
years. The bias in terms of the spending being towards infrastructural related projects.
Capital Expenditure Actuals
2014/15
Actuals
2015/16
Actuals
2016/17
Actuals
2017/18
Actuals
2018/19
R'000 R'000 R'000 R'000 R'000
IMPLEMENTATION OF BUSINESS CONTINUITY & 495,634 904,442 341,339
UPGRADE OF CURRENT PABX TO VOIP TELCOMMS 3,703,504 4,664,744
SERVITUDES AND LAND (INCLUDING INVESTIGA 19,696 167,245 338,509 25,975 75,158
WEBSITE 243,985
SCOA IMPLEMENTATION PROJECT 1,006,466
REPLACEMENT OF OIL PLANT 902,734
EXTENSION AND UPGRADING OF THE 11KV OVER 6,168,462 6,417,588 5,603,912 16,796,159 8,792,618
ELLITE SUBSTATION (AIRPORT NODE) 10,500,000 10,823,860 17,921,667 45,137,847
INSTALLATION OF OF PREPAID METERS (INDIGENTS) 878,362 39,743 195,217 58,297 5,515
ELECTRIFICATION CONNECTIONS (INEP) 21,360,913 26,315,711 20,159,955 13,822,419
METER PROJECT 63,633,076 33,236,925 13,295,680 3,197,793 4,129,172
SMART METERS ELECTRICITY 29,014,623 42,691,340 38,137,455
OFFICE FURNITURE & EQUIPMENTS 2,083,713 544,157 516,140 2,599,437 2,630,857
FICHARDTPARK DC :132KV/11KV 2,277,764 39,384,827
ELECTRIFICATION CONNECTIONS (INEP) 8,779 5,871,141
PUBLIC ELECTRICITY CONNECTIONS 11,102,662 15,113,201 24,178,494 8,858,829 9,826,394
OFFICE BUILDING 2,120,157 1,226,096 3,814,681 4,627,983 3,455,539
VEHICLES 21,930,563 7,594,437 240,522 1,624,433
TRAINING AND DEVELOPMENT 256,944 271,178 507,409 7,098,773
BULK METER REFURBISHMENT 167,600 644,700
NEW TEST VEHICLES EQUIPMENT 1,247,352
TRANSFORMER REPLACEMENT 3,408,929 5,473,818 1,203,897
S/LIGHTS REPLACE POLE TRNS POLES SECTION 2,207,259
INSTALLATION OF PUBLIC LIGHTING 14,325,933 16,201,639 9,792,523 15,010,785
ELECTRIFICATION PROJECTS (INTERNAL) 10,988,609 13,950,362 4,813,335 3,281,215
REPLACEMENT OF DECREPIT LOW VOLTAGE OVER 396,830 85,064
REPLACEMENT OF BRITTLE OVERHEAD CONNECTION 738,134 780,436 139,513
COMPUTER AND PRINTER (REPLACEMENT)
REPLACEMENT OF DECREPIT HAMILTON 902,866 1,506,348 531,174
REPLACEMENT OF DECREPIT 11KV CABLE 1,045,476 2,351,857 1,976,878 39,006
NETWORK REFURBISHMENTS 21,262,346 3,999,476 8,805,287
METERING SYSTEM 6,876,960
CECELIA DC 132KV/11KV 30 MVA 3,480,798 36,501,286 17,931,741
VANSTRADENSRUS PHASE 2 ELECTRIFICATION 2,555,511
KHAYELITSHA ELECTRIFICATION / PHASE 7 20,746,527
REPLACEMENT OF 11KV BATTERIES 435,745
REPLACEMENT OF 110KV BATTERIES 219,770
REPAIR MMM DIST DIST CENTRE 15,944,845
REPAIR VISTA DIST DIST CENTRE 1,251,427
REPLACEMENT OF 32V BATTERIES 365,360 3,120
REPLACEMENT OF 2 &4 WAY FIBREGLAS BOX 273,500 166,859 176,374
REP LOW VOLT DECREPIT 2/4/8 WAY BOXES 354,294
REMEDIAL WORK 132KV SOUTHERN LINES 8,603,989 2,941,020
REPLACEMENT OF 240mm XLPE 5,845,657
BOTSHABELO: 132KV LINE FROM DC 5,131,380 9,346,983 25,234,677
GROENVLEI DC 132/11KV 20 MVA DC 14,045,424 6,933,641
TIBBIE VISSER 33/11 T1 5MVA 375,076
BOTSHABELO: 132KV LINES FROM DC AROUND 7,506,414
VENDING BACK OFFICE 402,561 273,165
REFURBISHMENT OF HIGH MAST LIGHTS 2,097,321 471,911
UPGRADE AND REFURBISHMENT OF CENTLEC COMPUTER NETWORK 1,406,743 2,009,821 3,157,712 11,449,225
COMMUNICATION AND MARKETING 1,566,233 2,570,239
SECURITY EQUIPMENT (CCTV ) 1,368,429 352,008 2,582,992
REPLACEMENT OF 11KV SWITCHGEARS FOR MAGISTRATE SUB 575,276 490,100
SHIFTING OF CONNECTION AND REPLACEMENTS 1,285,179 1,794,997
132KV NORTHERN RING FROM NOORDSTAD DC 14,694,052 5,256,171 1,004,093
REFUR PROTEC & SCADA SYSTEMS DIST CENTRE 658,202
SOLAR FARM GENERATION PLANT 591,000
TOTALS 282,432,554 242,344,542 213,740,985 118,986,263 178,299,144
MTREF 2020/21 – 2022/23
9
2.1.1 RISKS FACING MUNICIPAL ENTITY
• Declining revenue due to the constraints on supply side viz. customers heeding
to energy conservation as well as the protracted economic climate resulting in
suppressed demand in general.
• Maintenance backlogs in respect of service delivery infrastructure and utilities.
• The low economic growth impacting on collectability of debt.
• Unfilled vacancies that puts pressure on service delivery and prudent
administration.
2.1.2 AUDIT OUTCOME 2018-2019 Centlec (SOC) Ltd Audit Report:
The Entity’s audit outcome for the 2018/19 financial year was an unqualified audit
opinion.
2.2 BUDGET SUMMARY
2.2.1 CONSOLIDATED MEDIUM TERM REVENUE AND EXPENDITURE FRAMEWORK OUTLOOK: 2020/21 – 2022/23
A. OPERATING REVENUE BUDGET - HIGHLIGHTS ON MAJOR CATERGORIES
For the Municipal Entity to continue with its quality service provision, it has to sustain high
revenue collection levels and add other sustainable sources in the revenue streams. In
the budget year the entity will seek to add other energy sources in its distribution licence.
The total revenue budget is projected at R 2,852 billion in 2020/21, representing a increase
in revenue of R 30 million (1,10%) on the 2019/20 Adjustments Budget of R 2,820 billion.
The allocation for the outer two years of the MTREF period is R 2,891 billion and R 3,031
billion respectively. Revenue generated from services charges forms a significant part of
the revenue basket of the Entity. Services charges constitutes 97% (2019/20 - 95%) of the
budgeted revenue (excluding capital grants and transfers) in the 2020/21 budget year.
MTREF 2020/21 – 2022/23
10
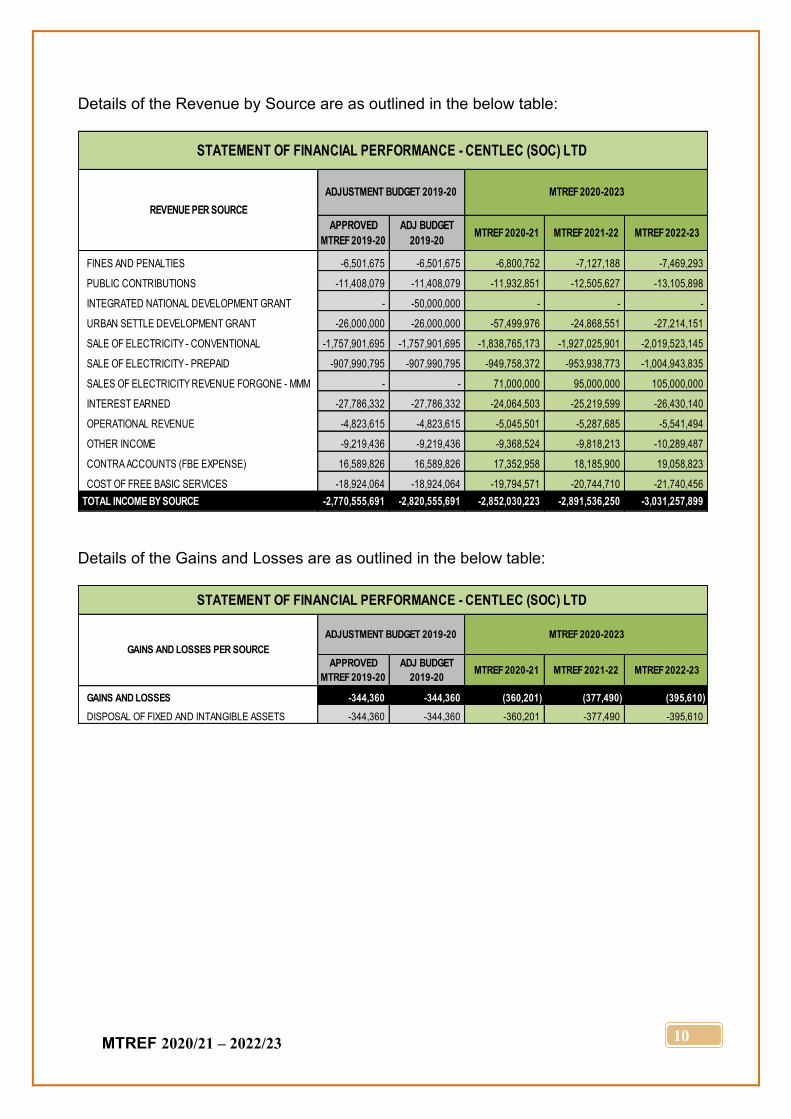
Details of the Revenue by Source are as outlined in the below table:
Details of the Gains and Losses are as outlined in the below table:
APPROVED
MTREF 2019-20
ADJ BUDGET
2019-20 MTREF 2020-21 MTREF 2021-22 MTREF 2022-23
FINES AND PENALTIES -6,501,675 -6,501,675 -6,800,752 -7,127,188 -7,469,293
PUBLIC CONTRIBUTIONS -11,408,079 -11,408,079 -11,932,851 -12,505,627 -13,105,898
INTEGRATED NATIONAL DEVELOPMENT GRANT - -50,000,000 - - -
URBAN SETTLE DEVELOPMENT GRANT -26,000,000 -26,000,000 -57,499,976 -24,868,551 -27,214,151
SALE OF ELECTRICITY - CONVENTIONAL -1,757,901,695 -1,757,901,695 -1,838,765,173 -1,927,025,901 -2,019,523,145
SALE OF ELECTRICITY - PREPAID -907,990,795 -907,990,795 -949,758,372 -953,938,773 -1,004,943,835
SALES OF ELECTRICITY REVENUE FORGONE - MMM - - 71,000,000 95,000,000 105,000,000
INTEREST EARNED -27,786,332 -27,786,332 -24,064,503 -25,219,599 -26,430,140
OPERATIONAL REVENUE -4,823,615 -4,823,615 -5,045,501 -5,287,685 -5,541,494
OTHER INCOME -9,219,436 -9,219,436 -9,368,524 -9,818,213 -10,289,487
CONTRA ACCOUNTS (FBE EXPENSE) 16,589,826 16,589,826 17,352,958 18,185,900 19,058,823
COST OF FREE BASIC SERVICES -18,924,064 -18,924,064 -19,794,571 -20,744,710 -21,740,456
TOTAL INCOME BY SOURCE -2,770,555,691 -2,820,555,691 -2,852,030,223 -2,891,536,250 -3,031,257,899
STATEMENT OF FINANCIAL PERFORMANCE - CENTLEC (SOC) LTD
REVENUE PER SOURCE
ADJUSTMENT BUDGET 2019-20 MTREF 2020-2023
APPROVED
MTREF 2019-20
ADJ BUDGET
2019-20 MTREF 2020-21 MTREF 2021-22 MTREF 2022-23
GAINS AND LOSSES -344,360 -344,360 (360,201) (377,490) (395,610)
DISPOSAL OF FIXED AND INTANGIBLE ASSETS -344,360 -344,360 -360,201 -377,490 -395,610
GAINS AND LOSSES PER SOURCE
ADJUSTMENT BUDGET 2019-20 MTREF 2020-2023
STATEMENT OF FINANCIAL PERFORMANCE - CENTLEC (SOC) LTD
MTREF 2020/21 – 2022/23
11
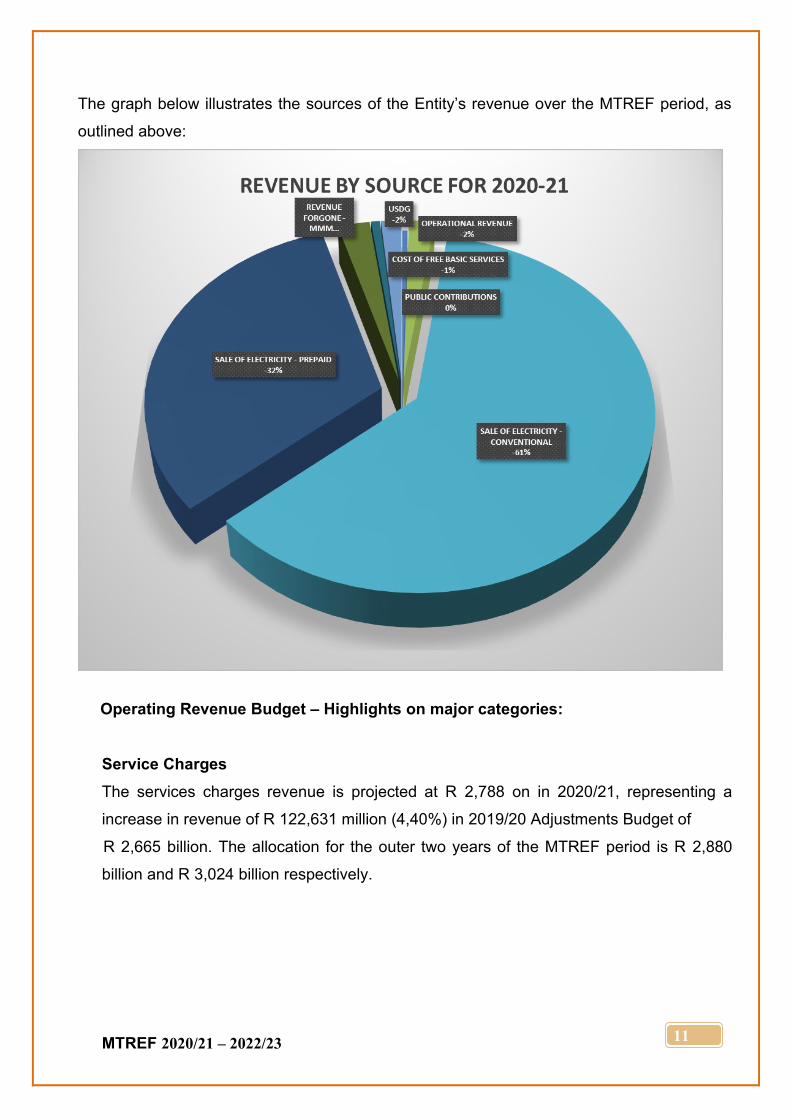
The graph below illustrates the sources of the Entity’s revenue over the MTREF period, as
outlined above:
Operating Revenue Budget – Highlights on major categories:
Service Charges
The services charges revenue is projected at R 2,788 on in 2020/21, representing a
increase in revenue of R 122,631 million (4,40%) in 2019/20 Adjustments Budget of
R 2,665 billion. The allocation for the outer two years of the MTREF period is R 2,880
billion and R 3,024 billion respectively.
MTREF 2020/21 – 2022/23
12
Equitable Share from the Parent Municipality (FBE)
Included in the budgeted revenue of R 2,852 billion, is free basic electricity from the Parent
Municipality totalling to R 19,794 million for the 2020/21. The allocations for the 2021/22
and 2022/23 budget years are R 20,744 million and R 21,740 million respectively. This
derives from the indigent register of the Parent Municipality.
Capital Grants and Subsidies (USDG)
Capital grants from the Provincial and National Governments amounts to R 57,500 million
for 2020/21. The allocations for the 2021/22 is R 24,869 and R 27,214 million in 2022/23.
The conditional grants allocation anticipating as gazetted, constitutes 2,02% of the
budgeted revenue for the 2020/21 budget year.
B. OPERATING EXPENDITURE The Municipal Entity’s expenditure for the 2020/21 budget and MTREF is informed by the
following:
• Modelling of feasible and sustainable budgets over the medium term;
• National Treasury guidelines;
• NERSA tariffs guideline
• Growth in the City and continued economic development;
• Cognisance of national and local economic and fiscal conditions;
• Expenditure limits driven by realistic and realisable revenue levels;
• Relevant (budget and other) legislative imperatives.
The operating expenditure budget increases from the adjustments budget amount of R 2,255
billion in 2019/20 to a new consolidated budget amount of R 2,462 billion (representing an
increase of 8,40% (R 206,851 million) in 2020/21. The allocation of the outer two years of the
MTREF period is R 2,582 billion and R 2,736 billion respectively.
MTREF 2020/21 – 2022/23
13
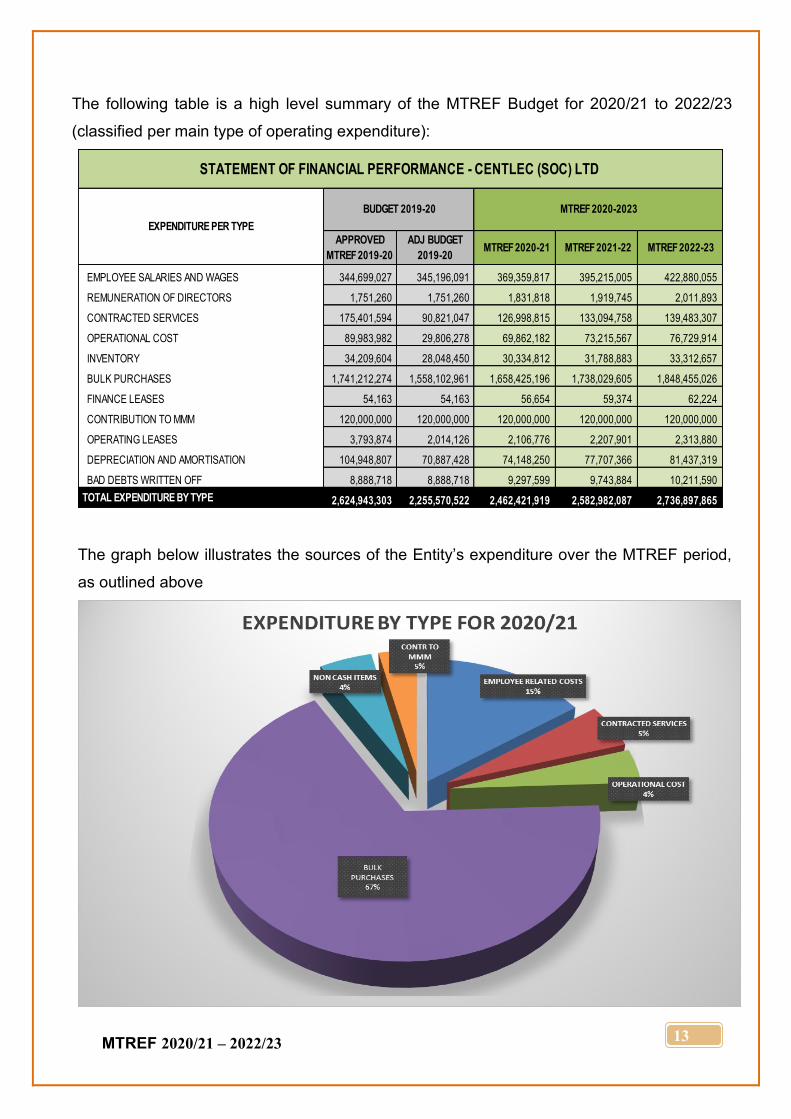
The following table is a high level summary of the MTREF Budget for 2020/21 to 2022/23
(classified per main type of operating expenditure):
The graph below illustrates the sources of the Entity’s expenditure over the MTREF period,
as outlined above
APPROVED
MTREF 2019-20
ADJ BUDGET
2019-20 MTREF 2020-21 MTREF 2021-22 MTREF 2022-23
EMPLOYEE SALARIES AND WAGES 344,699,027 345,196,091 369,359,817 395,215,005 422,880,055
REMUNERATION OF DIRECTORS 1,751,260 1,751,260 1,831,818 1,919,745 2,011,893
CONTRACTED SERVICES 175,401,594 90,821,047 126,998,815 133,094,758 139,483,307
OPERATIONAL COST 89,983,982 29,806,278 69,862,182 73,215,567 76,729,914
INVENTORY 34,209,604 28,048,450 30,334,812 31,788,883 33,312,657
BULK PURCHASES 1,741,212,274 1,558,102,961 1,658,425,196 1,738,029,605 1,848,455,026
FINANCE LEASES 54,163 54,163 56,654 59,374 62,224
CONTRIBUTION TO MMM 120,000,000 120,000,000 120,000,000 120,000,000 120,000,000
OPERATING LEASES 3,793,874 2,014,126 2,106,776 2,207,901 2,313,880
DEPRECIATION AND AMORTISATION 104,948,807 70,887,428 74,148,250 77,707,366 81,437,319
BAD DEBTS WRITTEN OFF 8,888,718 8,888,718 9,297,599 9,743,884 10,211,590
TOTAL EXPENDITURE BY TYPE 2,624,943,303 2,255,570,522 2,462,421,919 2,582,982,087 2,736,897,865
STATEMENT OF FINANCIAL PERFORMANCE - CENTLEC (SOC) LTD
EXPENDITURE PER TYPE
BUDGET 2019-20 MTREF 2020-2023
MTREF 2020/21 – 2022/23
14
Highlights on major categories: Salaries, Wages and Allowances:
Personnel costs increase by an average 7%, or R 24,163 million from the 2019/20
Adjustments Budget of R 345,196 million to R 369,359 million in 2020/21. The main reason
for the increase is the normal annual average increase. This expenditure category
constitutes 16% of the operating expenditure budget. The allocation for the two outer years
of the MTREF period is R 395,215 million and R 422,880 million respectively.
Remuneration of Directors:
The budget of this line item is aligned to the Council determination resolution. The 2019/20
Adjustments budget of R 1,751 million to R 1,831 million in 2020/21. The allocation for the
two outer years of the MTREF period is R 1,919 million and R 2,011 million respectively.
The cost associated with the remuneration of directors is determined as per Councillor
Determination of the Parent Municipality. Further details regarding the remuneration of
Directors can be obtained on the Supporting Table SD4.
Operational Cost
The operational cost increased with R 40,055 million from the 2019/20 Adjustments Budget
of R 29,806 million to R 69,862 million in the 2020/21 budget year. The allocation for the
two outer years of the MTREF period is R 73,215 million and R 76,729 million respectively.
Bulk Purchases
Bulk purchases increased by 6%, R 1,558 billion against the 2019/20 Adjustments budget,
to the proposed amount of R 1,658 billion for the 2020/21 budget year. The allocation for
the two outer years of the MTREF period is R 1,738 billion and R 1,848 billion respectively.
Bulk purchases constitute approximately 67% of the operating expenditure budget for
2020/21. The proposed growth is as tariffs initially approved by NERSA for supplier Eskom.
MTREF 2020/21 – 2022/23
15
Contracted Services
Contracted Services increased by R 36,177 million to R 126,998 billion in the 2020/21
budget year from a base of R 90,821 million in the 2019/20 Adjustments budget. The
allocation for the two outer years of the MTREF period is R 133,094 million and
R 139,483 million respectively.
Inventory
The budgeted inventory increased with 8% to an amount of R 30,334 million for 2020/21
(Adjustments Budget 2019/20 - R 28,048 million). The indicative allocated amount for the
two outer years of the MTREF period is R 31,788 million and R 33,312 million respectively.
Operating and Finance leases
The budgeted operating leases amount is R 2,163 million for 2020/21 (Adjustments Budget
2019/20 - R 2,068 million). The indicative allocated amount for the two outer years of the
MTREF period is R 2,267 million and R 2,376 million respectively.
Depreciation
The budgeted depreciation amount is R 74,148 million for 2020/21 (Adjustments Budget
2019/20 - R 70,887 million). The indicative allocated amount for the two outer years of the
MTREF period is R 77,707 million and R 81,437 million respectively.
Transfer to Bad Debt Reserve
The budget amount for bad debt impairment is R 9,297 million in 2020/21. The indicative
allocated amount for the two outer years of the MTREF period is R 9,743 million and
R 10,211 million respectively. This figures are conservative and it is management’s view
that it shall strive to maximize collection under the current economic conditions in order to
maintain the required result. Should this position change figures will be adjusted
accordingly.
MTREF 2020/21 – 2022/23
16
C. CAPITAL BUDGET The capital budget increased by R 50,566 million for the 2020/21 financial year to
R 169,724 million as compared to the approved Adjustments Budget of R 119,158 million
for the 2019/20 period. The projected capital expenditure budget for the two outer years of
the MTREF period has been set at R 124,041 million and R 129,048 million respectively.
The budget is funded mainly from internally generated sources augmented by conditional
grant for electrification.
CAPITAL FUNDING BY SOURCE
Funding of the capital budget for the new budget cycle is as outlined below:
Conditional Grant Funding
The main projects to be undertaken out of the (INEP & USDG Funding) allocation are as
outlined on the table below:
Public Contributions
The public contributions allocation is as outlined on the table below:
FUNDING BY SOURCE APPROVED
BUDGET 2019/20
ADJ BUDGET
2019/20
MTREF
2020/2021
MTREF
2021/2022
MTREF
2022/2023
Urban Settlement Development Grant 26,000,000 26,000,000 57,499,976 24,868,551 27,214,151
Public Contributions 11,408,079 11,408,079 11,932,851 12,505,627 13,105,898
Revenue / Surplus (Internal funds) 108,230,742 81,750,742 100,292,173 86,667,197 88,728,085
TOTAL 145,638,821 119,158,821 169,724,999 124,041,376 129,048,133
INTEGRATED NATIONAL ELECTRIFICATION GRANT APPROVED
BUDGET 2019/20
ADJ BUDGET
2019/20
MTREF
2020/2021
MTREF
2021/2022
MTREF
2022/2023
ELECTRIFICATION CONNECTIONS (USDG) 26,000,000 26,000,000 57,499,976 24,868,551 27,214,151
TOTAL 26,000,000 26,000,000 57,499,976 24,868,551 27,214,151
PUBLIC CONNECTIONS APPROVED
BUDGET 2019/20
ADJ BUDGET
2019/20
MTREF
2020/2021
MTREF
2021/2022
MTREF
2022/2023
PUBLIC ELECTRICITY CONNECTIONS 11,408,079 11,408,079 11,932,851 12,505,627 13,105,898
TOTAL 11,408,079 11,408,079 11,932,851 12,505,627 13,105,898
MTREF 2020/21 – 2022/23
17
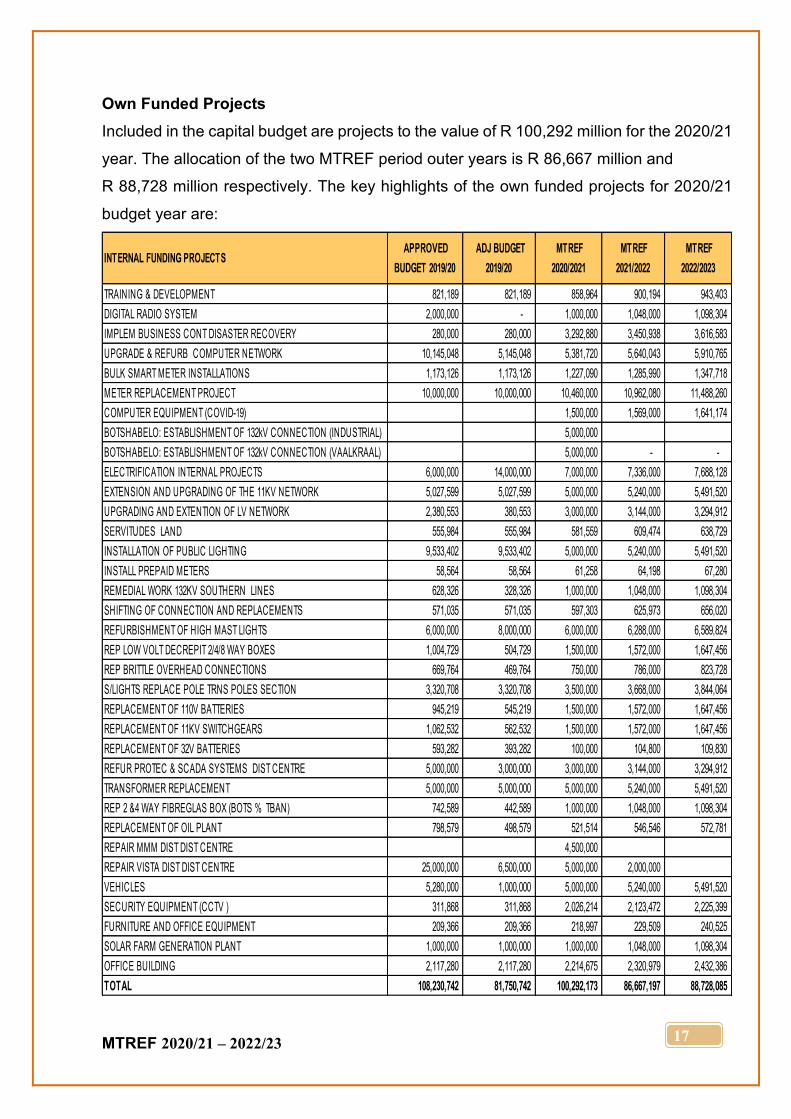
Own Funded Projects
Included in the capital budget are projects to the value of R 100,292 million for the 2020/21
year. The allocation of the two MTREF period outer years is R 86,667 million and
R 88,728 million respectively. The key highlights of the own funded projects for 2020/21
budget year are:
INTERNAL FUNDING PROJECTS APPROVED
BUDGET 2019/20
ADJ BUDGET
2019/20
MTREF
2020/2021
MTREF
2021/2022
MTREF
2022/2023
TRAINING & DEVELOPMENT 821,189 821,189 858,964 900,194 943,403
DIGITAL RADIO SYSTEM 2,000,000 - 1,000,000 1,048,000 1,098,304
IMPLEM BUSINESS CONT DISASTER RECOVERY 280,000 280,000 3,292,880 3,450,938 3,616,583
UPGRADE & REFURB COMPUTER NETWORK 10,145,048 5,145,048 5,381,720 5,640,043 5,910,765
BULK SMART METER INSTALLATIONS 1,173,126 1,173,126 1,227,090 1,285,990 1,347,718
METER REPLACEMENT PROJECT 10,000,000 10,000,000 10,460,000 10,962,080 11,488,260
COMPUTER EQUIPMENT (COVID-19) 1,500,000 1,569,000 1,641,174
BOTSHABELO: ESTABLISHMENT OF 132kV CONNECTION (INDUSTRIAL) 5,000,000
BOTSHABELO: ESTABLISHMENT OF 132kV CONNECTION (VAALKRAAL) 5,000,000 - -
ELECTRIFICATION INTERNAL PROJECTS 6,000,000 14,000,000 7,000,000 7,336,000 7,688,128
EXTENSION AND UPGRADING OF THE 11KV NETWORK 5,027,599 5,027,599 5,000,000 5,240,000 5,491,520
UPGRADING AND EXTENTION OF LV NETWORK 2,380,553 380,553 3,000,000 3,144,000 3,294,912
SERVITUDES LAND 555,984 555,984 581,559 609,474 638,729
INSTALLATION OF PUBLIC LIGHTING 9,533,402 9,533,402 5,000,000 5,240,000 5,491,520
INSTALL PREPAID METERS 58,564 58,564 61,258 64,198 67,280
REMEDIAL WORK 132KV SOUTHERN LINES 628,326 328,326 1,000,000 1,048,000 1,098,304
SHIFTING OF CONNECTION AND REPLACEMENTS 571,035 571,035 597,303 625,973 656,020
REFURBISHMENT OF HIGH MAST LIGHTS 6,000,000 8,000,000 6,000,000 6,288,000 6,589,824
REP LOW VOLT DECREPIT 2/4/8 WAY BOXES 1,004,729 504,729 1,500,000 1,572,000 1,647,456
REP BRITTLE OVERHEAD CONNECTIONS 669,764 469,764 750,000 786,000 823,728
S/LIGHTS REPLACE POLE TRNS POLES SECTION 3,320,708 3,320,708 3,500,000 3,668,000 3,844,064
REPLACEMENT OF 110V BATTERIES 945,219 545,219 1,500,000 1,572,000 1,647,456
REPLACEMENT OF 11KV SWITCHGEARS 1,062,532 562,532 1,500,000 1,572,000 1,647,456
REPLACEMENT OF 32V BATTERIES 593,282 393,282 100,000 104,800 109,830
REFUR PROTEC & SCADA SYSTEMS DIST CENTRE 5,000,000 3,000,000 3,000,000 3,144,000 3,294,912
TRANSFORMER REPLACEMENT 5,000,000 5,000,000 5,000,000 5,240,000 5,491,520
REP 2 &4 WAY FIBREGLAS BOX (BOTS % TBAN) 742,589 442,589 1,000,000 1,048,000 1,098,304
REPLACEMENT OF OIL PLANT 798,579 498,579 521,514 546,546 572,781
REPAIR MMM DIST DIST CENTRE 4,500,000
REPAIR VISTA DIST DIST CENTRE 25,000,000 6,500,000 5,000,000 2,000,000
VEHICLES 5,280,000 1,000,000 5,000,000 5,240,000 5,491,520
SECURITY EQUIPMENT (CCTV ) 311,868 311,868 2,026,214 2,123,472 2,225,399
FURNITURE AND OFFICE EQUIPMENT 209,366 209,366 218,997 229,509 240,525
SOLAR FARM GENERATION PLANT 1,000,000 1,000,000 1,000,000 1,048,000 1,098,304
OFFICE BUILDING 2,117,280 2,117,280 2,214,675 2,320,979 2,432,386
TOTAL 108,230,742 81,750,742 100,292,173 86,667,197 88,728,085
MTREF 2020/21 – 2022/23
18
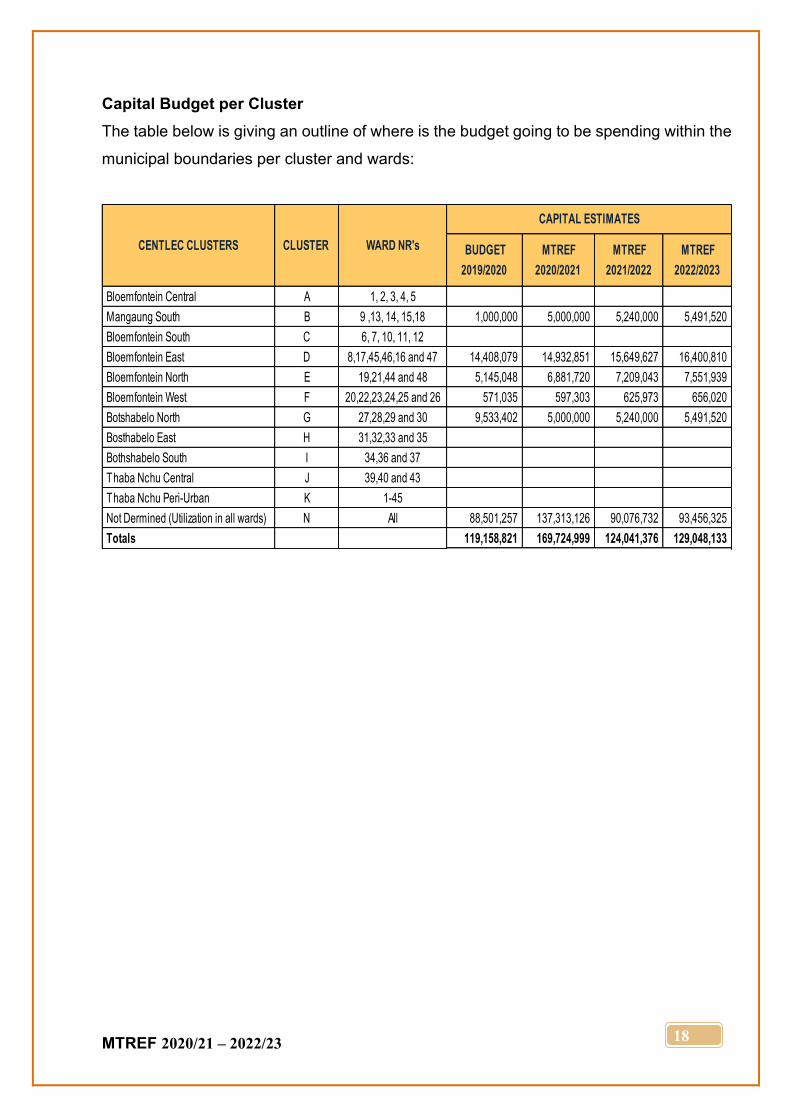
Capital Budget per Cluster
The table below is giving an outline of where is the budget going to be spending within the
municipal boundaries per cluster and wards:
BUDGET
2019/2020
MTREF
2020/2021
MTREF
2021/2022
MTREF
2022/2023
Bloemfontein Central A 1, 2, 3, 4, 5
Mangaung South B 9 ,13, 14, 15,18 1,000,000 5,000,000 5,240,000 5,491,520
Bloemfontein South C 6, 7, 10, 11, 12
Bloemfontein East D 8,17,45,46,16 and 47 14,408,079 14,932,851 15,649,627 16,400,810
Bloemfontein North E 19,21,44 and 48 5,145,048 6,881,720 7,209,043 7,551,939
Bloemfontein West F 20,22,23,24,25 and 26 571,035 597,303 625,973 656,020
Botshabelo North G 27,28,29 and 30 9,533,402 5,000,000 5,240,000 5,491,520
Bosthabelo East H 31,32,33 and 35
Bothshabelo South I 34,36 and 37
Thaba Nchu Central J 39,40 and 43
Thaba Nchu Peri-Urban K 1-45
Not Dermined (Utilization in all wards) N All 88,501,257 137,313,126 90,076,732 93,456,325
Totals 119,158,821 169,724,999 124,041,376 129,048,133
CLUSTER WARD NR'sCENTLEC CLUSTERS
CAPITAL ESTIMATES
MTREF 2020/21 – 2022/23
19
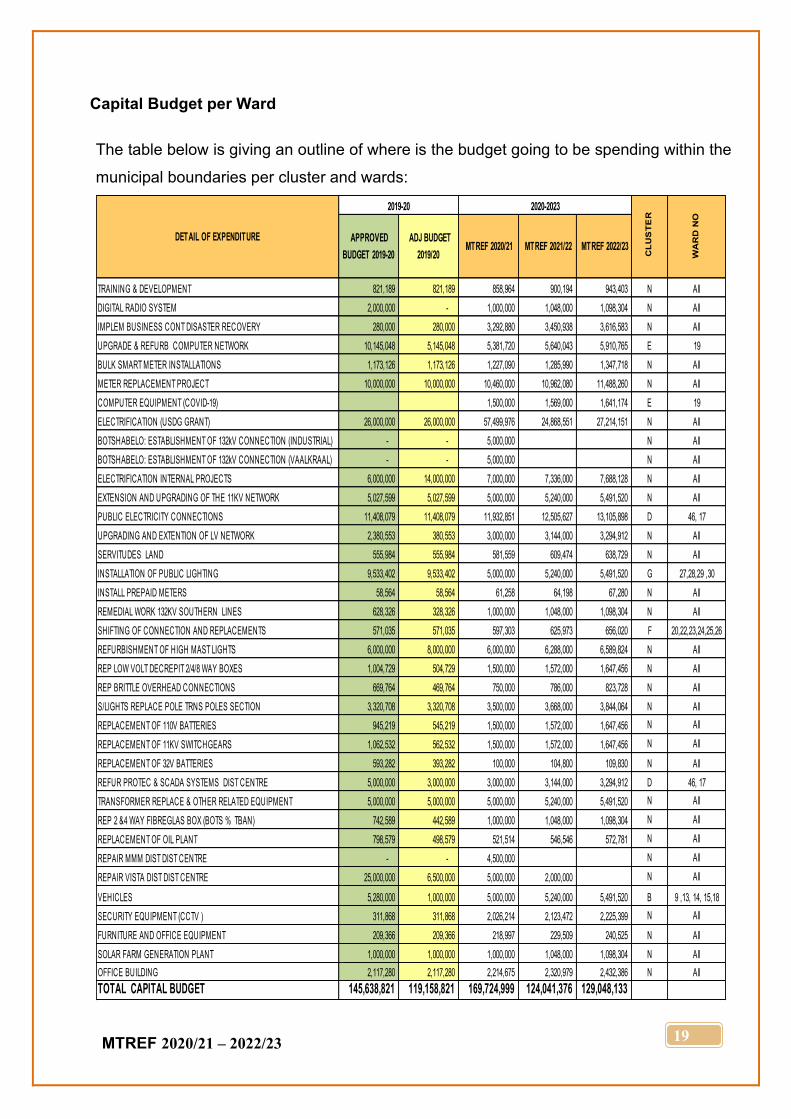
Capital Budget per Ward
The table below is giving an outline of where is the budget going to be spending within the
municipal boundaries per cluster and wards:
APPROVED
BUDGET 2019-20
ADJ BUDGET
2019/20 MTREF 2020/21 MTREF 2021/22 MTREF 2022/23
TRAINING & DEVELOPMENT 821,189 821,189 858,964 900,194 943,403 N All
DIGITAL RADIO SYSTEM 2,000,000 - 1,000,000 1,048,000 1,098,304 N All
IMPLEM BUSINESS CONT DISASTER RECOVERY 280,000 280,000 3,292,880 3,450,938 3,616,583 N All
UPGRADE & REFURB COMPUTER NETWORK 10,145,048 5,145,048 5,381,720 5,640,043 5,910,765 E 19
BULK SMART METER INSTALLATIONS 1,173,126 1,173,126 1,227,090 1,285,990 1,347,718 N All
METER REPLACEMENT PROJECT 10,000,000 10,000,000 10,460,000 10,962,080 11,488,260 N All
COMPUTER EQUIPMENT (COVID-19) 1,500,000 1,569,000 1,641,174 E 19
ELECTRIFICATION (USDG GRANT) 26,000,000 26,000,000 57,499,976 24,868,551 27,214,151 N All
BOTSHABELO: ESTABLISHMENT OF 132kV CONNECTION (INDUSTRIAL) - - 5,000,000 N All
BOTSHABELO: ESTABLISHMENT OF 132kV CONNECTION (VAALKRAAL) - - 5,000,000 N All
ELECTRIFICATION INTERNAL PROJECTS 6,000,000 14,000,000 7,000,000 7,336,000 7,688,128 N All
EXTENSION AND UPGRADING OF THE 11KV NETWORK 5,027,599 5,027,599 5,000,000 5,240,000 5,491,520 N All
PUBLIC ELECTRICITY CONNECTIONS 11,408,079 11,408,079 11,932,851 12,505,627 13,105,898 D 46, 17
UPGRADING AND EXTENTION OF LV NETWORK 2,380,553 380,553 3,000,000 3,144,000 3,294,912 N All
SERVITUDES LAND 555,984 555,984 581,559 609,474 638,729 N All
INSTALLATION OF PUBLIC LIGHTING 9,533,402 9,533,402 5,000,000 5,240,000 5,491,520 G 27,28,29 ,30
INSTALL PREPAID METERS 58,564 58,564 61,258 64,198 67,280 N All
REMEDIAL WORK 132KV SOUTHERN LINES 628,326 328,326 1,000,000 1,048,000 1,098,304 N All
SHIFTING OF CONNECTION AND REPLACEMENTS 571,035 571,035 597,303 625,973 656,020 F 20,22,23,24,25,26
REFURBISHMENT OF HIGH MAST LIGHTS 6,000,000 8,000,000 6,000,000 6,288,000 6,589,824 N All
REP LOW VOLT DECREPIT 2/4/8 WAY BOXES 1,004,729 504,729 1,500,000 1,572,000 1,647,456 N All
REP BRITTLE OVERHEAD CONNECTIONS 669,764 469,764 750,000 786,000 823,728 N All
S/LIGHTS REPLACE POLE TRNS POLES SECTION 3,320,708 3,320,708 3,500,000 3,668,000 3,844,064 N All
REPLACEMENT OF 110V BATTERIES 945,219 545,219 1,500,000 1,572,000 1,647,456 N All
REPLACEMENT OF 11KV SWITCHGEARS 1,062,532 562,532 1,500,000 1,572,000 1,647,456 N All
REPLACEMENT OF 32V BATTERIES 593,282 393,282 100,000 104,800 109,830 N All
REFUR PROTEC & SCADA SYSTEMS DIST CENTRE 5,000,000 3,000,000 3,000,000 3,144,000 3,294,912 D 46, 17
TRANSFORMER REPLACE & OTHER RELATED EQUIPMENT 5,000,000 5,000,000 5,000,000 5,240,000 5,491,520 N All
REP 2 &4 WAY FIBREGLAS BOX (BOTS % TBAN) 742,589 442,589 1,000,000 1,048,000 1,098,304 N All
REPLACEMENT OF OIL PLANT 798,579 498,579 521,514 546,546 572,781 N All
REPAIR MMM DIST DIST CENTRE - - 4,500,000 N All
REPAIR VISTA DIST DIST CENTRE 25,000,000 6,500,000 5,000,000 2,000,000 N All
VEHICLES 5,280,000 1,000,000 5,000,000 5,240,000 5,491,520 B 9 ,13, 14, 15,18
SECURITY EQUIPMENT (CCTV ) 311,868 311,868 2,026,214 2,123,472 2,225,399 N All
FURNITURE AND OFFICE EQUIPMENT 209,366 209,366 218,997 229,509 240,525 N All
SOLAR FARM GENERATION PLANT 1,000,000 1,000,000 1,000,000 1,048,000 1,098,304 N All
OFFICE BUILDING 2,117,280 2,117,280 2,214,675 2,320,979 2,432,386 N All
TOTAL CAPITAL BUDGET 145,638,821 119,158,821 169,724,999 124,041,376 129,048,133
DETAIL OF EXPENDITURE
CL
US
TE
R
WA
RD
NO
2019-20 2020-2023
MTREF 2020/21 – 2022/23
20
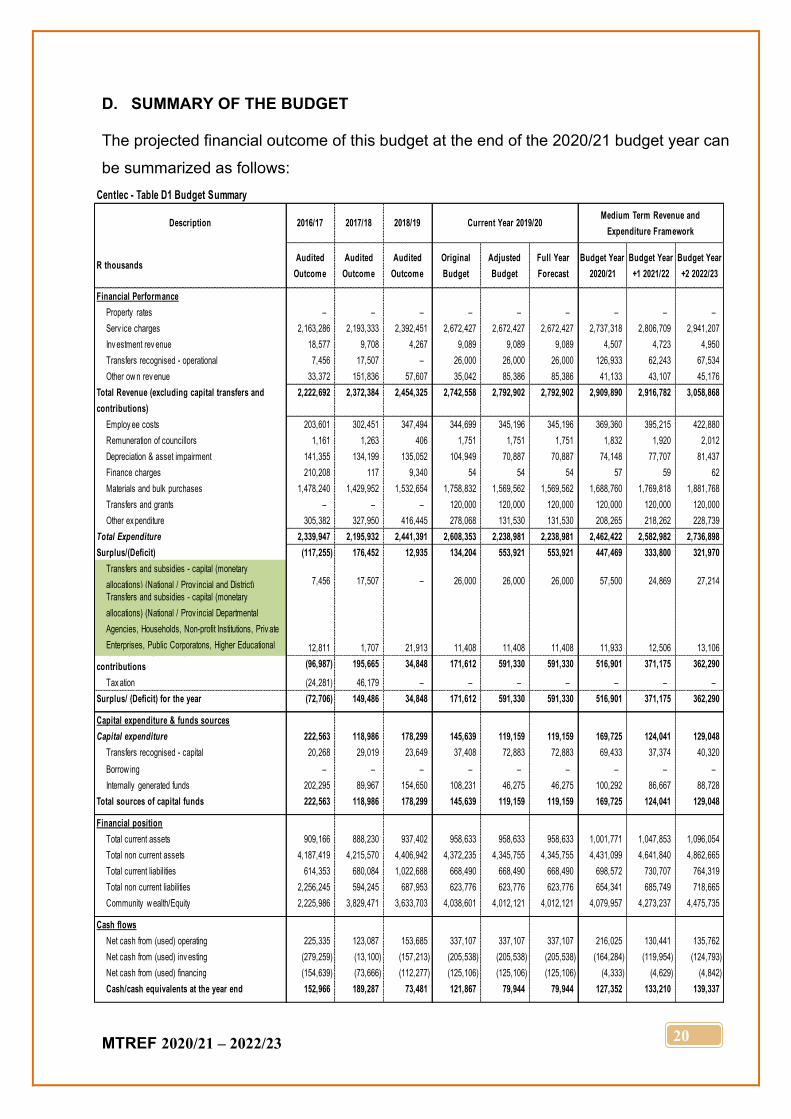
D. SUMMARY OF THE BUDGET The projected financial outcome of this budget at the end of the 2020/21 budget year can
be summarized as follows:
Centlec - Table D1 Budget Summary
Description 2016/17 2017/18 2018/19 Current Year 2019/20Medium Term Revenue and
Expenditure Framework
R thousandsAudited
Outcome
Audited
Outcome
Audited
Outcome
Original
Budget
Adjusted
Budget
Full Year
Forecast
Budget Year
2020/21
Budget Year
+1 2021/22
Budget Year
+2 2022/23
Financial Performance
Property rates – – – – – – – – –
Serv ice charges 2,163,286 2,193,333 2,392,451 2,672,427 2,672,427 2,672,427 2,737,318 2,806,709 2,941,207
Inv estment rev enue 18,577 9,708 4,267 9,089 9,089 9,089 4,507 4,723 4,950
Transfers recognised - operational 7,456 17,507 – 26,000 26,000 26,000 126,933 62,243 67,534
Other ow n rev enue 33,372 151,836 57,607 35,042 85,386 85,386 41,133 43,107 45,176
Total Revenue (excluding capital transfers and
contributions)
2,222,692 2,372,384 2,454,325 2,742,558 2,792,902 2,792,902 2,909,890 2,916,782 3,058,868
Employ ee costs 203,601 302,451 347,494 344,699 345,196 345,196 369,360 395,215 422,880
Remuneration of councillors 1,161 1,263 406 1,751 1,751 1,751 1,832 1,920 2,012
Depreciation & asset impairment 141,355 134,199 135,052 104,949 70,887 70,887 74,148 77,707 81,437
Finance charges 210,208 117 9,340 54 54 54 57 59 62
Materials and bulk purchases 1,478,240 1,429,952 1,532,654 1,758,832 1,569,562 1,569,562 1,688,760 1,769,818 1,881,768
Transfers and grants – – – 120,000 120,000 120,000 120,000 120,000 120,000
Other ex penditure 305,382 327,950 416,445 278,068 131,530 131,530 208,265 218,262 228,739
Total Expenditure 2,339,947 2,195,932 2,441,391 2,608,353 2,238,981 2,238,981 2,462,422 2,582,982 2,736,898
Surplus/(Deficit) (117,255) 176,452 12,935 134,204 553,921 553,921 447,469 333,800 321,970
Transfers and subsidies - capital (monetary
allocations) (National / Prov incial and District) 7,456 17,507 – 26,000 26,000 26,000 57,500 24,869 27,214
Transfers and subsidies - capital (monetary
allocations) (National / Prov incial Departmental
Agencies, Households, Non-profit Institutions, Priv ate
Enterprises, Public Corporatons, Higher Educational
Institutions) & Transfers and subsidies - capital (in-
12,811 1,707 21,913 11,408 11,408 11,408 11,933 12,506 13,106 Surplus/(Deficit) after capital transfers &
contributions (96,987) 195,665 34,848 171,612 591,330 591,330 516,901 371,175 362,290
Tax ation (24,281) 46,179 – – – – – – –
Surplus/ (Deficit) for the year (72,706) 149,486 34,848 171,612 591,330 591,330 516,901 371,175 362,290
Capital expenditure & funds sources
Capital expenditure 222,563 118,986 178,299 145,639 119,159 119,159 169,725 124,041 129,048
Transfers recognised - capital 20,268 29,019 23,649 37,408 72,883 72,883 69,433 37,374 40,320
Borrow ing – – – – – – – – –
Internally generated funds 202,295 89,967 154,650 108,231 46,275 46,275 100,292 86,667 88,728
Total sources of capital funds 222,563 118,986 178,299 145,639 119,159 119,159 169,725 124,041 129,048
Financial position
Total current assets 909,166 888,230 937,402 958,633 958,633 958,633 1,001,771 1,047,853 1,096,054
Total non current assets 4,187,419 4,215,570 4,406,942 4,372,235 4,345,755 4,345,755 4,431,099 4,641,840 4,862,665
Total current liabilities 614,353 680,084 1,022,688 668,490 668,490 668,490 698,572 730,707 764,319
Total non current liabilities 2,256,245 594,245 687,953 623,776 623,776 623,776 654,341 685,749 718,665
Community w ealth/Equity 2,225,986 3,829,471 3,633,703 4,038,601 4,012,121 4,012,121 4,079,957 4,273,237 4,475,735
Cash flows
Net cash from (used) operating 225,335 123,087 153,685 337,107 337,107 337,107 216,025 130,441 135,762
Net cash from (used) inv esting (279,259) (13,100) (157,213) (205,538) (205,538) (205,538) (164,284) (119,954) (124,793)
Net cash from (used) financing (154,639) (73,666) (112,277) (125,106) (125,106) (125,106) (4,333) (4,629) (4,842)
Cash/cash equivalents at the year end 152,966 189,287 73,481 121,867 79,944 79,944 127,352 133,210 139,337
MTREF 2020/21 – 2022/23
21
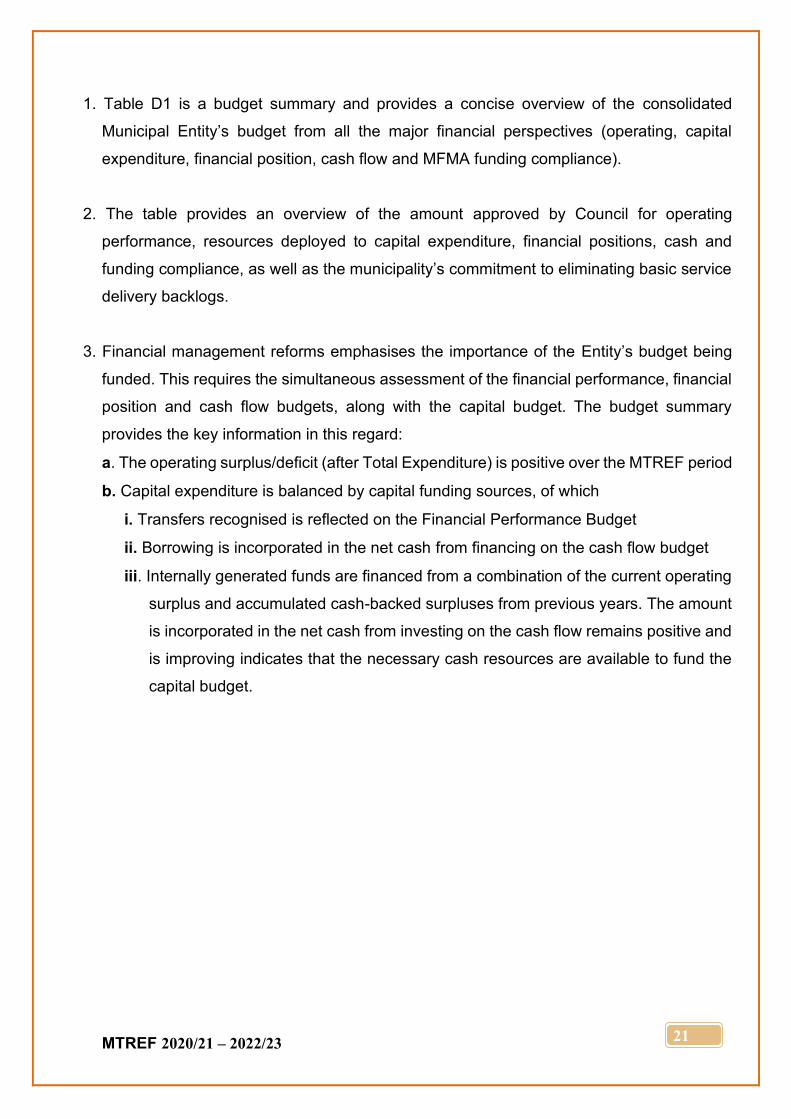
1. Table D1 is a budget summary and provides a concise overview of the consolidated
Municipal Entity’s budget from all the major financial perspectives (operating, capital
expenditure, financial position, cash flow and MFMA funding compliance).
2. The table provides an overview of the amount approved by Council for operating
performance, resources deployed to capital expenditure, financial positions, cash and
funding compliance, as well as the municipality’s commitment to eliminating basic service
delivery backlogs.
3. Financial management reforms emphasises the importance of the Entity’s budget being
funded. This requires the simultaneous assessment of the financial performance, financial
position and cash flow budgets, along with the capital budget. The budget summary
provides the key information in this regard:
a. The operating surplus/deficit (after Total Expenditure) is positive over the MTREF period
b. Capital expenditure is balanced by capital funding sources, of which
i. Transfers recognised is reflected on the Financial Performance Budget
ii. Borrowing is incorporated in the net cash from financing on the cash flow budget
iii. Internally generated funds are financed from a combination of the current operating
surplus and accumulated cash-backed surpluses from previous years. The amount
is incorporated in the net cash from investing on the cash flow remains positive and
is improving indicates that the necessary cash resources are available to fund the
capital budget.
MTREF 2020/21 – 2022/23
22
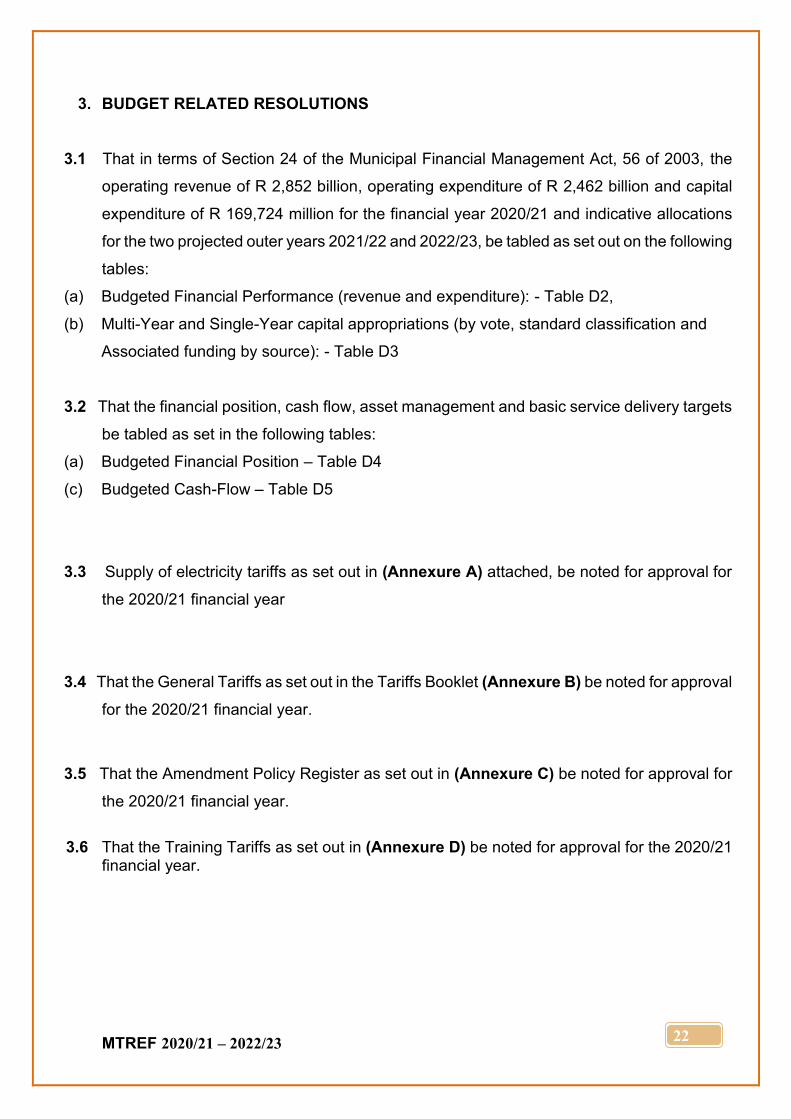
3. BUDGET RELATED RESOLUTIONS
3.1 That in terms of Section 24 of the Municipal Financial Management Act, 56 of 2003, the
operating revenue of R 2,852 billion, operating expenditure of R 2,462 billion and capital
expenditure of R 169,724 million for the financial year 2020/21 and indicative allocations
for the two projected outer years 2021/22 and 2022/23, be tabled as set out on the following
tables:
(a) Budgeted Financial Performance (revenue and expenditure): - Table D2,
(b) Multi-Year and Single-Year capital appropriations (by vote, standard classification and
Associated funding by source): - Table D3
3.2 That the financial position, cash flow, asset management and basic service delivery targets
be tabled as set in the following tables:
(a) Budgeted Financial Position – Table D4
(c) Budgeted Cash-Flow – Table D5
3.3 Supply of electricity tariffs as set out in (Annexure A) attached, be noted for approval for
the 2020/21 financial year
3.4 That the General Tariffs as set out in the Tariffs Booklet (Annexure B) be noted for approval
for the 2020/21 financial year.
3.5 That the Amendment Policy Register as set out in (Annexure C) be noted for approval for
the 2020/21 financial year.
3.6 That the Training Tariffs as set out in (Annexure D) be noted for approval for the 2020/21
financial year.
MTREF 2020/21 – 2022/23
23
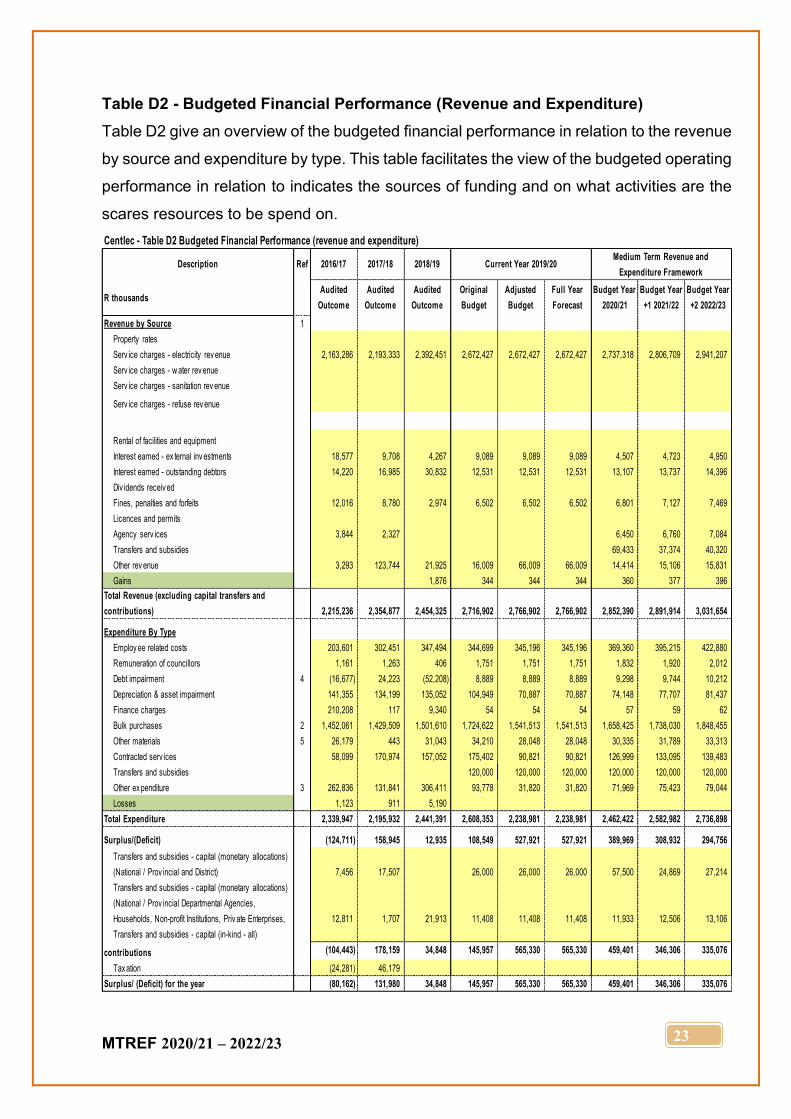
Table D2 - Budgeted Financial Performance (Revenue and Expenditure)
Table D2 give an overview of the budgeted financial performance in relation to the revenue
by source and expenditure by type. This table facilitates the view of the budgeted operating
performance in relation to indicates the sources of funding and on what activities are the
scares resources to be spend on.
Centlec - Table D2 Budgeted Financial Performance (revenue and expenditure)
Description Ref 2016/17 2017/18 2018/19 Current Year 2019/20Medium Term Revenue and
Expenditure Framework
R thousandsAudited
Outcome
Audited
Outcome
Audited
Outcome
Original
Budget
Adjusted
Budget
Full Year
Forecast
Budget Year
2020/21
Budget Year
+1 2021/22
Budget Year
+2 2022/23
Revenue by Source 1
Property rates
Serv ice charges - electricity rev enue 2,163,286 2,193,333 2,392,451 2,672,427 2,672,427 2,672,427 2,737,318 2,806,709 2,941,207
Serv ice charges - w ater rev enue
Serv ice charges - sanitation rev enue
Serv ice charges - refuse rev enue
Rental of facilities and equipment
Interest earned - ex ternal inv estments 18,577 9,708 4,267 9,089 9,089 9,089 4,507 4,723 4,950
Interest earned - outstanding debtors 14,220 16,985 30,832 12,531 12,531 12,531 13,107 13,737 14,396
Div idends receiv ed
Fines, penalties and forfeits 12,016 8,780 2,974 6,502 6,502 6,502 6,801 7,127 7,469
Licences and permits
Agency serv ices 3,844 2,327 6,450 6,760 7,084
Transfers and subsidies 69,433 37,374 40,320
Other rev enue 3,293 123,744 21,925 16,009 66,009 66,009 14,414 15,106 15,831
Gains 1,876 344 344 344 360 377 396
Total Revenue (excluding capital transfers and
contributions) 2,215,236 2,354,877 2,454,325 2,716,902 2,766,902 2,766,902 2,852,390 2,891,914 3,031,654
Expenditure By Type
Employ ee related costs 203,601 302,451 347,494 344,699 345,196 345,196 369,360 395,215 422,880
Remuneration of councillors 1,161 1,263 406 1,751 1,751 1,751 1,832 1,920 2,012
Debt impairment 4 (16,677) 24,223 (52,208) 8,889 8,889 8,889 9,298 9,744 10,212
Depreciation & asset impairment 141,355 134,199 135,052 104,949 70,887 70,887 74,148 77,707 81,437
Finance charges 210,208 117 9,340 54 54 54 57 59 62
Bulk purchases 2 1,452,061 1,429,509 1,501,610 1,724,622 1,541,513 1,541,513 1,658,425 1,738,030 1,848,455
Other materials 5 26,179 443 31,043 34,210 28,048 28,048 30,335 31,789 33,313
Contracted serv ices 58,099 170,974 157,052 175,402 90,821 90,821 126,999 133,095 139,483
Transfers and subsidies 120,000 120,000 120,000 120,000 120,000 120,000
Other ex penditure 3 262,836 131,841 306,411 93,778 31,820 31,820 71,969 75,423 79,044
Losses 1,123 911 5,190
Total Expenditure 2,339,947 2,195,932 2,441,391 2,608,353 2,238,981 2,238,981 2,462,422 2,582,982 2,736,898
Surplus/(Deficit) (124,711) 158,945 12,935 108,549 527,921 527,921 389,969 308,932 294,756
Transfers and subsidies - capital (monetary allocations)
(National / Prov incial and District) 7,456 17,507 26,000 26,000 26,000 57,500 24,869 27,214
Transfers and subsidies - capital (monetary allocations)
(National / Prov incial Departmental Agencies,
Households, Non-profit Institutions, Priv ate Enterprises, 12,811 1,707 21,913 11,408 11,408 11,408 11,933 12,506 13,106
Transfers and subsidies - capital (in-kind - all) Surplus/(Deficit) after capital transfers &
contributions (104,443) 178,159 34,848 145,957 565,330 565,330 459,401 346,306 335,076
Tax ation (24,281) 46,179
Surplus/ (Deficit) for the year (80,162) 131,980 34,848 145,957 565,330 565,330 459,401 346,306 335,076
MTREF 2020/21 – 2022/23
24
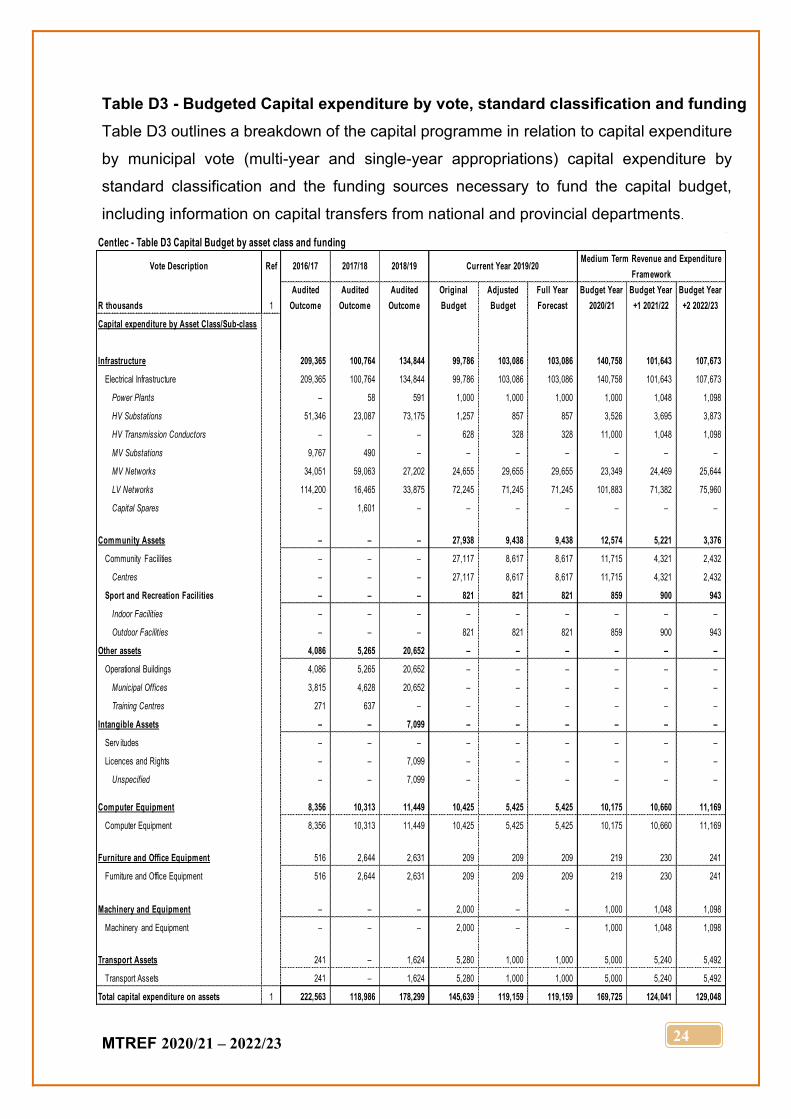
Table D3 - Budgeted Capital expenditure by vote, standard classification and funding
Table D3 outlines a breakdown of the capital programme in relation to capital expenditure
by municipal vote (multi-year and single-year appropriations) capital expenditure by
standard classification and the funding sources necessary to fund the capital budget,
including information on capital transfers from national and provincial departments.
Centlec - Table D3 Capital Budget by asset class and funding
Vote Description Ref 2016/17 2017/18 2018/19Medium Term Revenue and Expenditure
Framework
R thousands 1
Audited
Outcome
Audited
Outcome
Audited
Outcome
Original
Budget
Adjusted
Budget
Full Year
Forecast
Budget Year
2020/21
Budget Year
+1 2021/22
Budget Year
+2 2022/23
Capital expenditure by Asset Class/Sub-class
Infrastructure 209,365 100,764 134,844 99,786 103,086 103,086 140,758 101,643 107,673
Electrical Infrastructure 209,365 100,764 134,844 99,786 103,086 103,086 140,758 101,643 107,673
Power Plants – 58 591 1,000 1,000 1,000 1,000 1,048 1,098
HV Substations 51,346 23,087 73,175 1,257 857 857 3,526 3,695 3,873
HV Transmission Conductors – – – 628 328 328 11,000 1,048 1,098
MV Substations 9,767 490 – – – – – – –
MV Networks 34,051 59,063 27,202 24,655 29,655 29,655 23,349 24,469 25,644
LV Networks 114,200 16,465 33,875 72,245 71,245 71,245 101,883 71,382 75,960
Capital Spares – 1,601 – – – – – – –
Community Assets – – – 27,938 9,438 9,438 12,574 5,221 3,376
Community Facilities – – – 27,117 8,617 8,617 11,715 4,321 2,432
Centres – – – 27,117 8,617 8,617 11,715 4,321 2,432
Sport and Recreation Facilities – – – 821 821 821 859 900 943
Indoor Facilities – – – – – – – – –
Outdoor Facilities – – – 821 821 821 859 900 943
Other assets 4,086 5,265 20,652 – – – – – –
Operational Buildings 4,086 5,265 20,652 – – – – – –
Municipal Offices 3,815 4,628 20,652 – – – – – –
Training Centres 271 637 – – – – – – –
Intangible Assets – – 7,099 – – – – – –
Serv itudes – – – – – – – – –
Licences and Rights – – 7,099 – – – – – –
Unspecified – – 7,099 – – – – – –
Computer Equipment 8,356 10,313 11,449 10,425 5,425 5,425 10,175 10,660 11,169
Computer Equipment 8,356 10,313 11,449 10,425 5,425 5,425 10,175 10,660 11,169
Furniture and Office Equipment 516 2,644 2,631 209 209 209 219 230 241
Furniture and Office Equipment 516 2,644 2,631 209 209 209 219 230 241
Machinery and Equipment – – – 2,000 – – 1,000 1,048 1,098
Machinery and Equipment – – – 2,000 – – 1,000 1,048 1,098
Transport Assets 241 – 1,624 5,280 1,000 1,000 5,000 5,240 5,492
Transport Assets 241 – 1,624 5,280 1,000 1,000 5,000 5,240 5,492
Total capital expenditure on assets 1 222,563 118,986 178,299 145,639 119,159 119,159 169,725 124,041 129,048
Current Year 2019/20
MTREF 2020/21 – 2022/23
25
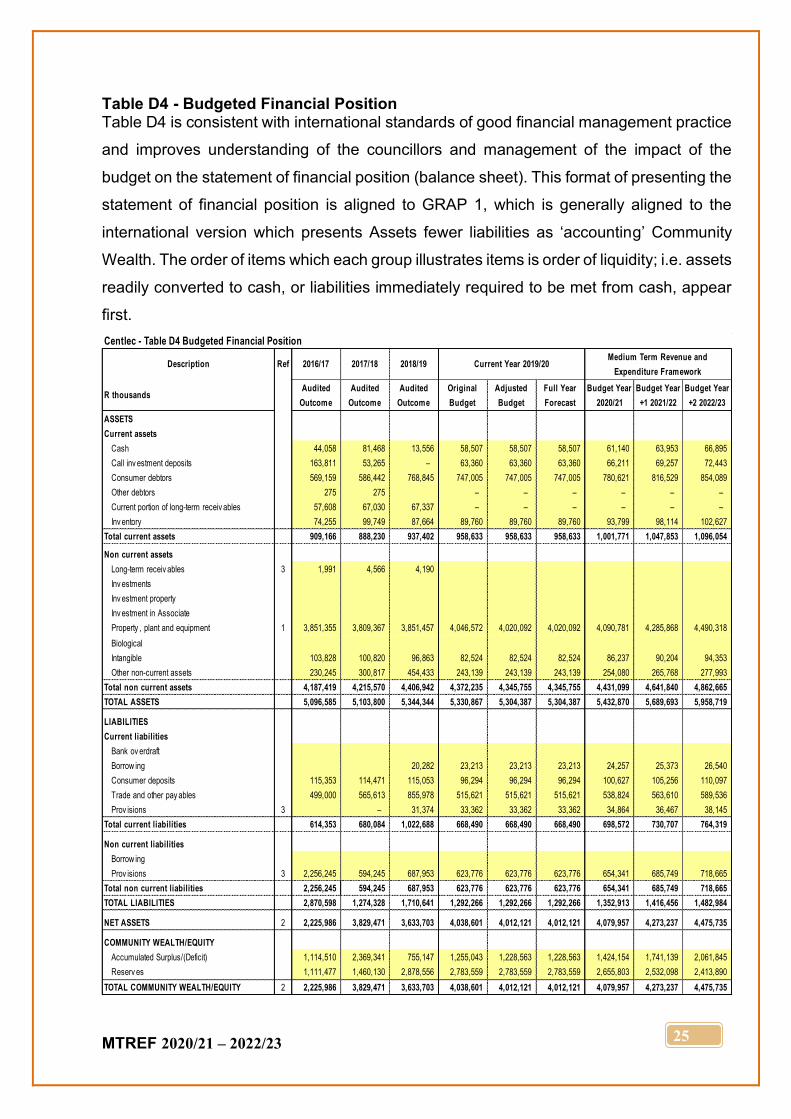
Table D4 - Budgeted Financial Position Table D4 is consistent with international standards of good financial management practice
and improves understanding of the councillors and management of the impact of the
budget on the statement of financial position (balance sheet). This format of presenting the
statement of financial position is aligned to GRAP 1, which is generally aligned to the
international version which presents Assets fewer liabilities as ‘accounting’ Community
Wealth. The order of items which each group illustrates items is order of liquidity; i.e. assets
readily converted to cash, or liabilities immediately required to be met from cash, appear
first.
Centlec - Table D4 Budgeted Financial Position
Description Ref 2016/17 2017/18 2018/19Medium Term Revenue and
Expenditure Framework
R thousandsAudited
Outcome
Audited
Outcome
Audited
Outcome
Original
Budget
Adjusted
Budget
Full Year
Forecast
Budget Year
2020/21
Budget Year
+1 2021/22
Budget Year
+2 2022/23
ASSETS
Current assets
Cash 44,058 81,468 13,556 58,507 58,507 58,507 61,140 63,953 66,895
Call inv estment deposits 163,811 53,265 – 63,360 63,360 63,360 66,211 69,257 72,443
Consumer debtors 569,159 586,442 768,845 747,005 747,005 747,005 780,621 816,529 854,089
Other debtors 275 275 – – – – – –
Current portion of long-term receiv ables 57,608 67,030 67,337 – – – – – –
Inv entory 74,255 99,749 87,664 89,760 89,760 89,760 93,799 98,114 102,627
Total current assets 909,166 888,230 937,402 958,633 958,633 958,633 1,001,771 1,047,853 1,096,054
Non current assets
Long-term receiv ables 3 1,991 4,566 4,190
Inv estments
Inv estment property
Inv estment in Associate
Property , plant and equipment 1 3,851,355 3,809,367 3,851,457 4,046,572 4,020,092 4,020,092 4,090,781 4,285,868 4,490,318
Biological
Intangible 103,828 100,820 96,863 82,524 82,524 82,524 86,237 90,204 94,353
Other non-current assets 230,245 300,817 454,433 243,139 243,139 243,139 254,080 265,768 277,993
Total non current assets 4,187,419 4,215,570 4,406,942 4,372,235 4,345,755 4,345,755 4,431,099 4,641,840 4,862,665
TOTAL ASSETS 5,096,585 5,103,800 5,344,344 5,330,867 5,304,387 5,304,387 5,432,870 5,689,693 5,958,719
LIABILITIES
Current liabilities
Bank ov erdraft
Borrow ing 20,282 23,213 23,213 23,213 24,257 25,373 26,540
Consumer deposits 115,353 114,471 115,053 96,294 96,294 96,294 100,627 105,256 110,097
Trade and other pay ables 499,000 565,613 855,978 515,621 515,621 515,621 538,824 563,610 589,536
Prov isions 3 – 31,374 33,362 33,362 33,362 34,864 36,467 38,145
Total current liabilities 614,353 680,084 1,022,688 668,490 668,490 668,490 698,572 730,707 764,319
Non current liabilities
Borrow ing
Prov isions 3 2,256,245 594,245 687,953 623,776 623,776 623,776 654,341 685,749 718,665
Total non current liabilities 2,256,245 594,245 687,953 623,776 623,776 623,776 654,341 685,749 718,665
TOTAL LIABILITIES 2,870,598 1,274,328 1,710,641 1,292,266 1,292,266 1,292,266 1,352,913 1,416,456 1,482,984
NET ASSETS 2 2,225,986 3,829,471 3,633,703 4,038,601 4,012,121 4,012,121 4,079,957 4,273,237 4,475,735
COMMUNITY WEALTH/EQUITY
Accumulated Surplus/(Deficit) 1,114,510 2,369,341 755,147 1,255,043 1,228,563 1,228,563 1,424,154 1,741,139 2,061,845
Reserv es 1,111,477 1,460,130 2,878,556 2,783,559 2,783,559 2,783,559 2,655,803 2,532,098 2,413,890
TOTAL COMMUNITY WEALTH/EQUITY 2 2,225,986 3,829,471 3,633,703 4,038,601 4,012,121 4,012,121 4,079,957 4,273,237 4,475,735
Current Year 2019/20
MTREF 2020/21 – 2022/23
26
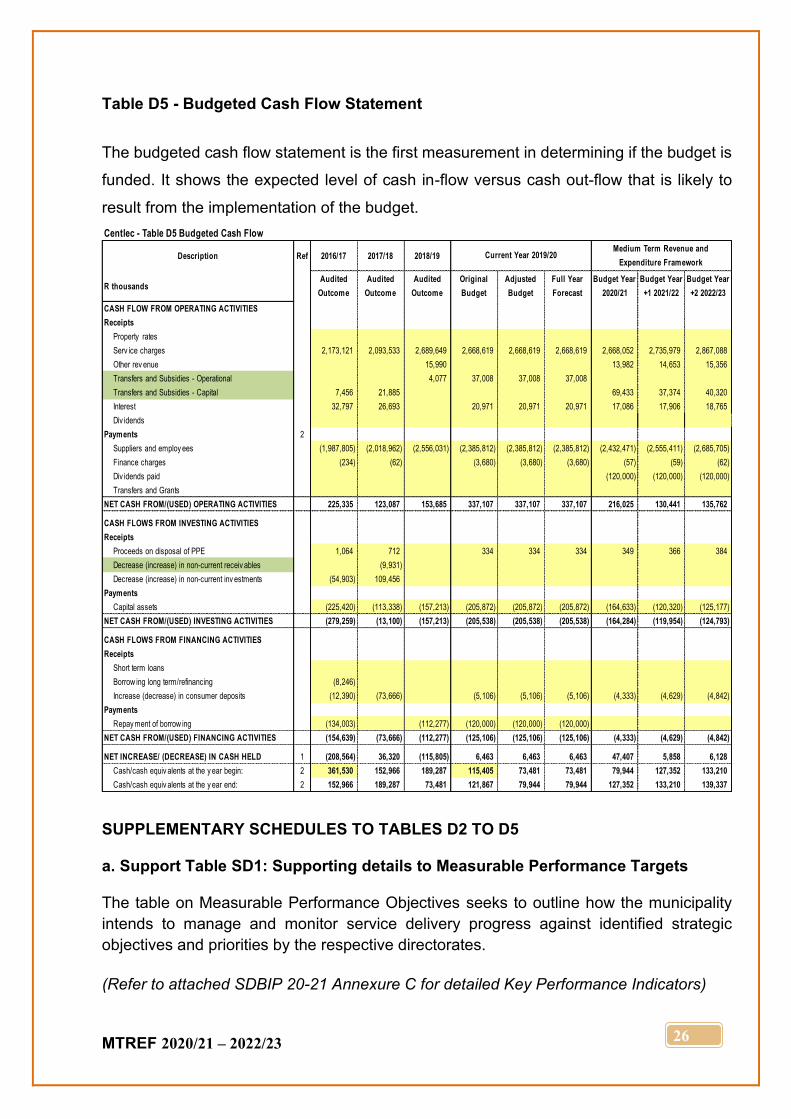
Table D5 - Budgeted Cash Flow Statement
The budgeted cash flow statement is the first measurement in determining if the budget is
funded. It shows the expected level of cash in-flow versus cash out-flow that is likely to
result from the implementation of the budget.
SUPPLEMENTARY SCHEDULES TO TABLES D2 TO D5 a. Support Table SD1: Supporting details to Measurable Performance Targets The table on Measurable Performance Objectives seeks to outline how the municipality
intends to manage and monitor service delivery progress against identified strategic
objectives and priorities by the respective directorates.
(Refer to attached SDBIP 20-21 Annexure C for detailed Key Performance Indicators)
Centlec - Table D5 Budgeted Cash Flow
Description Ref 2016/17 2017/18 2018/19Medium Term Revenue and
Expenditure Framework
R thousandsAudited
Outcome
Audited
Outcome
Audited
Outcome
Original
Budget
Adjusted
Budget
Full Year
Forecast
Budget Year
2020/21
Budget Year
+1 2021/22
Budget Year
+2 2022/23
CASH FLOW FROM OPERATING ACTIVITIES
Receipts
Property rates
Serv ice charges 2,173,121 2,093,533 2,689,649 2,668,619 2,668,619 2,668,619 2,668,052 2,735,979 2,867,088
Other rev enue 15,990 13,982 14,653 15,356
Transfers and Subsidies - Operational 4,077 37,008 37,008 37,008
Transfers and Subsidies - Capital 7,456 21,885 69,433 37,374 40,320
Interest 32,797 26,693 20,971 20,971 20,971 17,086 17,906 18,765
Div idends
Payments 2
Suppliers and employ ees (1,987,805) (2,018,962) (2,556,031) (2,385,812) (2,385,812) (2,385,812) (2,432,471) (2,555,411) (2,685,705)
Finance charges (234) (62) (3,680) (3,680) (3,680) (57) (59) (62)
Div idends paid (120,000) (120,000) (120,000)
Transfers and Grants
NET CASH FROM/(USED) OPERATING ACTIVITIES 225,335 123,087 153,685 337,107 337,107 337,107 216,025 130,441 135,762
CASH FLOWS FROM INVESTING ACTIVITIES
Receipts
Proceeds on disposal of PPE 1,064 712 334 334 334 349 366 384
Decrease (increase) in non-current receiv ables (9,931)
Decrease (increase) in non-current inv estments (54,903) 109,456
Payments
Capital assets (225,420) (113,338) (157,213) (205,872) (205,872) (205,872) (164,633) (120,320) (125,177)
NET CASH FROM/(USED) INVESTING ACTIVITIES (279,259) (13,100) (157,213) (205,538) (205,538) (205,538) (164,284) (119,954) (124,793)
CASH FLOWS FROM FINANCING ACTIVITIES
Receipts
Short term loans
Borrow ing long term/refinancing (8,246)
Increase (decrease) in consumer deposits (12,390) (73,666) (5,106) (5,106) (5,106) (4,333) (4,629) (4,842)
Payments
Repay ment of borrow ing (134,003) (112,277) (120,000) (120,000) (120,000)
NET CASH FROM/(USED) FINANCING ACTIVITIES (154,639) (73,666) (112,277) (125,106) (125,106) (125,106) (4,333) (4,629) (4,842)
NET INCREASE/ (DECREASE) IN CASH HELD 1 (208,564) 36,320 (115,805) 6,463 6,463 6,463 47,407 5,858 6,128
Cash/cash equiv alents at the y ear begin: 2 361,530 152,966 189,287 115,405 73,481 73,481 79,944 127,352 133,210
Cash/cash equiv alents at the y ear end: 2 152,966 189,287 73,481 121,867 79,944 79,944 127,352 133,210 139,337
Current Year 2019/20
MTREF 2020/21 – 2022/23
27
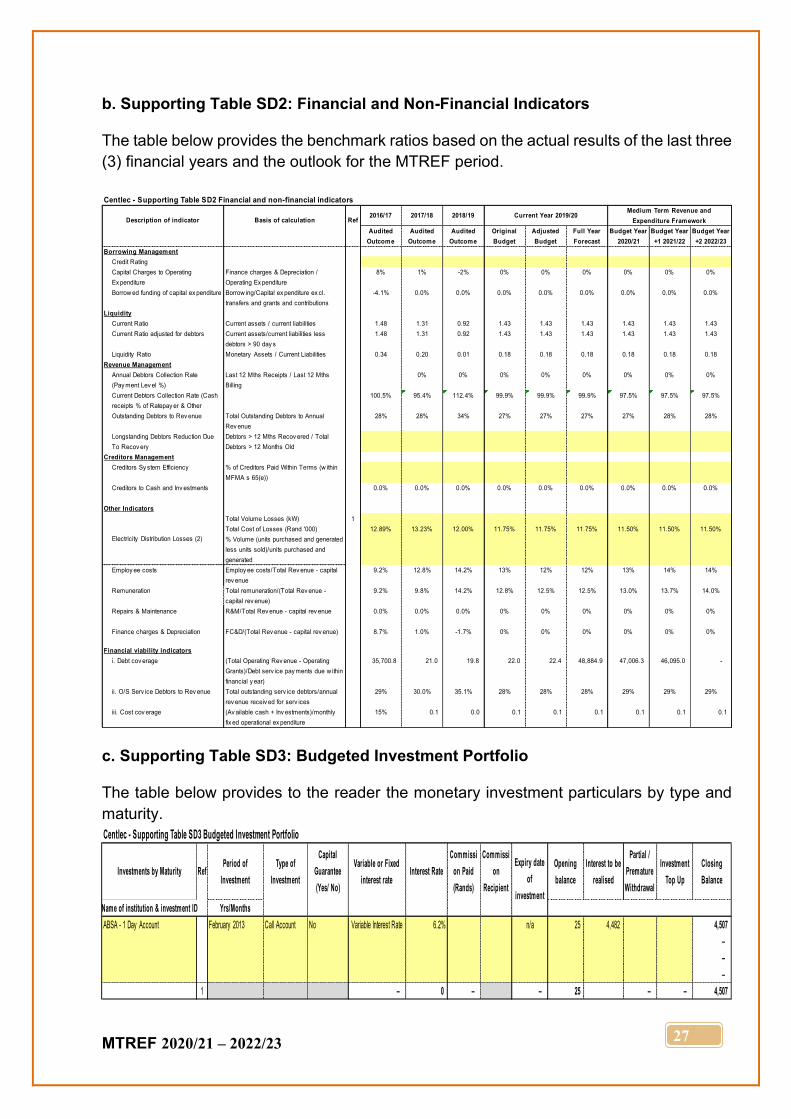
b. Supporting Table SD2: Financial and Non-Financial Indicators The table below provides the benchmark ratios based on the actual results of the last three
(3) financial years and the outlook for the MTREF period.
c. Supporting Table SD3: Budgeted Investment Portfolio The table below provides to the reader the monetary investment particulars by type and
maturity.
Centlec - Supporting Table SD2 Financial and non-financial indicators
2016/17 2017/18 2018/19Medium Term Revenue and
Expenditure Framework
Borrowing Management
Credit Rating
Capital Charges to Operating
Ex penditure
Finance charges & Depreciation /
Operating Ex penditure
8% 1% -2% 0% 0% 0% 0% 0% 0%
Borrow ed funding of capital ex penditure Borrow ing/Capital ex penditure ex cl.
transfers and grants and contributions
-4.1% 0.0% 0.0% 0.0% 0.0% 0.0% 0.0% 0.0% 0.0%
Liquidity
Current Ratio Current assets / current liabilities 1.48 1.31 0.92 1.43 1.43 1.43 1.43 1.43 1.43
Current Ratio adjusted for debtors Current assets/current liabilities less
debtors > 90 day s
1.48 1.31 0.92 1.43 1.43 1.43 1.43 1.43 1.43
Liquidity Ratio Monetary Assets / Current Liabilities 0.34 0.20 0.01 0.18 0.18 0.18 0.18 0.18 0.18
Revenue Management
Annual Debtors Collection Rate
(Pay ment Lev el %)
Last 12 Mths Receipts / Last 12 Mths
Billing
0% 0% 0% 0% 0% 0% 0% 0%
Current Debtors Collection Rate (Cash
receipts % of Ratepay er & Other
100.5% 95.4% 112.4% 99.9% 99.9% 99.9% 97.5% 97.5% 97.5%
Outstanding Debtors to Rev enue Total Outstanding Debtors to Annual
Rev enue
28% 28% 34% 27% 27% 27% 27% 28% 28%
Longstanding Debtors Reduction Due
To Recov ery
Debtors > 12 Mths Recov ered / Total
Debtors > 12 Months Old
Creditors Management
Creditors Sy stem Efficiency % of Creditors Paid Within Terms (w ithin
MFMA s 65(e))
Creditors to Cash and Inv estments 0.0% 0.0% 0.0% 0.0% 0.0% 0.0% 0.0% 0.0% 0.0%
Other Indicators
Total Volume Losses (kW) 1
Total Cost of Losses (Rand '000) 12.89% 13.23% 12.00% 11.75% 11.75% 11.75% 11.50% 11.50% 11.50%
% Volume (units purchased and generated
less units sold)/units purchased and
generated
Employ ee costs Employ ee costs/Total Rev enue - capital
rev enue
9.2% 12.8% 14.2% 13% 12% 12% 13% 14% 14%
Remuneration Total remuneration/(Total Rev enue -
capital rev enue)
9.2% 9.8% 14.2% 12.8% 12.5% 12.5% 13.0% 13.7% 14.0%
Repairs & Maintenance R&M/Total Rev enue - capital rev enue 0.0% 0.0% 0.0% 0% 0% 0% 0% 0% 0%
Finance charges & Depreciation FC&D/(Total Rev enue - capital rev enue) 8.7% 1.0% -1.7% 0% 0% 0% 0% 0% 0%
Financial viability indicators
i. Debt cov erage (Total Operating Rev enue - Operating
Grants)/Debt serv ice pay ments due w ithin
financial y ear)
35,700.8 21.0 19.8 22.0 22.4 48,884.9 47,006.3 46,095.0 -
ii. O/S Serv ice Debtors to Rev enue Total outstanding serv ice debtors/annual
rev enue receiv ed for serv ices
29% 30.0% 35.1% 28% 28% 28% 29% 29% 29%
iii. Cost cov erage (Av ailable cash + Inv estments)/monthly
fix ed operational ex penditure
15% 0.1 0.0 0.1 0.1 0.1 0.1 0.1 0.1
Description of indicator
Budget Year
+2 2022/23
Ref
Audited
Outcome
Original
Budget
Adjusted
Budget
Full Year
Forecast
Current Year 2019/20
Budget Year
+1 2021/22
Basis of calculation
Audited
Outcome
Audited
Outcome
Budget Year
2020/21
Electricity Distribution Losses (2)
Centlec - Supporting Table SD3 Budgeted Investment Portfolio
Investments by Maturity RefPeriod of
Investment
Type of
Investment
Capital
Guarantee
(Yes/ No)
Variable or Fixed
interest rateInterest Rate
Commissi
on Paid
(Rands)
Commissi
on
Recipient
Opening
balance
Interest to be
realised
Partial /
Premature
Withdrawal
Investment
Top Up
Closing
Balance
Name of institution & investment ID Yrs/Months
ABSA - 1 Day Account February 2013 Call Account No Variable Interest Rate 6.2% n/a 25 4,482 4,507
–
–
–
1 – 0 – – 25 – – 4,507
Expiry date
of
investment
MTREF 2020/21 – 2022/23
28
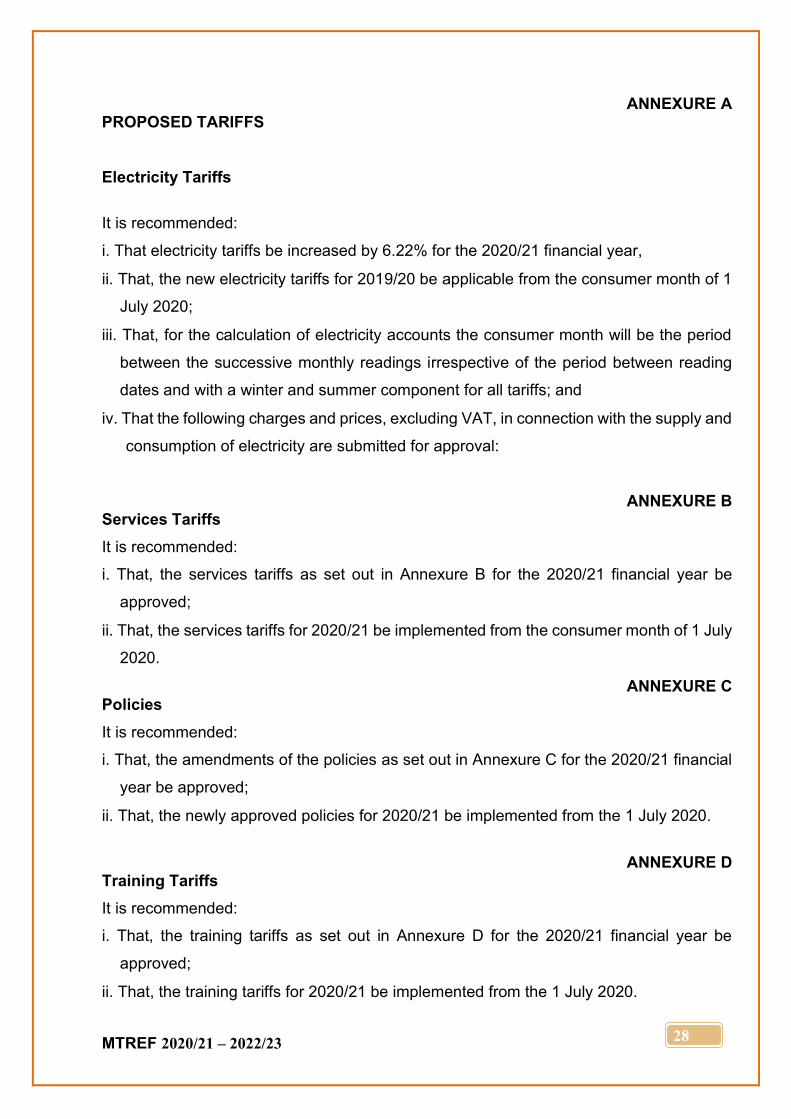
ANNEXURE A PROPOSED TARIFFS Electricity Tariffs
It is recommended:
i. That electricity tariffs be increased by 6.22% for the 2020/21 financial year,
ii. That, the new electricity tariffs for 2019/20 be applicable from the consumer month of 1
July 2020;
iii. That, for the calculation of electricity accounts the consumer month will be the period
between the successive monthly readings irrespective of the period between reading
dates and with a winter and summer component for all tariffs; and
iv. That the following charges and prices, excluding VAT, in connection with the supply and
consumption of electricity are submitted for approval:
ANNEXURE B Services Tariffs
It is recommended:
i. That, the services tariffs as set out in Annexure B for the 2020/21 financial year be
approved;
ii. That, the services tariffs for 2020/21 be implemented from the consumer month of 1 July
2020.
ANNEXURE C Policies
It is recommended:
i. That, the amendments of the policies as set out in Annexure C for the 2020/21 financial
year be approved;
ii. That, the newly approved policies for 2020/21 be implemented from the 1 July 2020.
ANNEXURE D
Training Tariffs
It is recommended:
i. That, the training tariffs as set out in Annexure D for the 2020/21 financial year be
approved;
ii. That, the training tariffs for 2020/21 be implemented from the 1 July 2020.
MTREF 2020/21 – 2022/23
29
PART 2 - SUPPORTING DOCUMENTATION 1. OVERVIEW OF ANNUAL BUDGET PROCESS
In terms of section 87 of MFMA The board of directors of a municipal entity must for
each financial year submit a proposed budget for the entity to its parent municipality not
later than 150 days before the start of the entity’s financial year or earlier if requested
by the parent municipality. This implies that the Entity’s budget must be submitted to
the Municipality on or before the end of 30 January each year. The parent municipality
must then consider the proposed budget by the entity, assess the entity’s priorities and
objectives and make recommendations.
The entity must then consider these recommendations and, if necessary, submit a
revised budget to the parent municipality not later than 100 days before the start of the
financial year which is approximately on or before the 15th of March each year.
Thereafter the following will lead to the approval of the budget:
• The mayor of the parent municipality must table the proposed budget of the
municipal entity in the council when the annual budget of the municipality for the
relevant year is tabled.
• The board of directors of a municipal entity must approve the budget of the
municipal entity not later than 30 days before the start of the financial year, taking
into account any hearings or recommendations of the council of the parent
municipality.
The framework within which the budget must be compiled is as follows:
• It must be balanced, deficit budget is not allowed;
• It must be consistent with any service delivery agreement or other agreement
between the entity and the entity’s parent municipality;
• it must be within any limits determined by the entity’s parent municipality, including
any limits on tariffs, revenue, expenditure and borrowing;
• it must include a multi-year business plan for the entity that—
▪ sets key financial and non-financial performance objectives and measurement
criteria as agreed with the parent municipality;
▪ is consistent with the budget and integrated development plan of the entity’s
parent municipality;
MTREF 2020/21 – 2022/23
30
▪ is consistent with any service delivery agreement or other agreement between
the entity and the entity’s parent municipality; and
▪ reflects actual and potential liabilities and commitments, including particulars
of any proposed borrowing of money during the period to which the plan
relates;
The above prescripts are as per the MFMA and directly also relates to Centlec as a
municipal entity.
1.1 BUDGET PRINCIPLES:
The following budget principles shall apply:
• The budget shall be prepared on the Zero basis and combination method.
• The budget shall only be approved if it has been properly balanced
• All expenses, including depreciation expenses, shall be cash-funded.
• At least 7% of the operating budget component shall be set aside for maintenance.
• The budget for salaries, allowances and salaries-related benefits shall be separately
prepared, and shall not exceed 30% of the aggregate operating budget component
of the annual budget. For purposes of applying this principle, the remuneration of the
Board of Directors shall be excluded from this limit.
MTREF 2020/21 – 2022/23
31
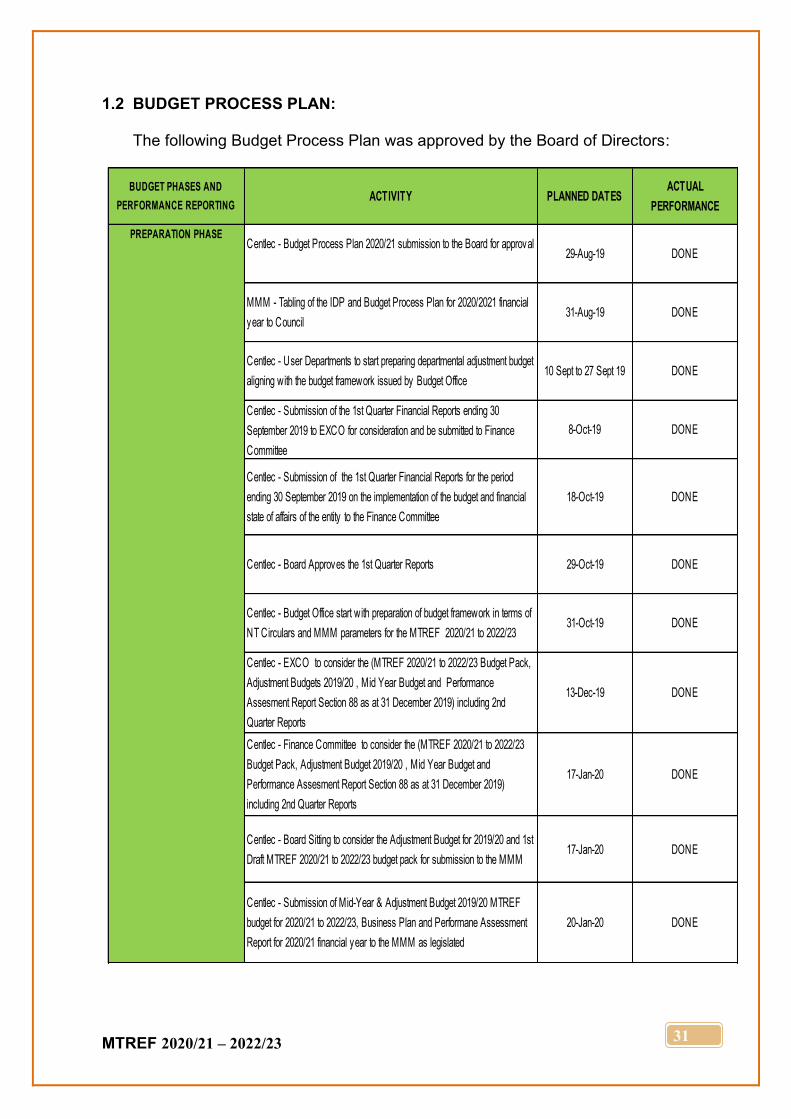
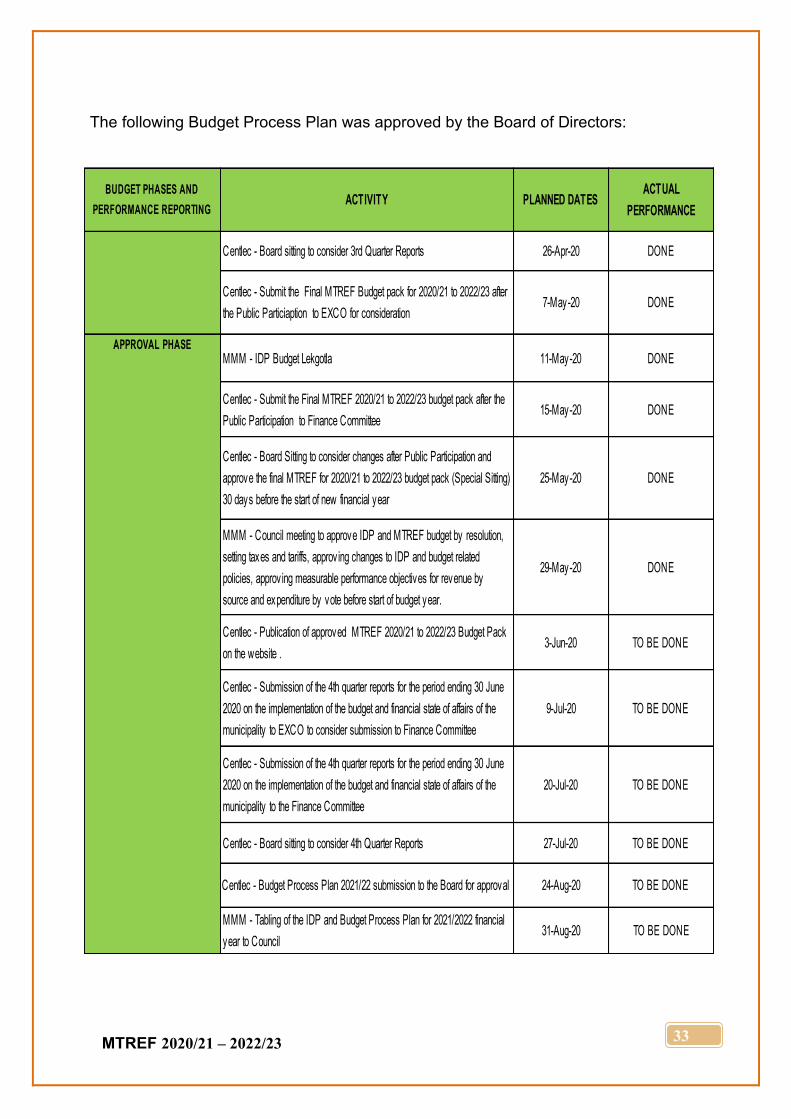
1.2 BUDGET PROCESS PLAN: The following Budget Process Plan was approved by the Board of Directors:
BUDGET PHASES AND
PERFORMANCE REPORTINGACTIVITY PLANNED DATES
ACTUAL
PERFORMANCE
Centlec - Budget Process Plan 2020/21 submission to the Board for approval29-Aug-19 DONE
MMM - Tabling of the IDP and Budget Process Plan for 2020/2021 financial
year to Council31-Aug-19 DONE
Centlec - User Departments to start preparing departmental adjustment budget
aligning with the budget framework issued by Budget Office 10 Sept to 27 Sept 19 DONE
Centlec - Submission of the 1st Quarter Financial Reports ending 30
September 2019 to EXCO for consideration and be submitted to Finance
Committee
8-Oct-19 DONE
Centlec - Submission of the 1st Quarter Financial Reports for the period
ending 30 September 2019 on the implementation of the budget and financial
state of affairs of the entity to the Finance Committee
18-Oct-19 DONE
Centlec - Board Approves the 1st Quarter Reports 29-Oct-19 DONE
Centlec - Budget Office start with preparation of budget framework in terms of
NT Circulars and MMM parameters for the MTREF 2020/21 to 2022/23 31-Oct-19 DONE
Centlec - EXCO to consider the (MTREF 2020/21 to 2022/23 Budget Pack,
Adjustment Budgets 2019/20 , Mid Year Budget and Performance
Assesment Report Section 88 as at 31 December 2019) including 2nd
Quarter Reports
13-Dec-19 DONE
Centlec - Finance Committee to consider the (MTREF 2020/21 to 2022/23
Budget Pack, Adjustment Budget 2019/20 , Mid Year Budget and
Performance Assesment Report Section 88 as at 31 December 2019)
including 2nd Quarter Reports
17-Jan-20 DONE
Centlec - Board Sitting to consider the Adjustment Budget for 2019/20 and 1st
Draft MTREF 2020/21 to 2022/23 budget pack for submission to the MMM17-Jan-20 DONE
Centlec - Submission of Mid-Year & Adjustment Budget 2019/20 MTREF
budget for 2020/21 to 2022/23, Business Plan and Performane Assessment
Report for 2020/21 financial year to the MMM as legislated
20-Jan-20 DONE
PREPARATION PHASE
MTREF 2020/21 – 2022/23
32
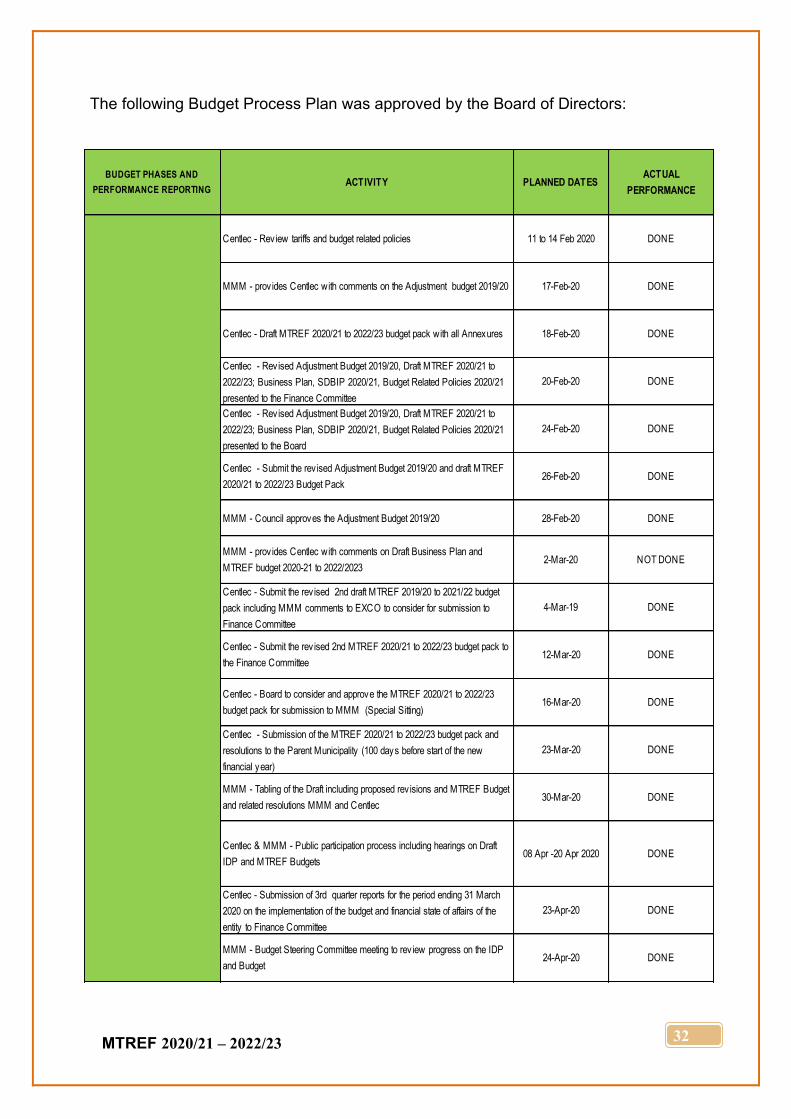
The following Budget Process Plan was approved by the Board of Directors:
BUDGET PHASES AND
PERFORMANCE REPORTINGACTIVITY PLANNED DATES
ACTUAL
PERFORMANCE
Centlec - Review tariffs and budget related policies 11 to 14 Feb 2020 DONE
MMM - prov ides Centlec with comments on the Adjustment budget 2019/20 17-Feb-20 DONE
Centlec - Draft MTREF 2020/21 to 2022/23 budget pack with all Annexures 18-Feb-20 DONE
Centlec - Revised Adjustment Budget 2019/20, Draft MTREF 2020/21 to
2022/23; Business Plan, SDBIP 2020/21, Budget Related Policies 2020/21
presented to the Finance Committee
20-Feb-20 DONE
Centlec - Revised Adjustment Budget 2019/20, Draft MTREF 2020/21 to
2022/23; Business Plan, SDBIP 2020/21, Budget Related Policies 2020/21
presented to the Board
24-Feb-20 DONE
Centlec - Submit the rev ised Adjustment Budget 2019/20 and draft MTREF
2020/21 to 2022/23 Budget Pack26-Feb-20 DONE
MMM - Council approves the Adjustment Budget 2019/20 28-Feb-20 DONE
MMM - prov ides Centlec with comments on Draft Business Plan and
MTREF budget 2020-21 to 2022/20232-Mar-20 NOT DONE
Centlec - Submit the rev ised 2nd draft MTREF 2019/20 to 2021/22 budget
pack including MMM comments to EXCO to consider for submission to
Finance Committee
4-Mar-19 DONE
Centlec - Submit the rev ised 2nd MTREF 2020/21 to 2022/23 budget pack to
the Finance Committee12-Mar-20 DONE
Centlec - Board to consider and approve the MTREF 2020/21 to 2022/23
budget pack for submission to MMM (Special Sitting)16-Mar-20 DONE
Centlec - Submission of the MTREF 2020/21 to 2022/23 budget pack and
resolutions to the Parent Municipality (100 days before start of the new
financial year)
23-Mar-20 DONE
MMM - Tabling of the Draft including proposed rev isions and MTREF Budget
and related resolutions MMM and Centlec30-Mar-20 DONE
Centlec & MMM - Public participation process including hearings on Draft
IDP and MTREF Budgets08 Apr -20 Apr 2020 DONE
Centlec - Submission of 3rd quarter reports for the period ending 31 March
2020 on the implementation of the budget and financial state of affairs of the
entity to Finance Committee
23-Apr-20 DONE
MMM - Budget Steering Committee meeting to rev iew progress on the IDP
and Budget24-Apr-20 DONE
MTREF 2020/21 – 2022/23
33
The following Budget Process Plan was approved by the Board of Directors:
BUDGET PHASES AND
PERFORMANCE REPORTINGACTIVITY PLANNED DATES
ACTUAL
PERFORMANCE
Centlec - Board sitting to consider 3rd Quarter Reports 26-Apr-20 DONE
Centlec - Submit the Final MTREF Budget pack for 2020/21 to 2022/23 after
the Public Particiaption to EXCO for consideration7-May-20 DONE
MMM - IDP Budget Lekgotla 11-May-20 DONE
Centlec - Submit the Final MTREF 2020/21 to 2022/23 budget pack after the
Public Participation to Finance Committee15-May-20 DONE
Centlec - Board Sitting to consider changes after Public Participation and
approve the final MTREF for 2020/21 to 2022/23 budget pack (Special Sitting)
30 days before the start of new financial year
25-May-20 DONE
MMM - Council meeting to approve IDP and MTREF budget by resolution,
setting taxes and tariffs, approving changes to IDP and budget related
policies, approving measurable performance objectives for revenue by
source and expenditure by vote before start of budget year.
29-May-20 DONE
Centlec - Publication of approved MTREF 2020/21 to 2022/23 Budget Pack
on the website .3-Jun-20 TO BE DONE
Centlec - Submission of the 4th quarter reports for the period ending 30 June
2020 on the implementation of the budget and financial state of affairs of the
municipality to EXCO to consider submission to Finance Committee
9-Jul-20 TO BE DONE
Centlec - Submission of the 4th quarter reports for the period ending 30 June
2020 on the implementation of the budget and financial state of affairs of the
municipality to the Finance Committee
20-Jul-20 TO BE DONE
Centlec - Board sitting to consider 4th Quarter Reports 27-Jul-20 TO BE DONE
Centlec - Budget Process Plan 2021/22 submission to the Board for approval 24-Aug-20 TO BE DONE
MMM - Tabling of the IDP and Budget Process Plan for 2021/2022 financial
year to Council31-Aug-20 TO BE DONE
APPROVAL PHASE
MTREF 2020/21 – 2022/23
34
2. OVERVIEW OF ALIGNMENT OF ANNUAL BUDGET WITH SERVICE DELIVERY AGREEMENT
The entity remains wholly owned by the Mangaung Metropolitan Municipality as the
parent municipality. There are no intentions by either parties to effect any changes to the
control and ownership of the entity. The following are some of oversight processes
instituted by the parent municipality:
▪ Approval of the Entity’s proposed budget in terms of MFMA sec.87
▪ Approval of the Mid-Year and performance assessment of the Entity in terms MFMA
sec.88
In terms of schedule 1 of the Service Delivery Agreement between the entity and the
parent municipality, the entity will act as the service provider and will execute on behalf
of the parent municipality all services necessary as required by the electricity distribution
licence conditions.
The budget of the entity will be funded from internal sources however a portion of capital
expenditure will be funded by grants.
3. MEASURABLE PERFORMANCE OBJECTIVES AND INDICATORS
The Measurable Performance Objectives of the Entity to manage and monitor service
delivery progress against identified strategic objectives and priorities by the respective
directorates is attached as Annexure SDBIP
4. OVERVIEW OF BUDGET RELATED POLICIES Budget Related Policies:
a. The budget should address priorities as identified in the Mangaung Metropolitan
Municipality Integrated Development Plan;
b. Operating costs should be funded from revenues;
c. Revenue projections should be conservative;
d. The Company must produce a balanced budget in line with legislation; and
e. The Company should maintain its assets adequately to ensure reliable supply to
its customers.
MTREF 2020/21 – 2022/23
35
4.1 Approved Policies The following policies that govern the Entity’s budget, compilation and/or
implementation thereof were approved in the 2020-21 year and shall be subjected for review during this budget process:
4.2 Budget Related Policies overview for amendments and submitted for approval The following policies that govern the Entity’s budget, compilation and/or
implementation thereof were amendments and submit for approval for the 2020-21 year (Annexure C):
▪ Asset Management Policy
▪ SCM Policy
▪ Bad Debts Policy
▪ Banking & Investments Policy
▪ Connection & Disconnection
▪ Estimation Policy
▪ Revenue Policy
▪ Credit Control & Debt Collection Policy
▪ Tariff Policy
▪ Customer Care Policy
▪ Long-Term Debtors Policy
▪ Borrowings Policy
▪ Sundry Income Policy
▪ Pre-paid Electricity Vending Policy
▪ VAT Policy
▪ Petty Cash Policy
▪ Unauthorized, Irregular, Fruitless & Wasteful Expenditure
▪ Subsistence & Travel Policy
▪ Budget & Reporting Policy
▪ Virement Policy
▪ Service Connection Policy
The abovementioned policies are available on the Centlec website (www.centlec.co.za)
▪ Credit Control & Debt Collection Policy
▪ VAT Policy
MTREF 2020/21 – 2022/23
36
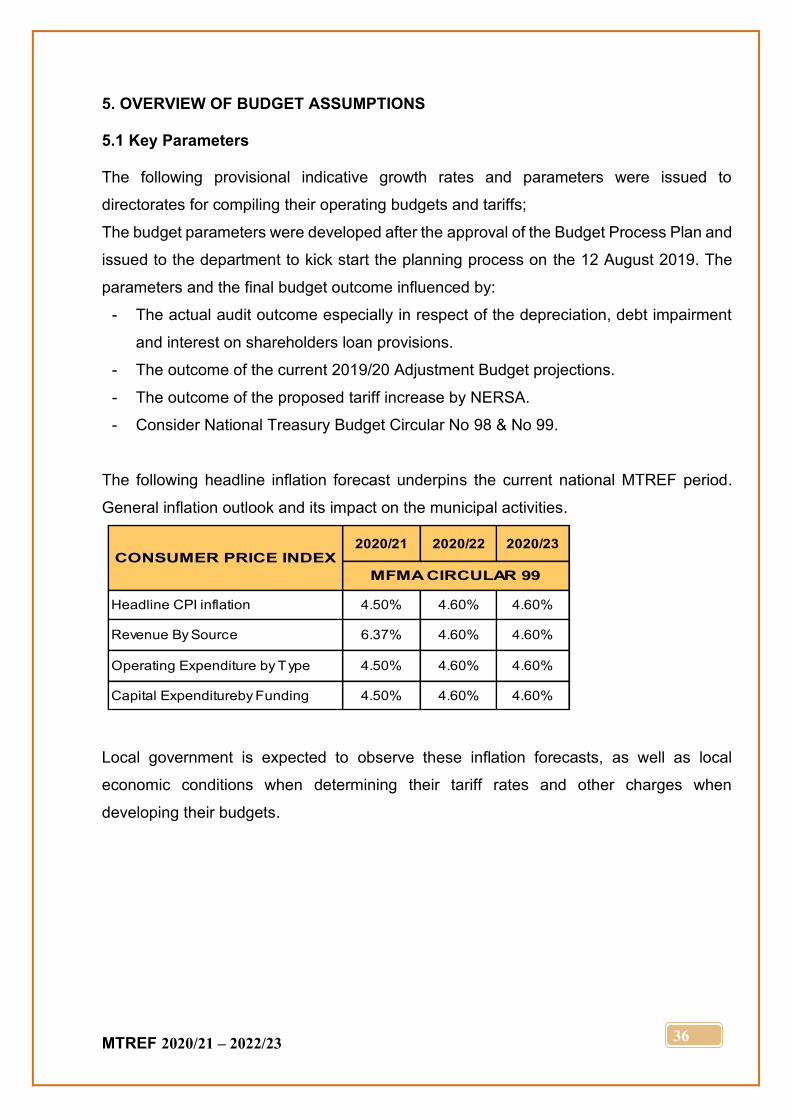
5. OVERVIEW OF BUDGET ASSUMPTIONS 5.1 Key Parameters The following provisional indicative growth rates and parameters were issued to
directorates for compiling their operating budgets and tariffs;
The budget parameters were developed after the approval of the Budget Process Plan and
issued to the department to kick start the planning process on the 12 August 2019. The
parameters and the final budget outcome influenced by:
- The actual audit outcome especially in respect of the depreciation, debt impairment
and interest on shareholders loan provisions.
- The outcome of the current 2019/20 Adjustment Budget projections.
- The outcome of the proposed tariff increase by NERSA.
- Consider National Treasury Budget Circular No 98 & No 99.
The following headline inflation forecast underpins the current national MTREF period.
General inflation outlook and its impact on the municipal activities.
Local government is expected to observe these inflation forecasts, as well as local
economic conditions when determining their tariff rates and other charges when
developing their budgets.
2020/21 2020/22 2020/23
Headline CPI inflation 4.50% 4.60% 4.60%
Revenue By Source 6.37% 4.60% 4.60%
Operating Expenditure by Type 4.50% 4.60% 4.60%
Capital Expenditureby Funding 4.50% 4.60% 4.60%
CONSUMER PRICE INDEX
MFMA CIRCULAR 99
MTREF 2020/21 – 2022/23
37
6. OVERVIEW OF BUDGET FUNDING (a) The overview of budget funding must explain how the annual budget is to be
funded, which must include at least the following –
a narrative summary of –
(i) the funding of operating and capital expenditure;
(ii) financial plans;
(iii) reserves;
(iv) the fiscal viability of the municipal entity;
(v) the overall impact on rates and tariffs; and
(vi) allocations from or distributions to the parent municipality;
The budget of the entity will be funded from the revenue raised internally as well as
conditional Grants from Department of Energy. It is important to note that the energy
bulk purchases represents more than 69% of the entity’s operational budget. The
revenue from the sale of electricity represents more than 98% of the operating revenue
for the entity.
(b) Particulars of funding measures used to determine whether operating and
Capital expenditure is funded in accordance with section 18 of the Act;
Details of the proposed tariffs on energy and Services are attached as Annexures
(c) Particulars of tariffs and other charges;
Details of the proposed tariffs on energy and Services are attached as Annexures
(d) The debtors’ collection levels that have been estimated;
Electricity debtors collection rate set at 95% factored in the revenue projection
(e) Particulars of planned savings and efficiencies for the medium term as
detailed in the multi-year business plan;
• Renewable energy in FS
• Smart Technology Metering
• Conversion to pre-paid smart metering
• Increase Automated Meter Reading (AMR)
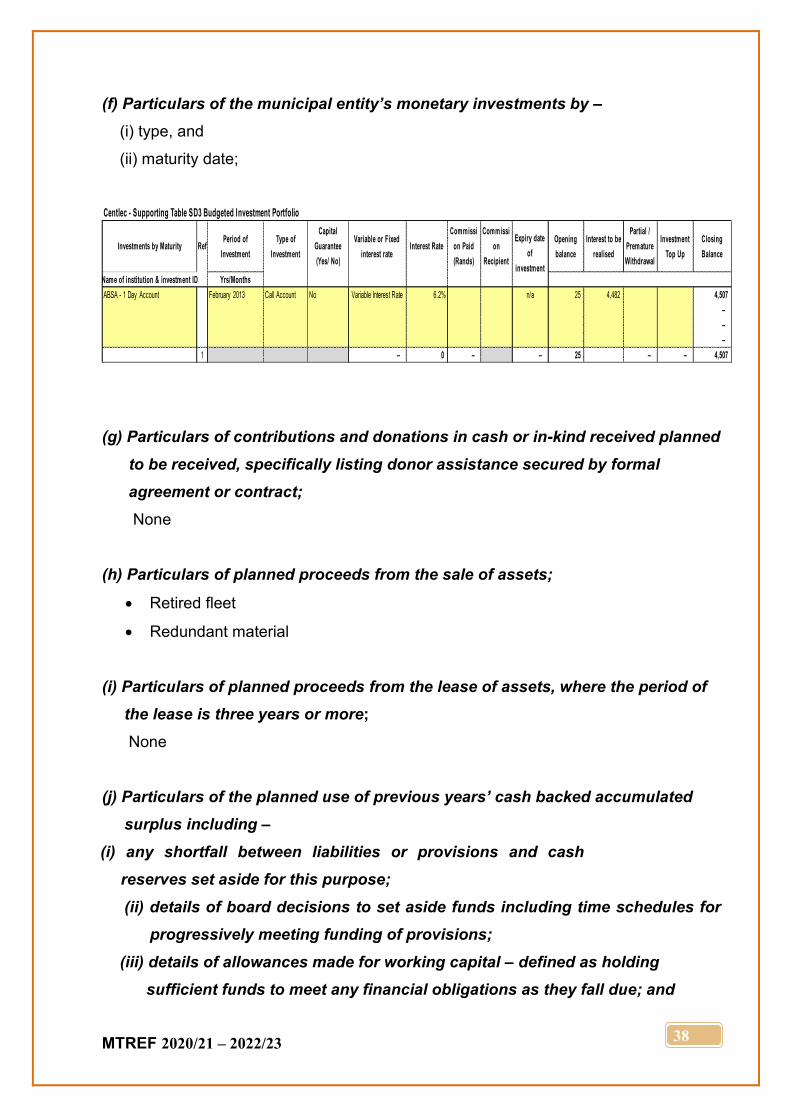
MTREF 2020/21 – 2022/23
38
(f) Particulars of the municipal entity’s monetary investments by –
(i) type, and
(ii) maturity date;
(g) Particulars of contributions and donations in cash or in-kind received planned
to be received, specifically listing donor assistance secured by formal
agreement or contract;
None
(h) Particulars of planned proceeds from the sale of assets;
• Retired fleet
• Redundant material
(i) Particulars of planned proceeds from the lease of assets, where the period of
the lease is three years or more;
None
(j) Particulars of the planned use of previous years’ cash backed accumulated
surplus including –
(i) any shortfall between liabilities or provisions and cash
reserves set aside for this purpose;
(ii) details of board decisions to set aside funds including time schedules for
progressively meeting funding of provisions;
(iii) details of allowances made for working capital – defined as holding
sufficient funds to meet any financial obligations as they fall due; and
Centlec - Supporting Table SD3 Budgeted Investment Portfolio
Investments by Maturity RefPeriod of
Investment
Type of
Investment
Capital
Guarantee
(Yes/ No)
Variable or Fixed
interest rateInterest Rate
Commissi
on Paid
(Rands)
Commissi
on
Recipient
Opening
balance
Interest to be
realised
Partial /
Premature
Withdrawal
Investment
Top Up
Closing
Balance
Name of institution & investment ID Yrs/Months
ABSA - 1 Day Account February 2013 Call Account No Variable Interest Rate 6.2% n/a 25 4,482 4,507
–
–
–
1 – 0 – – 25 – – 4,507
Expiry date
of
investment
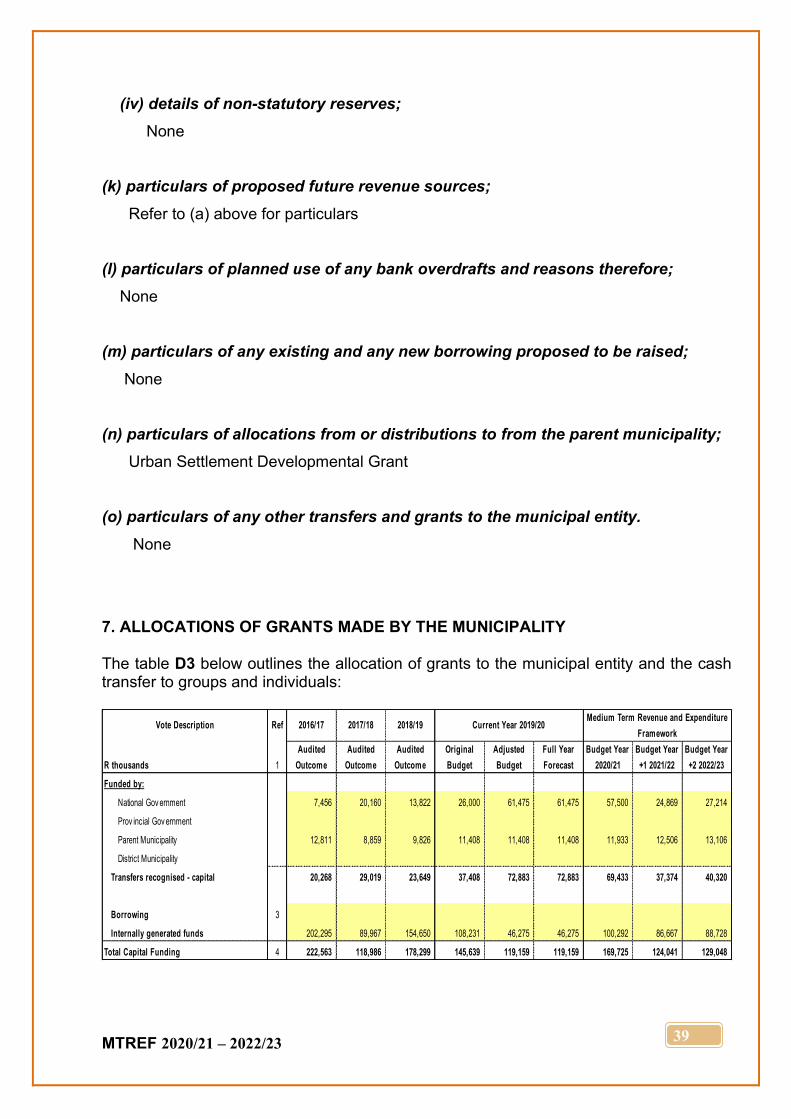
MTREF 2020/21 – 2022/23
39
(iv) details of non-statutory reserves;
None
(k) particulars of proposed future revenue sources;
Refer to (a) above for particulars
(l) particulars of planned use of any bank overdrafts and reasons therefore;
None
(m) particulars of any existing and any new borrowing proposed to be raised;
None
(n) particulars of allocations from or distributions to from the parent municipality;
Urban Settlement Developmental Grant
(o) particulars of any other transfers and grants to the municipal entity.
None
7. ALLOCATIONS OF GRANTS MADE BY THE MUNICIPALITY The table D3 below outlines the allocation of grants to the municipal entity and the cash transfer to groups and individuals:
Vote Description Ref 2016/17 2017/18 2018/19Medium Term Revenue and Expenditure
Framework
R thousands 1
Audited
Outcome
Audited
Outcome
Audited
Outcome
Original
Budget
Adjusted
Budget
Full Year
Forecast
Budget Year
2020/21
Budget Year
+1 2021/22
Budget Year
+2 2022/23
Funded by:
National Gov ernment 7,456 20,160 13,822 26,000 61,475 61,475 57,500 24,869 27,214
Prov incial Gov ernment
Parent Municipality 12,811 8,859 9,826 11,408 11,408 11,408 11,933 12,506 13,106
District Municipality
Transfers recognised - capital 20,268 29,019 23,649 37,408 72,883 72,883 69,433 37,374 40,320
Borrowing 3
Internally generated funds 202,295 89,967 154,650 108,231 46,275 46,275 100,292 86,667 88,728
Total Capital Funding 4 222,563 118,986 178,299 145,639 119,159 119,159 169,725 124,041 129,048
Current Year 2019/20
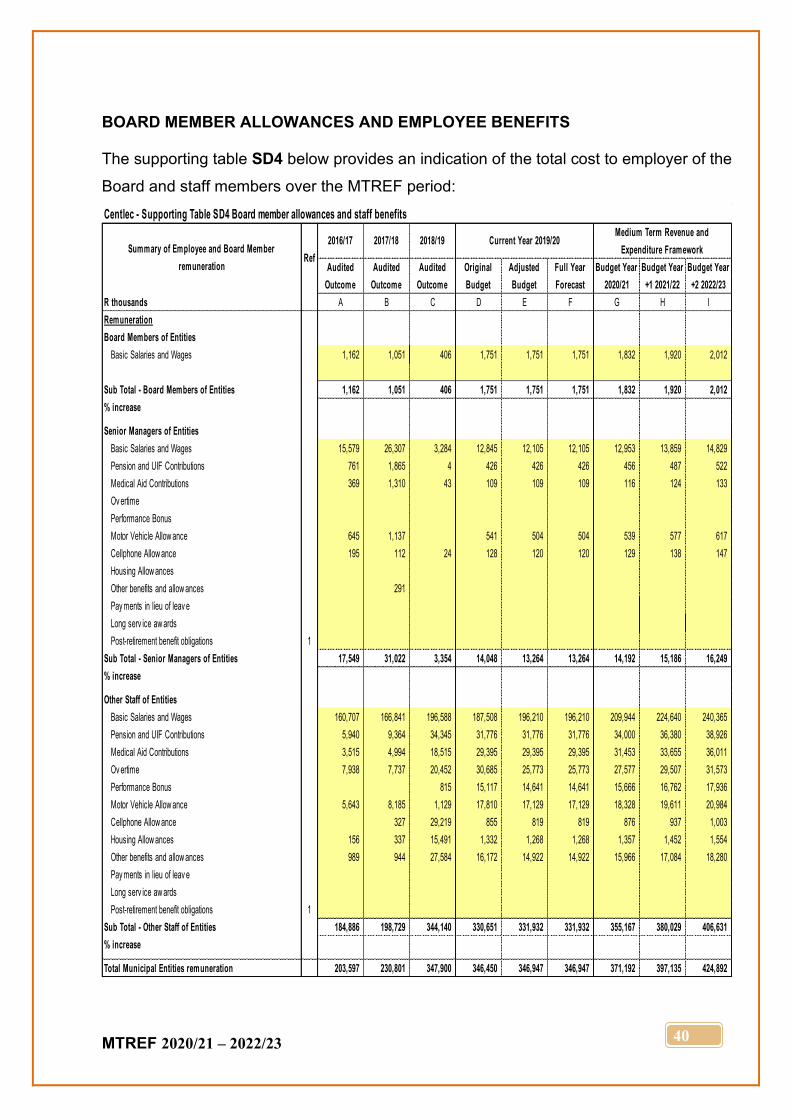
MTREF 2020/21 – 2022/23
40
BOARD MEMBER ALLOWANCES AND EMPLOYEE BENEFITS The supporting table SD4 below provides an indication of the total cost to employer of the
Board and staff members over the MTREF period:
Centlec - Supporting Table SD4 Board member allowances and staff benefits
2016/17 2017/18 2018/19 Current Year 2019/20Medium Term Revenue and
Expenditure Framework
R thousands A B C D E F G H I
Remuneration
Board Members of Entities
Basic Salaries and Wages 1,162 1,051 406 1,751 1,751 1,751 1,832 1,920 2,012
Sub Total - Board Members of Entities 1,162 1,051 406 1,751 1,751 1,751 1,832 1,920 2,012
% increase
Senior Managers of Entities
Basic Salaries and Wages 15,579 26,307 3,284 12,845 12,105 12,105 12,953 13,859 14,829
Pension and UIF Contributions 761 1,865 4 426 426 426 456 487 522
Medical Aid Contributions 369 1,310 43 109 109 109 116 124 133
Ov ertime
Performance Bonus
Motor Vehicle Allow ance 645 1,137 541 504 504 539 577 617
Cellphone Allow ance 195 112 24 128 120 120 129 138 147
Housing Allow ances
Other benefits and allow ances 291
Pay ments in lieu of leav e
Long serv ice aw ards
Post-retirement benefit obligations 1
Sub Total - Senior Managers of Entities 17,549 31,022 3,354 14,048 13,264 13,264 14,192 15,186 16,249
% increase
Other Staff of Entities
Basic Salaries and Wages 160,707 166,841 196,588 187,508 196,210 196,210 209,944 224,640 240,365
Pension and UIF Contributions 5,940 9,364 34,345 31,776 31,776 31,776 34,000 36,380 38,926
Medical Aid Contributions 3,515 4,994 18,515 29,395 29,395 29,395 31,453 33,655 36,011
Ov ertime 7,938 7,737 20,452 30,685 25,773 25,773 27,577 29,507 31,573
Performance Bonus 815 15,117 14,641 14,641 15,666 16,762 17,936
Motor Vehicle Allow ance 5,643 8,185 1,129 17,810 17,129 17,129 18,328 19,611 20,984
Cellphone Allow ance 327 29,219 855 819 819 876 937 1,003
Housing Allow ances 156 337 15,491 1,332 1,268 1,268 1,357 1,452 1,554
Other benefits and allow ances 989 944 27,584 16,172 14,922 14,922 15,966 17,084 18,280
Pay ments in lieu of leav e
Long serv ice aw ards
Post-retirement benefit obligations 1
Sub Total - Other Staff of Entities 184,886 198,729 344,140 330,651 331,932 331,932 355,167 380,029 406,631
% increase
Total Municipal Entities remuneration 203,597 230,801 347,900 346,450 346,947 346,947 371,192 397,135 424,892
Original
Budget
Summary of Employee and Board Member
remunerationRef
Audited
Outcome
Audited
Outcome
Audited
Outcome
Adjusted
Budget
Full Year
Forecast
Budget Year
2020/21
Budget Year
+1 2021/22
Budget Year
+2 2022/23
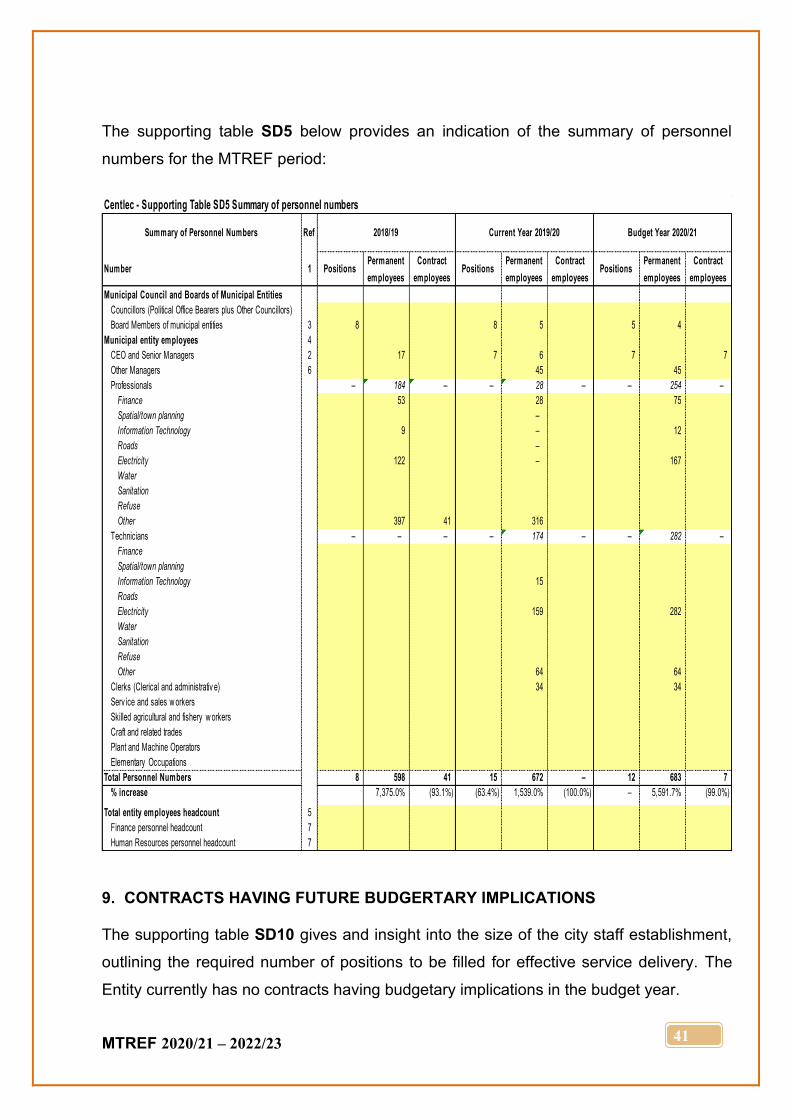
MTREF 2020/21 – 2022/23
41
The supporting table SD5 below provides an indication of the summary of personnel
numbers for the MTREF period:
9. CONTRACTS HAVING FUTURE BUDGERTARY IMPLICATIONS The supporting table SD10 gives and insight into the size of the city staff establishment,
outlining the required number of positions to be filled for effective service delivery. The
Entity currently has no contracts having budgetary implications in the budget year.
Centlec - Supporting Table SD5 Summary of personnel numbers
Summary of Personnel Numbers Ref
Number 1 PositionsPermanent
employees
Contract
employeesPositions
Permanent
employees
Contract
employeesPositions
Permanent
employees
Contract
employees
Municipal Council and Boards of Municipal Entities
Councillors (Political Office Bearers plus Other Councillors)
Board Members of municipal entities 3 8 8 5 5 4
Municipal entity employees 4
CEO and Senior Managers 2 17 7 6 7 7
Other Managers 6 45 45
Professionals – 184 – – 28 – – 254 –
Finance 53 28 75
Spatial/town planning –
Information Technology 9 – 12
Roads –
Electricity 122 – 167
Water
Sanitation
Refuse
Other 397 41 316
Technicians – – – – 174 – – 282 –
Finance
Spatial/town planning
Information Technology 15
Roads
Electricity 159 282
Water
Sanitation
Refuse
Other 64 64
Clerks (Clerical and administrativ e) 34 34
Serv ice and sales w orkers
Skilled agricultural and fishery w orkers
Craft and related trades
Plant and Machine Operators
Elementary Occupations
Total Personnel Numbers 8 598 41 15 672 – 12 683 7
% increase 7,375.0% (93.1%) (63.4%) 1,539.0% (100.0%) – 5,591.7% (99.0%)
Total entity employees headcount 5
Finance personnel headcount 7
Human Resources personnel headcount 7
2018/19 Current Year 2019/20 Budget Year 2020/21
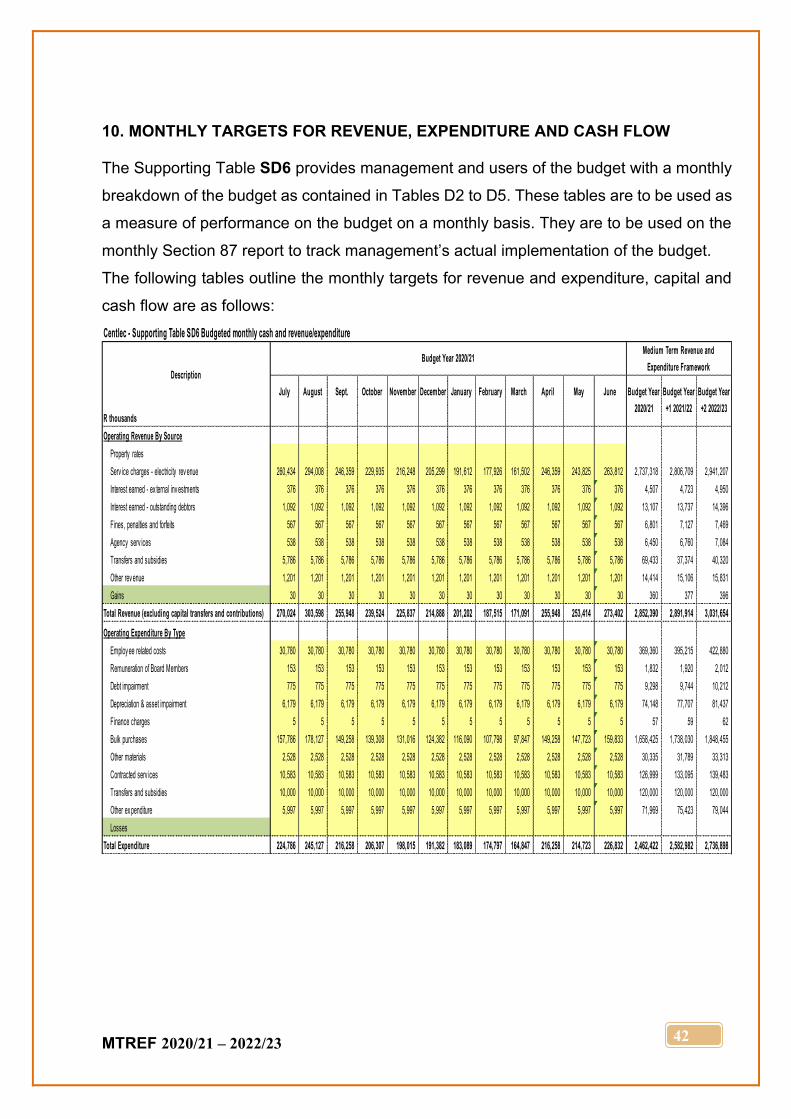
MTREF 2020/21 – 2022/23
42
10. MONTHLY TARGETS FOR REVENUE, EXPENDITURE AND CASH FLOW The Supporting Table SD6 provides management and users of the budget with a monthly
breakdown of the budget as contained in Tables D2 to D5. These tables are to be used as
a measure of performance on the budget on a monthly basis. They are to be used on the
monthly Section 87 report to track management’s actual implementation of the budget.
The following tables outline the monthly targets for revenue and expenditure, capital and
cash flow are as follows:
Centlec - Supporting Table SD6 Budgeted monthly cash and revenue/expenditure
Budget Year 2020/21Medium Term Revenue and
Expenditure Framework
July August Sept. October November December January February March April May June
R thousands
Operating Revenue By Source
Property rates
Serv ice charges - electricity rev enue 260,434 294,008 246,359 229,935 216,248 205,299 191,612 177,926 161,502 246,359 243,825 263,812 2,737,318 2,806,709 2,941,207
Interest earned - ex ternal inv estments 376 376 376 376 376 376 376 376 376 376 376 376 4,507 4,723 4,950
Interest earned - outstanding debtors 1,092 1,092 1,092 1,092 1,092 1,092 1,092 1,092 1,092 1,092 1,092 1,092 13,107 13,737 14,396
Fines, penalties and forfeits 567 567 567 567 567 567 567 567 567 567 567 567 6,801 7,127 7,469
Agency serv ices 538 538 538 538 538 538 538 538 538 538 538 538 6,450 6,760 7,084
Transfers and subsidies 5,786 5,786 5,786 5,786 5,786 5,786 5,786 5,786 5,786 5,786 5,786 5,786 69,433 37,374 40,320
Other rev enue 1,201 1,201 1,201 1,201 1,201 1,201 1,201 1,201 1,201 1,201 1,201 1,201 14,414 15,106 15,831
Gains 30 30 30 30 30 30 30 30 30 30 30 30 360 377 396
Total Revenue (excluding capital transfers and contributions) 270,024 303,598 255,948 239,524 225,837 214,888 201,202 187,515 171,091 255,948 253,414 273,402 2,852,390 2,891,914 3,031,654
Operating Expenditure By Type
Employ ee related costs 30,780 30,780 30,780 30,780 30,780 30,780 30,780 30,780 30,780 30,780 30,780 30,780 369,360 395,215 422,880
Remuneration of Board Members 153 153 153 153 153 153 153 153 153 153 153 153 1,832 1,920 2,012
Debt impairment 775 775 775 775 775 775 775 775 775 775 775 775 9,298 9,744 10,212
Depreciation & asset impairment 6,179 6,179 6,179 6,179 6,179 6,179 6,179 6,179 6,179 6,179 6,179 6,179 74,148 77,707 81,437
Finance charges 5 5 5 5 5 5 5 5 5 5 5 5 57 59 62
Bulk purchases 157,786 178,127 149,258 139,308 131,016 124,382 116,090 107,798 97,847 149,258 147,723 159,833 1,658,425 1,738,030 1,848,455
Other materials 2,528 2,528 2,528 2,528 2,528 2,528 2,528 2,528 2,528 2,528 2,528 2,528 30,335 31,789 33,313
Contracted serv ices 10,583 10,583 10,583 10,583 10,583 10,583 10,583 10,583 10,583 10,583 10,583 10,583 126,999 133,095 139,483
Transfers and subsidies 10,000 10,000 10,000 10,000 10,000 10,000 10,000 10,000 10,000 10,000 10,000 10,000 120,000 120,000 120,000
Other ex penditure 5,997 5,997 5,997 5,997 5,997 5,997 5,997 5,997 5,997 5,997 5,997 5,997 71,969 75,423 79,044
Losses
Total Expenditure 224,786 245,127 216,258 206,307 198,015 191,382 183,089 174,797 164,847 216,258 214,723 226,832 2,462,422 2,582,982 2,736,898
Description
Budget Year
2020/21
Budget Year
+1 2021/22
Budget Year
+2 2022/23
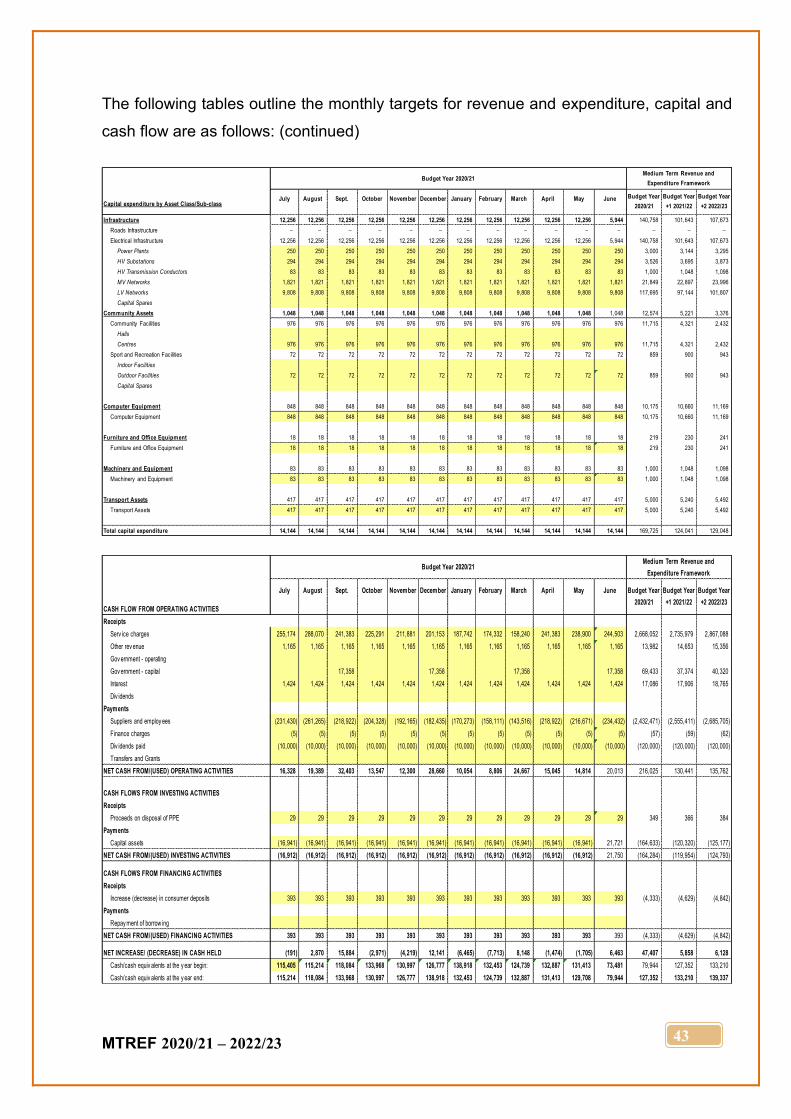
MTREF 2020/21 – 2022/23
43
The following tables outline the monthly targets for revenue and expenditure, capital and
cash flow are as follows: (continued)
Budget Year 2020/21Medium Term Revenue and
Expenditure Framework
Capital expenditure by Asset Class/Sub-classJuly August Sept. October November December January February March April May June
Infrastructure 12,256 12,256 12,256 12,256 12,256 12,256 12,256 12,256 12,256 12,256 12,256 5,944 140,758 101,643 107,673
Roads Infrastructure – – – – – – – – – – – – – – –
Electrical Infrastructure 12,256 12,256 12,256 12,256 12,256 12,256 12,256 12,256 12,256 12,256 12,256 5,944 140,758 101,643 107,673
Power Plants 250 250 250 250 250 250 250 250 250 250 250 250 3,000 3,144 3,295
HV Substations 294 294 294 294 294 294 294 294 294 294 294 294 3,526 3,695 3,873
HV Transmission Conductors 83 83 83 83 83 83 83 83 83 83 83 83 1,000 1,048 1,098
MV Networks 1,821 1,821 1,821 1,821 1,821 1,821 1,821 1,821 1,821 1,821 1,821 1,821 21,849 22,897 23,996
LV Networks 9,808 9,808 9,808 9,808 9,808 9,808 9,808 9,808 9,808 9,808 9,808 9,808 117,695 97,144 101,807
Capital Spares
Community Assets 1,048 1,048 1,048 1,048 1,048 1,048 1,048 1,048 1,048 1,048 1,048 1,048 12,574 5,221 3,376
Community Facilities 976 976 976 976 976 976 976 976 976 976 976 976 11,715 4,321 2,432
Halls
Centres 976 976 976 976 976 976 976 976 976 976 976 976 11,715 4,321 2,432
Sport and Recreation Facilities 72 72 72 72 72 72 72 72 72 72 72 72 859 900 943
Indoor Facilities
Outdoor Facilities 72 72 72 72 72 72 72 72 72 72 72 72 859 900 943
Capital Spares
Computer Equipment 848 848 848 848 848 848 848 848 848 848 848 848 10,175 10,660 11,169
Computer Equipment 848 848 848 848 848 848 848 848 848 848 848 848 10,175 10,660 11,169
Furniture and Office Equipment 18 18 18 18 18 18 18 18 18 18 18 18 219 230 241
Furniture and Office Equipment 18 18 18 18 18 18 18 18 18 18 18 18 219 230 241
Machinery and Equipment 83 83 83 83 83 83 83 83 83 83 83 83 1,000 1,048 1,098
Machinery and Equipment 83 83 83 83 83 83 83 83 83 83 83 83 1,000 1,048 1,098
Transport Assets 417 417 417 417 417 417 417 417 417 417 417 417 5,000 5,240 5,492
Transport Assets 417 417 417 417 417 417 417 417 417 417 417 417 5,000 5,240 5,492
Total capital expenditure 14,144 14,144 14,144 14,144 14,144 14,144 14,144 14,144 14,144 14,144 14,144 14,144 169,725 124,041 129,048
Budget Year
2020/21
Budget Year
+1 2021/22
Budget Year
+2 2022/23
Budget Year 2020/21Medium Term Revenue and
Expenditure Framework
July August Sept. October November December January February March April May June
CASH FLOW FROM OPERATING ACTIVITIES
Receipts
Serv ice charges 255,174 288,070 241,383 225,291 211,881 201,153 187,742 174,332 158,240 241,383 238,900 244,503 2,668,052 2,735,979 2,867,088
Other rev enue 1,165 1,165 1,165 1,165 1,165 1,165 1,165 1,165 1,165 1,165 1,165 1,165 13,982 14,653 15,356
Gov ernment - operating
Gov ernment - capital 17,358 17,358 17,358 17,358 69,433 37,374 40,320
Interest 1,424 1,424 1,424 1,424 1,424 1,424 1,424 1,424 1,424 1,424 1,424 1,424 17,086 17,906 18,765
Div idends
Payments
Suppliers and employ ees (231,430) (261,265) (218,922) (204,328) (192,165) (182,435) (170,273) (158,111) (143,516) (218,922) (216,671) (234,432) (2,432,471) (2,555,411) (2,685,705)
Finance charges (5) (5) (5) (5) (5) (5) (5) (5) (5) (5) (5) (5) (57) (59) (62)
Div idends paid (10,000) (10,000) (10,000) (10,000) (10,000) (10,000) (10,000) (10,000) (10,000) (10,000) (10,000) (10,000) (120,000) (120,000) (120,000)
Transfers and Grants
NET CASH FROM/(USED) OPERATING ACTIVITIES 16,328 19,389 32,403 13,547 12,300 28,660 10,054 8,806 24,667 15,045 14,814 20,013 216,025 130,441 135,762
CASH FLOWS FROM INVESTING ACTIVITIES
Receipts
Proceeds on disposal of PPE 29 29 29 29 29 29 29 29 29 29 29 29 349 366 384
Payments
Capital assets (16,941) (16,941) (16,941) (16,941) (16,941) (16,941) (16,941) (16,941) (16,941) (16,941) (16,941) 21,721 (164,633) (120,320) (125,177)
NET CASH FROM/(USED) INVESTING ACTIVITIES (16,912) (16,912) (16,912) (16,912) (16,912) (16,912) (16,912) (16,912) (16,912) (16,912) (16,912) 21,750 (164,284) (119,954) (124,793)
CASH FLOWS FROM FINANCING ACTIVITIES
Receipts
Increase (decrease) in consumer deposits 393 393 393 393 393 393 393 393 393 393 393 393 (4,333) (4,629) (4,842)
Payments
Repay ment of borrow ing
NET CASH FROM/(USED) FINANCING ACTIVITIES 393 393 393 393 393 393 393 393 393 393 393 393 (4,333) (4,629) (4,842)
NET INCREASE/ (DECREASE) IN CASH HELD (191) 2,870 15,884 (2,971) (4,219) 12,141 (6,465) (7,713) 8,148 (1,474) (1,705) 6,463 47,407 5,858 6,128
Cash/cash equiv alents at the y ear begin: 115,405 115,214 118,084 133,968 130,997 126,777 138,918 132,453 124,739 132,887 131,413 73,481 79,944 127,352 133,210
Cash/cash equiv alents at the y ear end: 115,214 118,084 133,968 130,997 126,777 138,918 132,453 124,739 132,887 131,413 129,708 79,944 127,352 133,210 139,337
Budget Year
2020/21
Budget Year
+1 2021/22
Budget Year
+2 2022/23

MTREF 2020/21 – 2022/23
44
11. CAPITAL EXPENDITURE DETAILS
The Supporting Table SD9 provides the details of Capital Expenditure by class and sub-
class areas are provided below:
Centlec - Supporting Table SD9 Detailed capital budget
R thousand
Function
Current Year
2019/20
Full Year
Forecast
Budget Year
2020/21
Budget Year +1
2021/22
Budget Year +2
2022/23
Entities:
List all capital projects grouped by Entity
Entity A
Water project A
Entity B
Electricity project B
TRAINING & DEVELOPMENT 821 859 900 943
DIGITAL RADIO SYSTEM 1,000 1,048 1,098
IMPLEM BUSINESS CONT DISASTER RECOVERY 280 3,293 3,451 3,617
UPGRADE & REFURB COMPUTER NETWORK 5,145 5,382 5,640 5,911
BULK SMART METER INSTALLATIONS 1,173 1,227 1,286 1,348
METER REPLACEMENT PROJECT 10,000 10,460 10,962 11,488
ELECTRIFICATION (USDG GRANT) 26,000 57,500 24,869 27,214
BOTSHABELO: ESTABLISHMENT OF 132kV CONNECTION (INDUSTRIAL) 5,000
BOTSHABELO: ESTABLISHMENT OF 132kV CONNECTION (VAALKRAAL) 5,000
ELECTRIFICATION INTERNAL PROJECTS 14,000 7,000 7,336 7,688
EXTENSION AND UPGRADING OF THE 11KV NETWORK 5,028 5,000 5,240 5,492
PUBLIC ELECTRICITY CONNECTIONS 11,408 11,933 12,506 13,106
UPGRADING AND EXTENTION OF LV NETWORK 381 3,000 3,144 3,295
SERVITUDES LAND 556 582 609 639
INSTALLATION OF PUBLIC LIGHTING 9,533 5,000 5,240 5,492
INSTALL PREPAID METERS 59 61 64 67
REMEDIAL WORK 132KV SOUTHERN LINES 328 1,000 1,048 1,098
SHIFTING OF CONNECTION AND REPLACEMENTS 571 597 626 656
REFURBISHMENT OF HIGH MAST LIGHTS 8,000 6,000 6,288 6,590
REP LOW VOLT DECREPIT 2/4/8 WAY BOXES 505 1,500 1,572 1,647
REP BRITTLE OVERHEAD CONNECTIONS 470 750 786 824
S/LIGHTS REPLACE POLE TRNS POLES SECTION 3,321 3,500 3,668 3,844
REPLACEMENT OF 110V BATTERIES 545 1,500 1,572 1,647
REPLACEMENT OF 11KV SWITCHGEARS 563 1,500 1,572 1,647
REPLACEMENT OF 32V BATTERIES 393 100 105 110
REFUR PROTEC & SCADA SYSTEMS DIST CENTRE 3,000 3,000 3,144 3,295
TRANSFORMER REPLACE & OTHER RELATED EQUIPMENT 5,000 5,000 5,240 5,492
REP 2 &4 WAY FIBREGLAS BOX (BOTS % TBAN) 443 1,000 1,048 1,098
REPLACEMENT OF OIL PLANT 499 522 547 573
REPAIR MMM DIST DIST CENTRE 4,500
REPAIR VISTA DIST DIST CENTRE 6,500 5,000 2,000
VEHICLES 1,000 5,000 5,240 5,492
SECURITY EQUIPMENT (CCTV ) 312 2,026 2,123 2,225
FURNITURE AND OFFICE EQUIPMENT 209 219 230 241
SOLAR FARM GENERATION PLANT 1,000 1,000 1,048 1,098
OFFICE BUILDING 2,117 2,215 2,321 2,432
COMPUTER EQUIPMENT (COVID-19) 1,500 1,569 1,641
Entity Capital expenditure 119,159 169,725 124,041 129,048
2020/21 Medium Term Revenue & Expenditure
Framework
MTREF 2020/21 – 2022/23
45
LEGISLATION COMPLIANCE STATUS
Compliance with the MFMA implementation requirements have been substantially adhered
to through the following activities:
1. In-Year Reporting
Reporting to National Treasury in electronic format was fully complied with on a monthly
basis. Section 87 reporting to the Executive Mayor (within 7 working days) has
progressively improved and includes monthly published performance on the
municipality’s website.
2. Budget and Treasury Office
The Budget and Treasury Office has been established in accordance with the MFMA.
3. Audit Committee
An Audit Committee has been established and is fully functional.
4. Risk Management
The Risk Management Committee has not been established and a Chief Risk Officer
has not been appointed, however this aspect is catered under Internal Audit and Audit
and Risk Committee.
5. Service Delivery and Implementation Plan
The detailed 2020/21 SDBIP is directly aligned and informed by the 2020/21 MTREF.
6. Annual Report
Annual Report is compiled in terms of the MFMA and National Treasury requirements.
MTREF 2020/21 – 2022/23
46
QUALITY CERTIFICATION
Prepared By: Print Name _____________________________________________
CHIEF FINANCIAL OFFICER OF CENTLEC (SOC) LTD
Signature ______________________________________________
Date __________________
CHIEF EXECUTIVE OFFICER CERTIFICATION Chief executive officer’s certification:
I …………………………………, Chief Executive Officer of CENTLEC (SOC) Ltd, hereby
certify that the Annual Budget and supporting documentation have been prepared in
accordance with the Municipal Finance Management Act and the Regulations made
under the Act, and that the annual budget and supporting documentation are consistent
with the Integrated Development Plan of the Parent Municipality, the service delivery
agreement with the Parent Municipality and the Business Plan of the Entity.
Print Name _____________________________________________
CHIEF EXECUTIVE OFFICER OF CENTLEC (SOC) LTD
Signature ______________________________________________
Date ___________________