Embed Size (px)
Citation preview

1
Site geotechnical and vibrational characterization for the design of the foundations of the ALBA project.
David Carles and Lluis Miralles1
CELLS 2 - Consorci per a la Construcció, Equipament i Explotació del Laboratori de Llum Sincrotró
May 18, 2006
0.- Abstract The stability of the experimental and accelerator foundations are one of the major importances on 3rd generation synchrotron light sources. A detailed study of the site for the future Synchrotron light facility ALBA has been carried on. Here are revised the soil geotechnical characterization method and results, experimental setup for on-line long term soil monitoring and results, vibrational analysis experimental setup and results. We are presenting the solution adopted for the foundations of the beam lines and complex of accelerators critical floor area based on the experimental results obtained. 0.- Abstract .......................................................................................................................... 1 1.- Introduction .................................................................................................................... 2 2.- Objectives of the final building...................................................................................... 3 3.- Geotechnical characterization of the soil ....................................................................... 4
3.1. On site and laboratory results..................................................................................... 7 3.2. Geotechnical field measurements............................................................................... 9
3.2.1. Micrometer measurements ................................................................................. 9 3.2.2. Inclinometer measurements.............................................................................. 11 3.2.3. Extensometer measurements ............................................................................ 11 3.2.4. Piezometer measurements ................................................................................ 11
3.3. Piezometric levels and autogenous movements ....................................................... 11 4.- Vibrational analysis...................................................................................................... 15
4.1. Ground vibration measurements at ALBA site ........................................................ 17 4.2. Vibration reports ...................................................................................................... 18
5.- As projected.................................................................................................................. 21 6.- Simulation of the soil behaviour .................................................................................. 23 7.- Summary ...................................................................................................................... 28 Acknowledgement.................................................................................................................... 29 Document sources .................................................................................................................... 29
1 [email protected] and [email protected] 2 CELLS – ALBA · Edifici Ciències Nord · Mòdul C-3 central · Campus Universitari de Bellaterra · Universitat Autònoma de Barcelona · 08193 Bellaterra, Barcelona · Spain · http://www.cells.es

2
1.- Introduction The Consortium for the Construction, Equipping and Exploitation of the Synchrotron Light Laboratory (CELLS – www.cells.es), it is co-financed by the Spanish and the Catalan governaments and its aim is to be responsible of the first Synchrotron Light Source Facility to be built in Spain, which name is ALBA. ALBA is a 3 GeV complex that will consist of a 100 MeV electron linear accelerator followed by a 3 GeV booster synchrotron and finally the 3 GeV storage ring where eventually a beam of 400 mA will circulate while at the beamlines the scientists will perform their experiments. ALBA will use the so-called top-up injection mode, in which the current is kept almost constant in the storage ring by injecting currents as small as 1 mA every few minutes. In this case all elements of the Storage Ring and more importantly the beamline optical components will operate under a constant heat load to ensure proper stability of the beam at the sample position. In this context, the building must be subservient to the technical and scientific necessities as well as accomplish requirements formulated by accelerators and experimental divisions. Structural stability of the critical floor area was one of the central and crucial parts of the Executive Building Project. Along 2004, geotechnical investigations ordered by CELLS started at the selected construction site of ALBA, located close to CELLS offices, at region called Centre Direccional de Cerdanyola del Vallés. There are several reports available from Eurogeotecnica (www.eurogeotecnica.com) that summarizes the performed field and laboratory tests on site, the instrumentation readings (which are updated every month since September 2004), in order to monitor de behaviour of the ALBA site. In parallel, an ideas competition was organized by CELLS in order to award the engineering firm who was in charge of the redaction of the executive project for the construction of the building as well as the urbanization of external spaces to the buildings. The winner was Master Engineering & Architecture (www.masteringenieria.com). They have developed the executive project during 2005, close to a group of external and international consultants, and under the supervision of the civil engineering group at CELLS. Furthermore, ground vibration measurements at the proposed ALBA site were carried out by Desy group of people (http://ground-vibrations.desy.de) specialised in detailed study of the vibrational aspects for synchrotrons lights sources at the end of 2004. The Basic Project for the construction of the buildings and urbanization of external spaces was finished on time and it was approved after an international review in September 2005. The Executive Project, which foresees a fast track construction approach, is divided into several lots and its completion was done last February 2006. The first lot of the executive project includes breaking of the soil, foundations, service gallery, critical slab area and ALBA tunnel; the on site civil works will start this spring after the tendering exercise.

3
2.- Objectives of the final building The project Synchrotron ALBA makes extreme high demands on the deformations of the slab in the critical area. The specifications for the buildings needed at ALBA are described within this point; these specifications are mainly determined by the stability of the machine area and the experimental hall called such as critical floor slab area. General description of the critical floor slab area The critical floor slab has an outer radius of 60 m and the inner edge is defined by the inner wall of the experimental line plus a minimum excess length of 30 cm. On the other hand, the inner edge is also defined by the layout of the deck elements of the false floor. The Critical Floor slab supports along its inner part the ALBA Tunnel with the experimental line and along its outer part the service area for the single lines. The width of the critical floor varies between 22 m and 29 m at the Linac. To avoid the transmission of vibrations from outside to the critical floor area, the slab has completely been disconnected and isolated from all other structures. Loads and requirements Loads acting on the critical floor slab and limitations of differential floor slab displacements as well as vibrations requirements are summarized 1 below.
Circular ring in which requirements are applied Inner diameter 60 m aprox. Outer diameter 120 m
Charges on the circular ring Total static charge 10.000 Tm Distributed static charge 1,5 Tm / m2 Maximum charge on a point 5 Tm / m2 Dynamic charge 2 Tm
Floor differential displacements
< 0.25 mm/10 m/ year < 0.05 mm/10 m/month
< 10 µm/10 m/ day Slow relative displacements
< 1 µm/10 m/ hour Maximum differential displacement over the whole perimeter < 2.5 mm/ year
Floor deformability because of charges On the application point At 2 m Static charge of 500 kg 6 µm 1 µm Dynamic charge of 100 kg 1 µm
Vibrations
< 4 µm From 0.05 – 1 Hz Vertical amplitudes
< 0.4 µm From 1 – 100 Hz Horizontal amplitudes 2 µm
Table 1. Loads and requirements on the critical floor area
4
Part of these necessities and requirements are already simulated with the final solution adopted for the critical floor area, checking the structural calculations and the methods proposed to guarantee the stability of the critical floor area.
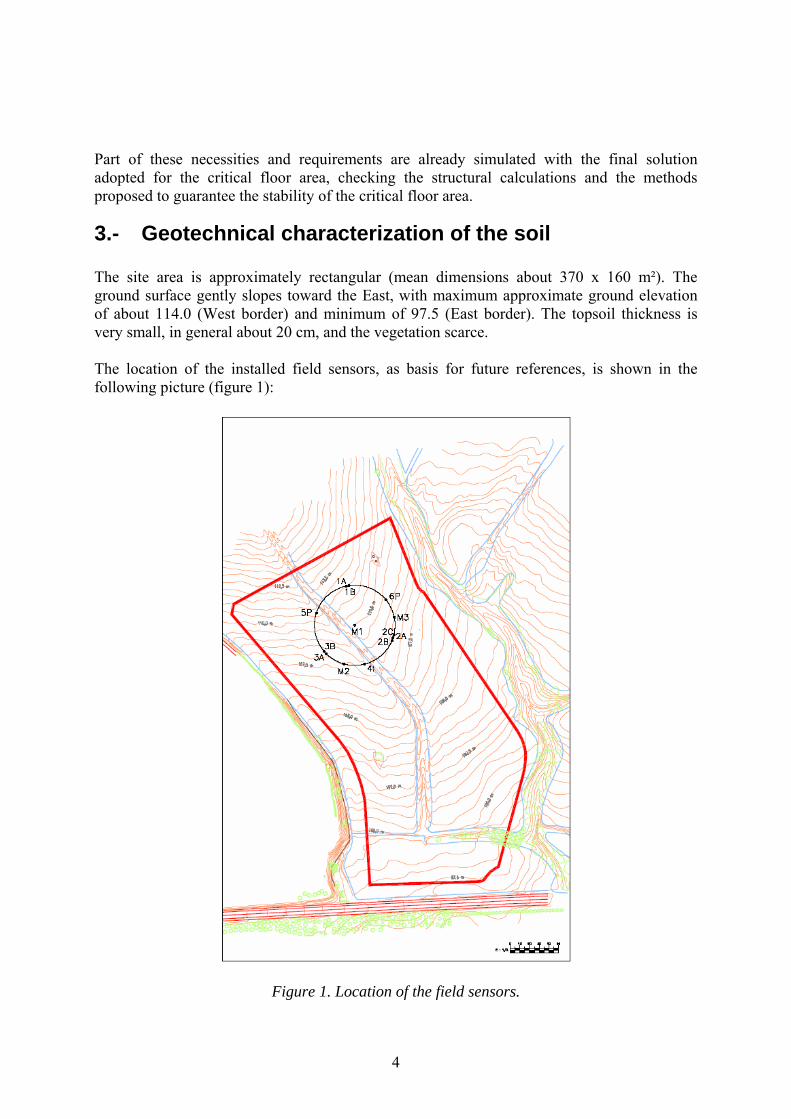
3.- Geotechnical characterization of the soil The site area is approximately rectangular (mean dimensions about 370 x 160 m²). The ground surface gently slopes toward the East, with maximum approximate ground elevation of about 114.0 (West border) and minimum of 97.5 (East border). The topsoil thickness is very small, in general about 20 cm, and the vegetation scarce. The location of the installed field sensors, as basis for future references, is shown in the following picture (figure 1):
Figure 1. Location of the field sensors.

5
The geotechnical site investigations and laboratory tests performed by Eurogeotecnica has been done in two stages. In the main one, carried out in year 2004, the following tasks were performed:
Drilling of nine boreholes (six of them with core recovery) down to a maximum depth of 72 m, and located along a circumference of diameter 85 m in the future critical area of the Synchrotron. During the perforation of these boreholes, 20 “in situ” pressuremeter tests were done, along with Standard Penetration Tests (SPT).
Also, undisturbed samples were taken and laboratory tests of the following types
performed: identification, strength (direct shear, unconfined and triaxial compression) and deformation (consolidation and swelling characteristics).
Installation in the boreholes of “in situ” monitoring devices: 3 sliding micrometers, 2
extensometers, 1 inclinometer and 12 closed piezometers (vibrating wire type). The objective of this monitoring is to determine the ground movements caused by potential changes in the hydrogeological conditions at the site.
The results of the investigations performed in year 2004 are presented in the reports elaborated by Eurogeotecnica [1] and [2]. Furthermore, a second stage of site investigation was done in March 2005, drilling three additional borings with core recovery (S-M1 to S-M3) in the critical area, one of 20 m depth and the other two of 15 m. Basically, the objective of these additional borings was to obtain undisturbed samples of the clayey first layers of the subsoil, in order to better characterize them, performing more identification tests, and also 6 consolidation and 8 swelling potential tests. The logs of these three borings are presented in the report of Eurogeotecnica [3]. Sumarizing all boreholes and samples studied, a complete profile of the subsoil under the critical floor area was done and it can be viewed at figure 2.
Silts, brown-red, clayed, with fine sands Silts, brown and grey, with fine grey sand layers Red silt stones, consolidated Gravels, clays and sands, calcareous Clay, red, with calcareus core Clay, achre-green with red clay layers Fine and medium sands, light brown, with brown silt layers (millimetric) Fine and medium sands, ochre-grey
Gravel, grey-ochre, slightly litified, not compacted Fine sands with silt and clay layers Silts, grey-brown; appearance like marls; lutites/ silt stones or marls, dark grey Silts, brown-grey Silts, Grey-brown, compacted, appearance marls or silt stones with shells fragments or grey marls Silt stones, red or bluish, snady, litified
Silts stones or silty clay, with grey-bluish marls Clay, grey-bluish, with soft silty layers Detritic sediments with clay layers
Figure 2. Geotechnical characterization, profile of the soil

6

7
3.1. On site and laboratory results The geotechnical assessment to Master Engineering was given by DM Iberia (www.dmiberia.es) step by step during the redaction of the building executive project according to the available geotechnical information submitted by Eurogeotecnica. The most important findings are summarized below: In the site, the subsoil materials are mainly very stiff to hard overconsolidated clays and marls, in general of low plasticity (CL) and variable content of sand. Some sandy small strata are also interlayered in the clayey mass. The average values of the identification tests, both for all the samples tested and for the samples taken at depths less than 15 m are shown on table 2.
Table 2. Results of identification tests It should be pointed out that the dry density of these clayey soils is relatively high; and that their moisture content is below the average plastic limit, which indicates that they are clearly overconsolidated, practically from the ground surface, as it is typical in the site region, and probably due to strong cycles of wet-dry conditions during the deposition of the soils. To confirm the former statement, six consolidation tests were performed later on samples taken at depths less than 10 m and applying a vertical pressure up to 40 kg/cm2, in order to better determine the “virgin line”. A summary of the relevant data estimated from these tests is shown on table 3.
Table 3. Consolidation tests (March 2005) Where:
C’c specific compression index C’r Specific recompression index

8
P’c presonsolidation pressure It can be concluded that the compressibility of the clayey subsoil at the site is relatively low. The low compressibility of the subsoil is also backed up by the pressuremeter results. With these "in situ" tests, values of the Young’s modulus (Ep) ranging from a minimum of 377 kg/cm² to a maximum of 6,044 kg/cm² have been deduced. The mean value of the tests performed at depths less than 15 m (4 tests) is equal to 868 kg/cm²; while the mean value of the ones (16 tests) at greater depths is 3,362 kg/cm². These values are indicating that the subsoil can be characterized as a hard soil / soft rock. To evaluate the swelling potential of the clayey soils at depth less than 15 m, eight swelling tests were performed. The values of the free swell and of the swelling pressure determined in these tests are presented on table 4.
Table 4. Swelling tests (March 2005) According to these results, the average free swell is equal to 1.2% and the average swelling pressure 0.69 kg/cm2. It can be concluded that the swelling potential of the clayey soils of the site is not too relevant. Although, precautions will be taken to avoid or reduce as much as possible the moisture content changes of the subsoil during the construction and service life of the ALBA complex of accelerators. Looking at the different strength tests performed by Eurogeotecnica in year 2004, for the design of excavated slopes and foundations, it is adequate and reasonably conservative to assume that the effective angle of internal friction (φ′) of the clayey soils (depth < 15 m) is equal to 23°, and the effective cohesion (c′) 0.25 kg/cm². Also, looking at the available unconfined compression tests and the SPT values the undrained shear strength (su), even at depths less than 15 m is, with conservative criterion, equal or greater than 1.0 kg/cm².

9
3.2. Geotechnical field measurements Eurogeotecnica has been in charge of carried out the execution of the field instrumentation measurements, from September 2004 and reporting monthly the data to CELLS. All this monthly reports has been studied by Höltschi & Schurter from Zurich (www.hoeltschi-schurter.ch) and DM Iberia such as external consultants from Master Engineering during redaction of the building executive project. The last report taken into account in this paper is the one [4] of October 2005.
3.2.1. Micrometer measurements The maximum cumulated deformations measured with the installed micrometers are:
Micrometer 1A: - 1.01 mm to 1.50 mm (see figure 3) Micrometer 2A: - 0.54 mm to 1.80 mm (see figure 4) Micrometer 3A: - 0.33 mm to 3.15 mm (see figure 5)
The major deformations have taken place in the upper 10 to 15 meters, with a tendency to compression in the last measurements. The measured values of micrometers 1A and 2A are still in the range of the system accuracy (0.03 mm per m). The measured values of micrometer 3A show important movements in the upper 10 m. The compression values measured lie above the system accuracy. For all measurements, the diagrams tend to indicate an increase in deformations in the most recent measurements.
Figure 3: Measurements for micrometer 1A, including foreseen excavation level

10
Figure 4: Measurements for micrometer 2A, including foreseen excavation level
Figure 5: Measurements for micrometer 3A, including foreseen excavation level

11
3.2.2. Inclinometer measurements Inclinometer 4I, 35 meters depth, has shown maximum displacements measured of 6.7 mm in A-axis and 5.4 mm in B-axis. The measured values are still in the range of the system accuracy (0.2 mm per m), even if the last measurement for the A-axis tend to show major deformations in comparison to the previous results.
3.2.3. Extensometer measurements The maximum cumulated deformations (settlements) measured with the installed extensometers of 70 meters depth are:
Extensometer 5P: - 0.82 mm Extensometer 6P: - 0.04 mm
The essential deformation in extensometer 5P has taken place exclusively within the first 25 days. Afterwards, a stabilisation has taken place, which is also valid for extensometer 6P. No significant vertical movements are thus recorded at these points.
3.2.4. Piezometer measurements Generally, for all piezometers installed (12 units at boreholes 1B, 2B and 3B), the measured values show a stable water pressure level for the sensors placed below 15 m. The 3 piezometers placed at 14 m or 15 m show a slight tendency to pressure decrease since the beginning of measurements.
3.3. Piezometric levels and autogenous movements Piezometric levels The monitoring being carried out with 12 closed piezometers, installed in the borings 1B, 2B and 3B in the summer of 2004, shows that the site has not hydrostatic conditions. In fact, it seems that there is a very slow groundwater flow, with a slightly downward gradient, probably related with the general slope gradient of the ground surface in the site area. Also, it also appears that the registered pore water pressures are affected by the weather cycles (dry and wet conditions) along the time. The recorded porewater pressures, several months after the installation of the piezometers, can be considered, in our opinion, as a representative “initial state”, being sure that the piezometers (in clayey soils the closed piezometers need some time (in the order of months) to actually measure the real porewater pressures) were already measuring at that date the actual porewater pressures of the subsoil.

12
From the practical point of view, in this case it is very important the information about the variations of the porewater pressures along the time. Although it is believed that in the site these variations are very small and slow, due to the low permeability of the clayey soils, they can induce small cycles of autogenous ground movements (changes of the effective pressures), related to the weather cycles of the site region. The piezometric head elevations measured at the end of January, and their variations at the ends of March, April and May 2005 are shown on table 5.
* These 3 piezometers went out of service on May 16 ** This piezometer went out of service on April 20
Table 5. Piezometric heads Where: PH = Elevation of the piezometric head at the end of January 2005 (measured in meters) D = Variation of the piezometric head from the end of January 2005 (measured in centimetres) Although it is believed that in the site these variations are very small and slow, due to the low permeability of the clayey soils, they can induce small cycles of autogenously ground movements (changes of the effective pressures), related to the weather cycles of the site region. During the last months of 2005, the pore water pressures have had in general a small decrease, in the order of magnitude of decimetres (measured as water column height), from the end of January to the end of October 2005. This could be expected, as the rains during the autumn of year 2004 and the winter and spring of 2005 have been scarce. Furthermore, the pore water pressure decreases seem to be greater in the shallower piezometers: the maximum decrease (70 cm) has been recorded by the piezometer no 4 of the borehole 1B (installed at 14 m

13
depth). Also, it should be noticed that the pore water pressure variations, although small, are not uniform. Knowing that the pore water pressures have decreased, it could be expected that ground settlements have occurred. This seems to be the case, according to the data registered by the three sliding micrometers (installed in the boreholes 1A to 3A) and the two extensometers (boreholes 5P and 6P). Except the extensometer 6P, which practically registers no ground deformation, in the other four monitoring points ground settlements have been recorded until the end of October 2005, although very small ones, ranging approximately between 0.5 and 2.0 mm. This small order of magnitude of the settlements is quite coherent with the also small pore water pressures decreases registered. Nevertheless, it should not be forgotten that the ground movements can increase at a faster rate if very rainy or very dry (and relatively long) periods do occur in the region close to the ALBA site. Autogenous movements It should be taken into account the degree of accuracy of the geotechnical calculation procedures used for the estimation of the ground movements. With a good knowledge of the loads applied and the subsoil characteristics, it is considered a “good prediction” if the estimated settlements (or heaves) are inside a ± 30% interval of the real movements, when these ones are of the order of magnitude of centimetres or decimetres. If the order of magnitude is below one centimetre, usually the relative error of the predictions could be even greater. In the case of the critical area, the initial settlements due to the future applied light loads on top of the slab could be disregarded, because they will be very small (few millimetres), relatively homogeneous and, even more important, according to the experience about the behaviour of this type of overconsolidated subsoil, they will occur very quickly, approximately in less than 2 months, before the final adjustments of the equipments. In this site, the relevant geotechnical aspect for the critical area is the potential autogenous ground movements caused by changes in the porewater pressures of the subsoil. In order to predict them, besides the degree of accuracy that can expected from any geotechnical estimation (which is not high for movements of millimetres), the problem comes from the fact that the future changes of the groundwater conditions in the site along the service life of the synchrotron are not known in advance, and can not be predicted with accuracy. They will depend on the irregular weather cycles. On the other hand, fortunately the available monitoring data obtained in the site (after several months of a dry period) indicate that the piezometric head changes and the induced ground deformations are very small and occur very slowly, as it could be expected, due to the low values of the compressibility, swelling potential and permeability of the overconsolidated subsoil. Then, for the slab and equipment designs, the best approach is to adopt a reasonably conservative assumption about the autogenous ground movements that may occur in a period of time (let’s say in one year). Moreover, in order to have guidance for adopting a reasonable assumption, estimations of the settlements due to piezometric head decreases have been performed and they are presented, in a graphical form, at figure 6.

14
The estimations have been done using the oedometric method; down to a depth of 75 m; for five depth intervals of the ground, in general of thickness equal to 15 m, except the shallowest one (from 3 to 15 m depth); and with the following hypotheses:
The general final elevation of the ground surface is 106.0. Approximately the first 3 m under the critical floor area do not have movements (due
to the thickness of the slab and a gravel layer). The average bulk density of the ground is 2.05 g/cm3, and the C’r index equal to
0.0065 (both for recompression and rebound). The initial porewater pressure (u) is a linear function of the depth (z) (see elevation of
piezometric heads at previous point, so u = 0.081 (z – 4.85); with u in kg/cm2 and z in meters).
Looking at the general trend of the actual piezometric head changes monitored by the closed piezometers up to now (during a relatively extreme dry weather), it seems that a reasonable, but still conservative, criterion is the following: Very probably, during each one of the years of the service life, the piezometric head changes in the critical area will be about or less than 100 to 200 cm down to a depth of 15 m; and about or less than 50 to 100 cm from 15 to 75 m depth. According to the graph of figure 6:
Figure 6. Settlement versus piezometric head decrease

15
The induced settlements with this criterion would be the following:
It is also assumed that these total settlements might occur in points located in a horizontal distance between them of at least 25 m. Using the graph from figure 6, settlements for other combinations of the piezometric head decreases in the different depth intervals can be calculated. Also, the graph can be directly used to estimate upheave movements for piezometric head positive increments. With the former criterion and the subsequent ground deformation estimations, it is reasonable to assume for the slab design that, in one-year period, the maximum differential ground movement (in “free field” conditions, without imposed structural loads on its surface) could be about 4 mm or less, for horizontal distances probably greater than 25 m. Of course, being a “reasonable assumption”, it was open to a follow-up and long discussion with the structural designers of Master Engineering and their consultants.
4.- Vibrational analysis The Alba site is located at Centre Direccional de Cerdanyola del Vallés, near Barcelona in the vicinity of the University UAB Universitat Autònoma de Barcelona. Next figure 7 shows a topographic map with the location of:
The laboratory in the centre (1) The university campus (3) located in the north The ALBA site bounded by a local road (9) and a ceramic factory (11) A railway partially underground and a multi lane highway (4)
All these were identified such as possible sources of cultural noise.

16
Figure 7. Surroundings of ALBA site Cultural noise from human activities like traffic and engineering works enhances the ground vibration spectra by several orders of magnitude at frequencies above about 1 Hz. Ground vibration excites vibration of the quadrupoles in the storage ring of a synchrotron light facility which can be increased or damped by the resonance behaviour of the supports. If the motion of the lenses is uncorrelated then the emittance of the stored beam will be increased, especially in the new generation low emittance machines. Additionally the stability of the photon beam is decreased due to the tilt jitter of the source point. For a synchrotron light source a typical specification can be given that the electron beam motion must not exceed 10 % of the beam size in the transverse planes. Therefore ground vibration measurements were done at the proposed ALBA site to evaluate the influence of cultural noise sources. A stored beam in a synchrotron light source is flat and therefore much more sensitive to the vertical displacement of the quadrupoles than to the horizontal. Concerning the vibration measurements campaigns and studies in order to help with he redaction of the building executive project, there are several reports available from Desy group [5] and ICR Ingenieria para el Control del Ruido (www.icrsl.com), [6] [7] and [8].

17
4.1. Ground vibration measurements at ALBA site The ground vibration measurements at the proposed ALBA site done last August and December 2004 by Desy group were made using Güralp tri-axial feedback seismic sensors CMG-3T. These seismometers measure the ground acceleration which is integrated internally. The CMG-3T seismic sensors are hermetically sealed three-axis devices with an internal 24 bit digitizer (1.3 µV/bit) without amplifier, N/T = 200 Hz sampling rate and a seismometer constant of CS = 3 kV/m/s. The resolution of the instruments is about 0.4 nm/s/bit or 0.07 nm/bit @ 1 Hz, which is sufficient to resolve the power spectra even at quiet sites. The ground vibration was measured first with one single instrument from August 26 to 27, 2004 for about 17 hours. This first approach showed a very clear source of vibrations outer site and was planed a second long term campaign. At this second period, the ground vibration was measured at the proposed ALBA site from December 3 to 13, 2004 with two seismic sensors; in particular the vibration sources should be better located by using more than one instrument. They were placed on the circumference of the planned ALBA storage ring roughly orthogonal to the fence of the ceramic factory. The diameter of the ALBA machine is about 84 m. Both seismometers were placed and two GPS antennas kept the internal clocks synchronized. The sensors and the computer were powered by the mains of the ceramic factory via long cables. The measurement started on a Friday. Monday to Wednesday of the following week was season holidays in Spain. The measurement was finished on Monday a week later. The on-time of the main machines in the ceramic factory each shift was recorded. The quadratic difference of the RMS value above 1 Hz measured at both positions together with the relative factory activity and the RMS at 12.3 Hz measured with the seismic sensor S3. The activity of the ceramic factory was roughly recorded during the measurement period. The on-time of the grinders, the moulding machines and the kilns (oven for firing ceramics) each shift was written in a journal. The kilns were on continuously. The sum of the relative on-time each shift of the other two sources is shown in figure 8. Thus mainly vertical ground vibration measurements presented shows that the ground vibration is well correlated with the factory activity, especially the RMS value at 12.3 Hz that fits perfectly with the activity of the grinder. The grinder seems to rotate with 738 and the moulding machine with 960 revolutions per minute.

18
0
20
40
60
80
100
Dezember 3 Dezember 6 Dezember 9 Dezember 12
Date in 2004
(Diff
eren
ce) R
MS
Val
ue >
1 H
z in
nm
0
1
2
Rel
ativ
e Fa
ctor
y A
ctiv
ity
S3
∆S31
Sunday Sunday
Figure 8. Second period of ground vibration measurements at ALBA site
4.2. Vibration reports In report [6] by ICR, the results of the eigenfrequency measurements as well as the SASW tests are presented. The corresponding shear velocity profile of the subsoil is depicted in figure 9. The fundamental eigenfrequency at the site is estimated as 1.0 Hz +/- 0.3 Hz.
Figure 9. Deduced shear waves velocity profile.

19
Report [7] by ICR analyses the vibration levels measured at the ALBA site. It is concluded that the relevant vibrations are produced by the nearby ceramic factory, mainly in the frequency range from 10 Hz to 35 Hz. Several peaks are observed in this range, which are clearly correlated to the operation of the mills or other equipment of the factory. However, their levels are far below from the limit values in the requirements for this range of frequencies. See figure 10.
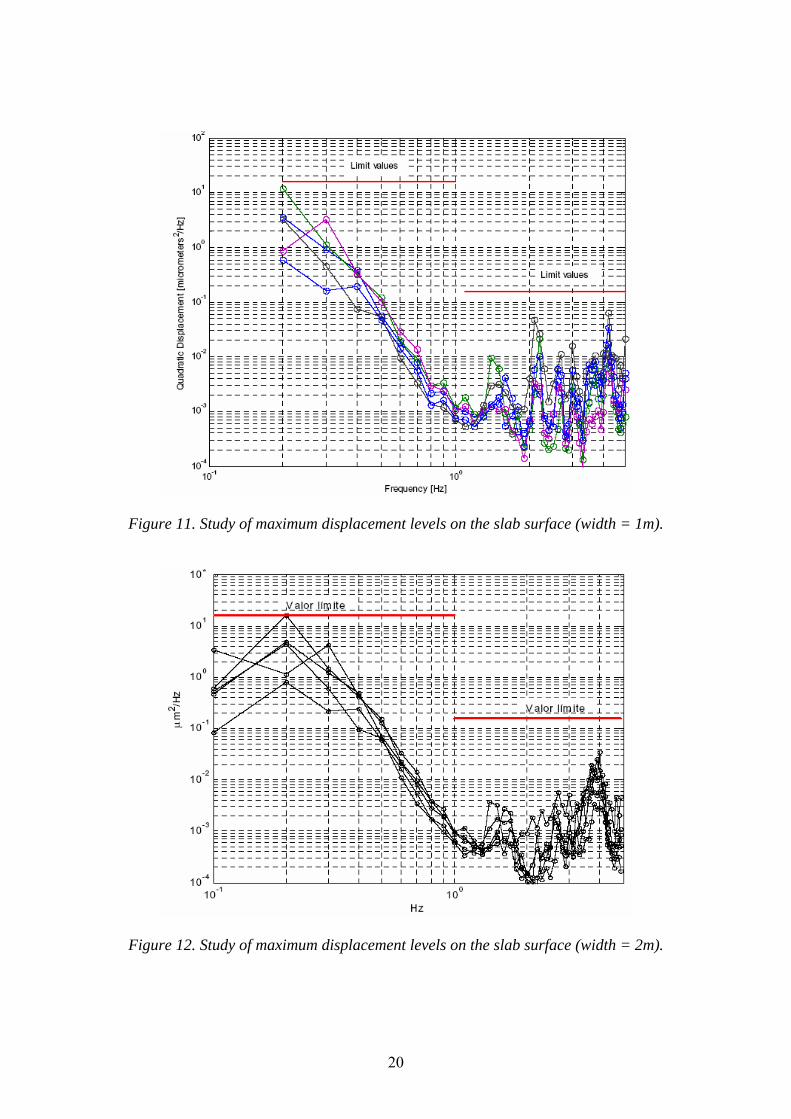
Figure 10. Measured mean values with respect the limit level between 10 and 35 Hz. The results of the investigation conducted by ICR on the influence of plate thickness on the vibration level [8] showed that thicker plates have a beneficial influence on higher frequencies (above 2 Hz in the region of the man made vibrations), but this influence is not significant. See figures 11 and 12. From the results of the calculation of the influence of plate thickness on the vibration level on the test plate, it can be concluded that the thickness of the plate will mainly be governed by the deformation criteria. Remember that the geometrical characteristics of the critical floor concrete slab, 130 metres diameter in front of 1 or 2 metres thickness.
20
Figure 11. Study of maximum displacement levels on the slab surface (width = 1m).
Figure 12. Study of maximum displacement levels on the slab surface (width = 2m).

21
5.- As projected Design Figures 13 and 14 are showing part of the ALBA building executive project were we can see a cross section of the buildings and the top view of the critical floor area.
Figure 13. Cross section of the ALBA buildings
Figure 14. Top view of the critical floor area with the walls af the ALBA tunnel and the sectors of the slab

22
The detailed design of the critical floor slab takes into account the effect of differential subsoil movements as described above and the effect of vertical loads, acting on the test slab (dead weights and live loads). The solution projected for the critical slab floor area of the ALBA Synchrotron Light Source consists in 1 meter thickness concrete slab, supported on a 2 metres thickness treatment soil. This underlayer will consist in a refill of 1,70 meters of selected gravel homogenously and conveniently compacted protected by two layers of 0,15 meters of poor concrete, on the top and the bottom (sandwich mode) of this gravel.
Figure 15. Cross section of the solution for the critical floor area Construction Stages The whole test plate, which has been divided into 20 segments, will be produced one by one. The area of the single elements has been chosen in such a way that the corresponding concrete volume can be poured in one day and the corresponding work properly be guaranteed. Construction joints to be vertical with shuttering boards (or similar) and longitudinal reinforcement bars going through the shuttering. Surface retarder will be applied to the shuttering prior to pouring. Immediately the formwork is removed, concrete surface will be washed off with a strong water jet to expose the aggregates. After-treatment of the exposed concrete surface during at least the first week after pouring will be applied to avoid a desiccation of the surface. Could be curing or better covering the slab with plastic or insulating foils. The time gap between pouring two adjacent elements shall be at least one week (hardening of the prior poured element).

23
6.- Simulation of the soil behaviour
This simulation has the objective to analyze the behaviour of the soil studied in order to estimate movements due to natural causes. A natural cause means those that are associated at naturals causes like the up heave of the soil due to increase the humidity of the soil, they are not associated at loads or unloads during the construction phase, or something similar. First stage was to create a model and establish first approach about slab thickness and software used to study soil behaviour. Respect to deformation criteria a parametric study has been provided basing on the assumption of a differential displacement of approx. 4 mm within the critical test area. The maximum resulting Floor Slab differential displacements along the trajectory as well as tangential to the trajectory in the most critical zones of the test area have been calculated for different slab thicknesses:
Slab thickness 1.00 m Slab thickness 1.80 m Slab thickness 8.00 m.
Figure 16. Model of the critical floor area At this point and taking into consideration the points showed before, it is reasonable to assume for the slab design that, in one-year period, the maximum differential ground

24
movement (in “free field” conditions, without imposed structural loads on its surface) will be about 4 mm or less. The parametric study has been based on the following constant assumptions:
Differential upheave of about 4 mm. Length of affected area 2 x 25 = 50 m.
The results for a displacement due to swelling over the surface of the critical floor area at a radius of 42.8 m, when the slab has 1 meter thickness are the following:
Figure 17. Curvature w (mm) / 10 m / year < 0.25 for slab of t = 1.0 m. Additionally, the computer model which has been used until now (CEDRUS) has been counterchecked with the PLAXIS computer model. With these calculations, the critical floor slab has been modelled as a gridslab structure on elastic springs, modelling the differential surface movements within the concrete slab. Different affected areas with maximum differential subsoil displacements have been investigated (α = 45° / α = 75° and α = 135°).

25
The resulting floor slab differential displacements along the trajectory (R = 42.80 m) within the tunnel as well as along the critical tangent of the trajectory (experimental line) have been calculated, the results are at table 6.
Table 6. Summary of maximum values (mm/10 m) for CEDRUS 3D (1st row) and PLAXIS 2D (2nd row)
This first stage can be concluded with the saying that the influence of the thickness of the slab in front of the surface is not relevant due to diameter of the plate, and also that the software accuracy is out of the range of the requirements. At this point it was useful create a very complete model of the soil along the trajectory within the ALBA tunnel in order to crosscheck the behaviour simulated with the real displacements measured until today. For this second stage, it was used version 8.1 of PLAXIS 2d software, developed by the Delft University of Technology (Holland). It is software oriented to solve 2D geotechnical affaires and it is base on the finite element method. The new model has dimensions of 260 m longitudinal per 70 m depth. The geometry of the layers has been created following the geological and geotechnical interpretation of the figure 2, this is following the boreholes information and extrapolating between them, the characterization of the soil (properties) has been introduced also, trying to be close the reality as much as possible.

26
Figure 18. Geometry of the model with the mesh of finit elements
Figure 19. Detail of the output after changes in the volume due to variable moisture content of the soil following criteria established.
27
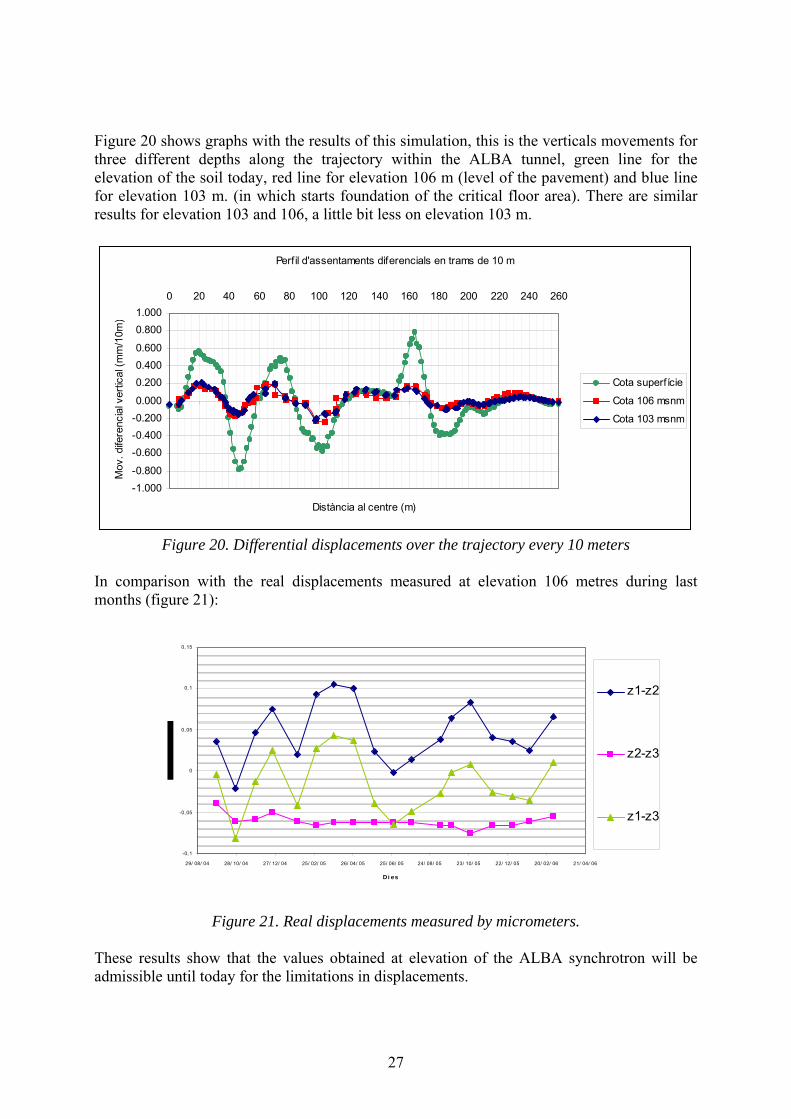
Figure 20 shows graphs with the results of this simulation, this is the verticals movements for three different depths along the trajectory within the ALBA tunnel, green line for the elevation of the soil today, red line for elevation 106 m (level of the pavement) and blue line for elevation 103 m. (in which starts foundation of the critical floor area). There are similar results for elevation 103 and 106, a little bit less on elevation 103 m.
Perfil d'assentaments diferencials en trams de 10 m
-1.000-0.800
-0.600-0.400-0.2000.000
0.2000.4000.600
0.8001.000
0 20 40 60 80 100 120 140 160 180 200 220 240 260
Distància al centre (m)
Mov
. dife
renc
ial v
ertic
al (m
m/1
0m)
Cota superfície
Cota 106 msnm
Cota 103 msnm
Figure 20. Differential displacements over the trajectory every 10 meters
In comparison with the real displacements measured at elevation 106 metres during last months (figure 21):
-0,1
-0,05
0
0,05
0,1
0,15
29/ 08/ 04 28/ 10/ 04 27/ 12/ 04 25/ 02/ 05 26/ 04/ 05 25/ 06/ 05 24/ 08/ 05 23/ 10/ 05 22/ 12/ 05 20/ 02/ 06 21/ 04/ 06
Di es
z1-z2
z2-z3
z1-z3
Figure 21. Real displacements measured by micrometers.
These results show that the values obtained at elevation of the ALBA synchrotron will be admissible until today for the limitations in displacements.

28
7.- Summary At the ALBA site, the relevant geotechnical and vibrational aspect for the critical floor area is the potential autogenous ground movements caused by changes in the pore water pressures of the subsoil. In order to predict them, besides the degree of accuracy that can expected from any geotechnical estimation (which is not high for movements of millimetres), the problem comes from the fact that the future changes of the groundwater conditions in the site along the service life of the synchrotron are not known in advance, and can not be predicted with accuracy. They will depend on the irregular weather cycles. Basing on a differential displacement of the top surface of the existing ground within the critical test area of approx. 4 mm, and a slab thickness of 1.00 m, the resulting maximum floor slab differential displacements will reach the value of 1.30 mm to 2.20 mm over a length of 10 m. That means, the specified limitations of the floor slab differential displacements can not be guaranteed, if a differential displacement of the ground of 4 mm is assumed. On the other hand, fortunately the available monitoring data obtained in the site indicate that the piezometric head changes and the induced ground deformations are very small and occur very slowly, as it could be expected, due to the low values of the compressibility, swelling potential and permeability of the overconsolidated subsoil.

29
Acknowledgement We are very grateful to J.Amigó, A.Díaz and D.Plana from Eurogeotecnica; A.Perdrix, A.Fernandez, J.Mª.Paris, T.Ricol and J.Olivés from Master Engineering; W.Bialowons and H.Ehrlichmann from DESY, M.Velasco from DMIberia; H.Höltschi and J.Studer from Höltschi & Schurter, F.X.Magrans from ICR, for their interest supporting the civil engineering group at CELLS, all our colleagues of CELLS and our families for their patience in our passion.
Document sources [1] “Campanya de reconeixements i instrumentació dels terrenys per la ubicació del laboratori de llum Sincrotró, informe resum de treballs efectuats”, (Volumes I and II), dated September 6, 2004. [2] “Estudi geotècnic dels terrenys per a la ubicació del laboratori de llum Sincrotró, informe preliminar als tres mesos de l’inici dels treballs”, dated November 10, 2004. [3] “Ampliació de Campanya de Reconeixements Geotècnics dels Terrenys per la Ubicació del Laboratory de Llum Sincrotró”, dated March 23, 2005. [4] "Col-locació i seguiment d'instrumentació dels terrenys per la ubicació del laboratory de llum Sincrotró. Cerdanyola del Vallès, Informe mensual d'auscultació n° 17, October 2005" by Eurogeotecnica, November 10th, 2005. [5] "Ground Vibration Measurements at the Proposed ALBA Site in Barcelona" by W. Bialowons and H. Ehrlichmann, DESY, Hamburg, January 28 and February 23, 2005. [6] "SIN_011 Executive Project Phase, Dynamic Characterization of the Soil", ICR Report, 16.6.2005. [7] "SIN_012 Executive Project Phase, Characterization of the Factory Frequencies", ICR Report, 16.6.2005. [8] "SIN_014 Executive Project Phase, Aislamiento de la Losa de 1 metro de grosor", ICR Report, 17.6.2005.