Embed Size (px)
Citation preview
1
‘Meeting the Challenge’
Annual Corporate Improvement Plan 2010-11
2
Contents
1 Foreword Page 3
2 Mission, Vision, Strategic and Improvement Objectives
Pages 4 - 5
3 Equality & Diversity Pages 6 – 7
4 Sustainable Development Pages 8 - 9
5 Part 1 – Reviewing our performance over 2009-10
Pages 10 - 36
Summary of Performance 2009-10 Pages 11 – 12
Movement of Risk from 2009-10 to 2010-11
Pages 13 - 14
Audit and Inspections conducted in 2009-10
Pages 15 - 17
What we achieved in 2009-10 Pages 18 – 31
Improvement Agreement 2009-10 Pages 32 – 33
Efficiency Gains Pages 34 - 36
6 Part 2 – Review of plans in place for 2010-11
Pages 37 - 42
Summary of Improvement Objectives for 2010-11 and Plans to meet them
Pages 38 – 40
Main findings from the Corporate Assessment 2010-11 by the Auditor General Wales
Pages 41 - 42
6 Glossary Pages 43 – 49
7 Further Information Pages 50 – 51
8 Appendix A – Performance Tables 2009-10
Pages 52 – 86
9 Appendix B – Efficiency Gain Outturn 2009-10
Page 87
3
Foreword The City & County of Swansea along with all local authorities in Wales is facing major challenges. Changing demands for our services due to shifting demographic and economic conditions, reduced government funding and the effects of the recession on Council budgets all mean that we have to prioritise what services we deliver and change the way that we deliver them. Maintaining services at their current levels with reduced resources will prove a challenge. It is therefore vitally important that we continue to make the best use of our resources and that our back office services that are crucial in supporting front-line service delivery need to be as efficient as possible. The Council has produced a medium term financial plan, which sets out how it intends to achieve this. It is more important than ever that we prioritise our resources and efforts onto services that are essential to the people of Swansea, to the success of the local economy, the continued vibrancy of our community and onto those services that ensure vulnerable people are cared for and protected. These key priorities have been identified and this improvement plan describes the actions and measures in place to deliver them. Children and young people in particular must continue to be prioritised. Safeguarding and supporting children in need is a vital responsibility of this and every local authority. We will continue to strive to improve services to vulnerable children and young people and their families and build upon and sustain the recent improvements that have been made. There is likely to be further and continual change over the next few years as local authorities adjust to reduced resources and seek new ways to deliver services. There will be even greater emphasis on achieving efficiencies, working together with other authorities to provide services and a continued focus on protecting front-line service delivery. Citizens and their interests will be at the heart of this change and local authorities will continue to measure their success by asking what difference we made to the citizens who use our services.
4
Mission Delivering quality services for a greener, safer more prosperous Swansea WHAT IS THE SHARED VISION FOR SWANSEA? By 2020 Swansea will aim to be a distinctive European City. Making the City & County a place which:
• is great to live in
• provides a great start to life
• provides excellent education opportunities
• is safe and feels safe
• supports a prosperous economy
• supports and promotes good health
• provides the best possible services. WHAT ARE THE STRATEGIC OBJECTIVES OUTLINED WITHIN THE COMMUNITY PLAN SHARED AMBITION IS CRITICAL 2010-14
• Improve Swansea’s environment for everyone
• Make a better Swansea for all children and young people
• Ensure excellent education opportunities for everyone in Swansea
• Make Swansea safer for everyone
• Make Swansea more prosperous for everyone
• Improve health, social care and wellbeing in Swansea for everyone
• Make better use of our resources. WHAT ARE THE COUNCIL’S IMPROVEMENT OBJECTIVES 2010-11? Improvement Objective 1: Improve services for children and young people, maximise well-being, raise standards of attainment and achievement and ensure they are safe so that the City & County provides excellent education opportunities. Improve Child & Family Services. Progress the QEd 2020 Programme and improve skills for learning, work and life. In conjunction with others, work to reduce the impact of poverty on children and young people. Improvement Objective 2: Improve and protect our environment and make communities feel safer so that the City & County is a great place to live. Ensure that all public spaces in neighbourhoods are well maintained.
5
Reduce Swansea’s ecological footprint by encouraging; the minimisation of waste, an increase in recycling and a decrease in the amount of waste sent to landfill. Encourage the provision of affordable, good quality, well managed housing in Swansea and to work towards improving Council Housing up to the Welsh Housing Quality Standard (WHQS) Improvement Objective 3: Improve Swansea’s economic performance so that the City & County of Swansea supports a prosperous economy. Provide a more integrated transport system that promotes the use of public transport. Improve and develop infrastructure that supports Swansea’s economic regeneration focussing on the City Centre, Waterfront, Strategic Employment Sites and Regeneration Areas Improvement Objective 4: Improve health and social care services for all so that the City & County supports and promotes good health Reshape and reconfigure Health and related services in Swansea. Promote and encourage healthier lifestyles. WHAT ARE THE COUNCIL’S VALUES? Teamwork Working with others and in partnership to deliver services Openness Valuing our customers, be clear about why we do things and be accountable for decisions we make. Innovation Driving services forward through innovation and being sustainable in our approach to service delivery. Respect Recognising diversity, respecting differences and valuing our culture and heritage Enthusiasm Positively engaging and involving communities in decision making Caring Understand people have different needs and deliver services accordingly

6
Equality & Diversity The City and County of Swansea has approved its first Single Equality and Diversity Scheme. The Scheme is for everyone who lives or works in Swansea, as well as visitors to the area. When we talk about equality issues we mean people’s:
• age
• disability
• ethnicity
• gender
• language
• religion or belief/non-belief
• sexual orientation.
Therefore, when we talk about promoting equality and preventing discrimination and harassment, it is in terms of all of these equality issues. The vision for the Equality and Diversity Scheme is:
“For the City and County of Swansea to be a society built on:
• Fairness
• Respect
• Freedom
• Choice
• Dignity Where everyone is confident in all aspects of diversity and can enjoy life as an equal citizen.” The purpose of the Scheme is to:
• Identify the Council’s priorities for action 2009-2012.
• Guide the Council in meeting its legislative duties to promote equality of opportunity for all and eliminate discrimination.
• Ensure that all Council staff work in a respectful and fair environment.
• Ensure that Council services are developed and delivered to meet the needs of citizens.
• Improve the Council’s communication with its citizens.
• Increase awareness of equality and diversity issues among Swansea’s communities.
Scheme Implementation The Equality and Diversity Scheme will not be a stand-alone document. An implementation and support plan has been developed, which includes, for example:
• Clear guidance on equality and diversity issues.
• Advice and support for all directorates in relation to activities such as Equality Impact Assessments.
• Regular information updates to ensure awareness.
7
• A Consultation Toolkit has been developed and is available on the Swansea Consultation Partnership website: http://www.swanseaconsultationpartnership.org.uk/index.cfm?articleid=26033. The Corporate Consultation Co-ordinator is also available to assist.
A detailed action plan has been included within the Equality and Diversity Scheme. A summary of corporate outcomes for 2009-10 include:
• Equality & Diversity Scheme promoted internally with support given to all directorates when required
• Scheme available in different formats and sent out to local stakeholder groups and organisations
• Draft role for Member Equality Champions developed and Councillor Guidance to Scheme.
• Scheme review process developed including progress reporting on action plan and consultation with stakeholder groups
• Review work undertaken on the Hate & Harassment Incident Process
• Liaison with groups covering all equality strands being developed
• Initial application for Rainbow Mark accreditation undertaken
• Use of Wales Interpretation and Translation Service (WITS) by Council implemented
• Older People Strategy Development Plan delivered including initial work on Older People’s Strategic Framework and link to the Scheme.
• Welsh Language Scheme reviewed and draft action plan developed
• Consultation & Engagement review scoped with initial mapping
• Swansea Consultation Partnership supported and website/database fully developed
Some key priorities for 2010-11 include:
• Delivery of second year of Equality & Diversity Action Plan
• Support Equality Impact Assessment process
• Complete Hate & Harassment Incident Process review
• Develop & implement Linguistic Skills Framework
• Complete Older People’s Strategic Framework
• Consult on and implement reviewed Welsh Language Scheme
• Develop Consultation & Engagement policy A full action plan will be found in the scheme which is available at: http://www.swansea.gov.uk/index.cfm?articleid=27605 Equality Impact Assessments (EIAs) Legislation requires the Council to undertake EIAs. This is a systematic way of examining whether a new or existing initiative affects any person or group of persons adversely. Further information on EIAs (including all completed assessments) is available at http://www.swansea.gov.uk/index.cfm?articleid=13264. More information on equality can be found at http://www.swansea.gov.uk/index.cfm?articleid=1917
8
Sustainable Development Development in Swansea that improves the ‘quality of life’ for all is an important commitment for the Council. However, the Council recognises that development should not undermine Swansea’s strengths such as our exceptional environment or damage the world for others, now or in the future. The Council adopted a Sustainable Development Policy in 2006 which defines sustainable development as: ‘Development that meets the needs of the present without compromising the ability of future generations to meet their own needs.’ In 2009 the City and County of Swansea developed a Sustainable Development Framework to deliver the Sustainable Development Policy which addresses areas such as:
• Political consensus
• Corporate training and awareness raising
• Embedding sustainability principles into corporate procedures and financial management
• Horizon scanning- identifying potential opportunities, threats and trends that will impact on communities
Key achievements in 2009/10 An Audit carried out by PricewaterhouseCoopers in 2009 concluded that the Council has an effective sustainability policy that is widespread and can be successfully demonstrated in a number of service areas. Aside from developing a Sustainable Development Framework, the Council has continued to develop and refine the tools and approaches we use to appraise Council policies, procedures and services. The Council introduced Sustainability Risk Assessments on key European funded projects to embed sustainability principles from the outset. In 2009 the Council introduced weekly collections of kitchen waste for composting and added plastic to our kerbside collection of recyclable materials. Our Corporate Buildings Services gained the highest environmental management standard Green Dragon Level 5, one of only 8 organisations in Wales to do so and we have incorporated renewable energy systems into all new schools such as Penyrheol Comprehensive. The Council has completed a survey of all the green space sites in Swansea and completed the infrastructure improvements for the new Metro Bus service. 938 business premises were inspected during the year to check compliance with Smoke Free Premises Regulations. The Beyond Bricks and Mortar scheme puts people at the heart of our thinking by ensuring clauses in our major contracts benefit local people and the environment. Key actions for 2010/11 In 2009 the Council will look to continue to make improvements in area of sustainability. Sustainability will be included in the assessments for business
9
and service planning and the sustainability risk assessment tool will be used to test all contracts over £140,000. The Council will aim to get sustainability and social clauses included in its building services contracts. A sustainability communication plan will be launched in September and energy efficiency and sustainability awareness raising will be included in the Council’s induction programme. Automatic energy metering will be rolled out across the Council’s corporate properties. We will complete the roll out of the segregated waste collection across all households. The Nature Conservation Team will hold the first 24 hour biodiversity blitz and start the Biodiversity Action Plan Review. The Planning Department are launching a new E-Consultation scheme and will start developing the Local Development Plan for Swansea. The existing bus station located next to the Quadrant shopping Centre will be transformed into a modern bus station with state-of-the-art facilities. More information on sustainable development in Swansea can be found by clicking the following link: www.swansea.gov.uk/sustainabledevelopment
10
Part 1: Reviewing our performance over 2009-10
11
Summary of performance 2009/10 When making performance comparisons between 2008/9 and 2009/10, the following should be considered:
• That nature and number of Performance Indicators (PIs) has changed during that period and therefore direct comparisons may not be appropriate;
• The results do not account for changes in resources and workload during that period;
• There may be changes to the numerator and denominator information which may affect the trends by showing a percentage decline while the actual numbers have increased. For instance, the number of learners leaving Employment Training has risen from 681 in 2008/9 to 1,647 in 2009/10 and the number of those leaving with a positive outcome has risen from 589 in 2008/9 to 1,332 in 2009/10. Despite this significant improvement in the number of young people benefiting from the service, the actual performance indicator shows a decline.
• In some service areas, targets have been downgraded for 2010/11 in order to reflect the impact of disinvestment and reduced resources.
For the period 2009/10, 68% (110 PI’s) of performance indicators either improved compared to 2008/09, were at best performance or stayed the same as 2008/09. 70% of indicators (116 PI’s) that are able to be analysed have met their target for 2009/10. From 2008/09 to 2009/10, 68% of Environment, 66% of Regeneration & Housing, 63% of Resources, 52% of Social Services and 52% of Education Directorate indicators all show improvement or are at best performance. The Education directorate met 81% of their targets for 2009/10, Resources 80%, Regeneration & Housing 77%, Environment 65% and Social Services 48%.
Swansea’s Performance in 2009/10 compared to other Welsh Unitary Local Authorities How does Swansea compare with others?
A number of the performance indicators in the following data tables contain a ‘star rating’. For the nationally available performance indicators, Swansea is compared with Welsh Local Authorities (comparison is based on Swansea’s performance in 2009-10 and the published performance of other Local Authorities 2008-09). This guide to comparative performance is illustrated by a star rating as defined below:
���� Results in the top 25% of Welsh authorities
���� Results in the upper middle quartile range ���� Results in the lower middle quartile range ���� Results in the lowest 25% of Welsh authorities
12
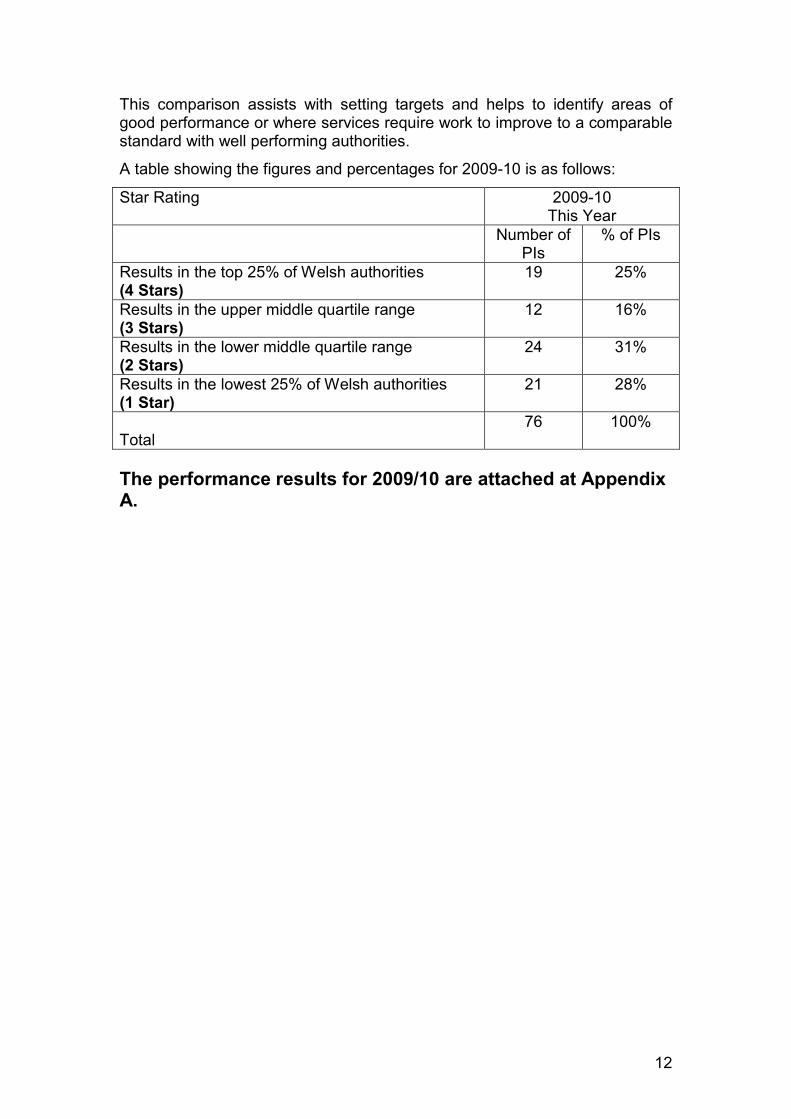
This comparison assists with setting targets and helps to identify areas of good performance or where services require work to improve to a comparable standard with well performing authorities.
A table showing the figures and percentages for 2009-10 is as follows:
Star Rating 2009-10 This Year
Number of PIs
% of PIs
Results in the top 25% of Welsh authorities (4 Stars)
19 25%
Results in the upper middle quartile range (3 Stars)
12 16%
Results in the lower middle quartile range (2 Stars)
24 31%
Results in the lowest 25% of Welsh authorities (1 Star)
21 28%
Total
76 100%
The performance results for 2009/10 are attached at Appendix A.
13
Movement of Risk from 2009/10 to 2010/11 Risk is an event, action, or lack of action that could adversely affect the Council's ability to achieve objectives and to successfully execute its strategies. Risk arises as much from failing to capture opportunities whilst pursuing business objectives as it does from a threat that something bad will happen.
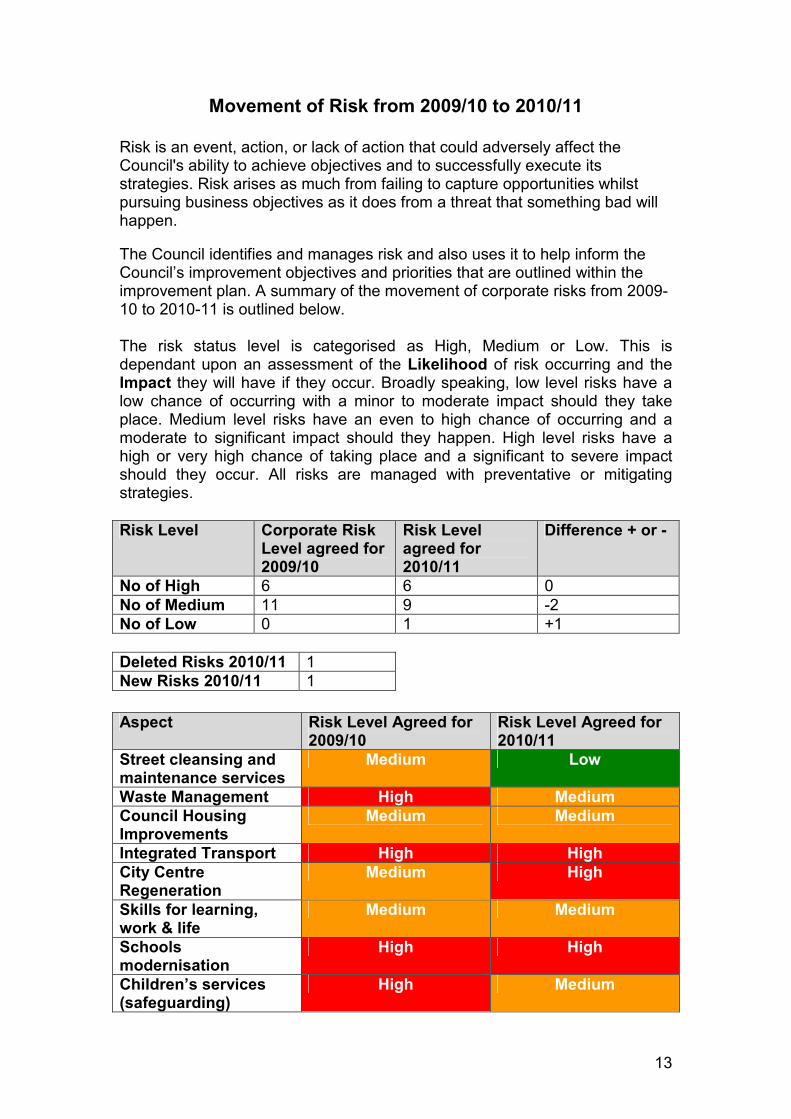
The Council identifies and manages risk and also uses it to help inform the Council’s improvement objectives and priorities that are outlined within the improvement plan. A summary of the movement of corporate risks from 2009-10 to 2010-11 is outlined below. The risk status level is categorised as High, Medium or Low. This is dependant upon an assessment of the Likelihood of risk occurring and the Impact they will have if they occur. Broadly speaking, low level risks have a low chance of occurring with a minor to moderate impact should they take place. Medium level risks have an even to high chance of occurring and a moderate to significant impact should they happen. High level risks have a high or very high chance of taking place and a significant to severe impact should they occur. All risks are managed with preventative or mitigating strategies.
Risk Level Corporate Risk Level agreed for 2009/10
Risk Level agreed for 2010/11
Difference + or -
No of High 6 6 0
No of Medium 11 9 -2
No of Low 0 1 +1
Deleted Risks 2010/11 1
New Risks 2010/11 1
Aspect Risk Level Agreed for
2009/10 Risk Level Agreed for 2010/11
Street cleansing and maintenance services
Medium Low
Waste Management High Medium
Council Housing Improvements
Medium Medium
Integrated Transport High High
City Centre Regeneration
Medium High
Skills for learning, work & life
Medium Medium
Schools modernisation
High High
Children’s services (safeguarding)
High Medium
14
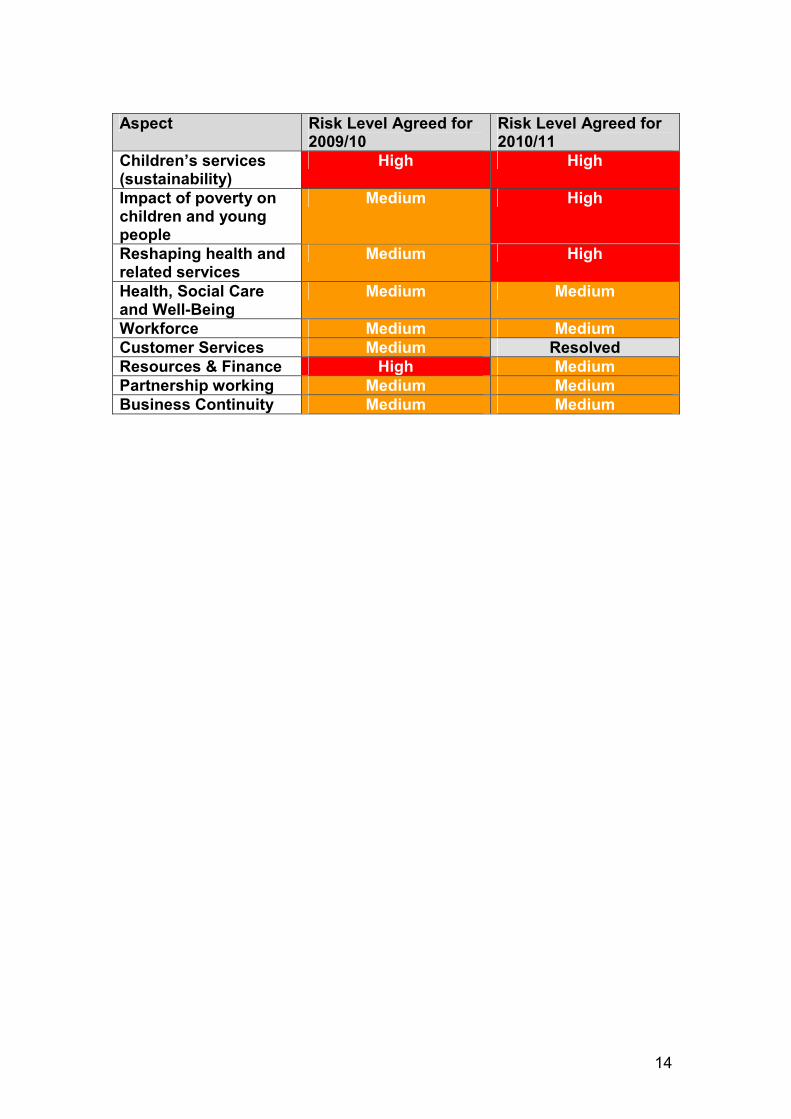
Aspect Risk Level Agreed for 2009/10
Risk Level Agreed for 2010/11
Children’s services (sustainability)
High High
Impact of poverty on children and young people
Medium High
Reshaping health and related services
Medium High
Health, Social Care and Well-Being
Medium Medium
Workforce Medium Medium
Customer Services Medium Resolved
Resources & Finance High Medium
Partnership working Medium Medium
Business Continuity Medium Medium
15
Audit and inspections conducted during 2009/10 Sustainability Policy Local Authorities are increasingly under pressure to develop and implement robust sustainability policies which are fully embedded in the way they deliver their services. The purpose of this study was to review the design and the extent of implementation of the Council’s Sustainability Policy. It sought to answer the question: “Has the Council defined and implemented an effective sustainability policy?” Some of the issues focused around longer term funding and investment, integrating sustainability in business planning and at an operational level, working with external specialist groups e.g. Carbon Trust and the work of the dedicated Sustainable Development Unit. The overall conclusion is that the Council has developed an effective Sustainability Policy. The implementation of the policy is widespread and can be successfully demonstrated in a number of service areas, however, there is further scope to strengthen its integration at the operational level. There were seven recommendations from the study that will help further develop and embed sustainability issues at both a strategic and operational level within the Council. WHQS Follow Up Review A Follow Up Review of WHQS was scheduled for 2009. The scope for this study is under review by the WAO. WAO Report on Development Control This was to respond to the outstanding recommendation of an earlier audit of Planning Services (the Sanders Report). A Task Group was charged with giving consideration to a further four recommendations covering service delivery options, strategic direction, measuring performance and monitoring progress with the actions as a result of the audit. Full details of these were reported to Council on 3rd December 2009 including a copy of the work programme. Buildings Management Review This audit conducted in September 2009, drew an overall conclusion that “The Council (Swansea) is ensuring that its land and buildings management arrangement support improvements in efficiency and service delivery to meet the needs and expectations of users for the 21st Century”. They further went on to say that the use of land and buildings to support the Council’s objectives, which in turn are focused on meeting needs, expectation and improving service delivery is well demonstrated through a well defined Corporate Asset Management Programme, a proactive Asset Management Group and strategic support from both Executive and Members. They considered that, like many other Council’s in Wales, the current economic environment has created specific challenges for the Council, with a significant reduction in Capital Receipts impacting on the capital programme. They noted that the Council recognised that there is some work to do to
16
ensure that services continue to be engaged in a corporate asset and building management culture. Trust Arrangements in the LC This review is being conducted in two phases – Phase 1 reported in January 2010 that partners “shared a common understanding of the spirit of the management agreement, but arrangements to monitor the LC’s contribution to Council strategies (e.g. Climbing Higher and Sports Development) and compliance with the management agreement are not fully developed. Performance information is used routinely to manage the LC, with evidence of service being adapted to meet changing needs. Phase 2 will provide an update focusing on three key questions: What progress is the Council making against the recommendations of the previous WAO report: How well is LC contributing to the Sports Development and Climbing Higher strategies? Are effective arrangements now in place to keep the Council informed of LC performance and progress against agreed objectives? This review is ongoing at the time of writing this report. New Payroll System The review of the payroll project was conducted in July 2009 with the objective of identifying whether the programme had achieved the objectives as defined in its original business case, how well it performed, how well any changes were managed and how risk assessment and mitigation was handled. The findings of the review focused around the level of expertise and experience in complex back office IT implementation, stakeholder engagement, contracting arrangements, impact assessments on risks and the roles and responsibilities of the Council and its partner. The conclusions were a mix of positive and negative statements and a list of 9 ‘lessons to be learned’ which will be incorporated into an action plan going forward with this project. Annual Council Report – Social Services All regulated services are inspected each year and the reports indicate that Social Services and Independent Providers are endeavouring to improve the support that is available. Where concerns arise action is taken to resolve matters. During the last year there has been some effective joint work with the CSSIW and others to ensure that specific concerns are addressed to achieve improvements in the quality of service provided. Within this report is a summary of inspections and reviews conducted during 2009/10 i.e. Adult Protection – December 2009; Children’s Safeguarding Arrangements and a review of Swansea Local Safeguarding Children Board - October 2009, followed by a full inspection of Child and Family Services – reported in March 2010. As mentioned earlier in this report Child and Family continues to be a top priority for the Council and the most recent report recognises that there were improvements over the last twelve months with a sound and effective momentum for change, with potentially the right building blocks being put in place in the coming year to deliver necessary improvement. That said, there remain further challenges to deliver and sustain

17
improvement, and the review team judged that the local authority remains, at present, uncertainly placed to deliver and sustain service improvement. Priorities for action have been identified and an action plan has been drawn up to address these issues. The Annual Report can be viewed on our website: http://www.swansea.gov.uk/index.cfm?articleid=38693
18
What we achieved in 2009-10 This section will describe our shared partnership priorities for 2009-10 as outlined within the Community Plan. It will also report what we have done to deliver our associated aims and priorities for 2009-10 that we set out within the annual Corporate Improvement Plan 2009-12. Swansea Voices is a citizen’s panel representing a cross section of the population of Swansea. The panel consists of 1250 respondents from a cross-section of the City and County of Swansea residents aged 17 plus (using criteria such as age, gender, economic activity, housing type, language, ethnicity, etc.). Panel membership is continuously refreshed and a third is replaced each year. The Panel was asked how successful or unsuccessful the Council was in delivering its priorities during 2009-10. A distinction between universal services (like street cleaning) and targeted services (like adult social services) must be made when interpreting the survey results. More respondents are likely to answer ‘don’t know’ to any question on services that they do not have any knowledge or experience of. For example, a Council tenant is more likely to be informed about improvements made to Council housing than someone living in a different housing tenure.
Aim 1 - Improve and protect our environment and make communities safer so that the City & County is a great place to live.
What were our associated shared partnership priorities in 2009/10?
• Climate Change • Energy and Carbon Management
• Swansea Bay • Wildlife Diversity
• Fear of Crime
What were our priorities in 2009-10? 1. Ensure street cleansing and maintenance services are well co-ordinated. 2. Minimise waste and increase our composting and recycling. 3. Increase the supply of good quality affordable housing and make
improvements to Council housing while working towards meeting the Welsh Housing Quality Standard (WHQS).
What did we plan to do to deliver these priorities in 2009-10? Well-coordinated street cleaning and maintenance services
• Maintain the NEAT programme for the whole of the City and County until March 2012.
19
• Develop the programme for the implementation of the Tidy Town Initiative during 2009-10.
• Finalise new Street Scene arrangements and introduce area cleansing and maintenance teams across the City and County.
• Carry out planned programme for 2009-10 for carriageways, footways and street lighting.
• Undertake carriageway works during 2009-10 to secure WAG local roads maintenance grant.
Minimising waste and increasing recycling
• Expand the Council’s Trade Waste Service’s recycling schemes.
• Review the possibility of introducing fortnightly kerbside collections of plastics, cardboard and textiles.
• Consider alternative proposals to achieve, with the Council’s Waste Disposal Company, the provision of new composting arrangements to achieve targets.
Welsh Housing Quality Standard and affordable housing
• Review the strategic direction in relation to enabling full compliance with the Welsh Housing Quality Standard.
• Agree a Programme Plan for the development of a strategy to enable affordable improvements to the Council housing stock.
• Develop and finalise proposals for consultation for affordable improvements to the Council housing stock.
• Consult key stakeholders on the proposals for affordable improvements to the Council housing stock.
• Submit a strategy and Housing Revenue Account Business Plan for formal approval for achieving affordable improvements to the council housing stock.
• Produce a draft Affordable Housing Delivery Plan which provides a clear statement on how the Council intends to increase the supply of affordable homes.
• Implement the agreed Delivery Plan for increasing the amount of affordable housing.
What have we done in 2009-10 to deliver these priorities? Well-coordinated street cleaning and maintenance services
• Undertook the NEAT programme in 2009-10 as planned.
• Completed the Tidy Town Initiative programme for 2009-10 as planned.
• Started to carry out planned maintenance programmes for footways and carriageways.
• Introduced area cleansing on a trial basis before it was adopted on a permanent basis in 2010/11.
Minimising waste and increasing recycling
• Made recycling schemes for the collection of glass, cans, paper, cardboard and food available for most commercial waste customers.
• Completed a review and started the roll out of fortnightly kerbside collections of plastics and cardboard before completing it in 2010/11.
20
• Developed alternative proposals to achieve, with the Council’s Waste Disposal Company, the provision of new composting arrangements to achieve targets.
Welsh Housing Quality Standard and affordable housing
• Agreed a revised strategic direction for targeted investment in Council housing parallel with a comprehensive consultation programme on the longer term aim of meeting the WHQS.
• Developed and finalised proposals and commenced consultation on the longer term aim of meeting the WHQS.
• Submitted a draft Housing Revenue Account Business Plan to the Welsh Assembly Government for approval.
• Produced and endorsed an Affordable Housing Delivery Plan, which provides a clear statement on how the Council intends to increase the supply of affordable homes.
• Started to implement the Affordable Housing Delivery Plan within the context of changes in the financial climate, particularly in the private sector.
What did the Swansea Voices Panel think? Well-coordinated street cleaning and maintenance services 54.5% of respondents said that the Council was very or fairly successful at delivering street cleansing and maintenance in 2009-10. 22.9% of respondents thought that the Council was fairly or very unsuccessful while 20.7% thought that the Council was neither successful nor unsuccessful. Minimising waste and increasing recycling 88% of respondents said that the Council was very or fairly successful at delivering increased opportunities for composting and recycling in 2009-10. Only 4.5% of respondents thought that the Council was fairly or very unsuccessful while 3.9% thought that the Council was neither successful nor unsuccessful. Welsh Housing Quality Standard and affordable housing 19.9% of respondents said that the Council was very or fairly successful at increasing the supply of affordable housing in 2009-10. 12.6% of respondents thought that the Council was fairly or very unsuccessful while 24.9% thought that the Council was neither successful nor unsuccessful. 42.6% of respondents said that they did not know. 22.9% of respondents said that the Council was very or fairly successful at making improvements to Council Housing in 2009-10. There were 8% of respondents that thought that the Council was fairly or very unsuccessful while 16.5% thought that the Council was neither successful nor unsuccessful. 52.6% of respondents said that they did not know.
21
Aim 2 - Improve Swansea’s economic potential so that the City & County of Swansea supports a prosperous economy.
What were our associated shared partnership priorities in 2009/10?
• Economic Inactivity (Local Service Board priority)
• Young People Not in Education, Employment or Training (Local Service Board priority)
• Air Quality • High Level Skills
What were our priorities in 2009/10? 1. Provide an integrated transport system that considers the night time
economy. 2. Improve public transport and provide a modern bus interchange to
encourage more usage. 3. Improve and develop the City Centre. 4. Improve skills for learning, work and life.
What did we plan to do to deliver these priorities in 2009/10? Integrated transport
• Complete a Regional Transport Plan for South West Wales.
• Implement the Regional Transport Plan.
• Implement recommendations of European Boulevard Study for Oystermouth Road corridor.
• Continue to provide additional taxi rank spaces within the City in response to requests received.
• Continue to provide taxi marshals and enforcement at key locations at critical times.
Improved public transport and a modern bus interchange
• Complete remainder works for the Swansea Metro.
• Complete the construction of the Swansea City bus station.
• Implement Park and Ride service for West Swansea pending future allocation of Transport Grant.
Improve and develop the city centre
• Complete a Strategic Car Park Study in support of proposals identified in City Centre Strategic Framework.
• Continue to deliver a programme of Building Enhancement Schemes in the city centre.
• Define the remainder of phases following a convergence funding decision to continue to deliver a programme of Public Realm and Accessibility Enhancement Schemes up to 2012.
22
Skills for learning, work & life
• Build upon the success of the Swansea Skills Service Objective 1 funded project to develop a Convergence funded Regional Essential Skills Partnership.
• Focus specifically on deprived areas to deliver Basic Skills & Family Learning opportunities as part of an integrated Return to Learn programme.
• Continue to deliver community and targeted learning programmes.
• Continue to improve outcomes of leavers completing Employment Training courses.
• Continue to implement the new all work based learning programme.
• Deliver Assembly requirements for the Foundation Phase (3 and 7) and Skills Curriculum (8 to 13) in schools.
• Target low attaining 7 year olds to improve reading levels.
• Continue to target low attaining 14 to 16 year olds to improve essential skill levels and support these young people 16 to 18 to ensure they do not become Not In Education, Employment or Training (NEET).
• Deliver the Building Enterprise Education in Swansea (BEES) projects supporting the development of innovation, enterprise and entrepreneurship for children and young people.
• Deliver the Knowledge Economy Strategy to improve skills appropriate to the needs of the economy.
• Continued delivery of Basic Skills, Family Learning and Work Based Learning courses for adults.
What have we done in 2009-10 to deliver this priority? Integrated transport
• The Welsh Assembly Government accepted the Regional Transport Plan that had been submitted with the approval of all four Councils.
• £3.250m of Regional Transport Plan funding was allocated to Swansea from the total £4.909m backing for the region in order to implement the Regional Transport Plan.
• Programmed the European Boulevard Preliminary Works to commence late autumn 2010.
• Held ongoing discussions with the taxi trade to identify new viable taxi ranks.
• Continued, in partnership with the Business Improvement District, to provide Taxi Marshals within the city centre on key dates.
Improved public transport and a modern bus interchange
• Completed the Swansea Metro infrastructure works.
• Started the construction of the Swansea City bus station. Improve and develop the city centre
• Completed the lower Oxford Street and Car Parking Strategic studies in support of proposals identified in City Centre Strategic Framework.
• Undertook a limited number of projects to deliver the Building Enhancement Scheme programme in the city centre.
23
• Agreed and defined the remainder phases following the convergence funding decision to continue to deliver a programme of Public Realm and Accessibility Enhancement Schemes within the city centre.
Skills for learning, work & life
• Reconsidered the convergence funded Regional Essential Skills Partnership in light of reduced capacity to fulfil match-funding requirements.
• Maintained the Basic Skills, Family Learning and Work Based Learning courses for adults.
• Delivered community and targeted learning programmes through: 1431 enrolments on Adult and Community Learning programmes; 452 enrolments on ICT/e-learning programmes, and; 434 starts and 84 literacy/numeracy awards relating to the Probation Service contract.
• Improved 81% positive outcomes for leavers completing Employment Training courses.
• 2500 learners participated in work-based learning of which 300 (12%) were over 25 years old.
• WAG Assessment of teacher:pupil ratios carried out in September 2009. Grant resources are sufficient to meet required adult:pupil ratio of 1:8 (3-5 year olds) and 1:15 (5-6 year olds)
• Targeted low attaining 7 year olds to improve reading levels.
• Targeted low attaining 14 to 16 year olds to improve essential skill levels and support these young people 16 to 18 to ensure they do not become NEET.
• Continued to deliver the Building Enterprise Education in Swansea (BEES) projects supporting the development of innovation, enterprise and entrepreneurship for children and young people.
• Continued to deliver the Knowledge Economy Strategy to improve skills appropriate to the needs of the economy through regional collaboration and an internet portal providing information to assist learners to access services, employers to identify skills and partners to share resources.
• Continue to deliver the Basic Skills & Family Learning opportunities in targeted areas dependent on available funding.
What did the Swansea Voices Panel think? Improved public transport and a modern bus interchange 42% of respondents said that the Council was very or fairly successful at providing improved public transport in 2009-10. 21.9% of respondents thought that the Council was fairly or very unsuccessful while 27.2% thought that the Council was neither successful nor unsuccessful. Improve and develop the city centre 32.1% of respondents said that the Council was very or fairly successful at regenerating the city centre in 2009-10. 33.4% of respondents thought that the Council was fairly or very unsuccessful while 29.5% thought that the Council was neither successful nor unsuccessful. 4.9% of respondents said that they did not know.
24
Skills for learning, work & life 28.7% of respondents said that the Council was very or fairly successful at providing opportunities for improving skills for learning, work and life in 2009-10. 10.7% of respondents thought that the Council was fairly or very unsuccessful while 23.4% thought that the Council was neither successful nor unsuccessful. 37.2% of respondents said that they did not know.
25
Aim 3 - Improve services for children and young people and raise standards of attainment and achievement so that the City & County provides excellent education opportunities.
What were our associated shared partnership priorities in 2009/10?
• Early Intervention and Prevention (Local Service Board priority).
• Young People not in Education, Employment or Training (Local Service Board priority).
What were our priorities in 2009/10? 1. Improve Child and Family Services. 2. Deliver the QEd (Quality in Education) 2020 programme. 3. Reduce the impact of poverty on Children and Young people.
What did we plan to do to deliver these priorities in 2009/10? Improve Child and Family Services
• Continue to deliver the Children and Family Services Strategic Delivery Plan.
• Ensure a close fit between preventative services provided in the community and those provided by Child & Family Services.
• Have a clear focus on Family Support Services that are directed to prevent harm, children becoming looked after and children becoming long-term looked after.
• Establish a coherent service for children from family support through accommodation to permanence through the Permanence and Placement Strategy.
• Review staffing structures. QEd 2020 programme
• Further increase the number of Welsh Medium Primary school places.
• Implement the Foundation Phase so that nursery children meet the Assembly statutory requirement of a adult to child ratio of 1:8.
• Implement the 14 to 19 Learning Pathways Measure.
• Continue to improve GCSE Results annually.
• Pilot programme across all schools & units to reduce 16 year olds Not in Education, Employment or Training (NEET) through a September guarantee. Sustain employment of these young people in the ages16 to 18.
• Continue to improve School attendance annually.
• Continue to deliver the Specialist Teaching Facilities (STF) programme.
• Implement the next set of agreed statutory proposals to improve the condition of school assets and learning environments and reduce surplus places.
26
Reducing the impact of poverty on children and young people
• On a phased basis, establish Flying Start in 8 school catchment settings providing free childcare, additional health visiting and basic skill support.
• Continue to improve reading levels of pupils in the early years in areas of deprivation on a targeted basis especially where these are low.
• Depending on a successful Convergence funding bid, deliver a more integrated approach to Welfare to Work through Swansea Working so that children and young people affected by poverty have their life chances improved.
• Deliver the first 12 month Action Plan of the Communities First Programme.
• Continue the programme to take an area approach to address the impact of poverty in the most deprived areas in Swansea including Flying Start, targeted reading programmes in the early years, reduction in health inequalities, early identification and programmes for vulnerable children especially 8 to 13, 14 to 19 Learning Pathways, avoiding being Not in Education, Employment or Training (NEET) at 16, welfare to work programmes and an increase in the take up of benefits.
• Determine targets in the areas of improved health, literacy standards, parenting and increased levels of childcare places, benefits take up and health visiting, exclusions, attendance in schools and measure and publish these annually.
What have we done in 2009-10 to deliver these priorities? Improve Child and Family Services.
• Reviewed and updated the Child and Family Services Delivery Plan in March for 2010-11. Completed a first quarter review, which indicated that good progress is being made against identified targets.
• Review of Family Support Services completed. Research has been commissioned on the interface between services.
• All Family Support Services have been reviewed and refocused on children and young people at risk of harm and / or accommodation.
• A Permanency and Placement Strategy is now being implemented.
• All staffing structures have been reviewed and a new structure agreed by Council. New structures will be implemented on the 30th September, 2010.
QEd 2020 programme
• Completed the delivery of the 14 to 19 Learning Pathways Measure
• Improved the GCSE Results for 2009 compared with the 2008 results and the four year trend.
• Reduced the number of 16 year olds Not in Education, Employment or Training (NEET) from 7.9% in 2008/09 to 6.7% in 2009/10.
• Improved school attendance in 2008/09 compared with 2007/08 to 90.7% (secondary) and 92.4% (primary both with upward 5 year trends.
27
• Current statutory proposals for Welsh medium school places to be referred to the Minister for final decision; if approved, this will increase the number of Welsh medium primary school places available beyond the 2412 target.
• Consulted on all proposals in 2009 to improve the condition of school assets and learning environments and reduce surplus places, which were approved by WAG resulting in 3 primary school closures and 1 amalgamation that will take effect in September 2010.
• Continued to deliver the Specialist Teaching Facilities (STF) programme with places increasing in line with identified need.
Reducing the impact of poverty on children and young people
• Established Flying Start in 5 school catchment settings (one also has Welsh medium provision) operating with capacity for 183 children providing free childcare, additional health visiting and basic skill support.
• Addressed reading levels of pupils in the early years in areas of deprivation on a targeted basis especially where these are low.
• Completed the recruitment process for all posts created by the Swansea Employment Gateway element of the South West Workways project.
• Engaged 298 participants in the South West Workways project in Swansea.
• Delivered the first 12 month Action Plan of the Communities First programme.
• Developed all aspects of a programme that is reporting regularly to adopt an area approach to address the impact of poverty in the most deprived areas in Swansea.
What did the Swansea Voices Panel think? Improve Child and Family Services 20.3% of respondents said that the Council was very or fairly successful at improving children’s social services in 2009-10. 13.7% of respondents thought that the Council was fairly or very unsuccessful while 13.6% thought that the Council was neither successful nor unsuccessful. 52.3% of respondents said that they did not know. QEd 2020 programme 24.8% of respondents said that the Council was very or fairly successful at improving schools and education in 2009-10. 16.4% of respondents thought that the Council was fairly or very unsuccessful while 23.8% thought that the Council was neither successful nor unsuccessful. 35.0% of respondents said that they did not know. Reducing the impact of poverty on children and young people 19.5% of respondents said that the Council was very or fairly successful at reducing the impact of poverty on children and young people in 2009-10. 12.6% of respondents thought that the Council was fairly or very unsuccessful while 18.1% thought that the Council was neither successful nor unsuccessful. 49.8% of respondents said that they did not know.
28
Aim 4 - Improve Health and Social Care services for all so that the City & County supports and promotes good health.
What were our associated shared partnership priorities in 2009/10?
• Healthy Lifestyles
• Health Inequalities between communities
What were our priorities in 2009/10? 1. Reshape and reconfigure Health and related services in Swansea. 2. Implement the Health, Social Care and Well-being agenda.
What did we plan to do to deliver these priorities in 2009/10? Reshape and reconfigure health and related services
• Progress the redesign of Respite Care Services for Older People.
• Continue to redesign Social Care Services for Older People. Health, Social Care & Well-Being agenda
• Implement the Older People Strategy Development Plan for 2009/10.
• Further investigate the aims and objectives of the Welsh Assembly Government’s second Older Person’s Strategy through the Community Plan, Heath Social Care & Well-Being Strategy and other strategies.
• Start to implement the assistive technology strategy and action plan.
• Review arrangements in relation to Intermediate Care Services and Continuing Health Care – Learning Disability.
• Continue to work with the Health & Safety Executive to prevent and reduce the number of workplace injuries in Swansea.
• Complete the Healthy Weight Strategy to help decrease the prevalence of people overweight/obese people in Swansea.
What have we done in 2009-10 to deliver this priority? Reshape and reconfigure health and related services
• Agreed a new model for Respite Care through the Health & Social Care Overview Board.
• Implemented recommendations and an action plan jointly with Health & Social Care Overview Board for Respite Care Services.
• Established an extended assessment service for domiciliary care provided by the Local Authority.
• Implemented a new model of day opportunities which will support re-enablement and promote independence for older people.
• Worked towards increased access to long term care for older people with mental health problems.
Health, Social Care & Well-Being agenda
• Delivered the Older People Strategy Development Plan for 2009/10.
29
• Identified key areas for mainstreaming the Welsh Assembly Government’s second Older Person’s Strategy into the work of the Council and its partners.
• Started to implement the assistive technology strategy and action plan with over 800 telecare packages installed to support older people and their carers at home.
• Started to review arrangements in relation to Intermediate Care Services and Continuing Health Care – Learning Disability.
• Worked with the Health & Safety Executive to undertake 75 inspections to help prevent and reduce the number of workplace injuries in Swansea.
• Developed and implemented Healthy Weight Strategy Standards and a year one action plan.
What did the Swansea Voices Panel think? Reshape and reconfigure health and related services 19% of respondents said that the Council was very or fairly successful at improving social care services for adults in 2009-10. 16% of respondents thought that the Council was fairly or very unsuccessful while 18.4% thought that the Council was neither successful nor unsuccessful. 46.6% of respondents said that they did not know. Health, Social Care & Well-Being agenda 33.4% of respondents said that the Council was very or fairly successful at helping people to adopt healthier lifestyles in 2009-10. 13.4% of respondents thought that the Council was fairly or very unsuccessful while 29.8% thought that the Council was neither successful nor unsuccessful. 23.5% of respondents said that they did not know.
30
Aim 5 - Make the best use of our resources so that the City & County provides the best possible services.
What were our associated shared partnership priorities in 2009/10?
• Consultation and Participation (Local Service Board priority)
• Equal Access to Services
What were our priorities in 2009/10? 1. Implement the Workforce Programme. 2. Improve customer access through a Customer Service Strategy. 3. Live within our resources and achieve financial stability. 4. Improve partnership and joint working arrangements to increase efficiency
and savings.
What did we plan to do to deliver these priorities in 2009/10? Workforce programme
• Progress the Workforce Programme.
• Finalise contact with the majority of Equal Pay claimants and manage remaining tribunal cases.
• Progress the Pay and Grading project as part of the Workforce Programme.
• Review employee Terms and Conditions.
• Review the Human Resources service.
• Develop an Employee Services Delivery Model.
• Undertake a Policy & Procedure Review.
• Start work on a Management Development Plan.
• Progress implementation of Payroll Customer Service Strategy
• Incorporate the Customer Service guidelines into the Human Resources Induction Packs.
Living within our resources
• Maintain and update the Medium Term Financial Plan.
• Continue to deliver the Medium Term Financial Plan through the Business Improvement Board.
• Continue to monitor the delivery of the Asset Management Plan 2009.
• Complete and publish the Asset Management Plan 2010. Improving partnership and joint working arrangements
• Continue to pilot the Programme and Project Management in the four open projects that report to the Local Service Board (LSB).
• Revisit the governance structure in the four open projects reporting to the LSB to check fitness for purpose.
• Consider joint working opportunities in the annual budget round.
31
What have we done in 2009-10 to deliver this priority? Workforce programme
• Developed an approach to Strategic Workforce planning.
• Worked on developing a Change strategy within the Workforce Programme.
• Delivered the Equal Pay Act.
• Completed the Pay & Grading Project up to the Job Evaluation stage and started pay modelling/costing.
• Designed a pay and grading system for Council staff.
• Completed a review of Council staff terms and conditions.
• Completed a review of Human Resources services and implemented new service levels.
• Reviewed key Human Resources and wider council policies.
• Worked on a management staff development plan.
• Element of transactional services operating
• Established priorities for Human Resources Management System (HRMS) improvements and taken them forward for implementation.
• Set up Pensioners and Teachers payrolls live on the new payroll system. Customer Service Strategy
• Updated and reissued the Customer Services Staff Guidelines and the Customer Charter and included them in induction packs for new staff.
Living within our resources
• Maintained, monitored and further updated the Medium Term Financial Plan, which was agreed at Council.
• Monitored the Asset Management Plan 2009 and completed the 2010-11 plan, which was approved by Council.
• Identified potential joint working opportunities within the Medium Term Financial Plan Action Plan agreed by Council.
Improving partnership and joint working arrangements
• Four open projects that report to the Local Service Board use the Council’s corporate Project Management methodology to help successful delivery.
• Governance arrangements for the Early Intervention and Prevention Programme and the wider Children and Young People were simplified and streamlined.
• Considered joint working opportunities in the annual budget round.
32
Improvement Agreement 2009/10
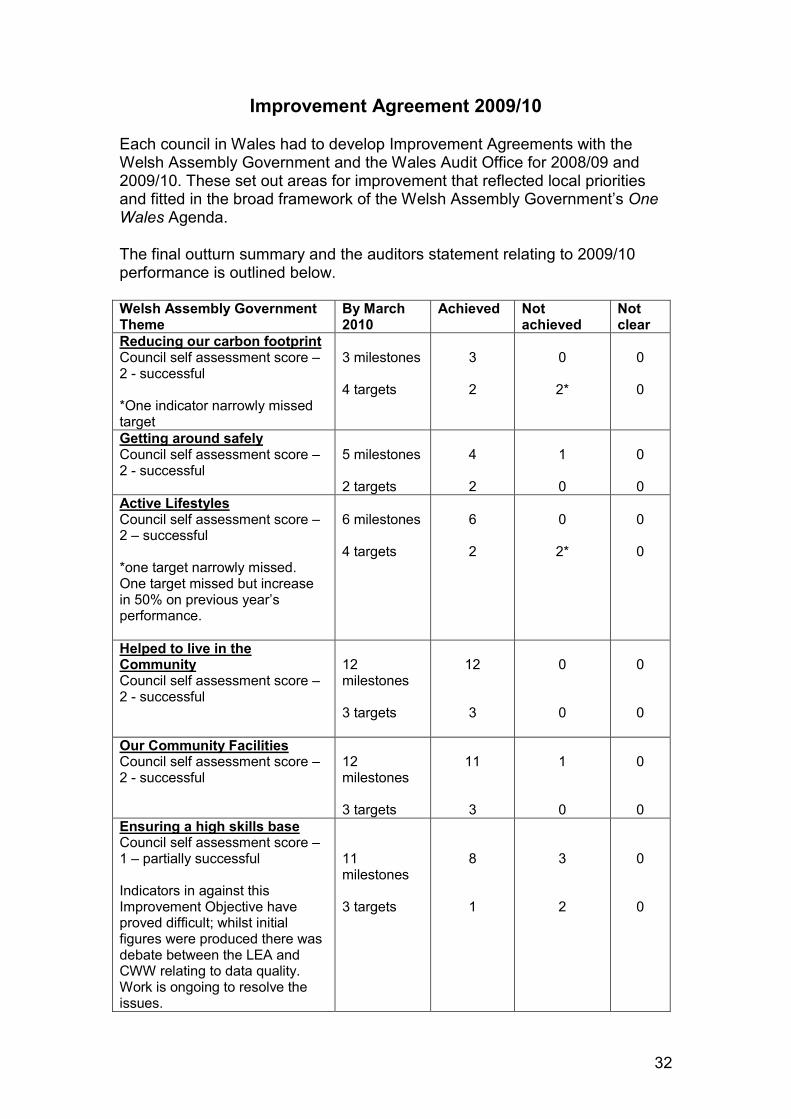
Each council in Wales had to develop Improvement Agreements with the Welsh Assembly Government and the Wales Audit Office for 2008/09 and 2009/10. These set out areas for improvement that reflected local priorities and fitted in the broad framework of the Welsh Assembly Government’s One Wales Agenda. The final outturn summary and the auditors statement relating to 2009/10 performance is outlined below. Welsh Assembly Government Theme
By March 2010
Achieved Not achieved
Not clear
Reducing our carbon footprint Council self assessment score – 2 - successful *One indicator narrowly missed target
3 milestones 4 targets
3 2
0
2*
0 0
Getting around safely Council self assessment score – 2 - successful
5 milestones 2 targets
4 2
1
0
0 0
Active Lifestyles Council self assessment score – 2 – successful *one target narrowly missed. One target missed but increase in 50% on previous year’s performance.
6 milestones 4 targets
6 2
0
2*
0 0
Helped to live in the Community Council self assessment score – 2 - successful
12 milestones 3 targets
12
3
0
0
0 0
Our Community Facilities Council self assessment score – 2 - successful
12 milestones 3 targets
11
3
1
0
0 0
Ensuring a high skills base Council self assessment score – 1 – partially successful Indicators in against this Improvement Objective have proved difficult; whilst initial figures were produced there was debate between the LEA and CWW relating to data quality. Work is ongoing to resolve the issues.
11 milestones 3 targets
8 1
3
2
0 0
33
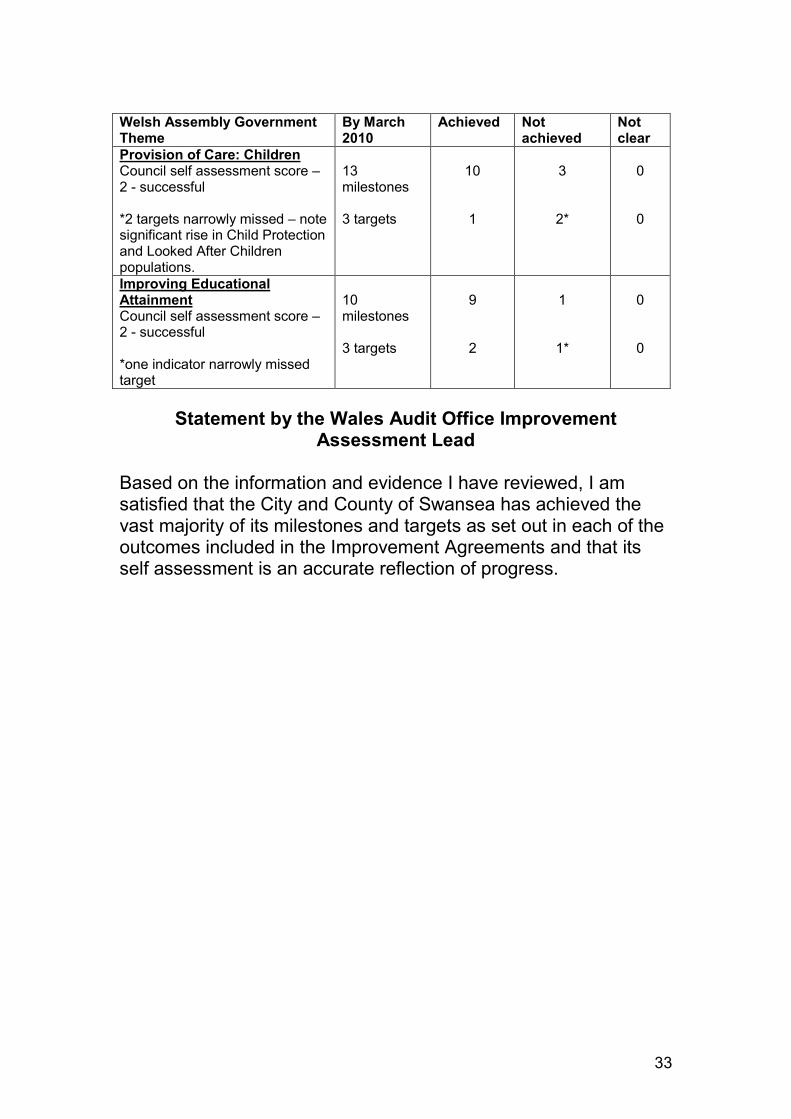
Welsh Assembly Government Theme
By March 2010
Achieved Not achieved
Not clear
Provision of Care: Children Council self assessment score – 2 - successful *2 targets narrowly missed – note significant rise in Child Protection and Looked After Children populations.
13 milestones 3 targets
10
1
3
2*
0 0
Improving Educational Attainment Council self assessment score – 2 - successful *one indicator narrowly missed target
10 milestones 3 targets
9 2
1
1*
0 0
Statement by the Wales Audit Office Improvement Assessment Lead
Based on the information and evidence I have reviewed, I am satisfied that the City and County of Swansea has achieved the vast majority of its milestones and targets as set out in each of the outcomes included in the Improvement Agreements and that its self assessment is an accurate reflection of progress.
34
Efficiency Gains The Welsh Assembly Government set a target for recurring value for money improvements across the public sector in Wales over a five year period ending in 2009/10. This target was set at 1% of the annual Standard Spending Assessment (SSA) for each Authority and in the case of the City and County of Swansea equated to approximately £3.3m per annum. The identification of value for money improvements requires a reassessment and challenge of existing processes and services to consider whether anything can be done differently to achieve improvements and whether better use can be made of resources. The WAG issued guidance on how efficiency gains were to be identified and recorded. Value for money efficiency gains are defined in terms of inputs and outputs as either: Cash releasing - the same outputs for reduced inputs, or same outputs for reduced prices; or
Non cash releasing - additional outputs for the same inputs Cash releasing efficiency gains are available to be reinvested in front line services and are noted as cash releasing even where the gain is reinvested in the same programme/policy area. Efficiency gains arise from actions taken or process changes (i.e. something different has been done) to achieve a beneficial outcome in terms of reduced inputs, or increased outputs or cost avoided. They are not cuts in budget, reallocation of budget, non use of contingency, under-spend on budget, reduction in budget, or phased or delayed implementation of a new service. Possible sources of value for money gains include
• Smarter procurement
• Streamlining support services
• Shaping public services to meet the needs of today
• Better use of staff time, skills and expertise Approach to achieving efficiency gains The Council’s annual budget and Medium Term Financial plan (MTFP) processes include a requirement to identify significant annual savings. The aim is always to maximise efficiency savings in order to avoid service spending cuts. Services are encouraged to put forward Invest to Save proposals with a view to achieving efficiency gains at a future time.
35
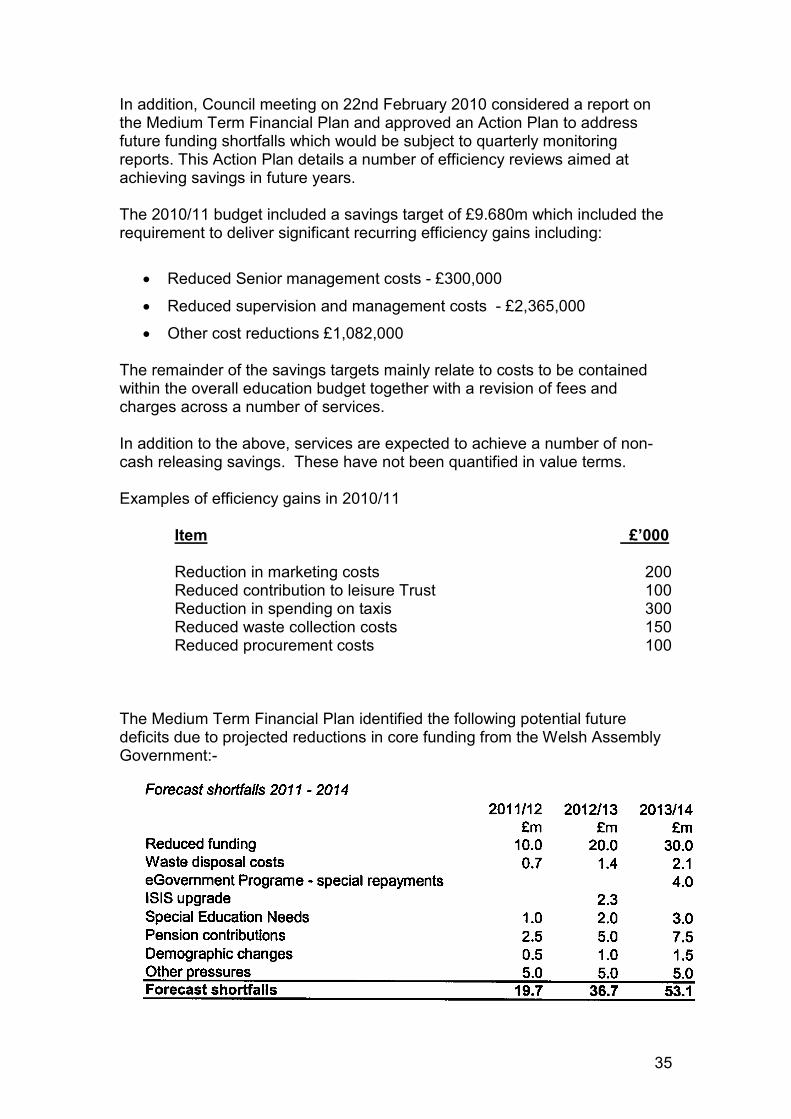
In addition, Council meeting on 22nd February 2010 considered a report on the Medium Term Financial Plan and approved an Action Plan to address future funding shortfalls which would be subject to quarterly monitoring reports. This Action Plan details a number of efficiency reviews aimed at achieving savings in future years. The 2010/11 budget included a savings target of £9.680m which included the requirement to deliver significant recurring efficiency gains including:
• Reduced Senior management costs - £300,000
• Reduced supervision and management costs - £2,365,000
• Other cost reductions £1,082,000
The remainder of the savings targets mainly relate to costs to be contained within the overall education budget together with a revision of fees and charges across a number of services. In addition to the above, services are expected to achieve a number of non-cash releasing savings. These have not been quantified in value terms. Examples of efficiency gains in 2010/11
Item £’000 Reduction in marketing costs 200 Reduced contribution to leisure Trust 100 Reduction in spending on taxis 300 Reduced waste collection costs 150 Reduced procurement costs 100
The Medium Term Financial Plan identified the following potential future deficits due to projected reductions in core funding from the Welsh Assembly Government:-
36
The calculation and capture of the savings for those future years will be derived from items identified from within the Medium term Financial Plan (Action Plan) and the detailed budget proposals as agreed for each year. The Medium Term Financial Plan, however, made clear that in addition to the items included in the Action Plan, due to the scale of the predicted deficits further action would be required during 2010/11 and beyond which will inevitably include:-
• A significant headcount reduction
• A reduction of service levels
• A reduction of service provision
• Increased charges for Council services
The efficiency gain outturn for 2009/10 is attached at Appendix B.
37
Part 2: Review of Plans in place for 2010-11
38
Summary of Improvement Objectives for 2010/11 and plans to meet them
The full details around this along with the relevant actions, performance measures and plans to meet improvement objectives and put arrangements in place to continuously improve is the subject of Making a Difference our forward looking improvement plan for 2010-11. The link is listed below: http://www.swansea.gov.uk/index.cfm?articleid=155
Selecting improvement objectives The Improvement Objectives were selected with due reference to the strategic objectives outlined within the Community Strategy 2010-14, the priorities outlined within the Corporate Improvement Plan 2009-12 approved by Council in October 2009 and priorities identified in other key plans such as the Children & Young People Plan and Health, Social Care and Well-Being Strategy. Consideration was also given to our performance data, audit and scrutiny reports, results from previous consultations with Swansea Voices Citizens Panel and national priorities. More detailed reasons for selecting Improvement Objectives and the outcomes citizens can expect are contained within Making a Difference. In summary, we want to:
1. Improve services for children and young people, maximise well-being, raise standards of attainment and achievement and ensure they are safe so that the City & County provides excellent education opportunities. Improve Child & Family Services. What are our plans to do this? � This will be addressed by tackling issues identified by the CSSIW report
published in March 2010 through the Child and Family Services Strategic Delivery Plan 2010-11.
Progress the QEd 2020 Programme and improve skills for learning, work and life. What are our plans to do this? � Children succeeding in school; � Improving the learning environment in schools by ensuring there are not
excessive surplus places and that there is Welsh medium provision and adequate specialist teaching facilities to meet demand, and;
39
� children and young people better equipped with skills for succeeding in learning, work and life.
In conjunction with others, work to reduce the impact of poverty on children and young people. What are our plans to do this? � Working with children and young people from the most deprived areas to
improve skills and reading; � delivering the Communities First programme, and; � training and supporting young people not in education, training or
employment.
2. Improve and protect our environment and make communities feel safer so that the City & County is a great place to live. Ensure that all public spaces in neighbourhoods are well maintained. What are our plans to do this? � A co-ordinated and area based approach to street cleaning and
maintenance; � a new 5-year planned highway maintenance programme; � improving public confidence in the Police and Council to reduce crime and
anti-social behaviour by holding Police and Communities Together (PACT) meetings and removing graffiti, and;
� making improvements to parks and open spaces. Reduce Swansea’s ecological footprint by encouraging; the minimisation of waste, an increase in recycling and a decrease in the amount of waste sent to landfill. What are our plans to do this? � Introduce segregated waste collections. � Extend the recycling of gully waste. Encourage the provision of affordable, good quality, well managed housing in Swansea and to work towards improving Council Housing up to the Welsh Housing Quality Standard (WHQS) What are our plans to do this? � Consult on improving the condition of the Council housing stock and the
future aim of achieving the WHQS and then deliver targeted and affordable improvements.
� Provide affordable housing in conjunction with others.
40
� Bring empty homes back into use and deal with problem dilapidated buildings.
� Review and adopt a new licensing policy for Houses in Multiple Occupation (HMO’s).
3. Improve Swansea’s economic performance so that the City & County of Swansea supports a prosperous economy. Provide a more integrated transport system that promotes the use of public transport. What are our plans to do this? � Complete Swansea Bus Station. � Appoint more civic parking enforcement officers and monitor effectiveness. � Improve the walking and cycling network. Improve and develop infrastructure that supports Swansea’s economic regeneration focussing on the City Centre, Waterfront, Strategic Employment Sites and Regeneration Areas What are our plans to do this? � Look to improve city centre retail facilities. � Offer and award grants in the city centre and strategic employment sites to
enhance and develop buildings and property. � Improve accessibility and the public realm in the City Centre & Waterfront. � Start to develop infrastructure at the Felindre site. � Plan to commence delivery of Western Valleys Regeneration Area
Programme.
4. Improve health and social care services for all so that the City & County supports and promotes good health Reshape and reconfigure Health and related services in Swansea. What are our plans to do this? � Redesign Respite and Social Care Services for Older People. � Reshape Acute (Hospital) and Community Based Care and Mental Health
Services. Promote and encourage healthier lifestyles. What are our plans to do this? � Implementing the Older Persons Strategy, Assistive Technology action
plan and Climbing Higher physical activity strategy. � Raise awareness of health and safety risks to the public.
41
Main Findings from the 2010-11 Corporate Assessment by the Auditor General Wales
This Preliminary Corporate Assessment Report sets out the findings of the Corporate Assessment and is designed to answer the question: ‘Are the arrangements of the City and County of Swansea (the Council) likely to secure continuous improvement?’ The main conclusion arising from the first Corporate Assessment is that some corporate arrangements have improved and are positively supporting improvement,1 but there are still some weaknesses and the Council’s leadership now faces the challenge of delivering the necessary improvements in a very difficult fiscal environment. Part 1: How the Council has approached improvement over time Following a period of significant change, the Council now has more settled leadership but will need to make tough and timely decisions to protect essential services and secure improvement in a very challenging environment. The Council has been characterised by significant leadership changes and a mixed picture of achievement. The Council now has more settled political and senior officer leadership and is improving some key services, although Child and Family Services remain subject to intervention. The Council faces significant challenges and will need to make tough and timely decisions to protect essential services and secure improvement. Part 2: Analysis of the Council’s arrangements to help it improve Some arrangements are positively supporting improvement and there is a stable Corporate Management Team, however there are some governance problems and flaws in some business arrangements. Partnership arrangements, project management and some aspects of resource management are positively supporting improvement. The Council has a stable Corporate Management Team and a generally coherent set of policies and strategies but there are some governance problems and leadership needs to take tough and timely decisions to secure the necessary savings.
1 The Council has produced the following definition:
Continuous improvement is developing and implementing sustainable solutions, taking into account
the needs and wants of the citizen, in the context of public spending cuts.
42
Some flaws in business planning, performance and risk management and aspects of people management may compromise future improvement.
The Auditor General did not identify any recommendations for improvement for the Council under Section 19 of the Local Government (Wales) Measure 2009. There were many positive aspects identified by the report. However, there were some suggestions for improvement as described below: Exhibit 1: Areas for improvement
1. Engage further with partners to identify shared outcomes, and develop success measures and performance indicators.
2. Ensure that strategic plans are carefully aligned to, and integrated
with, the Medium Term Financial Plan (MTFP) to strengthen corporate business planning.
3. Ensure that financial planning and service planning are better
integrated to improve ownership of budgets and the actions required to achieve savings.
4. Explore ways of strengthening accountability for Member behaviour
and reducing the rate of referral to the Ombudsman. This might include consideration of a more active role for the Standards Committee and/or developing internal mechanisms for resolving complaints.
5. Ensure that there is a clearer structure for decision making in ICT
and consideration of options for future ICT delivery. 6. Shift some of the balance of HR effort to future oriented planning and
action to help the Council prepare for and mitigate significant risks before they develop.
7. Specifically, the Council needs to focus on the following areas:
• HR strategy
• Strategic workforce planning
• Individual performance appraisal 8. Improve the integration between service, financial and workforce
plans to create a strategic approach to staff cost reduction that reduces the risk of a future mismatch between resource requirements and skills supply.
An action plan will be developed to address these suggested areas for improvement in readiness for the Corporate Assessment 2011-12.
43
Glossary • Affordable housing - Low cost market, and subsidised housing that is
available to people who cannot afford to rent or buy houses generally available on the open market
• Affordable Housing Delivery Statement - A clear statement of how a Local Authority intends to improve delivery of Affordable Housing as part of their strategic housing and planning functions. It will also provide direction and support to stakeholders and partners involved in the delivery of affordable housing. http://www.swansea.gov.uk/index.cfm?articleid=1319
• Anti-Social Behaviour (ASB) - any behaviour that causes harassment, alarm or distress to one or more persons, not of the same household. http://www.saferswansea.org.uk/index.cfm?articleid=19187
• Asset Management Plan - A 'snapshot' summary report of the condition of property holdings owned or leased by the Council. It also considers proposals on how these assets should be managed in the years to come. http://www.swansea.gov.uk/index.cfm?articleid=18369
• Assistive technology is technology used by individuals with disabilities in order to perform functions that might otherwise be difficult or impossible.
• Beyond Bricks & Mortar initiative - Designed to ensure that building and supply contracts for regeneration projects in the city offer direct benefits for local people. http://www.swansea.gov.uk/index.cfm?articleid=5956
• Building Enhancement Schemes (city centre). - Funding from the Welsh Assembly Government's Building Enhancement Programme to redevelop Swansea City Centre. http://www.swansea.gov.uk/index.cfm?articleid=7589
• Building Enterprise Education in Schools (BEES) - A project to develop a co-ordinated enterprise education programme across all schools and colleges in Swansea, so that all young people can access high quality provision. http://www.swansea2020.com/index.cfm?Articleid=25306
• Business Improvement District (BID) - Swansea Business Improvements Business Improvements (Swansea BID) was created by businesses in Swansea city centre in March 2006. Swansea BID is a business in its own right and is controlled by a board of directors drawn from stakeholders in the city centre who were nominated by its members and give their experience and time for free. These directors are local independent business owners, national businesses and councillors representing the local authority. http://www.swanseabid.co.uk/index.html
44
• City Centre Strategic Framework - A strategy that will facilitate and support development, transport, infrastructure and environmental enhancements within Swansea City Centre over the coming 10 - 15 years. http://www.swansea.gov.uk/index.cfm?articleid=13786
• City Centre Strategic Parking Study - http://www.swansea.gov.uk/index.cfm?articleid=7589
• Climbing Higher Sport and Physical Activity Strategy - The Council’s long term strategy for sport and physical activity aims to increase the participation of sport and physical activity as well as help the people of Swansea lead active and healthy lives. http://www.swansea.gov.uk/climbinghigher
• Communities First - a Welsh Assembly Government funded initiative. Its aim is to improve the opportunities and quality of life for people living and working in areas of Wales which do not have the same level of income, housing, education, health and access to services as other areas. http://www.swansea.gov.uk/index.cfm?articleid=14868
• Convergence funding - Convergence, the successor to the Objective 1 programme, will run from 2007 to 2013, and covers the same geographical area as the existing West Wales & the Valleys programme with approximately the same total programme value of £1.4bn. The programme has been designed with a much stronger emphasis on activities that promote sustainable jobs and growth in line with the EU Lisbon and Gothenburg agendas. http://www.swansea.gov.uk/convergence
• Delayed transfers of care - A delayed transfer of care is experienced by a hospital inpatient that is ready to move on to the next stage of care but is prevented from doing so for one or more reasons.
• Domiciliary Care - home care for adults provided by staff directly employed by the Council or by an independent care agency working on behalf of the Council. http://www.swansea.gov.uk/index.cfm?articleid=23065
• Early Intervention & Prevention - The Early Intervention and Prevention Programme takes as a starting point research findings that highlight that the health, well-being & future prospects of young people living in poverty are significantly reduced compared to young people not living in poverty. The pilot will put in place initiatives to support children, young people & their families. http://www.swansea.gov.uk/index.cfm?articleid=29118
• Equal Pay - It is unlawful for employers to pay men and women differently for the same jobs, jobs that have been rated the same under a job evaluation study, or jobs that are of equal value. http://www.equalityhumanrights.com/advice-and-guidance/information-for-employers/equal-pay-resources-and-audit-toolkit/
45
• European Boulevard Study for Oystermouth Road corridor – An initial study looking at the concept of creating a high quality European boulevard along Oystermouth Road, stretching from the Tawe bridges to the Civic Centre. http://www.swansea.gov.uk/index.cfm?articleid=13786
• Family Support Services - A number of specialist support services are provided by the Council in order to enhance the quality of life of children in need and prevent family breakdown. Services include practical support and programmes to improve parenting skills. Services normally last for a set period of time, and are intended to meet a specific need. Some families may be referred for more than one service at the same time. http://www.swansea.gov.uk/index.cfm?articleid=16093
• Flying Start - Flying Start is targeted at 0-3 year olds in the most disadvantaged communities in Wales. It aims to create positive outcomes in the medium and long term. It is a prescriptive programme based on international evidence of what works. http://new.wales.gov.uk/topics/childrenyoungpeople/parenting/help/flyingstart/?lang=en
• Foundation Phase (3 to 7) - Framework for Children’s Learning for 3 to 7-year-olds in Wales. http://new.wales.gov.uk/topics/educationandskills/curriculumassessment/arevisedcurriculumforwales/foundationphase/?lang=en
• Healthy Weight Strategy - The Healthy Weight Strategy was developed for Swansea by Public Health Wales in partnership with a multi-agency Healthy Weight Strategy Steering Group during 2008. The Strategy aims to develop a more integrated approach to increasing physical activity levels and improving nutrition across Swansea's population. http://www.swansea.gov.uk/hcswip/index.cfm?articleid=36490
• Houses of Multiple Occupation (HMOs) - The Housing Act 2004 defines a HMO as a property that is: occupied by 3 or more people, forming 2 or more households, sharing amenities e.g. bathroom and kitchen facilities, or; converted into self-contained flats, but does not meet the requirements of the 1991 Building Regulations and less than two thirds of the flats are owner occupied, or; occupied by 3 or more people, forming 2 or more households in a converted building that is not entirely self-contained. E.g. a basement flat with shared accommodation with a maisonette at ground & first/second floor levels. http://www.swansea.gov.uk/index.cfm?articleid=6602
• Housing Revenue Account (HRA) - The Housing Revenue Account (HRA) is a separate landlord account that any council with more than 50 council dwellings must keep. http://www.communities.gov.uk/housing/decenthomes/councilhousingfinance/housingrevenueaccount/
46
• Integrated Transport - providing a balance between different modes of accessible transport that seeks to reduce overall use of the private car. http://www.swansea.gov.uk/index.cfm?articleid=1907
• Intermediate care services - support, which could be care or equipment, to help people build back their skills and enable them to live at home as independently as possible. http://www.swansea.gov.uk/index.cfm?articleid=21248
• Job Evaluation – work undertaken to produce a new pay structure for Council employees.
• Knowledge Economy – a local economy built on knowledge-intensive businesses. http://www.swansea.gov.uk/index.cfm?articleid=26246
• 14 – 19 Learning Pathways Measure – a commitment to transforming the learning provision for all young people in Wales. It addresses the need for a flexible and balanced approach to the education of 14-19 year olds. http://wales.gov.uk/topics/educationandskills/policy_strategy_and_planning/learningpathways1419/?lang=en
• Local Service Board - a problem solving group which includes the leaders of Swansea's main service providers as well as representatives of the Voluntary and Business sectors and the Welsh Assembly Government. http://www.swansea.gov.uk/index.cfm?articleid=19637
• Medium Term Financial Plan - A 3 year financial plan estimating for each year: resources available; and income and expenditure. http://www.swansea.gov.uk/index.cfm?articleid=35424
• Municipal Waste – Household and certain types of commercial waste collected by the local government for disposal. http://www.swansea.gov.uk/index.cfm?articleid=22427
• NEAT Programme - Collaboration between Environment and Social Services that aims to give meaningful work to adults with learning disabilities, whilst also cleaning up parts of the city and county which the authority wouldn't otherwise be able to reach. http://www.swansea.gov.uk/index.cfm?articleid=3149
• NEET – Young People Not in Education, Employment or Training. http://www.swansea.gov.uk/index.cfm?articleid=29119
• Performance Indicator (PI) - A measure of performance against objectives. http://www.dataunitwales.gov.uk/Publication.asp?id=SX8439-A77F7332
• Police and Communities Together (PACT) - Police and Communities Together (PACT) meetings are intended to give communities an
47
opportunity to highlight the community issues that are having an impact on quality of life and to assist in deciding which are dealt with as priorities. http://www.ourbobby.com/en/content/cms/about_pact/about_pact.aspx
• Project Management - A temporary endeavour undertaken to create a unique product, service or result. http://www.swansea.gov.uk/index.cfm?articleid=17932
• Programme Management - A series of projects co-ordinated and managed as a unit in order to achieve outcomes and realise benefits. http://www.swansea.gov.uk/index.cfm?articleid=18369
• Public Realm and Accessibility Enhancement Schemes (city centre) – Projects to improve public areas and accessibility within Swansea city centre. http://www.swansea.gov.uk/index.cfm?articleid=7589
• Regional Transport Plan - The Regional Transport Plan is the result of joint working between the four local authorities in south west Wales and replaces the individual local transport plans previously adopted by the 4 councils. As well as acting as a bidding document for major transport schemes it will shape transport policy in the region for the next 5 years and beyond. http://www.swansea.gov.uk/index.cfm?articleid=1907
• Return to Learn - sessions held in venues across Swansea, both daytime and evening, to help people brush up on their English and Maths. http://www.swansea.gov.uk/index.cfm?articleid=24113
• Segregated waste collections - weekly kerbside collections of different elements of household waste collected on different weeks. http://www.swansea.gov.uk/index.cfm?articleid=1011
• Specialist Teaching Facilities (STF’s) - A number of mainstream schools have resources, facilities and specially trained staff to cater for the needs of children with particular learning difficulties. http://www.swansea.gov.uk/index.cfm?articleid=17358
• Strategic Employment Sites – sites providing a focus for regeneration activity primarily for employment purposes. http://www.swansea.gov.uk/index.cfm?articleid=5962
• Strategic workforce planning - improving the capability and capacity of Council staff and processes in order to deliver better services to customers by: providing a link between the businesses strategies/ plans and resource plans; identifying future skills and competencies needed to deliver new and improved services; analysing the present workforce; comparing the present and the future and identifying the gaps, and; strategies to address the gaps.
48
• Workforce Programme - projects co-ordinated and managed as a unit aimed at improving the capability and capacity of Council staff and processes in order to deliver better services to customers.
• Strategy for Older People (Older Person’s Strategy) - The Welsh Assembly Government is committed to tackling discrimination against older people, promoting positive images of ageing and giving older people a stronger voice in society. - http://wales.gov.uk/topics/olderpeople/strategy/?lang=en
• Street Scene – Council services working together introducing area cleansing and maintenance teams across the City and County. http://www.swansea.gov.uk/index.cfm?articleid=3149
• Swansea City Bus Station - Replaces the existing outdated and rundown bus station with a modern high quality Transport Interchange and caters for buses, coaches and Swansea Metro vehicles. http://www.swansea.gov.uk/index.cfm?articleid=30342
• Swansea Employment Gateway - a project under the Convergence programme aimed at procuring and investing in organisations that are working with people outside employment and those hardest to reach. http://www.swansea.gov.uk/index.cfm?articleid=26289
• Swansea Metro – a £14m package aimed at improving the public transport network in Swansea. http://www.swansea.gov.uk/index.cfm?articleid=14859
• Swansea Workways – a £25 million project led by Neath Port Talbot Council in collaboration with Carmarthenshire, Pembrokeshire and City and County of Swansea, that will tackle the barriers that prevent individuals from accessing the labour market before matching local people with businesses, helping them gain the vital experience needed to find long term employment. http://www.swansea.gov.uk/index.cfm?articleid=33411
• Telecare - or assistive technology, are the terms used for remotely-monitored electronic equipment installed in your home to help manage the risks associated with independent living. http://www.swansea.gov.uk/index.cfm?articleid=20432
• Tidy Town Initiative - A £12 million drive to get people to clean up and improve their local environment. The Tidy Towns scheme provides funding to Keep Wales Tidy and all 22 Welsh local authorities to work in partnership for 3 years to tackle local environmental issues. http://www.keepwalestidy.org/our-projects/tidy-towns
• Welsh Housing Quality Standard (WHQS) - The physical standard, condition and management of existing housing must be maintained and
49
improved to the Welsh Housing Quality Standard (the Standard). http://new.wales.gov.uk/topics/housingandcommunity/housing/social/whqs/;jsessionid=FpqjLTQRny382TDd1HN9VVK8lz8lWSQ1wgjHv6ZKcLNxpVh3hSv2!-1820637139?lang=en
• West Wales and the Valleys programme – Convergence, the successor to the Objective 1 programme, will run from 2007 to 2013, and covers the same geographical area as the existing West Wales & the Valleys programme with approximately the same total programme value of £1.4bn. The programme has been designed with a much stronger emphasis on activities that promote sustainable jobs and growth in line with the EU Lisbon and Gothenburg agendas. http://www.swansea.gov.uk/index.cfm?articleid=16007
50
Further Information Annual Corporate Improvement Plan 2010/11 Performance & Strategic Projects have prepared this document on behalf of the Council. If you have any questions or comments on the content of this plan, you can contact the Business Performance team in Performance & Strategic Projects by: Email to [email protected] Telephone 01792 636852. Making a Difference the forward looking improvement plan for 2010-11 can be found by clicking on the following web link: http://www.swansea.gov.uk/index.cfm?articleid=155 Community Strategy 2010 -14 If you are interested in finding out more about the Community Strategy, then you can do so via the Council’s web-site by clicking on the following web-link: http://www.swansea.gov.uk/index.cfm?articleid=11050 Also, if you have any questions related to the Community Plan, you can contact the Community Strategies Team by: Email at [email protected] Telephone 01792 636292 Local Service Board Website: www.swansea.gov.uk/LSB Children & Young People Plan 2008/12 http://www.cypswansea.co.uk/index.cfm?articleid=21910 Health, Social Care & Well-Being Strategy 2008/11 http://www.wales.nhs.uk/sites3/Documents/524/English.pdf Local Development Plan www.swansea.gov.uk/ldp Equality & Diversity http://www.swansea.gov.uk/equalityscheme
51
Sustainable Development http://www.swansea.gov.uk/index.cfm?articleid=4275 Relationship Managers Annual Letter http://www.wao.gov.uk/reportsandpublications/localgovernment_687.asp Estyn Inspection Reports http://www.estyn.gov.uk/inspection_reports.asp Care & Social Services Inspectorate Wales (CSSIW) Inspection Reports http://www.csiw.wales.gov.uk/dataviewer/index.asp Scrutiny Board Reports http://www.swansea.gov.uk/scrutiny More information on Consultation and Engagement To help co-ordinate the consultation work of the Swansea Consultation Partnership and enable residents to easily access consultations that are being conducted by, or on behalf of the City and County of Swansea Council, Swansea Council for Voluntary Service, South Wales Police, Mid and West Wales Fire and Rescue, ABM University Health Board, the Police Authority and the Welsh Language Board, we have created a partnership consultation database. The Consultation Database contains current consultations being undertaken by the City and County of Swansea Council, Swansea Council for Voluntary Service, South Wales Police, Mid and West Wales Fire and Rescue, ABM University Health Board, the Police Authority and the Welsh Language Board. Here you can view the consultation, find out more details and if and how you can get involved in providing feedback. When a consultation is complete you will be able to download any relevant results/newsletters. Please follow the link opposite to access the Consultation Database. www.swanseasays.org.uk Should you have any questions or queries about the Consultation Database, or you are experiencing trouble using it, please contact the Consultation Co-ordinator Rhian Foote on 01792 636732 or fax 01792 637206 or e-mail [email protected]
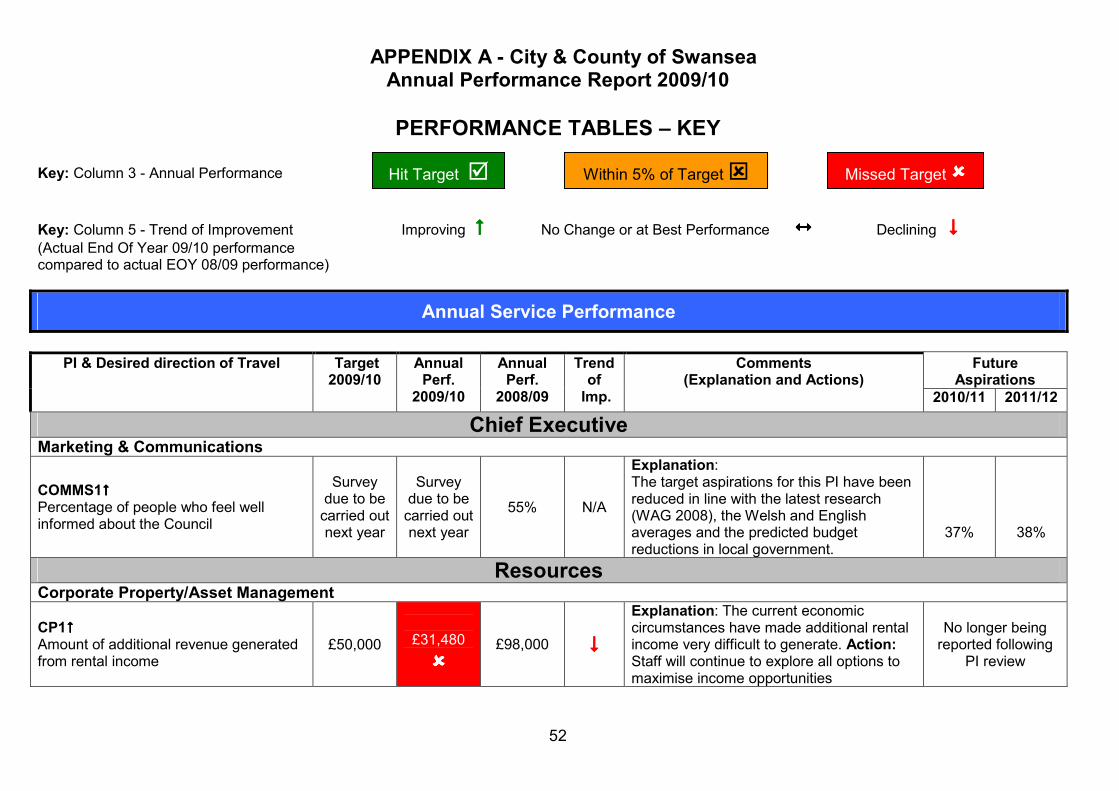
52
APPENDIX A - City & County of Swansea Annual Performance Report 2009/10
PERFORMANCE TABLES – KEY
Key: Column 3 - Annual Performance
Key: Column 5 - Trend of Improvement Improving ���� No Change or at Best Performance ���� Declining ����
(Actual End Of Year 09/10 performance compared to actual EOY 08/09 performance)
Annual Service Performance
Future Aspirations
PI & Desired direction of Travel Target 2009/10
Annual Perf.
2009/10
Annual Perf.
2008/09
Trend of
Imp.
Comments (Explanation and Actions)
2010/11 2011/12
Chief Executive Marketing & Communications
COMMS1���� Percentage of people who feel well informed about the Council
Survey due to be
carried out next year
Survey due to be
carried out next year
55% N/A
Explanation: The target aspirations for this PI have been reduced in line with the latest research (WAG 2008), the Welsh and English averages and the predicted budget reductions in local government.
37%
38%
Resources Corporate Property/Asset Management
CP1���� Amount of additional revenue generated from rental income
£50,000
£31,480
����
£98,000
����
Explanation: The current economic circumstances have made additional rental income very difficult to generate. Action: Staff will continue to explore all options to maximise income opportunities
No longer being reported following
PI review
Hit Target � Within 5% of Target � Missed Target ����
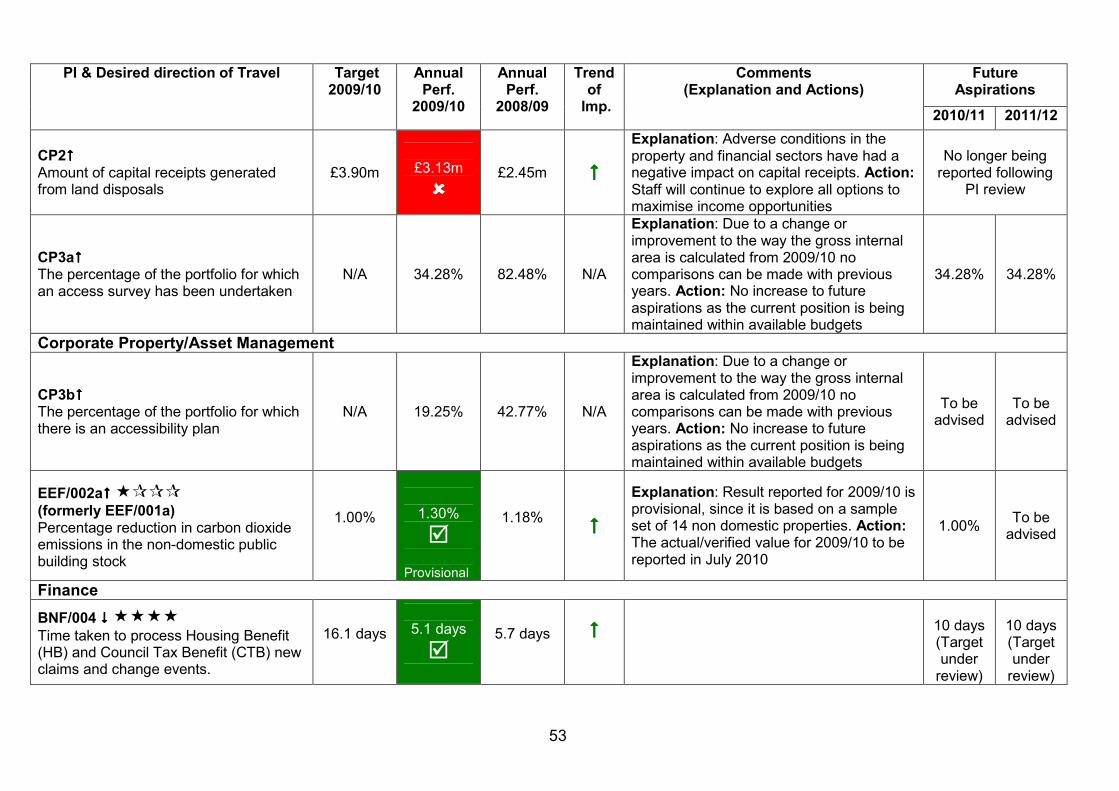
53
Future
Aspirations PI & Desired direction of Travel Target
2009/10 Annual Perf.
2009/10
Annual Perf.
2008/09
Trend of
Imp.
Comments (Explanation and Actions)
2010/11 2011/12
CP2���� Amount of capital receipts generated from land disposals
£3.90m
£3.13m
����
£2.45m ����
Explanation: Adverse conditions in the property and financial sectors have had a negative impact on capital receipts. Action: Staff will continue to explore all options to maximise income opportunities
No longer being reported following
PI review
CP3a���� The percentage of the portfolio for which an access survey has been undertaken
N/A
34.28%
82.48% N/A
Explanation: Due to a change or improvement to the way the gross internal area is calculated from 2009/10 no comparisons can be made with previous years. Action: No increase to future aspirations as the current position is being maintained within available budgets
34.28% 34.28%
Corporate Property/Asset Management
CP3b���� The percentage of the portfolio for which there is an accessibility plan
N/A
19.25%
42.77% N/A
Explanation: Due to a change or improvement to the way the gross internal area is calculated from 2009/10 no comparisons can be made with previous years. Action: No increase to future aspirations as the current position is being maintained within available budgets
To be advised
To be advised
EEF/002a���� ����
(formerly EEF/001a) Percentage reduction in carbon dioxide emissions in the non-domestic public building stock
1.00%
1.30%
�
Provisional
1.18% ����
Explanation: Result reported for 2009/10 is provisional, since it is based on a sample set of 14 non domestic properties. Action: The actual/verified value for 2009/10 to be reported in July 2010
1.00% To be
advised
Finance
BNF/004 ���� ����
Time taken to process Housing Benefit (HB) and Council Tax Benefit (CTB) new claims and change events.
16.1 days
5.1 days
�
5.7 days
����
10 days (Target under
review)
10 days (Target under
review)
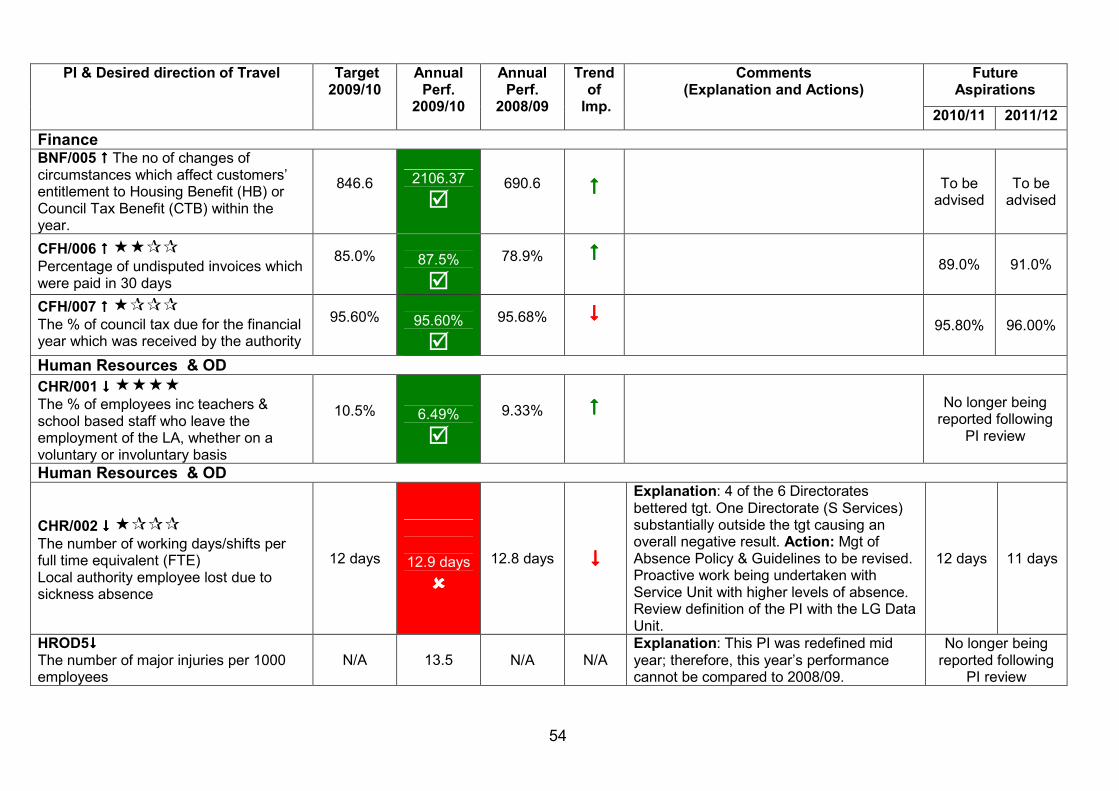
54
Future
Aspirations PI & Desired direction of Travel Target
2009/10 Annual Perf.
2009/10
Annual Perf.
2008/09
Trend of
Imp.
Comments (Explanation and Actions)
2010/11 2011/12
Finance BNF/005 ���� The no of changes of circumstances which affect customers’ entitlement to Housing Benefit (HB) or Council Tax Benefit (CTB) within the year.
846.6
2106.37
�
690.6
����
To be advised
To be advised
CFH/006 ���� ����
Percentage of undisputed invoices which were paid in 30 days
85.0%
87.5%
�
78.9%
����
89.0% 91.0%
CFH/007 ���� ����
The % of council tax due for the financial year which was received by the authority
95.60%
95.60%
�
95.68%
����
95.80% 96.00%
Human Resources & OD
CHR/001 ���� ����
The % of employees inc teachers & school based staff who leave the employment of the LA, whether on a voluntary or involuntary basis
10.5%
6.49%
�
9.33%
����
No longer being reported following
PI review
Human Resources & OD
CHR/002 ���� ����
The number of working days/shifts per full time equivalent (FTE) Local authority employee lost due to sickness absence
12 days
12.9 days
����
12.8 days ����
Explanation: 4 of the 6 Directorates bettered tgt. One Directorate (S Services) substantially outside the tgt causing an overall negative result. Action: Mgt of Absence Policy & Guidelines to be revised. Proactive work being undertaken with Service Unit with higher levels of absence. Review definition of the PI with the LG Data Unit.
12 days 11 days
HROD5���� The number of major injuries per 1000 employees
N/A 13.5
N/A
N/A Explanation: This PI was redefined mid year; therefore, this year’s performance cannot be compared to 2008/09.
No longer being reported following
PI review
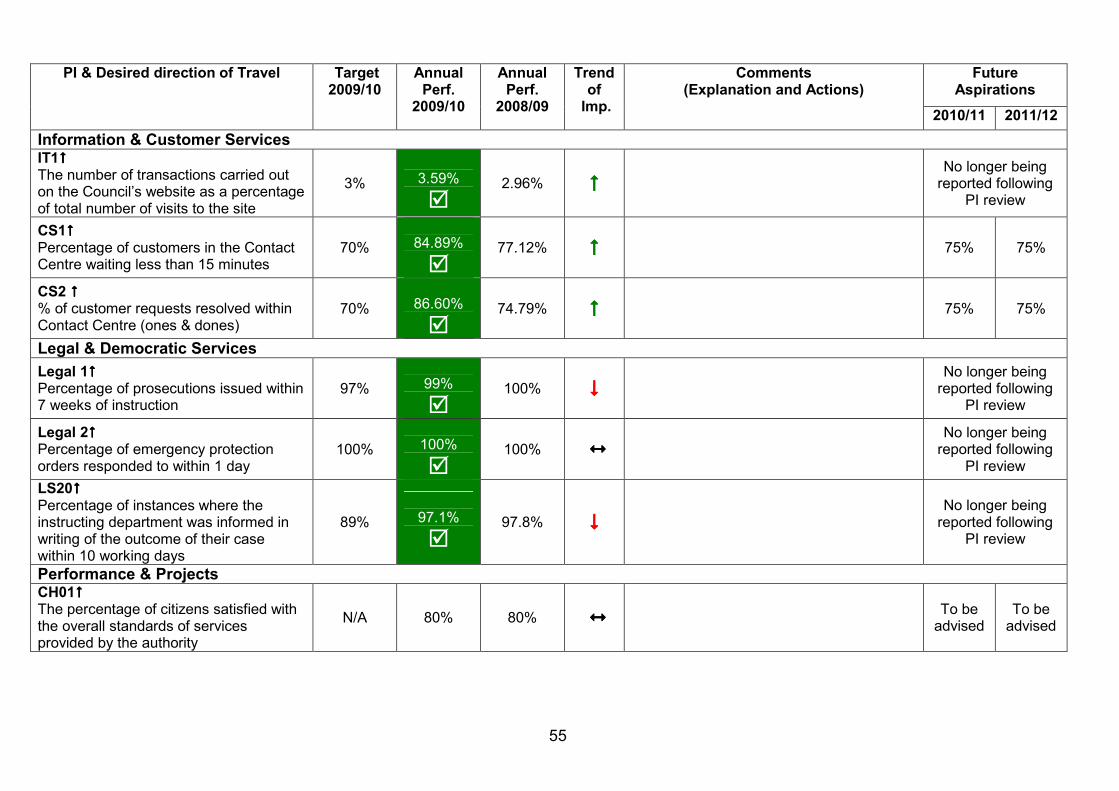
55
Future
Aspirations PI & Desired direction of Travel Target
2009/10 Annual Perf.
2009/10
Annual Perf.
2008/09
Trend of
Imp.
Comments (Explanation and Actions)
2010/11 2011/12
Information & Customer Services IT1���� The number of transactions carried out on the Council’s website as a percentage of total number of visits to the site
3%
3.59%
�
2.96% ���� No longer being
reported following PI review
CS1���� Percentage of customers in the Contact Centre waiting less than 15 minutes
70%
84.89%
�
77.12% ����
75% 75%
CS2 ���� % of customer requests resolved within Contact Centre (ones & dones)
70%
86.60%
�
74.79% ����
75% 75%
Legal & Democratic Services
Legal 1���� Percentage of prosecutions issued within 7 weeks of instruction
97%
99%
�
100% ���� No longer being
reported following PI review
Legal 2���� Percentage of emergency protection orders responded to within 1 day
100%
100%
�
100% ���� No longer being
reported following PI review
LS20���� Percentage of instances where the instructing department was informed in writing of the outcome of their case within 10 working days
89%
97.1%
�
97.8% ����
No longer being
reported following PI review
Performance & Projects
CH01���� The percentage of citizens satisfied with the overall standards of services provided by the authority
N/A
80%
80% ���� To be
advised To be
advised
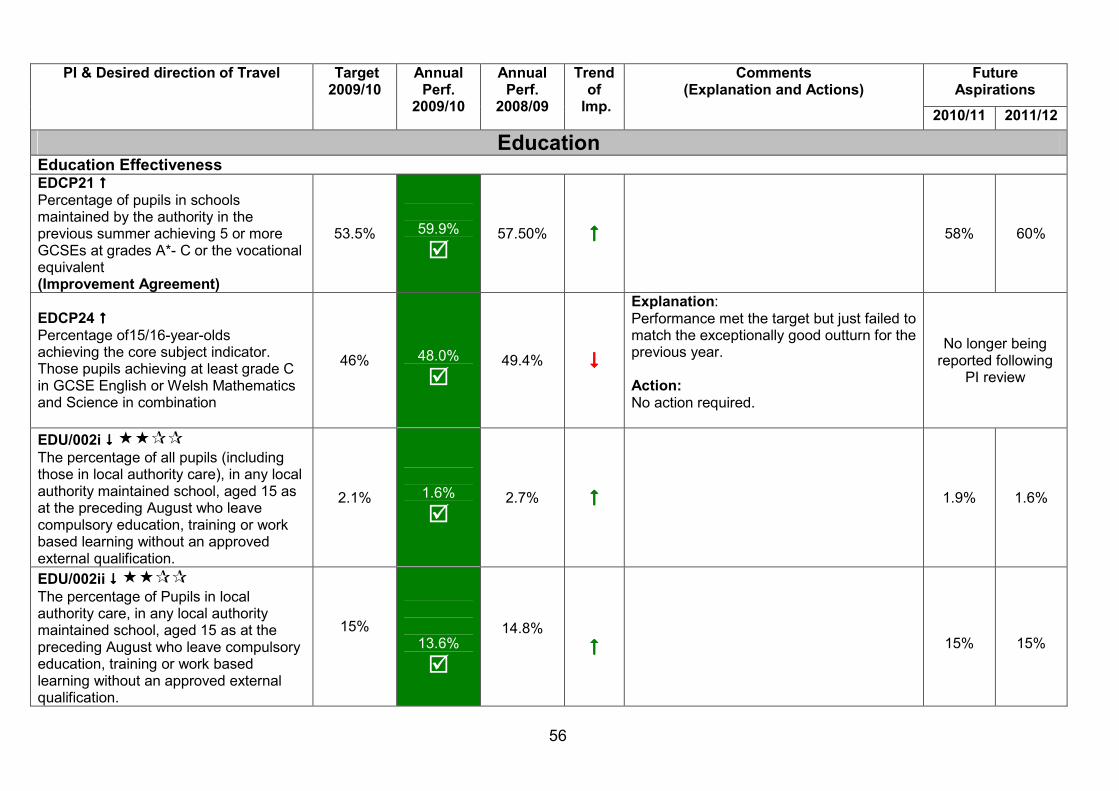
56
Future
Aspirations PI & Desired direction of Travel Target
2009/10 Annual Perf.
2009/10
Annual Perf.
2008/09
Trend of
Imp.
Comments (Explanation and Actions)
2010/11 2011/12
Education Education Effectiveness EDCP21 ���� Percentage of pupils in schools maintained by the authority in the previous summer achieving 5 or more GCSEs at grades A*- C or the vocational equivalent (Improvement Agreement)
53.5%
59.9%
�
57.50% ����
58% 60%
EDCP24 ���� Percentage of15/16-year-olds achieving the core subject indicator. Those pupils achieving at least grade C in GCSE English or Welsh Mathematics and Science in combination
46%
48.0%
�
49.4% ����
Explanation: Performance met the target but just failed to match the exceptionally good outturn for the previous year. Action: No action required.
No longer being reported following
PI review
EDU/002i ���� ����
The percentage of all pupils (including those in local authority care), in any local authority maintained school, aged 15 as at the preceding August who leave compulsory education, training or work based learning without an approved external qualification.
2.1%
1.6%
�
2.7% ����
1.9% 1.6%
EDU/002ii ���� ����
The percentage of Pupils in local authority care, in any local authority maintained school, aged 15 as at the preceding August who leave compulsory education, training or work based learning without an approved external qualification.
15%
13.6%
�
14.8%
����
15%
15%
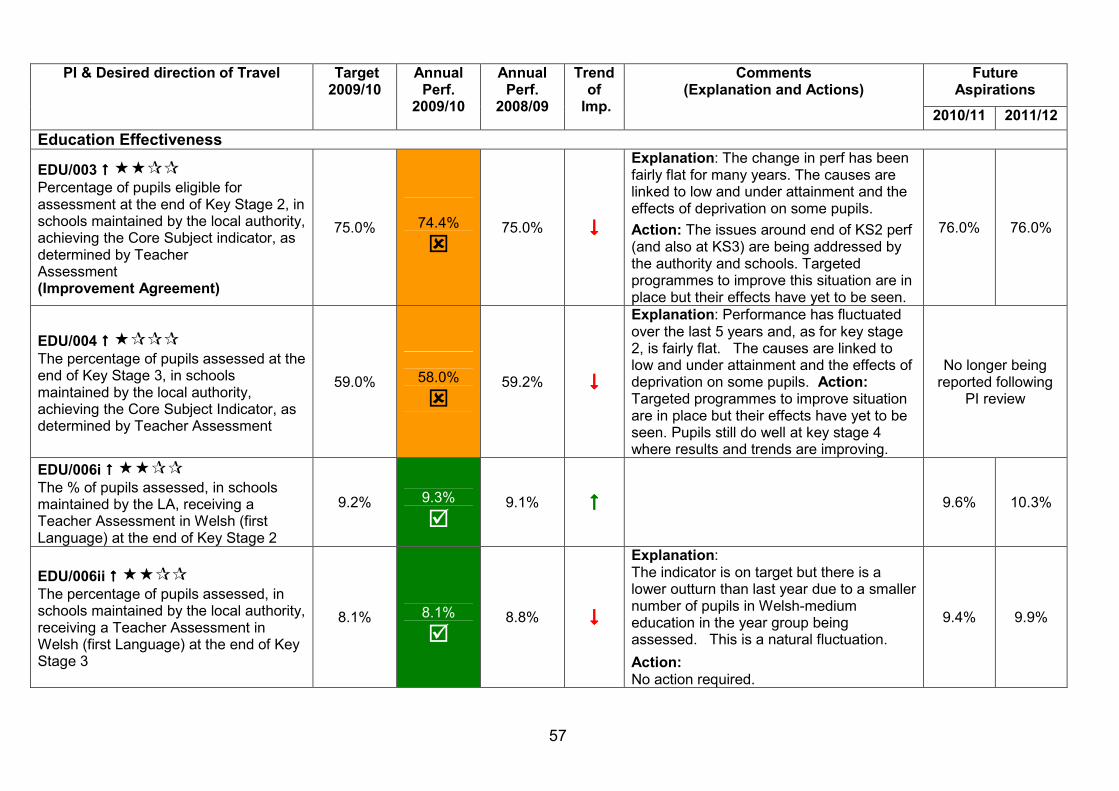
57
Future
Aspirations PI & Desired direction of Travel Target
2009/10 Annual Perf.
2009/10
Annual Perf.
2008/09
Trend of
Imp.
Comments (Explanation and Actions)
2010/11 2011/12
Education Effectiveness
EDU/003 ���� ����
Percentage of pupils eligible for assessment at the end of Key Stage 2, in schools maintained by the local authority, achieving the Core Subject indicator, as determined by Teacher Assessment (Improvement Agreement)
75.0%
74.4%
�
75.0% ����
Explanation: The change in perf has been fairly flat for many years. The causes are linked to low and under attainment and the effects of deprivation on some pupils.
Action: The issues around end of KS2 perf (and also at KS3) are being addressed by the authority and schools. Targeted programmes to improve this situation are in place but their effects have yet to be seen.
76.0% 76.0%
EDU/004 ���� ����
The percentage of pupils assessed at the end of Key Stage 3, in schools maintained by the local authority, achieving the Core Subject Indicator, as determined by Teacher Assessment
59.0%
58.0%
�
59.2% ����
Explanation: Performance has fluctuated over the last 5 years and, as for key stage 2, is fairly flat. The causes are linked to low and under attainment and the effects of deprivation on some pupils. Action: Targeted programmes to improve situation are in place but their effects have yet to be seen. Pupils still do well at key stage 4 where results and trends are improving.
No longer being reported following
PI review
EDU/006i ���� ����
The % of pupils assessed, in schools maintained by the LA, receiving a Teacher Assessment in Welsh (first Language) at the end of Key Stage 2
9.2%
9.3%
�
9.1% ����
9.6% 10.3%
EDU/006ii ���� ����
The percentage of pupils assessed, in schools maintained by the local authority, receiving a Teacher Assessment in Welsh (first Language) at the end of Key Stage 3
8.1%
8.1%
�
8.8% ����
Explanation: The indicator is on target but there is a lower outturn than last year due to a smaller number of pupils in Welsh-medium education in the year group being assessed. This is a natural fluctuation.
Action: No action required.
9.4% 9.9%
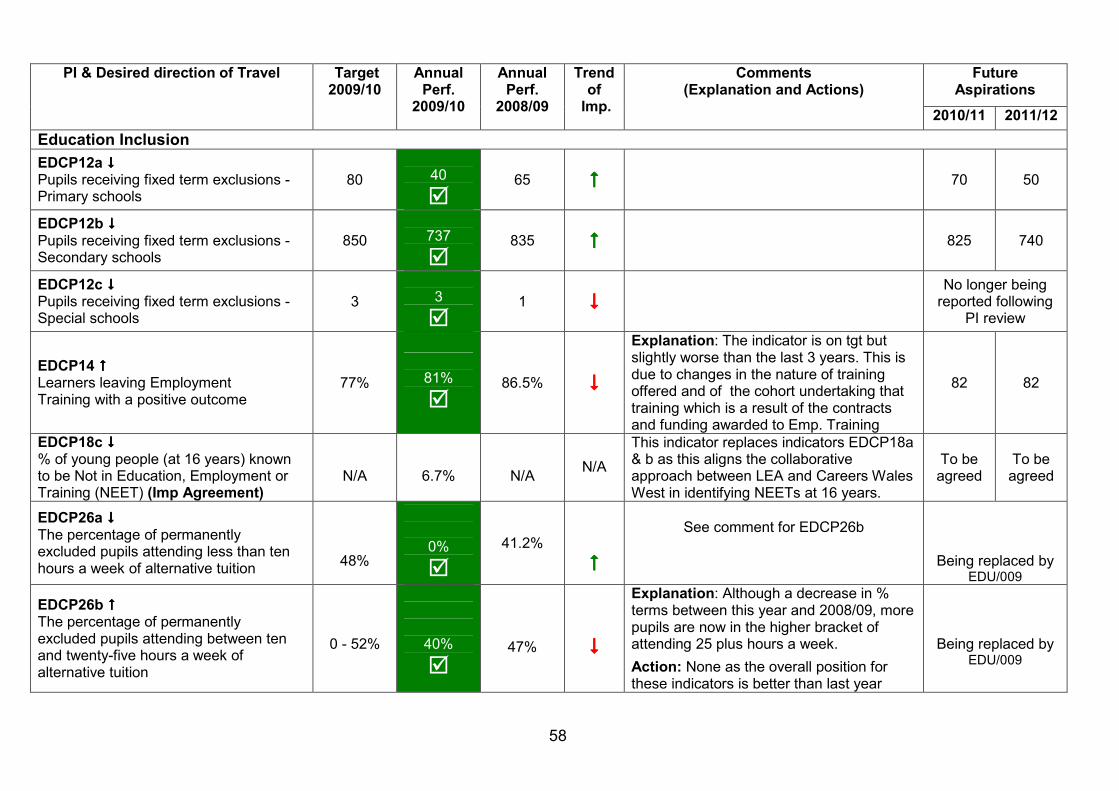
58
Future
Aspirations PI & Desired direction of Travel Target
2009/10 Annual Perf.
2009/10
Annual Perf.
2008/09
Trend of
Imp.
Comments (Explanation and Actions)
2010/11 2011/12
Education Inclusion
EDCP12a ���� Pupils receiving fixed term exclusions - Primary schools
80
40
�
65 ���� 70 50
EDCP12b ���� Pupils receiving fixed term exclusions - Secondary schools
850
737
�
835 ���� 825 740
EDCP12c ���� Pupils receiving fixed term exclusions - Special schools
3
3
�
1 ���� No longer being
reported following PI review
EDCP14 ���� Learners leaving Employment Training with a positive outcome
77%
81%
�
86.5% ����
Explanation: The indicator is on tgt but slightly worse than the last 3 years. This is due to changes in the nature of training offered and of the cohort undertaking that training which is a result of the contracts and funding awarded to Emp. Training
82 82
EDCP18c ���� % of young people (at 16 years) known to be Not in Education, Employment or Training (NEET) (Imp Agreement)
N/A
6.7%
N/A
N/A
This indicator replaces indicators EDCP18a & b as this aligns the collaborative approach between LEA and Careers Wales West in identifying NEETs at 16 years.
To be agreed
To be agreed
EDCP26a ���� The percentage of permanently excluded pupils attending less than ten hours a week of alternative tuition
48%
0%
�
41.2%
����
See comment for EDCP26b
Being replaced by EDU/009
EDCP26b ���� The percentage of permanently excluded pupils attending between ten and twenty-five hours a week of alternative tuition
0 - 52%
40%
�
47%
����
Explanation: Although a decrease in % terms between this year and 2008/09, more pupils are now in the higher bracket of attending 25 plus hours a week.
Action: None as the overall position for these indicators is better than last year
Being replaced by EDU/009
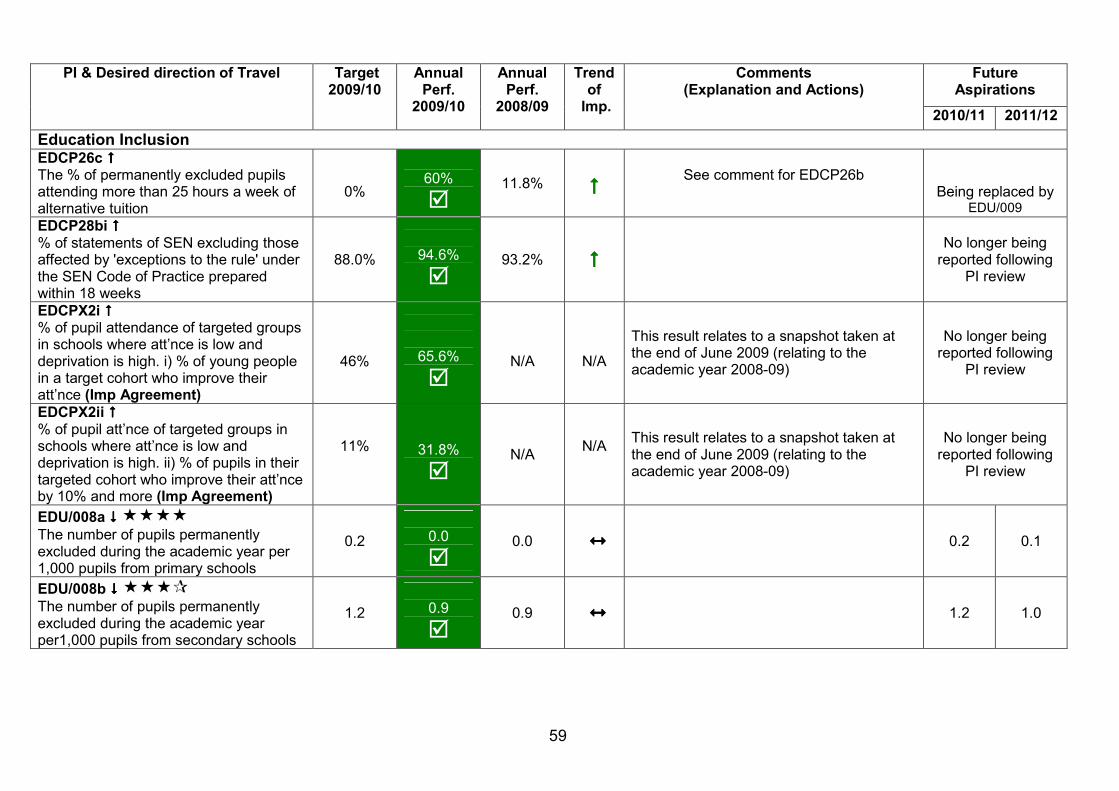
59
Future
Aspirations PI & Desired direction of Travel Target
2009/10 Annual Perf.
2009/10
Annual Perf.
2008/09
Trend of
Imp.
Comments (Explanation and Actions)
2010/11 2011/12
Education Inclusion
EDCP26c ���� The % of permanently excluded pupils attending more than 25 hours a week of alternative tuition
0%
60%
�
11.8%
����
See comment for EDCP26b
Being replaced by EDU/009
EDCP28bi ���� % of statements of SEN excluding those affected by 'exceptions to the rule' under the SEN Code of Practice prepared within 18 weeks
88.0%
94.6%
�
93.2% ����
No longer being
reported following PI review
EDCPX2i ���� % of pupil attendance of targeted groups in schools where att’nce is low and deprivation is high. i) % of young people in a target cohort who improve their att’nce (Imp Agreement)
46%
65.6%
�
N/A
N/A
This result relates to a snapshot taken at the end of June 2009 (relating to the academic year 2008-09)
No longer being reported following
PI review
EDCPX2ii ���� % of pupil att’nce of targeted groups in schools where att’nce is low and deprivation is high. ii) % of pupils in their targeted cohort who improve their att’nce by 10% and more (Imp Agreement)
11%
31.8%
�
N/A
N/A This result relates to a snapshot taken at the end of June 2009 (relating to the academic year 2008-09)
No longer being reported following
PI review
EDU/008a ���� ����
The number of pupils permanently excluded during the academic year per 1,000 pupils from primary schools
0.2
0.0
�
0.0 ����
0.2 0.1
EDU/008b ���� ����
The number of pupils permanently excluded during the academic year per1,000 pupils from secondary schools
1.2
0.9
�
0.9 ����
1.2 1.0
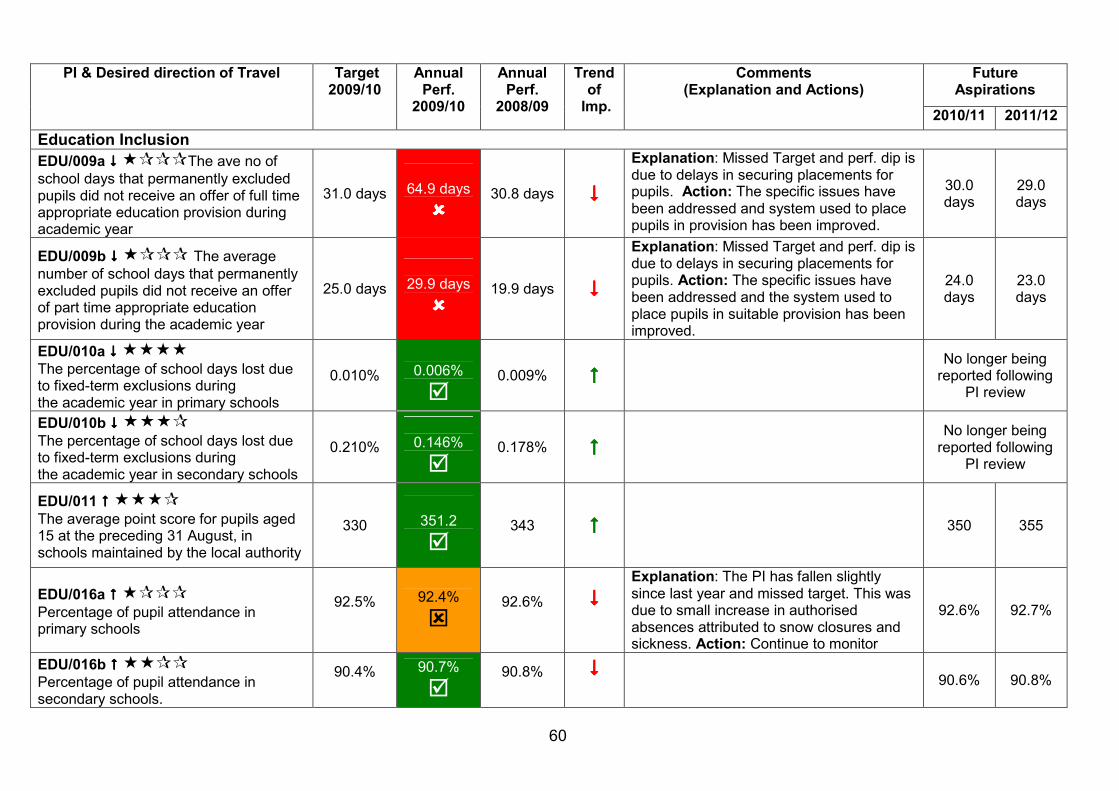
60
Future
Aspirations PI & Desired direction of Travel Target
2009/10 Annual Perf.
2009/10
Annual Perf.
2008/09
Trend of
Imp.
Comments (Explanation and Actions)
2010/11 2011/12
Education Inclusion
EDU/009a ���� ����The ave no of
school days that permanently excluded pupils did not receive an offer of full time appropriate education provision during academic year
31.0 days
64.9 days
����
30.8 days ����
Explanation: Missed Target and perf. dip is due to delays in securing placements for pupils. Action: The specific issues have been addressed and system used to place pupils in provision has been improved.
30.0 days
29.0 days
EDU/009b ���� ���� The average
number of school days that permanently excluded pupils did not receive an offer of part time appropriate education provision during the academic year
25.0 days
29.9 days
����
19.9 days ����
Explanation: Missed Target and perf. dip is due to delays in securing placements for pupils. Action: The specific issues have been addressed and the system used to place pupils in suitable provision has been improved.
24.0 days
23.0 days
EDU/010a ���� ����
The percentage of school days lost due to fixed-term exclusions during the academic year in primary schools
0.010%
0.006%
�
0.009% ����
No longer being
reported following PI review
EDU/010b ���� ����
The percentage of school days lost due to fixed-term exclusions during the academic year in secondary schools
0.210%
0.146%
�
0.178% ����
No longer being
reported following PI review
EDU/011 ���� ����
The average point score for pupils aged 15 at the preceding 31 August, in schools maintained by the local authority
330
351.2
�
343 ����
350
355
EDU/016a ���� ����
Percentage of pupil attendance in primary schools
92.5%
92.4%
�
92.6%
����
Explanation: The PI has fallen slightly since last year and missed target. This was due to small increase in authorised absences attributed to snow closures and sickness. Action: Continue to monitor
92.6% 92.7%
EDU/016b ���� ����
Percentage of pupil attendance in secondary schools.
90.4%
90.7%
�
90.8%
����
90.6%
90.8%
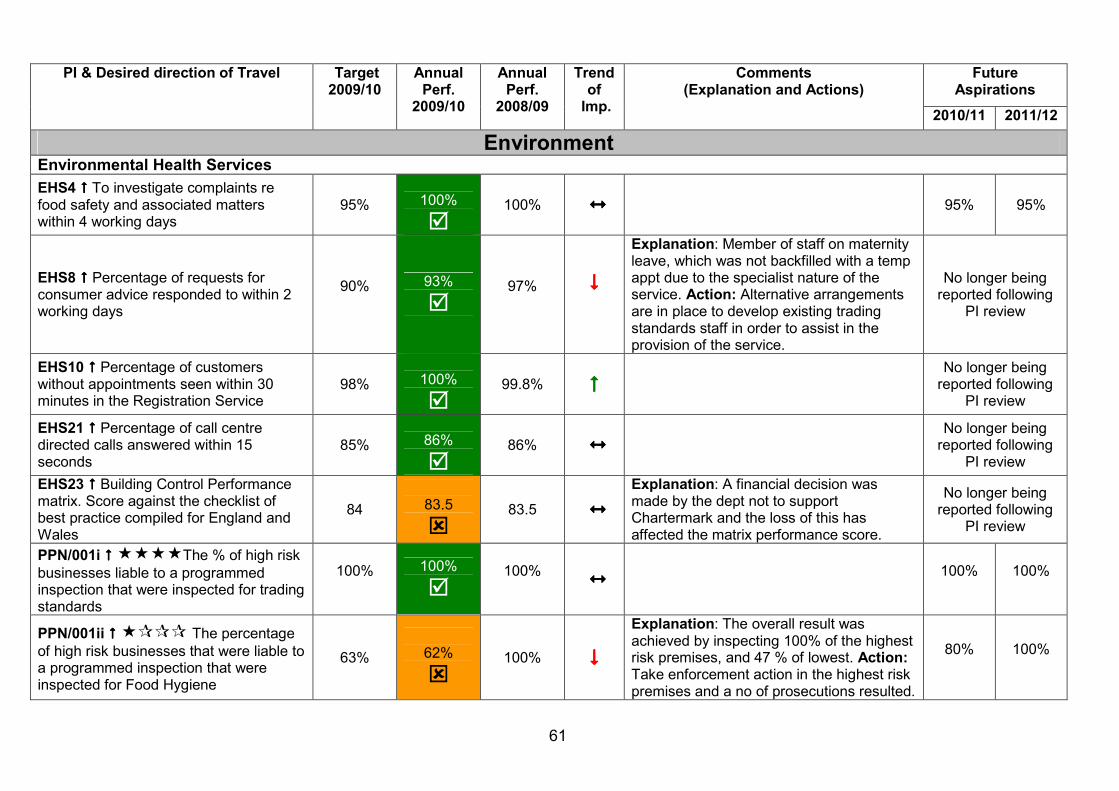
61
Future
Aspirations PI & Desired direction of Travel Target
2009/10 Annual Perf.
2009/10
Annual Perf.
2008/09
Trend of
Imp.
Comments (Explanation and Actions)
2010/11 2011/12
Environment Environmental Health Services
EHS4 ���� To investigate complaints re food safety and associated matters within 4 working days
95%
100%
�
100% ����
95% 95%
EHS8 ���� Percentage of requests for consumer advice responded to within 2 working days
90%
93%
�
97%
����
Explanation: Member of staff on maternity leave, which was not backfilled with a temp appt due to the specialist nature of the service. Action: Alternative arrangements are in place to develop existing trading standards staff in order to assist in the provision of the service.
No longer being reported following
PI review
EHS10 ���� Percentage of customers without appointments seen within 30 minutes in the Registration Service
98%
100%
�
99.8% ���� No longer being
reported following PI review
EHS21 ���� Percentage of call centre directed calls answered within 15 seconds
85%
86%
�
86% ���� No longer being
reported following PI review
EHS23 ���� Building Control Performance matrix. Score against the checklist of best practice compiled for England and Wales
84
83.5
�
83.5
����
Explanation: A financial decision was made by the dept not to support Chartermark and the loss of this has affected the matrix performance score.
No longer being reported following
PI review
PPN/001i ���� ����The % of high risk
businesses liable to a programmed inspection that were inspected for trading standards
100%
100%
�
100% ����
100%
100%
PPN/001ii ���� ���� The percentage
of high risk businesses that were liable to a programmed inspection that were inspected for Food Hygiene
63%
62%
�
100% ����
Explanation: The overall result was achieved by inspecting 100% of the highest risk premises, and 47 % of lowest. Action: Take enforcement action in the highest risk premises and a no of prosecutions resulted.
80%
100%
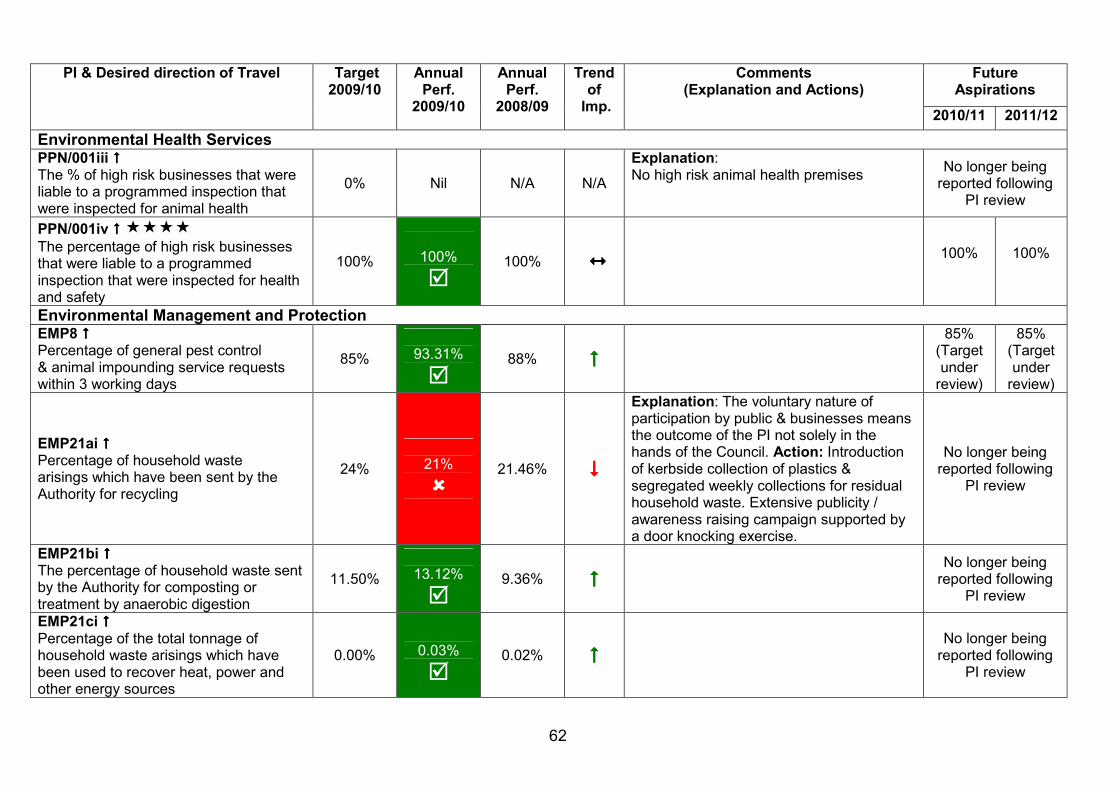
62
Future
Aspirations PI & Desired direction of Travel Target
2009/10 Annual Perf.
2009/10
Annual Perf.
2008/09
Trend of
Imp.
Comments (Explanation and Actions)
2010/11 2011/12
Environmental Health Services
PPN/001iii ���� The % of high risk businesses that were liable to a programmed inspection that were inspected for animal health
0% Nil N/A N/A
Explanation: No high risk animal health premises
No longer being reported following
PI review
PPN/001iv ���� ����
The percentage of high risk businesses that were liable to a programmed inspection that were inspected for health and safety
100%
100%
�
100% ����
100%
100%
Environmental Management and Protection
EMP8 ���� Percentage of general pest control & animal impounding service requests within 3 working days
85%
93.31%
�
88% ����
85% (Target under
review)
85% (Target under
review)
EMP21ai ���� Percentage of household waste arisings which have been sent by the Authority for recycling
24%
21%
����
21.46% ����
Explanation: The voluntary nature of participation by public & businesses means the outcome of the PI not solely in the hands of the Council. Action: Introduction of kerbside collection of plastics & segregated weekly collections for residual household waste. Extensive publicity / awareness raising campaign supported by a door knocking exercise.
No longer being reported following
PI review
EMP21bi ���� The percentage of household waste sent by the Authority for composting or treatment by anaerobic digestion
11.50%
13.12%
�
9.36% ����
No longer being
reported following PI review
EMP21ci ���� Percentage of the total tonnage of household waste arisings which have been used to recover heat, power and other energy sources
0.00%
0.03%
�
0.02% ����
No longer being
reported following PI review
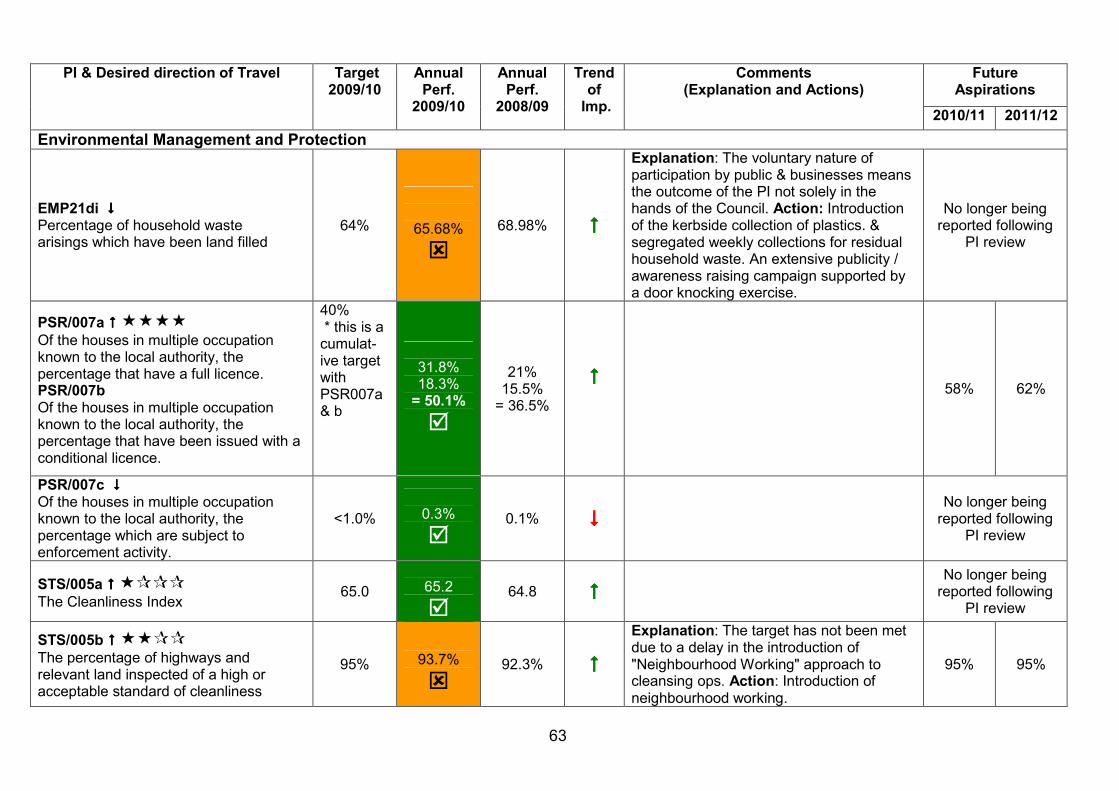
63
Future
Aspirations PI & Desired direction of Travel Target
2009/10 Annual Perf.
2009/10
Annual Perf.
2008/09
Trend of
Imp.
Comments (Explanation and Actions)
2010/11 2011/12
Environmental Management and Protection
EMP21di ���� Percentage of household waste arisings which have been land filled
64%
65.68%
�
68.98% ����
Explanation: The voluntary nature of participation by public & businesses means the outcome of the PI not solely in the hands of the Council. Action: Introduction of the kerbside collection of plastics. & segregated weekly collections for residual household waste. An extensive publicity / awareness raising campaign supported by a door knocking exercise.
No longer being reported following
PI review
PSR/007a ���� ����
Of the houses in multiple occupation known to the local authority, the percentage that have a full licence. PSR/007b Of the houses in multiple occupation known to the local authority, the percentage that have been issued with a conditional licence.
40% * this is a cumulat-ive target with PSR007a & b
31.8% 18.3% = 50.1%
�
21% 15.5%
= 36.5%
����
58% 62%
PSR/007c ���� Of the houses in multiple occupation known to the local authority, the percentage which are subject to enforcement activity.
<1.0%
0.3%
�
0.1% ����
No longer being
reported following PI review
STS/005a ���� ����
The Cleanliness Index 65.0
65.2
�
64.8 ���� No longer being
reported following PI review
STS/005b ���� ����
The percentage of highways and relevant land inspected of a high or acceptable standard of cleanliness
95%
93.7%
�
92.3% ����
Explanation: The target has not been met due to a delay in the introduction of "Neighbourhood Working" approach to cleansing ops. Action: Introduction of neighbourhood working.
95% 95%
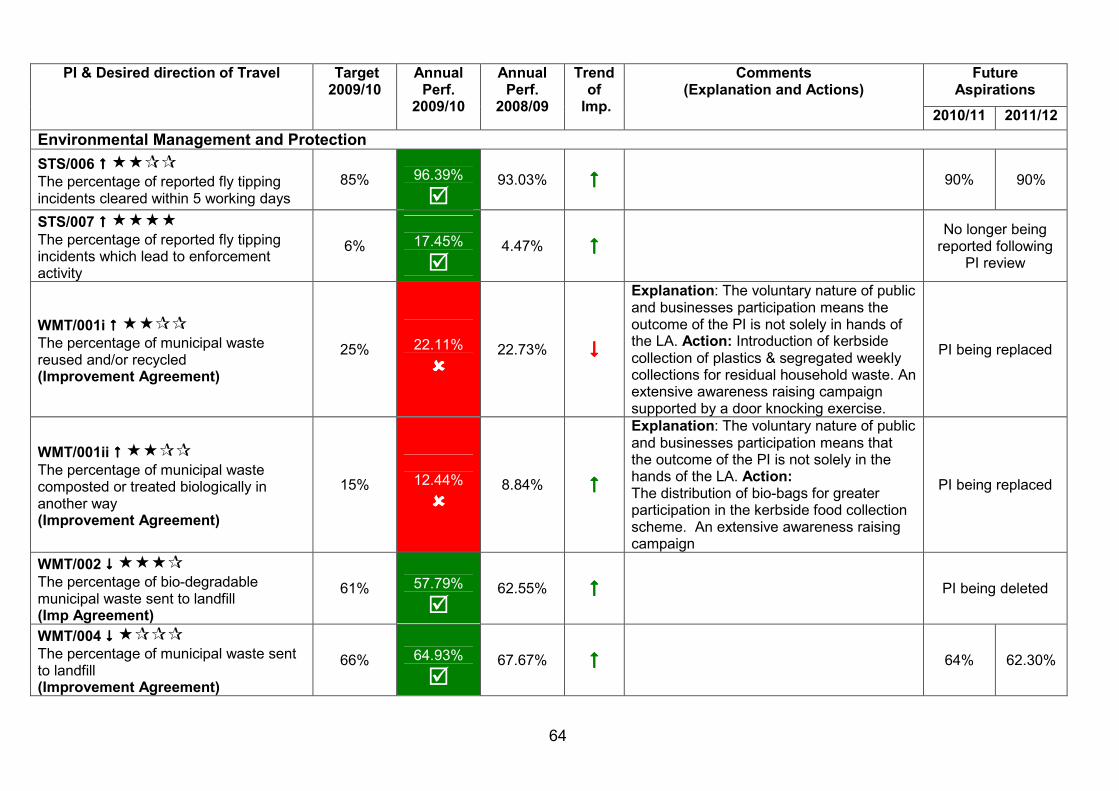
64
Future
Aspirations PI & Desired direction of Travel Target
2009/10 Annual Perf.
2009/10
Annual Perf.
2008/09
Trend of
Imp.
Comments (Explanation and Actions)
2010/11 2011/12
Environmental Management and Protection
STS/006 ���� ����
The percentage of reported fly tipping incidents cleared within 5 working days
85%
96.39%
�
93.03% ����
90%
90%
STS/007 ���� ����
The percentage of reported fly tipping incidents which lead to enforcement activity
6%
17.45%
�
4.47% ����
No longer being
reported following PI review
WMT/001i ���� ����
The percentage of municipal waste reused and/or recycled (Improvement Agreement)
25%
22.11%
����
22.73% ����
Explanation: The voluntary nature of public and businesses participation means the outcome of the PI is not solely in hands of the LA. Action: Introduction of kerbside collection of plastics & segregated weekly collections for residual household waste. An extensive awareness raising campaign supported by a door knocking exercise.
PI being replaced
WMT/001ii ���� ����
The percentage of municipal waste composted or treated biologically in another way (Improvement Agreement)
15%
12.44%
����
8.84% ����
Explanation: The voluntary nature of public and businesses participation means that the outcome of the PI is not solely in the hands of the LA. Action: The distribution of bio-bags for greater participation in the kerbside food collection scheme. An extensive awareness raising campaign
PI being replaced
WMT/002 ���� ����
The percentage of bio-degradable municipal waste sent to landfill (Imp Agreement)
61%
57.79%
�
62.55% ����
PI being deleted
WMT/004 ���� ����
The percentage of municipal waste sent to landfill (Improvement Agreement)
66%
64.93%
�
67.67% ����
64%
62.30%
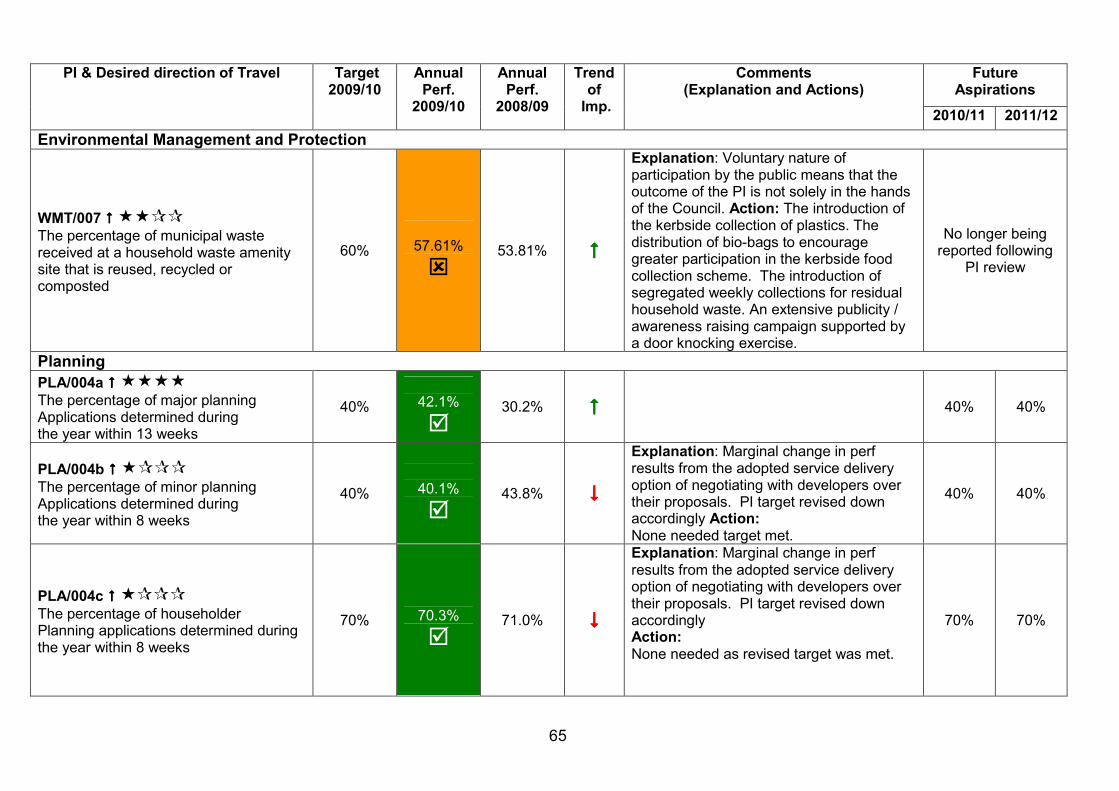
65
Future
Aspirations PI & Desired direction of Travel Target
2009/10 Annual Perf.
2009/10
Annual Perf.
2008/09
Trend of
Imp.
Comments (Explanation and Actions)
2010/11 2011/12
Environmental Management and Protection
WMT/007 ���� ����
The percentage of municipal waste received at a household waste amenity site that is reused, recycled or composted
60%
57.61%
�
53.81% ����
Explanation: Voluntary nature of participation by the public means that the outcome of the PI is not solely in the hands of the Council. Action: The introduction of the kerbside collection of plastics. The distribution of bio-bags to encourage greater participation in the kerbside food collection scheme. The introduction of segregated weekly collections for residual household waste. An extensive publicity / awareness raising campaign supported by a door knocking exercise.
No longer being reported following
PI review
Planning
PLA/004a ���� ����
The percentage of major planning Applications determined during the year within 13 weeks
40%
42.1%
�
30.2% ����
40% 40%
PLA/004b ���� ����
The percentage of minor planning Applications determined during the year within 8 weeks
40%
40.1%
�
43.8% ����
Explanation: Marginal change in perf results from the adopted service delivery option of negotiating with developers over their proposals. PI target revised down accordingly Action: None needed target met.
40% 40%
PLA/004c ���� ����
The percentage of householder Planning applications determined during the year within 8 weeks
70%
70.3%
�
71.0% ����
Explanation: Marginal change in perf results from the adopted service delivery option of negotiating with developers over their proposals. PI target revised down accordingly Action: None needed as revised target was met.
70% 70%
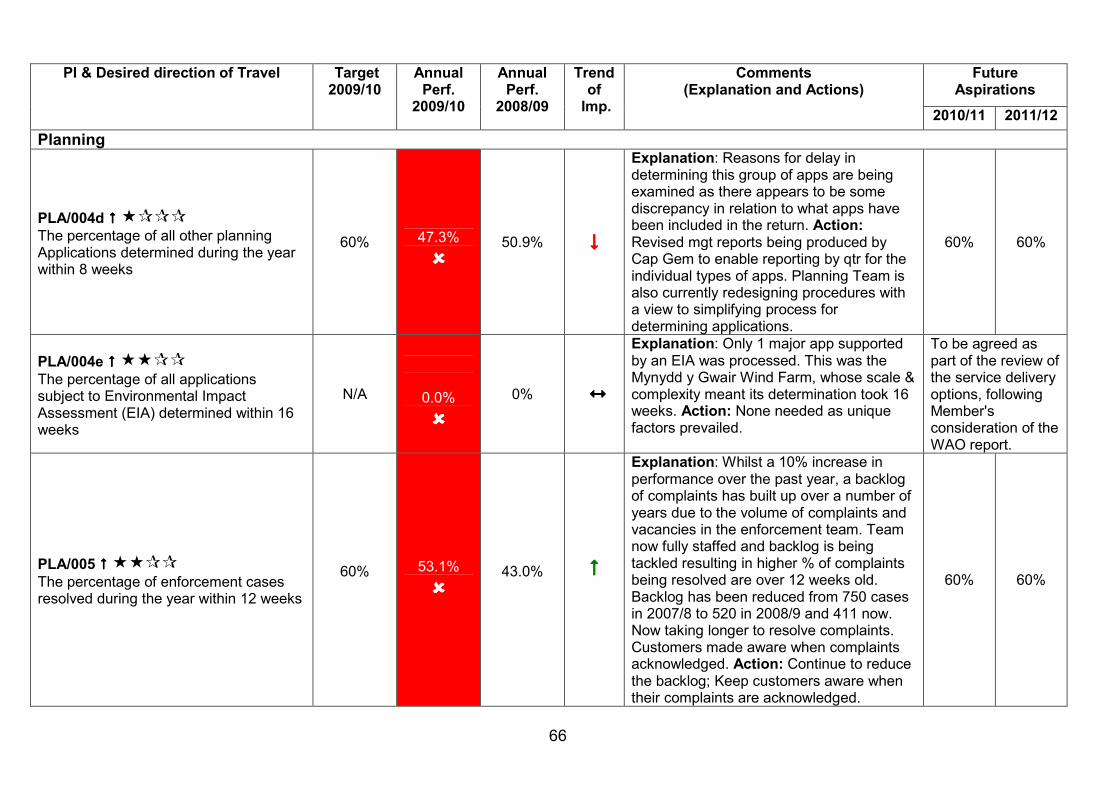
66
Future
Aspirations PI & Desired direction of Travel Target
2009/10 Annual Perf.
2009/10
Annual Perf.
2008/09
Trend of
Imp.
Comments (Explanation and Actions)
2010/11 2011/12
Planning
PLA/004d ���� ����
The percentage of all other planning Applications determined during the year within 8 weeks
60%
47.3%
����
50.9% ����
Explanation: Reasons for delay in determining this group of apps are being examined as there appears to be some discrepancy in relation to what apps have been included in the return. Action: Revised mgt reports being produced by Cap Gem to enable reporting by qtr for the individual types of apps. Planning Team is also currently redesigning procedures with a view to simplifying process for determining applications.
60%
60%
PLA/004e ���� ����
The percentage of all applications subject to Environmental Impact Assessment (EIA) determined within 16 weeks
N/A
0.0%
����
0% ����
Explanation: Only 1 major app supported by an EIA was processed. This was the Mynydd y Gwair Wind Farm, whose scale & complexity meant its determination took 16 weeks. Action: None needed as unique factors prevailed.
To be agreed as part of the review of the service delivery options, following Member's consideration of the WAO report.
PLA/005 ���� ����
The percentage of enforcement cases resolved during the year within 12 weeks
60%
53.1%
����
43.0%
����
Explanation: Whilst a 10% increase in performance over the past year, a backlog of complaints has built up over a number of years due to the volume of complaints and vacancies in the enforcement team. Team now fully staffed and backlog is being tackled resulting in higher % of complaints being resolved are over 12 weeks old. Backlog has been reduced from 750 cases in 2007/8 to 520 in 2008/9 and 411 now. Now taking longer to resolve complaints. Customers made aware when complaints acknowledged. Action: Continue to reduce the backlog; Keep customers aware when their complaints are acknowledged.
60% 60%
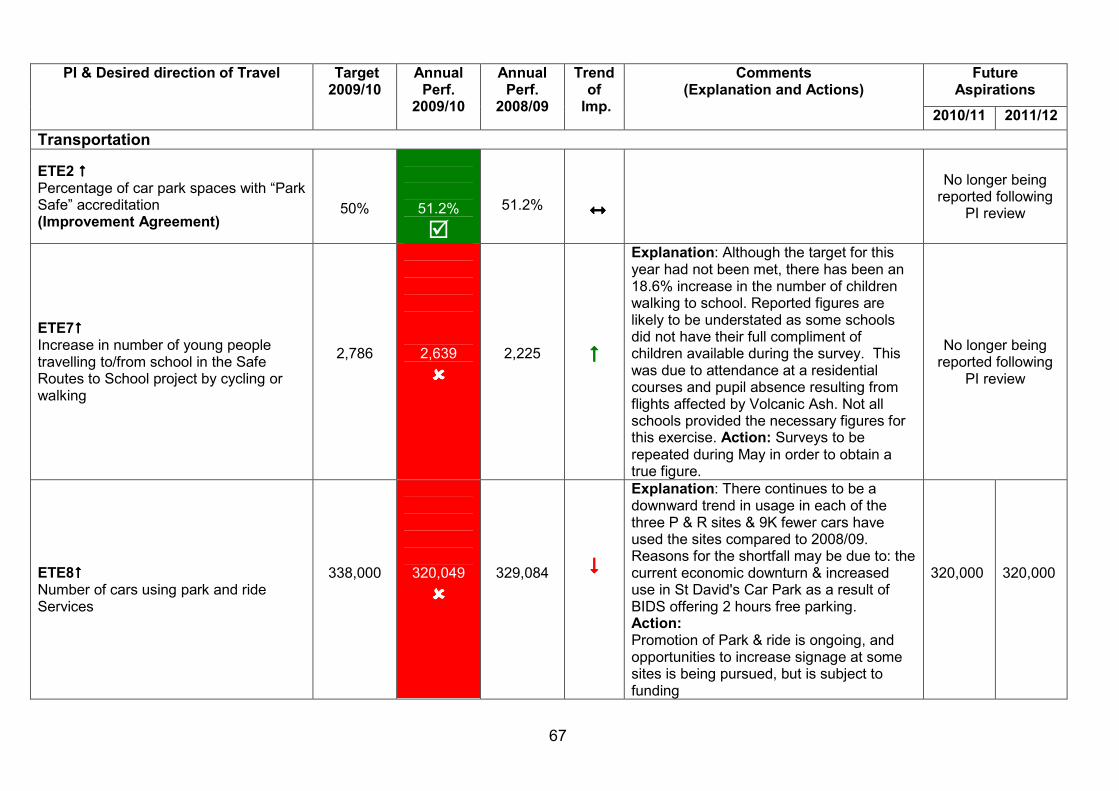
67
Future
Aspirations PI & Desired direction of Travel Target
2009/10 Annual Perf.
2009/10
Annual Perf.
2008/09
Trend of
Imp.
Comments (Explanation and Actions)
2010/11 2011/12
Transportation
ETE2 ���� Percentage of car park spaces with “Park Safe” accreditation (Improvement Agreement)
50%
51.2%
�
51.2%
����
No longer being reported following
PI review
ETE7���� Increase in number of young people travelling to/from school in the Safe Routes to School project by cycling or walking
2,786
2,639
����
2,225
����
Explanation: Although the target for this year had not been met, there has been an 18.6% increase in the number of children walking to school. Reported figures are likely to be understated as some schools did not have their full compliment of children available during the survey. This was due to attendance at a residential courses and pupil absence resulting from flights affected by Volcanic Ash. Not all schools provided the necessary figures for this exercise. Action: Surveys to be repeated during May in order to obtain a true figure.
No longer being reported following
PI review
ETE8���� Number of cars using park and ride Services
338,000
320,049
����
329,084
����
Explanation: There continues to be a downward trend in usage in each of the three P & R sites & 9K fewer cars have used the sites compared to 2008/09. Reasons for the shortfall may be due to: the current economic downturn & increased use in St David's Car Park as a result of BIDS offering 2 hours free parking. Action: Promotion of Park & ride is ongoing, and opportunities to increase signage at some sites is being pursued, but is subject to funding
320,000
320,000
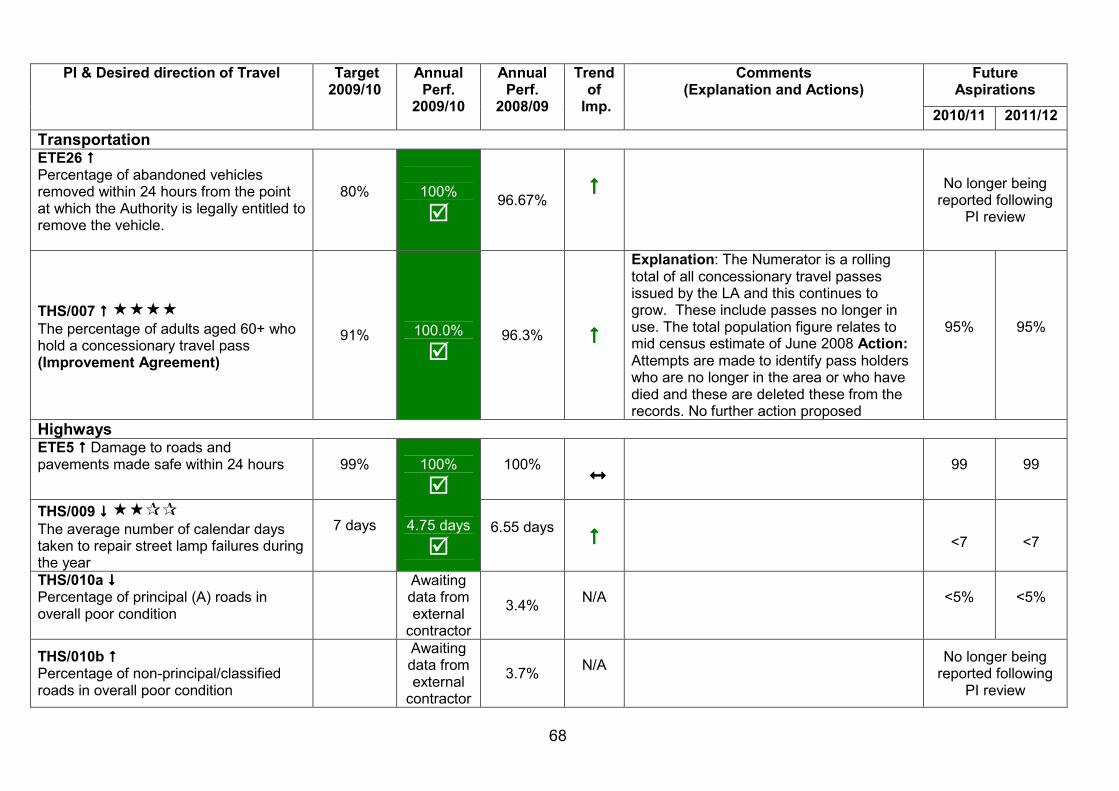
68
Future
Aspirations PI & Desired direction of Travel Target
2009/10 Annual Perf.
2009/10
Annual Perf.
2008/09
Trend of
Imp.
Comments (Explanation and Actions)
2010/11 2011/12
Transportation
ETE26 ���� Percentage of abandoned vehicles removed within 24 hours from the point at which the Authority is legally entitled to remove the vehicle.
80%
100%
� 96.67%
����
No longer being reported following
PI review
THS/007 ���� ����
The percentage of adults aged 60+ who hold a concessionary travel pass (Improvement Agreement)
91%
100.0%
�
96.3% ����
Explanation: The Numerator is a rolling total of all concessionary travel passes issued by the LA and this continues to grow. These include passes no longer in use. The total population figure relates to mid census estimate of June 2008 Action: Attempts are made to identify pass holders who are no longer in the area or who have died and these are deleted these from the records. No further action proposed
95%
95%
Highways ETE5 ���� Damage to roads and pavements made safe within 24 hours
99%
100%
�
100%
����
99
99
THS/009 ���� ����
The average number of calendar days taken to repair street lamp failures during the year
7 days
4.75 days
�
6.55 days
����
<7
<7
THS/010a ���� Percentage of principal (A) roads in overall poor condition
Awaiting data from external
contractor
3.4%
N/A
<5%
<5%
THS/010b ���� Percentage of non-principal/classified roads in overall poor condition
Awaiting data from external
contractor
3.7%
N/A
No longer being
reported following PI review
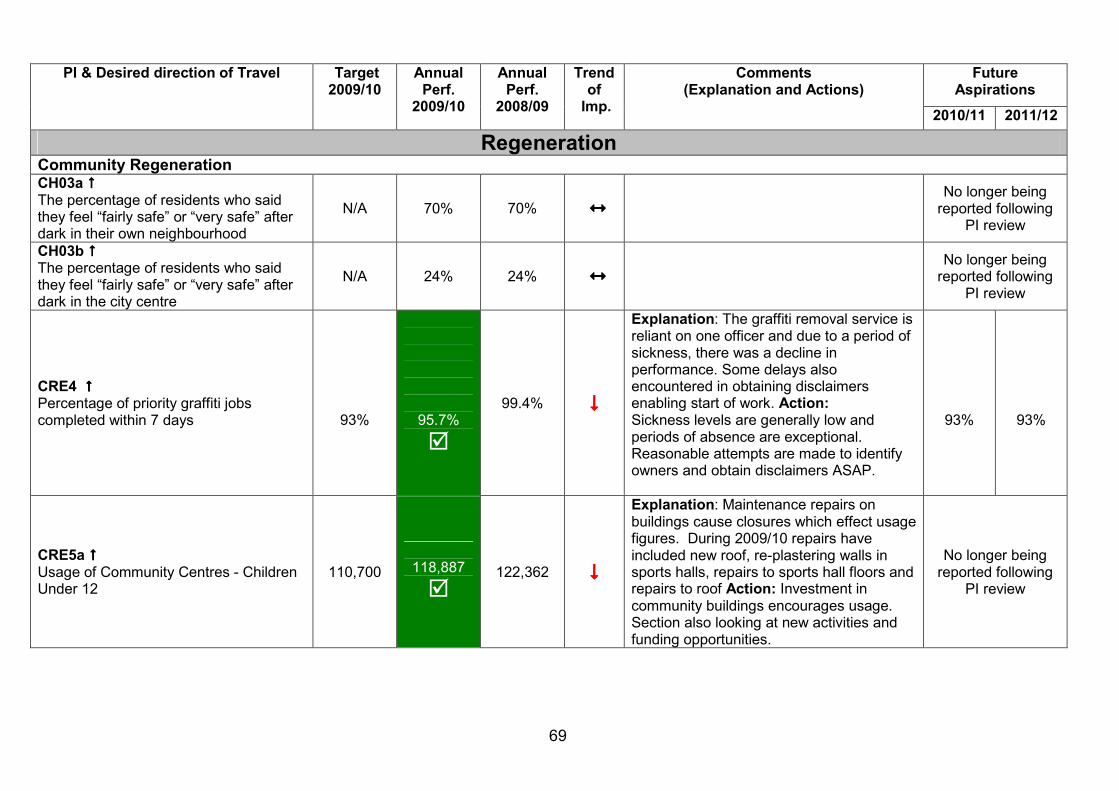
69
Future
Aspirations PI & Desired direction of Travel Target
2009/10 Annual Perf.
2009/10
Annual Perf.
2008/09
Trend of
Imp.
Comments (Explanation and Actions)
2010/11 2011/12
Regeneration Community Regeneration CH03a ���� The percentage of residents who said they feel “fairly safe” or “very safe” after dark in their own neighbourhood
N/A
70%
70% ����
No longer being
reported following PI review
CH03b ���� The percentage of residents who said they feel “fairly safe” or “very safe” after dark in the city centre
N/A
24%
24% ����
No longer being
reported following PI review
CRE4 ���� Percentage of priority graffiti jobs completed within 7 days
93%
95.7%
�
99.4%
����
Explanation: The graffiti removal service is reliant on one officer and due to a period of sickness, there was a decline in performance. Some delays also encountered in obtaining disclaimers enabling start of work. Action: Sickness levels are generally low and periods of absence are exceptional. Reasonable attempts are made to identify owners and obtain disclaimers ASAP.
93%
93%
CRE5a ���� Usage of Community Centres - Children Under 12
110,700
118,887
�
122,362 ����
Explanation: Maintenance repairs on buildings cause closures which effect usage figures. During 2009/10 repairs have included new roof, re-plastering walls in sports halls, repairs to sports hall floors and repairs to roof Action: Investment in community buildings encourages usage. Section also looking at new activities and funding opportunities.
No longer being reported following
PI review
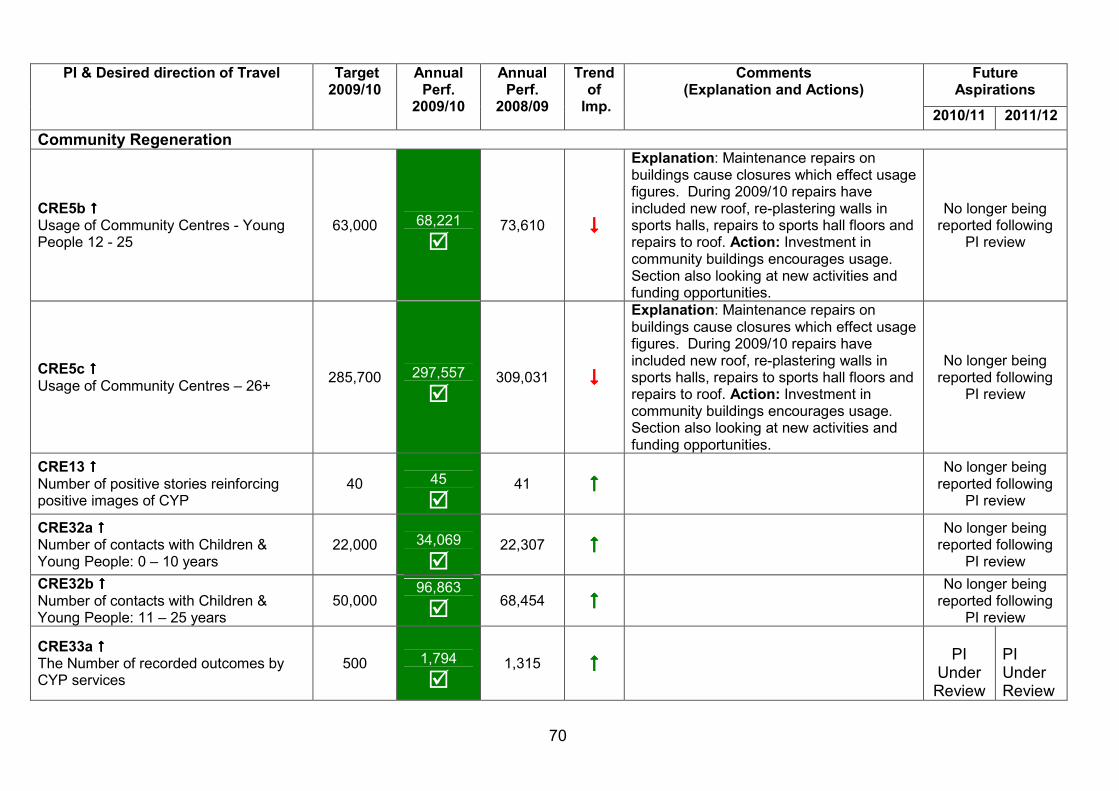
70
Future
Aspirations PI & Desired direction of Travel Target
2009/10 Annual Perf.
2009/10
Annual Perf.
2008/09
Trend of
Imp.
Comments (Explanation and Actions)
2010/11 2011/12
Community Regeneration
CRE5b ���� Usage of Community Centres - Young People 12 - 25
63,000
68,221
�
73,610 ����
Explanation: Maintenance repairs on buildings cause closures which effect usage figures. During 2009/10 repairs have included new roof, re-plastering walls in sports halls, repairs to sports hall floors and repairs to roof. Action: Investment in community buildings encourages usage. Section also looking at new activities and funding opportunities.
No longer being reported following
PI review
CRE5c ���� Usage of Community Centres – 26+
285,700
297,557
�
309,031 ����
Explanation: Maintenance repairs on buildings cause closures which effect usage figures. During 2009/10 repairs have included new roof, re-plastering walls in sports halls, repairs to sports hall floors and repairs to roof. Action: Investment in community buildings encourages usage. Section also looking at new activities and funding opportunities.
No longer being reported following
PI review
CRE13 ���� Number of positive stories reinforcing positive images of CYP
40
45
�
41 ���� No longer being
reported following PI review
CRE32a ���� Number of contacts with Children & Young People: 0 – 10 years
22,000
34,069
�
22,307 ���� No longer being
reported following PI review
CRE32b ���� Number of contacts with Children & Young People: 11 – 25 years
50,000 96,863
� 68,454 ����
No longer being reported following
PI review
CRE33a ���� The Number of recorded outcomes by CYP services
500
1,794
�
1,315 ����
PI
Under Review
PI Under Review
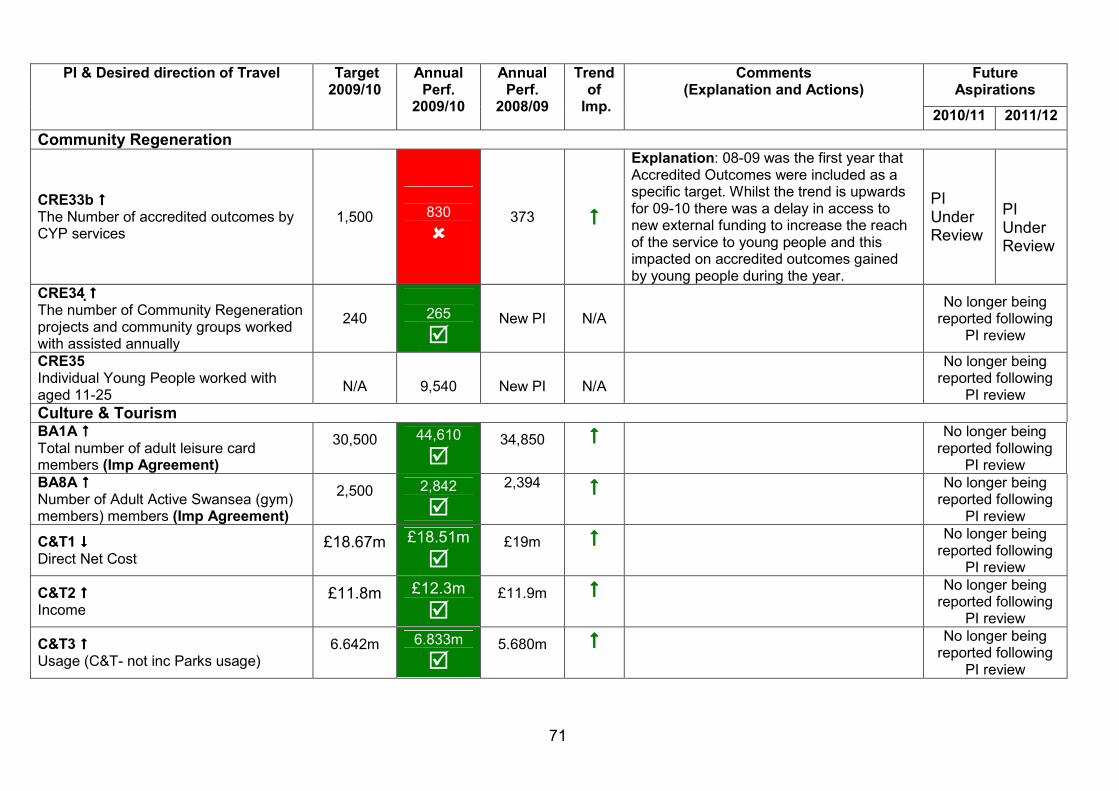
71
Future
Aspirations PI & Desired direction of Travel Target
2009/10 Annual Perf.
2009/10
Annual Perf.
2008/09
Trend of
Imp.
Comments (Explanation and Actions)
2010/11 2011/12
Community Regeneration
CRE33b ���� The Number of accredited outcomes by CYP services
1,500
830
����
373 ����
Explanation: 08-09 was the first year that Accredited Outcomes were included as a specific target. Whilst the trend is upwards for 09-10 there was a delay in access to new external funding to increase the reach of the service to young people and this impacted on accredited outcomes gained by young people during the year.
PI Under Review
PI Under Review
CRE34 ���� The number of Community Regeneration projects and community groups worked with assisted annually
240
265
�
New PI N/A No longer being
reported following PI review
CRE35 Individual Young People worked with aged 11-25
N/A
9,540
New PI
N/A
No longer being
reported following PI review
Culture & Tourism BA1A ���� Total number of adult leisure card members (Imp Agreement)
30,500
44,610
�
34,850
����
No longer being
reported following PI review
BA8A ���� Number of Adult Active Swansea (gym) members) members (Imp Agreement)
2,500
2,842
�
2,394
����
No longer being
reported following PI review
C&T1 ���� Direct Net Cost
£18.67m
£18.51m
�
£19m
����
No longer being
reported following PI review
C&T2 ���� Income
£11.8m
£12.3m
�
£11.9m
����
No longer being
reported following PI review
C&T3 ���� Usage (C&T- not inc Parks usage)
6.642m
6.833m
�
5.680m
����
No longer being
reported following PI review
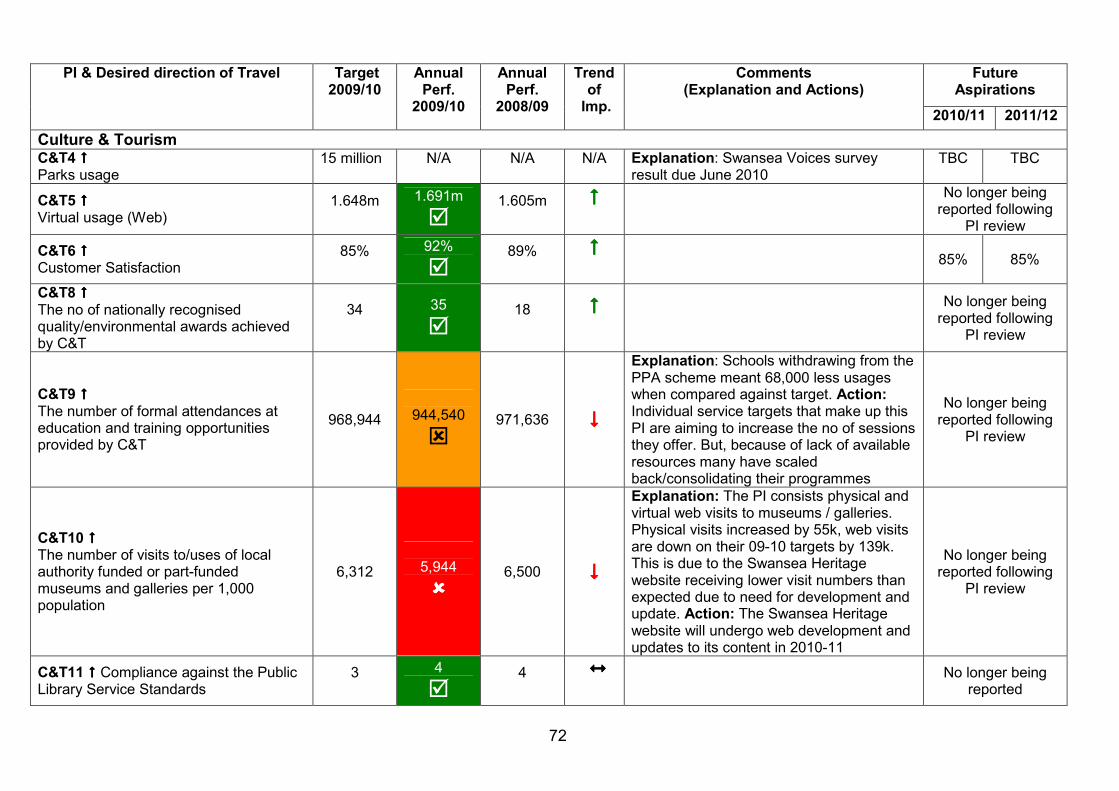
72
Future
Aspirations PI & Desired direction of Travel Target
2009/10 Annual Perf.
2009/10
Annual Perf.
2008/09
Trend of
Imp.
Comments (Explanation and Actions)
2010/11 2011/12
Culture & Tourism C&T4 ���� Parks usage
15 million N/A N/A N/A Explanation: Swansea Voices survey result due June 2010
TBC
TBC
C&T5 ���� Virtual usage (Web)
1.648m
1.691m
�
1.605m
����
No longer being
reported following PI review
C&T6 ���� Customer Satisfaction
85%
92%
�
89%
����
85% 85%
C&T8 ���� The no of nationally recognised quality/environmental awards achieved by C&T
34
35
�
18
����
No longer being
reported following PI review
C&T9 ���� The number of formal attendances at education and training opportunities provided by C&T
968,944
944,540
�
971,636 ����
Explanation: Schools withdrawing from the PPA scheme meant 68,000 less usages when compared against target. Action: Individual service targets that make up this PI are aiming to increase the no of sessions they offer. But, because of lack of available resources many have scaled back/consolidating their programmes
No longer being reported following
PI review
C&T10 ���� The number of visits to/uses of local authority funded or part-funded museums and galleries per 1,000 population
6,312
5,944
����
6,500 ����
Explanation: The PI consists physical and virtual web visits to museums / galleries. Physical visits increased by 55k, web visits are down on their 09-10 targets by 139k. This is due to the Swansea Heritage website receiving lower visit numbers than expected due to need for development and update. Action: The Swansea Heritage website will undergo web development and updates to its content in 2010-11
No longer being reported following
PI review
C&T11 ���� Compliance against the Public Library Service Standards
3
4
�
4
����
No longer being
reported
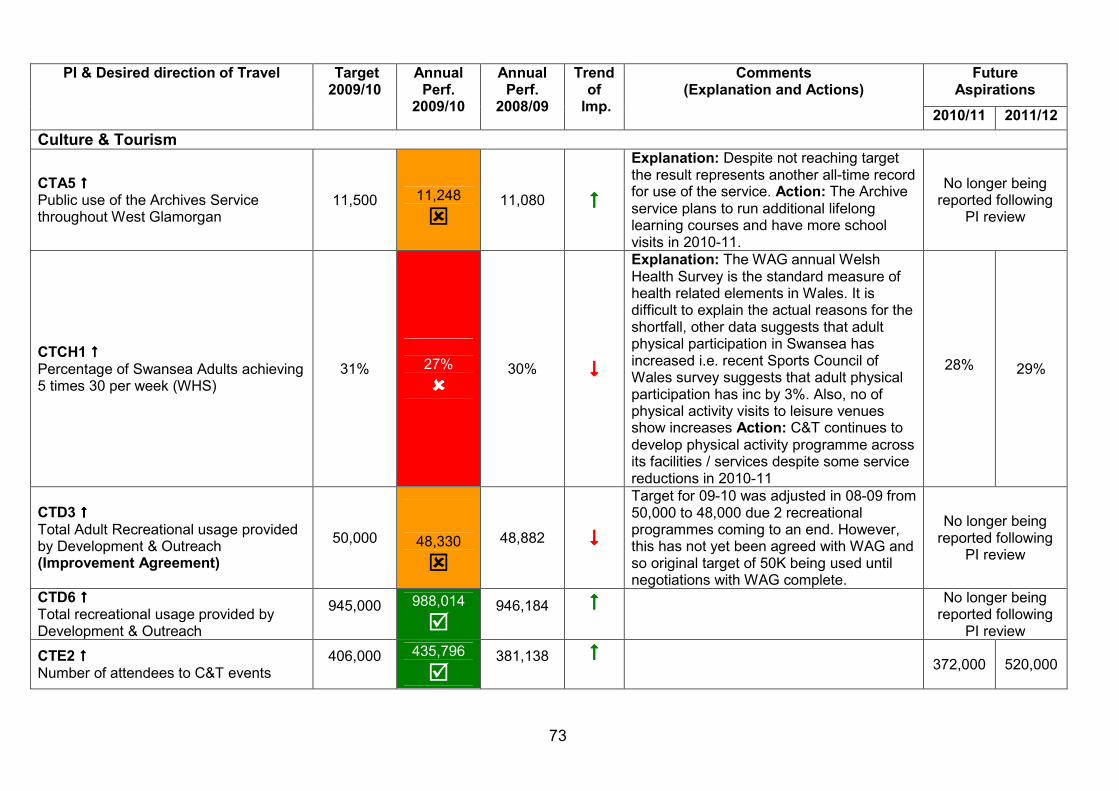
73
Future
Aspirations PI & Desired direction of Travel Target
2009/10 Annual Perf.
2009/10
Annual Perf.
2008/09
Trend of
Imp.
Comments (Explanation and Actions)
2010/11 2011/12
Culture & Tourism
CTA5 ���� Public use of the Archives Service throughout West Glamorgan
11,500
11,248
�
11,080 ����
Explanation: Despite not reaching target the result represents another all-time record for use of the service. Action: The Archive service plans to run additional lifelong learning courses and have more school visits in 2010-11.
No longer being reported following
PI review
CTCH1 ���� Percentage of Swansea Adults achieving 5 times 30 per week (WHS)
31%
27%
����
30% ����
Explanation: The WAG annual Welsh Health Survey is the standard measure of health related elements in Wales. It is difficult to explain the actual reasons for the shortfall, other data suggests that adult physical participation in Swansea has increased i.e. recent Sports Council of Wales survey suggests that adult physical participation has inc by 3%. Also, no of physical activity visits to leisure venues show increases Action: C&T continues to develop physical activity programme across its facilities / services despite some service reductions in 2010-11
28%
29%
CTD3 ���� Total Adult Recreational usage provided by Development & Outreach (Improvement Agreement)
50,000
48,330
�
48,882 ����
Target for 09-10 was adjusted in 08-09 from 50,000 to 48,000 due 2 recreational programmes coming to an end. However, this has not yet been agreed with WAG and so original target of 50K being used until negotiations with WAG complete.
No longer being reported following
PI review
CTD6 ���� Total recreational usage provided by Development & Outreach
945,000
988,014
�
946,184
����
No longer being
reported following PI review
CTE2 ���� Number of attendees to C&T events
406,000
435,796
�
381,138
����
372,000 520,000
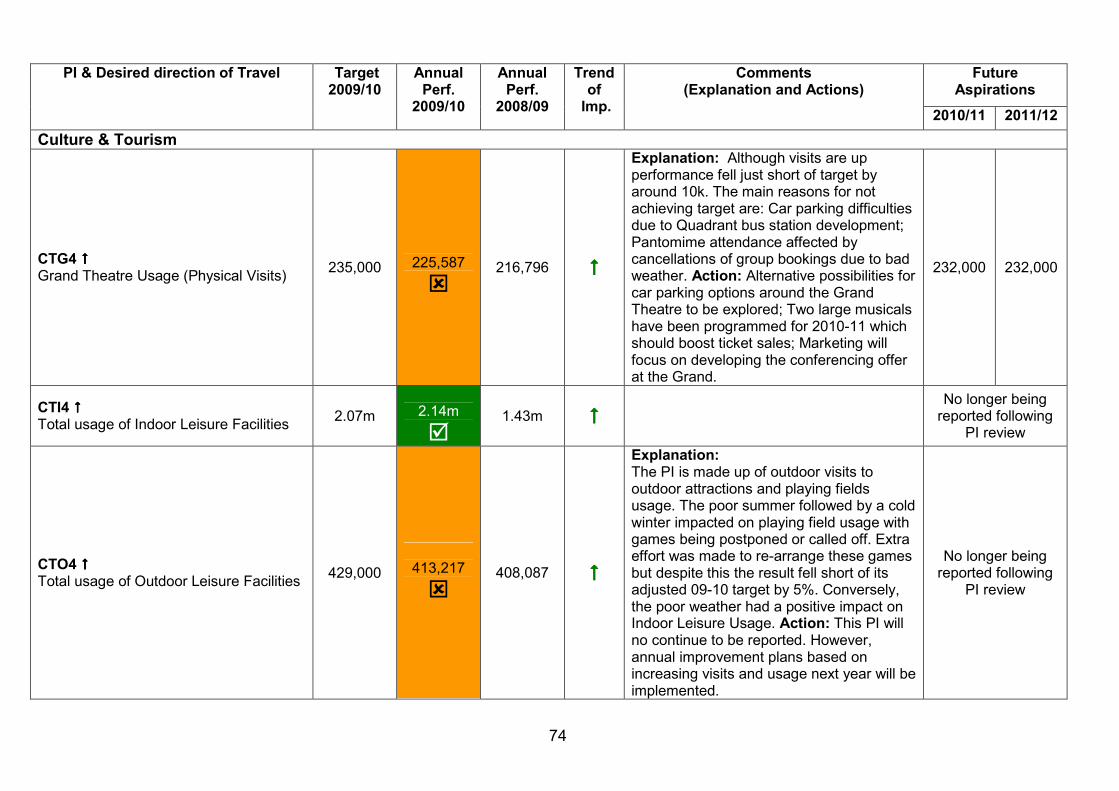
74
Future
Aspirations PI & Desired direction of Travel Target
2009/10 Annual Perf.
2009/10
Annual Perf.
2008/09
Trend of
Imp.
Comments (Explanation and Actions)
2010/11 2011/12
Culture & Tourism
CTG4 ���� Grand Theatre Usage (Physical Visits)
235,000
225,587
�
216,796 ����
Explanation: Although visits are up performance fell just short of target by around 10k. The main reasons for not achieving target are: Car parking difficulties due to Quadrant bus station development; Pantomime attendance affected by cancellations of group bookings due to bad weather. Action: Alternative possibilities for car parking options around the Grand Theatre to be explored; Two large musicals have been programmed for 2010-11 which should boost ticket sales; Marketing will focus on developing the conferencing offer at the Grand.
232,000 232,000
CTI4 ���� Total usage of Indoor Leisure Facilities
2.07m
2.14m
�
1.43m ���� No longer being
reported following PI review
CTO4 ���� Total usage of Outdoor Leisure Facilities
429,000
413,217
�
408,087
����
Explanation: The PI is made up of outdoor visits to outdoor attractions and playing fields usage. The poor summer followed by a cold winter impacted on playing field usage with games being postponed or called off. Extra effort was made to re-arrange these games but despite this the result fell short of its adjusted 09-10 target by 5%. Conversely, the poor weather had a positive impact on Indoor Leisure Usage. Action: This PI will no continue to be reported. However, annual improvement plans based on increasing visits and usage next year will be implemented.
No longer being reported following
PI review
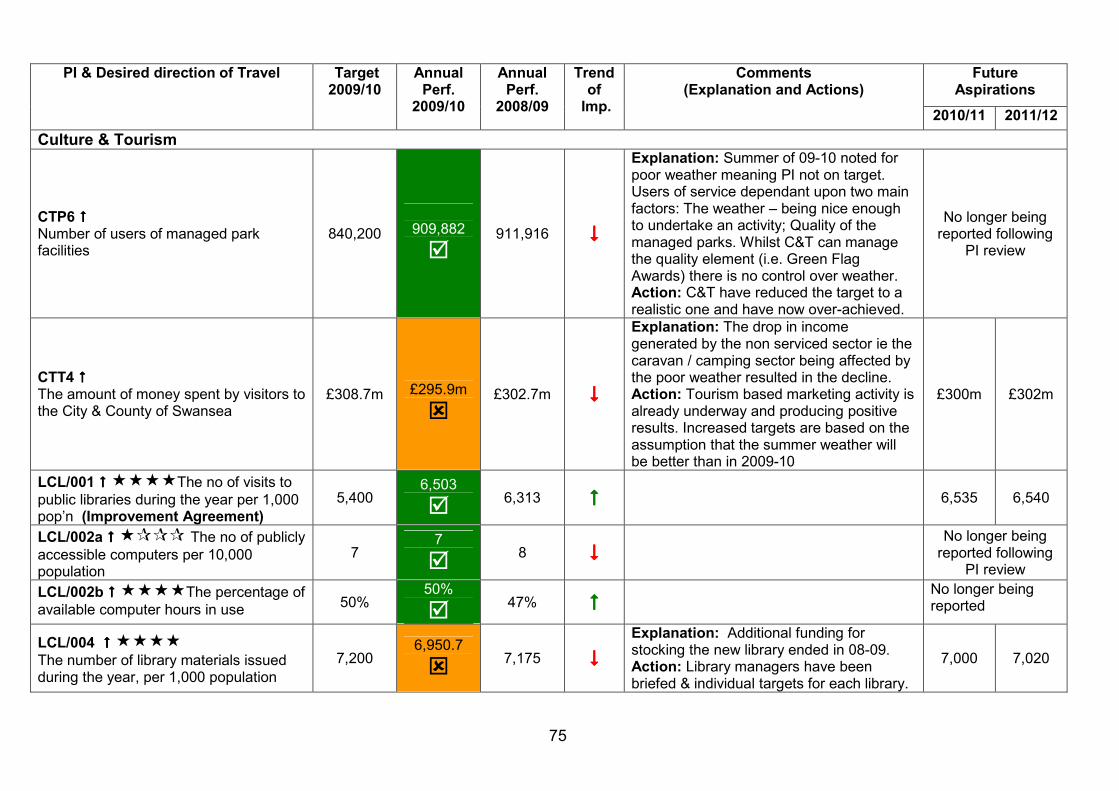
75
Future
Aspirations PI & Desired direction of Travel Target
2009/10 Annual Perf.
2009/10
Annual Perf.
2008/09
Trend of
Imp.
Comments (Explanation and Actions)
2010/11 2011/12
Culture & Tourism
CTP6 ���� Number of users of managed park facilities
840,200
909,882
�
911,916 ����
Explanation: Summer of 09-10 noted for poor weather meaning PI not on target. Users of service dependant upon two main factors: The weather – being nice enough to undertake an activity; Quality of the managed parks. Whilst C&T can manage the quality element (i.e. Green Flag Awards) there is no control over weather. Action: C&T have reduced the target to a realistic one and have now over-achieved.
No longer being reported following
PI review
CTT4 ���� The amount of money spent by visitors to the City & County of Swansea
£308.7m
£295.9m
�
£302.7m ����
Explanation: The drop in income generated by the non serviced sector ie the caravan / camping sector being affected by the poor weather resulted in the decline. Action: Tourism based marketing activity is already underway and producing positive results. Increased targets are based on the assumption that the summer weather will be better than in 2009-10
£300m £302m
LCL/001 ���� ����The no of visits to
public libraries during the year per 1,000 pop’n (Improvement Agreement)
5,400 6,503
� 6,313 ����
6,535 6,540
LCL/002a ���� ���� The no of publicly
accessible computers per 10,000 population
7 7
� 8 ����
No longer being reported following
PI review
LCL/002b ���� ����The percentage of
available computer hours in use 50%
50%
� 47% ����
No longer being reported
LCL/004 ���� ����
The number of library materials issued during the year, per 1,000 population
7,200 6,950.7
� 7,175 ����
Explanation: Additional funding for stocking the new library ended in 08-09. Action: Library managers have been briefed & individual targets for each library.
7,000 7,020
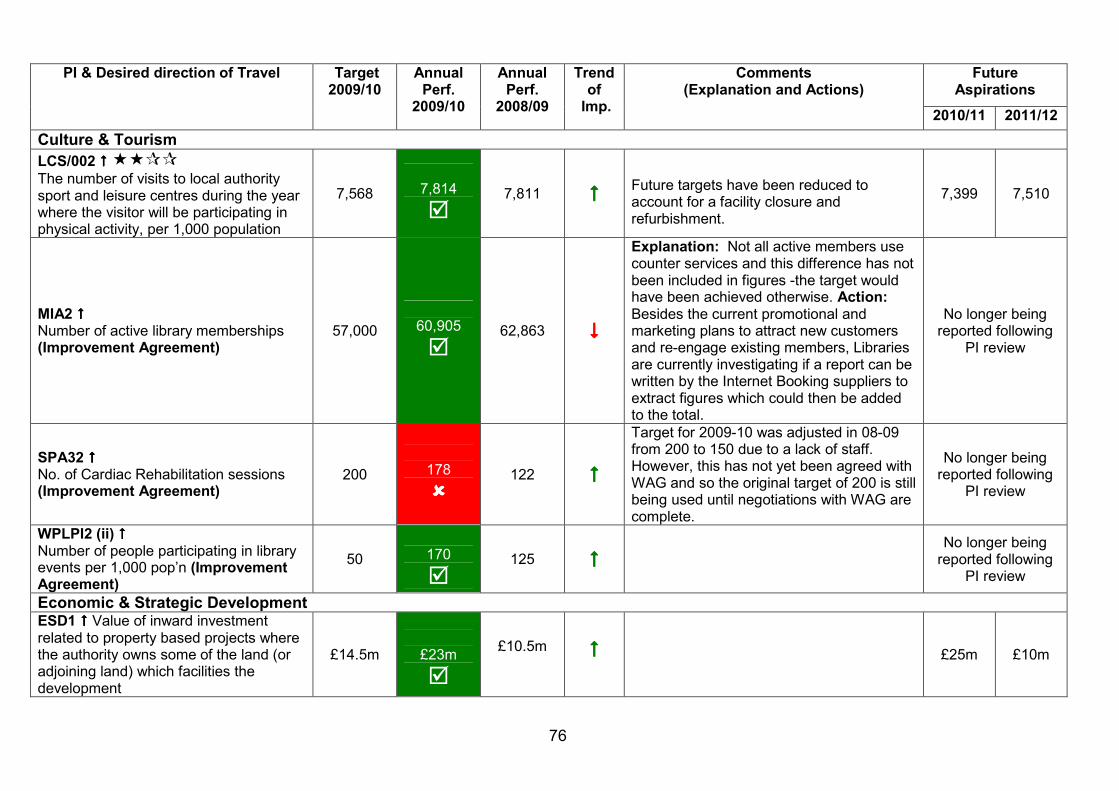
76
Future
Aspirations PI & Desired direction of Travel Target
2009/10 Annual Perf.
2009/10
Annual Perf.
2008/09
Trend of
Imp.
Comments (Explanation and Actions)
2010/11 2011/12
Culture & Tourism
LCS/002 ���� ����
The number of visits to local authority sport and leisure centres during the year where the visitor will be participating in physical activity, per 1,000 population
7,568
7,814
�
7,811 ����
Future targets have been reduced to account for a facility closure and refurbishment.
7,399 7,510
MIA2 ���� Number of active library memberships (Improvement Agreement)
57,000
60,905
�
62,863 ����
Explanation: Not all active members use counter services and this difference has not been included in figures -the target would have been achieved otherwise. Action: Besides the current promotional and marketing plans to attract new customers and re-engage existing members, Libraries are currently investigating if a report can be written by the Internet Booking suppliers to extract figures which could then be added to the total.
No longer being reported following
PI review
SPA32 ���� No. of Cardiac Rehabilitation sessions (Improvement Agreement)
200
178
����
122 ����
Target for 2009-10 was adjusted in 08-09 from 200 to 150 due to a lack of staff. However, this has not yet been agreed with WAG and so the original target of 200 is still being used until negotiations with WAG are complete.
No longer being reported following
PI review
WPLPI2 (ii) ���� Number of people participating in library events per 1,000 pop’n (Improvement Agreement)
50
170
�
125 ���� No longer being
reported following PI review
Economic & Strategic Development ESD1 ���� Value of inward investment related to property based projects where the authority owns some of the land (or adjoining land) which facilities the development
£14.5m
£23m
�
£10.5m
����
£25m
£10m
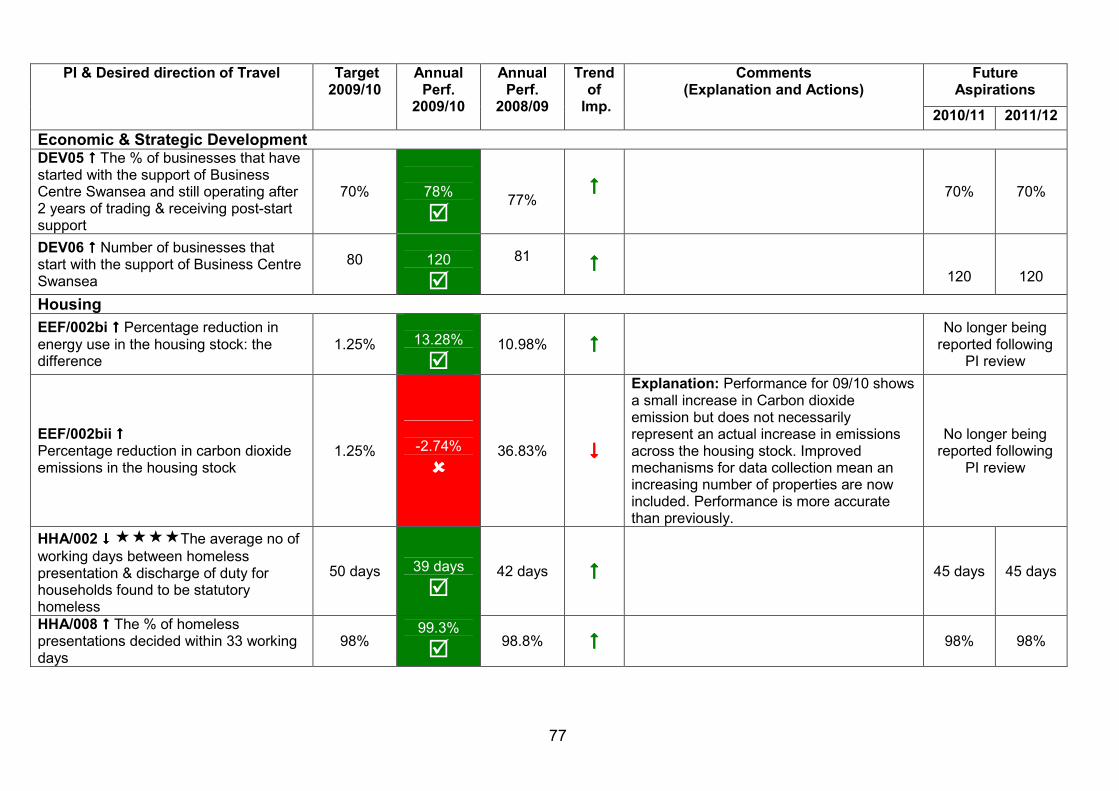
77
Future
Aspirations PI & Desired direction of Travel Target
2009/10 Annual Perf.
2009/10
Annual Perf.
2008/09
Trend of
Imp.
Comments (Explanation and Actions)
2010/11 2011/12
Economic & Strategic Development DEV05 ���� The % of businesses that have started with the support of Business Centre Swansea and still operating after 2 years of trading & receiving post-start support
70%
78%
�
77%
����
70%
70%
DEV06 ���� Number of businesses that start with the support of Business Centre Swansea
80
120
�
81
����
120
120
Housing
EEF/002bi ���� Percentage reduction in energy use in the housing stock: the difference
1.25%
13.28%
�
10.98% ���� No longer being
reported following PI review
EEF/002bii ���� Percentage reduction in carbon dioxide emissions in the housing stock
1.25%
-2.74%
����
36.83% ����
Explanation: Performance for 09/10 shows a small increase in Carbon dioxide emission but does not necessarily represent an actual increase in emissions across the housing stock. Improved mechanisms for data collection mean an increasing number of properties are now included. Performance is more accurate than previously.
No longer being reported following
PI review
HHA/002 ���� ����The average no of
working days between homeless presentation & discharge of duty for households found to be statutory homeless
50 days
39 days
�
42 days ���� 45 days 45 days
HHA/008 ���� The % of homeless presentations decided within 33 working days
98% 99.3%
� 98.8% ����
98% 98%
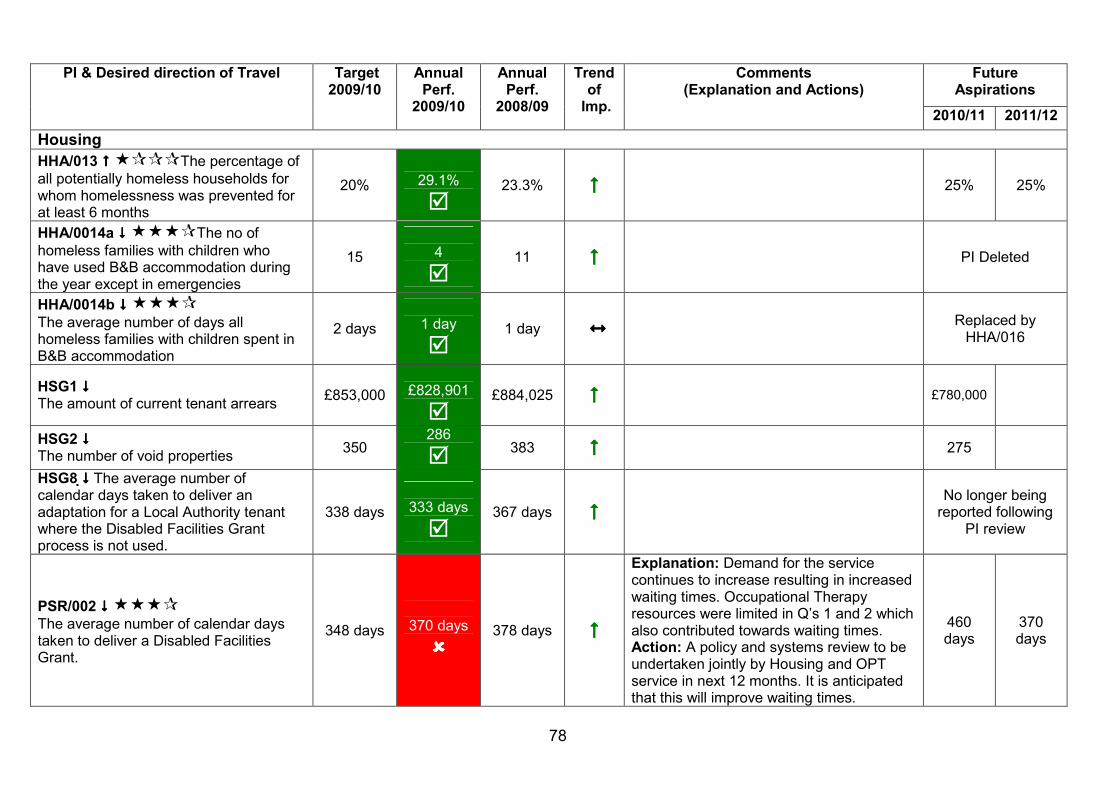
78
Future
Aspirations PI & Desired direction of Travel Target
2009/10 Annual Perf.
2009/10
Annual Perf.
2008/09
Trend of
Imp.
Comments (Explanation and Actions)
2010/11 2011/12
Housing
HHA/013 ���� ����The percentage of
all potentially homeless households for whom homelessness was prevented for at least 6 months
20%
29.1%
�
23.3% ����
25% 25%
HHA/0014a ���� ����The no of
homeless families with children who have used B&B accommodation during the year except in emergencies
15
4
�
11 ���� PI Deleted
HHA/0014b ���� ����
The average number of days all homeless families with children spent in B&B accommodation
2 days
1 day
�
1 day ����
Replaced by HHA/016
HSG1 ���� The amount of current tenant arrears
£853,000
£828,901
�
£884,025 ���� £780,000
HSG2 ���� The number of void properties
350 286
� 383 ���� 275
HSG8 ���� The average number of calendar days taken to deliver an adaptation for a Local Authority tenant where the Disabled Facilities Grant process is not used.
338 days
333 days
�
367 days ����
No longer being
reported following PI review
PSR/002 ���� ����
The average number of calendar days taken to deliver a Disabled Facilities Grant.
348 days
370 days
����
378 days ����
Explanation: Demand for the service continues to increase resulting in increased waiting times. Occupational Therapy resources were limited in Q’s 1 and 2 which also contributed towards waiting times. Action: A policy and systems review to be undertaken jointly by Housing and OPT service in next 12 months. It is anticipated that this will improve waiting times.
460 days
370 days
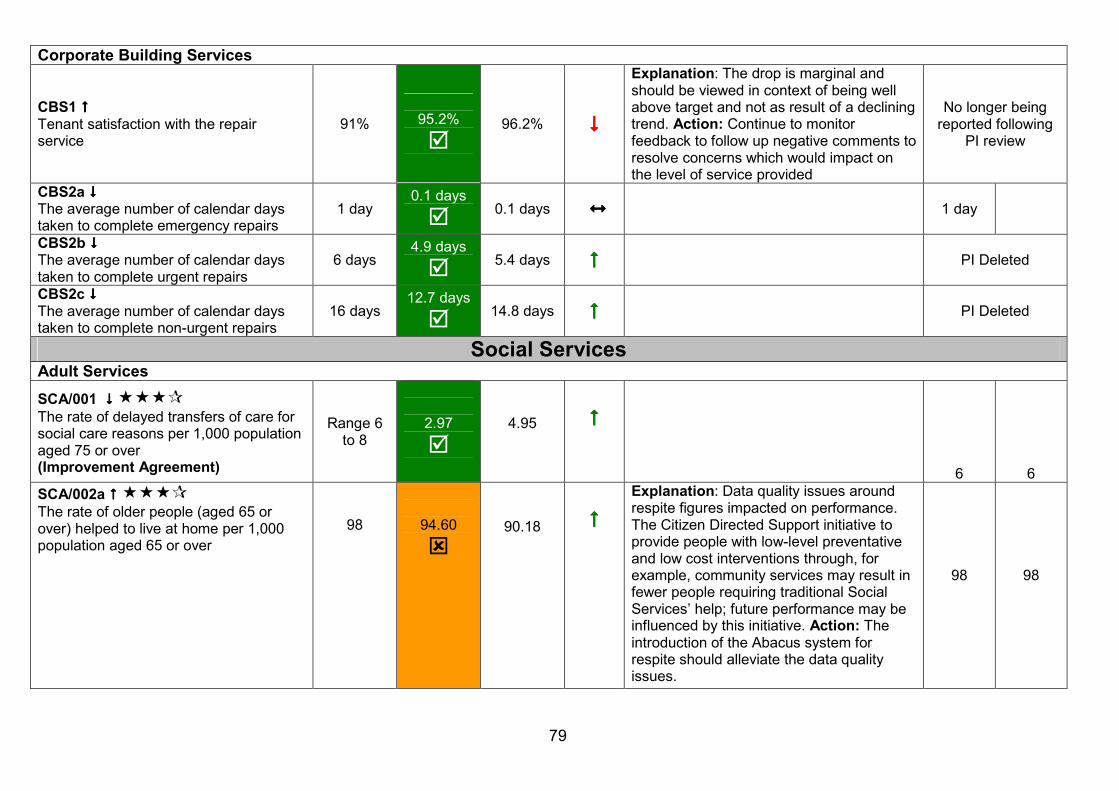
79
Corporate Building Services
CBS1 ���� Tenant satisfaction with the repair service
91%
95.2%
�
96.2% ����
Explanation: The drop is marginal and should be viewed in context of being well above target and not as result of a declining trend. Action: Continue to monitor feedback to follow up negative comments to resolve concerns which would impact on the level of service provided
No longer being reported following
PI review
CBS2a ���� The average number of calendar days taken to complete emergency repairs
1 day 0.1 days
� 0.1 days ����
1 day
CBS2b ���� The average number of calendar days taken to complete urgent repairs
6 days 4.9 days
� 5.4 days ����
PI Deleted
CBS2c ���� The average number of calendar days taken to complete non-urgent repairs
16 days 12.7 days
� 14.8 days ����
PI Deleted
Social Services Adult Services
SCA/001 ���� ����
The rate of delayed transfers of care for social care reasons per 1,000 population aged 75 or over (Improvement Agreement)
Range 6 to 8
2.97
�
4.95
����
6
6
SCA/002a ���� ����
The rate of older people (aged 65 or over) helped to live at home per 1,000 population aged 65 or over
98
94.60
�
90.18
����
Explanation: Data quality issues around respite figures impacted on performance. The Citizen Directed Support initiative to provide people with low-level preventative and low cost interventions through, for example, community services may result in fewer people requiring traditional Social Services’ help; future performance may be influenced by this initiative. Action: The introduction of the Abacus system for respite should alleviate the data quality issues.
98
98
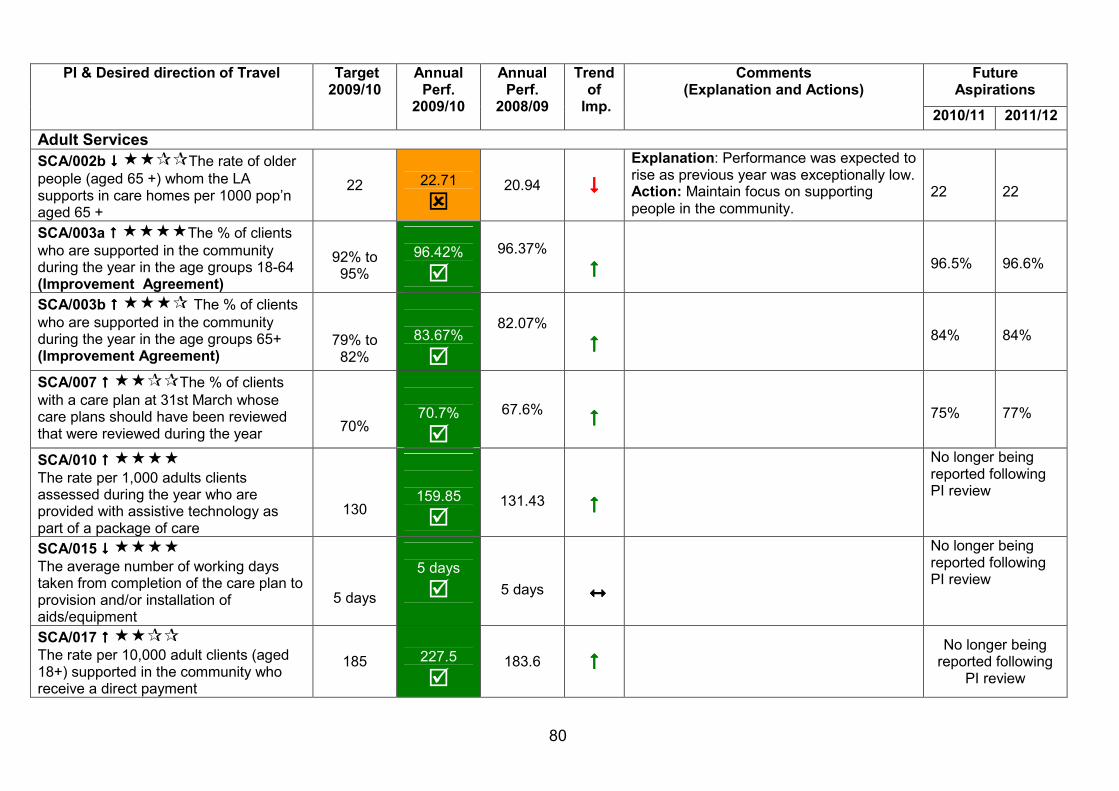
80
Future
Aspirations PI & Desired direction of Travel Target
2009/10 Annual Perf.
2009/10
Annual Perf.
2008/09
Trend of
Imp.
Comments (Explanation and Actions)
2010/11 2011/12
Adult Services
SCA/002b ���� ����The rate of older
people (aged 65 +) whom the LA supports in care homes per 1000 pop’n aged 65 +
22
22.71
�
20.94
����
Explanation: Performance was expected to rise as previous year was exceptionally low. Action: Maintain focus on supporting people in the community.
22
22
SCA/003a ���� ����The % of clients
who are supported in the community during the year in the age groups 18-64 (Improvement Agreement)
92% to 95%
96.42%
�
96.37%
����
96.5%
96.6%
SCA/003b ���� ���� The % of clients
who are supported in the community during the year in the age groups 65+ (Improvement Agreement)
79% to 82%
83.67%
�
82.07%
����
84%
84%
SCA/007 ���� ����The % of clients
with a care plan at 31st March whose care plans should have been reviewed that were reviewed during the year
70%
70.7%
�
67.6%
����
75%
77%
SCA/010 ���� ����
The rate per 1,000 adults clients assessed during the year who are provided with assistive technology as part of a package of care
130
159.85
�
131.43
����
No longer being reported following PI review
SCA/015 ���� ����
The average number of working days taken from completion of the care plan to provision and/or installation of aids/equipment
5 days
5 days
�
5 days
����
No longer being reported following PI review
SCA/017 ���� ����
The rate per 10,000 adult clients (aged 18+) supported in the community who receive a direct payment
185
227.5
�
183.6 ����
No longer being
reported following PI review
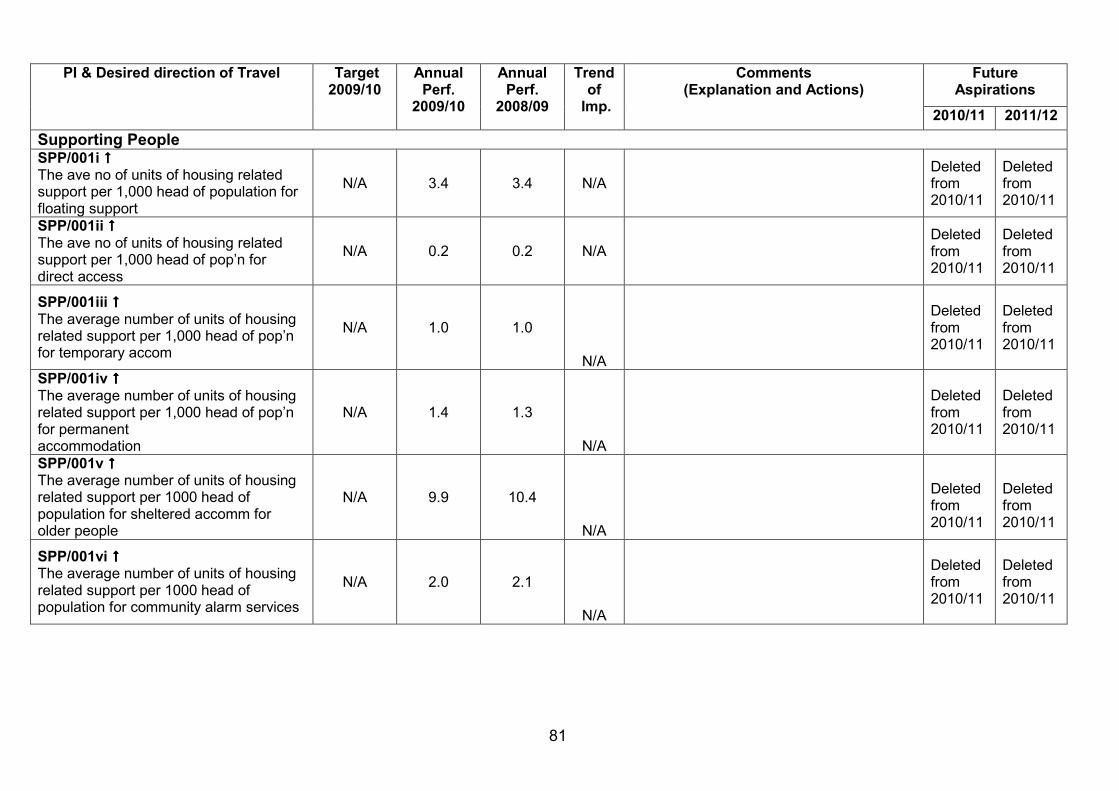
81
Future
Aspirations PI & Desired direction of Travel Target
2009/10 Annual Perf.
2009/10
Annual Perf.
2008/09
Trend of
Imp.
Comments (Explanation and Actions)
2010/11 2011/12
Supporting People SPP/001i ���� The ave no of units of housing related support per 1,000 head of population for floating support
N/A 3.4 3.4 N/A
Deleted from 2010/11
Deleted from 2010/11
SPP/001ii ���� The ave no of units of housing related support per 1,000 head of pop’n for direct access
N/A 0.2 0.2 N/A
Deleted from 2010/11
Deleted from 2010/11
SPP/001iii ���� The average number of units of housing related support per 1,000 head of pop’n for temporary accom
N/A 1.0 1.0
N/A
Deleted from 2010/11
Deleted from 2010/11
SPP/001iv ���� The average number of units of housing related support per 1,000 head of pop’n for permanent accommodation
N/A 1.4 1.3
N/A
Deleted from 2010/11
Deleted from 2010/11
SPP/001v ���� The average number of units of housing related support per 1000 head of population for sheltered accomm for older people
N/A 9.9 10.4
N/A
Deleted from 2010/11
Deleted from 2010/11
SPP/001vi ���� The average number of units of housing related support per 1000 head of population for community alarm services
N/A 2.0 2.1
N/A
Deleted from 2010/11
Deleted from 2010/11
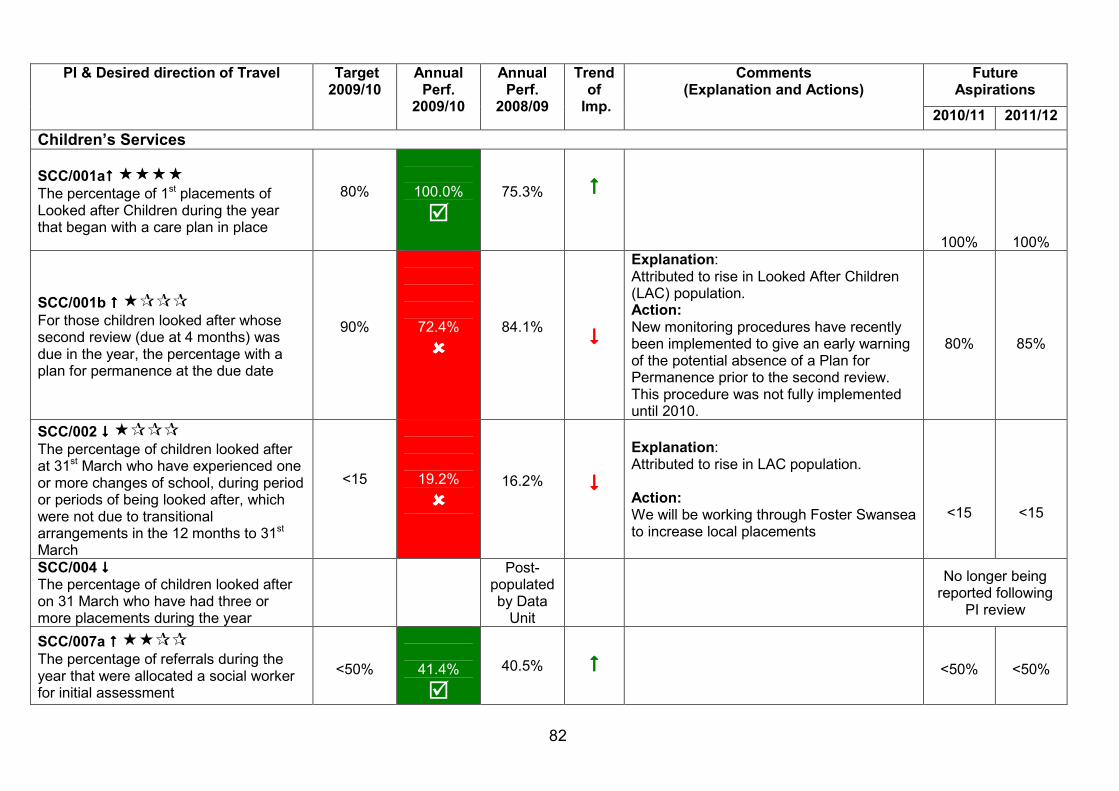
82
Future
Aspirations PI & Desired direction of Travel Target
2009/10 Annual Perf.
2009/10
Annual Perf.
2008/09
Trend of
Imp.
Comments (Explanation and Actions)
2010/11 2011/12
Children’s Services
SCC/001a���� ����
The percentage of 1st placements of Looked after Children during the year that began with a care plan in place
80%
100.0%
�
75.3%
����
100%
100%
SCC/001b ���� ����
For those children looked after whose second review (due at 4 months) was due in the year, the percentage with a plan for permanence at the due date
90%
72.4%
����
84.1%
����
Explanation: Attributed to rise in Looked After Children (LAC) population. Action: New monitoring procedures have recently been implemented to give an early warning of the potential absence of a Plan for Permanence prior to the second review. This procedure was not fully implemented until 2010.
80%
85%
SCC/002 ���� ����
The percentage of children looked after at 31st March who have experienced one or more changes of school, during period or periods of being looked after, which were not due to transitional arrangements in the 12 months to 31st March
<15
19.2%
����
16.2%
����
Explanation: Attributed to rise in LAC population. Action: We will be working through Foster Swansea to increase local placements
<15
<15
SCC/004 ���� The percentage of children looked after on 31 March who have had three or more placements during the year
Post-populated by Data
Unit
No longer being
reported following PI review
SCC/007a ���� ����
The percentage of referrals during the year that were allocated a social worker for initial assessment
<50%
41.4%
�
40.5%
����
<50%
<50%
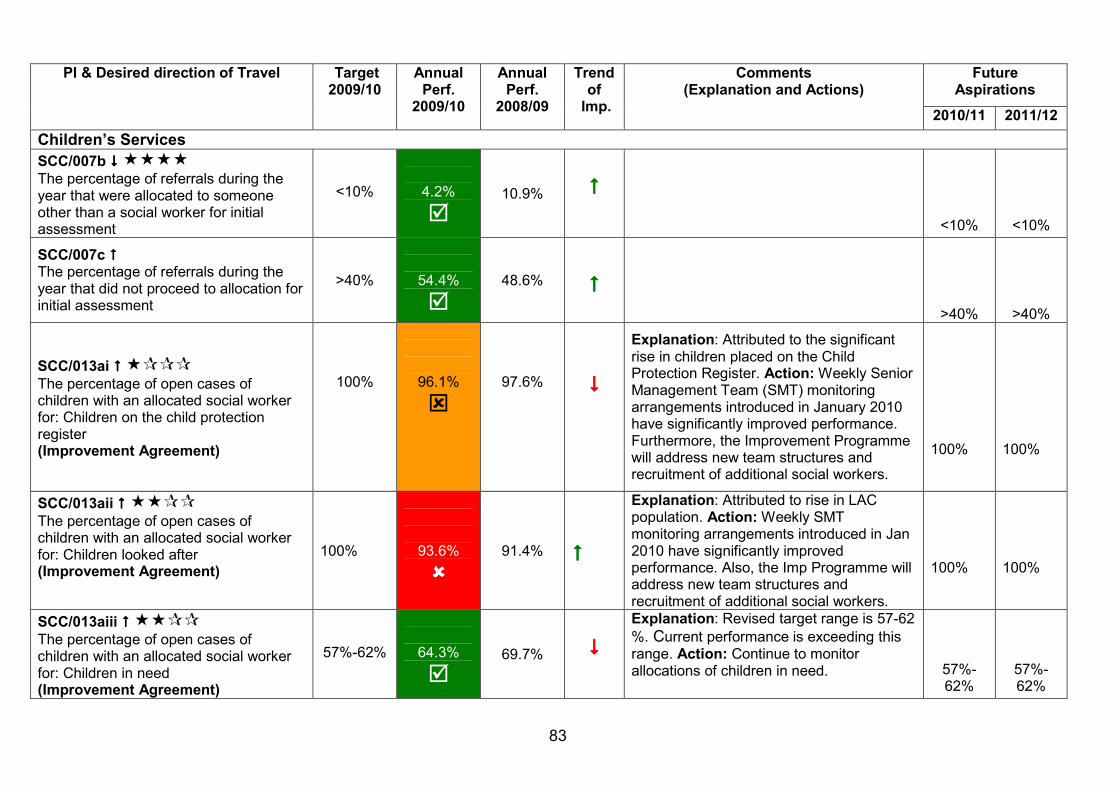
83
Future
Aspirations PI & Desired direction of Travel Target
2009/10 Annual Perf.
2009/10
Annual Perf.
2008/09
Trend of
Imp.
Comments (Explanation and Actions)
2010/11 2011/12
Children’s Services
SCC/007b ���� ����
The percentage of referrals during the year that were allocated to someone other than a social worker for initial assessment
<10%
4.2%
�
10.9%
����
<10%
<10%
SCC/007c ���� The percentage of referrals during the year that did not proceed to allocation for initial assessment
>40%
54.4%
�
48.6%
����
>40%
>40%
SCC/013ai ���� ����
The percentage of open cases of children with an allocated social worker for: Children on the child protection register (Improvement Agreement)
100%
96.1%
�
97.6%
����
Explanation: Attributed to the significant rise in children placed on the Child Protection Register. Action: Weekly Senior Management Team (SMT) monitoring arrangements introduced in January 2010 have significantly improved performance. Furthermore, the Improvement Programme will address new team structures and recruitment of additional social workers.
100%
100%
SCC/013aii ���� ����
The percentage of open cases of children with an allocated social worker for: Children looked after (Improvement Agreement)
100%
93.6%
����
91.4%
����
Explanation: Attributed to rise in LAC population. Action: Weekly SMT monitoring arrangements introduced in Jan 2010 have significantly improved performance. Also, the Imp Programme will address new team structures and recruitment of additional social workers.
100%
100%
SCC/013aiii ���� ����
The percentage of open cases of children with an allocated social worker for: Children in need (Improvement Agreement)
57%-62%
64.3%
�
69.7%
����
Explanation: Revised target range is 57-62
%. Current performance is exceeding this range. Action: Continue to monitor allocations of children in need.
57%-62%
57%-62%
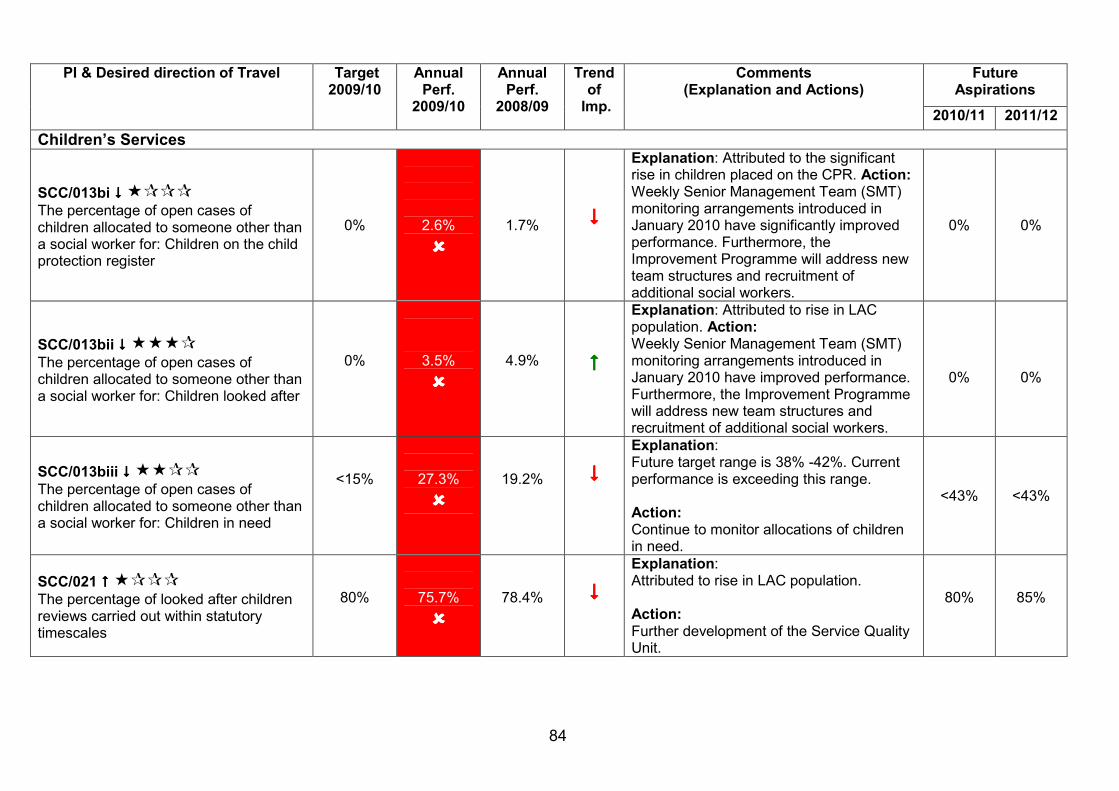
84
Future
Aspirations PI & Desired direction of Travel Target
2009/10 Annual Perf.
2009/10
Annual Perf.
2008/09
Trend of
Imp.
Comments (Explanation and Actions)
2010/11 2011/12
Children’s Services
SCC/013bi ���� ����
The percentage of open cases of children allocated to someone other than a social worker for: Children on the child protection register
0%
2.6%
����
1.7%
����
Explanation: Attributed to the significant rise in children placed on the CPR. Action: Weekly Senior Management Team (SMT) monitoring arrangements introduced in January 2010 have significantly improved performance. Furthermore, the Improvement Programme will address new team structures and recruitment of additional social workers.
0%
0%
SCC/013bii ���� ����
The percentage of open cases of children allocated to someone other than a social worker for: Children looked after
0%
3.5%
����
4.9%
����
Explanation: Attributed to rise in LAC population. Action: Weekly Senior Management Team (SMT) monitoring arrangements introduced in January 2010 have improved performance. Furthermore, the Improvement Programme will address new team structures and recruitment of additional social workers.
0%
0%
SCC/013biii ���� ����
The percentage of open cases of children allocated to someone other than a social worker for: Children in need
<15%
27.3%
����
19.2%
����
Explanation: Future target range is 38% -42%. Current performance is exceeding this range. Action: Continue to monitor allocations of children in need.
<43%
<43%
SCC/021 ���� ����
The percentage of looked after children reviews carried out within statutory timescales
80%
75.7%
����
78.4%
����
Explanation: Attributed to rise in LAC population. Action: Further development of the Service Quality Unit.
80%
85%
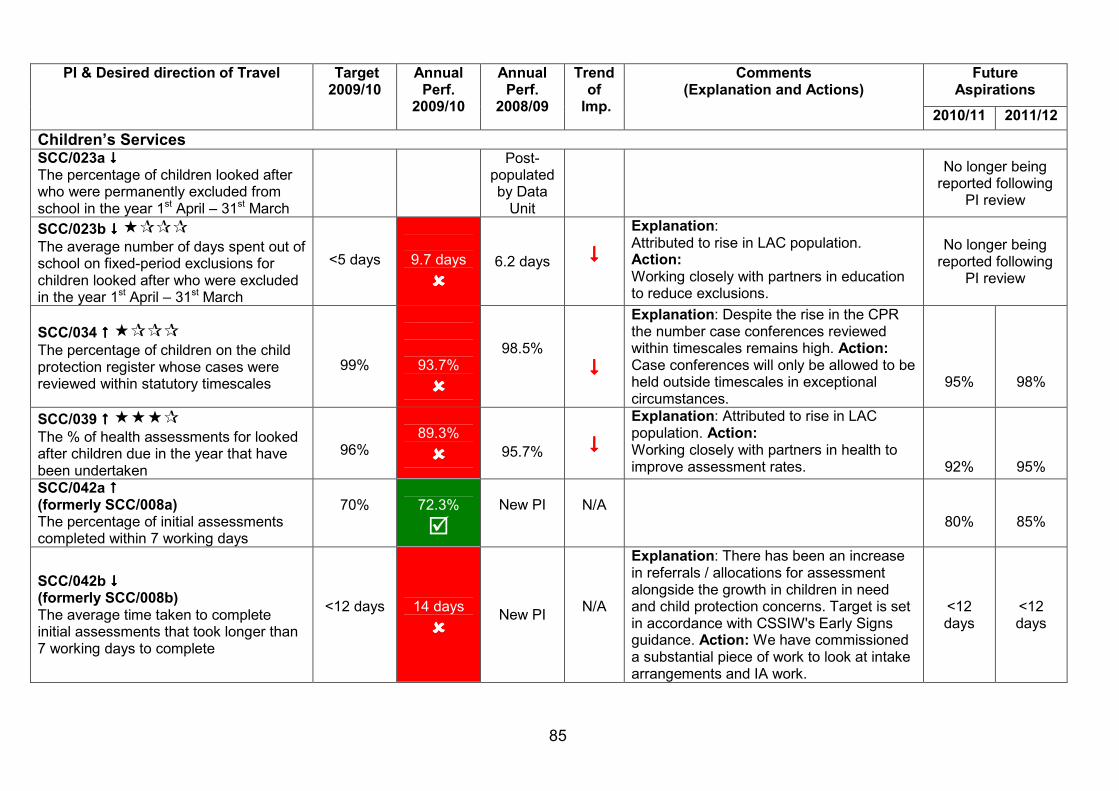
85
Future
Aspirations PI & Desired direction of Travel Target
2009/10 Annual Perf.
2009/10
Annual Perf.
2008/09
Trend of
Imp.
Comments (Explanation and Actions)
2010/11 2011/12
Children’s Services SCC/023a ���� The percentage of children looked after who were permanently excluded from school in the year 1st April – 31st March
Post-populated by Data
Unit
No longer being
reported following PI review
SCC/023b ���� ����
The average number of days spent out of school on fixed-period exclusions for children looked after who were excluded in the year 1st April – 31st March
<5 days
9.7 days
����
6.2 days
����
Explanation: Attributed to rise in LAC population. Action: Working closely with partners in education to reduce exclusions.
No longer being reported following
PI review
SCC/034 ���� ����
The percentage of children on the child protection register whose cases were reviewed within statutory timescales
99%
93.7%
����
98.5%
����
Explanation: Despite the rise in the CPR the number case conferences reviewed within timescales remains high. Action: Case conferences will only be allowed to be held outside timescales in exceptional circumstances.
95%
98%
SCC/039 ���� ����
The % of health assessments for looked after children due in the year that have been undertaken
96%
89.3%
����
95.7%
����
Explanation: Attributed to rise in LAC population. Action: Working closely with partners in health to improve assessment rates.
92%
95%
SCC/042a ���� (formerly SCC/008a) The percentage of initial assessments completed within 7 working days
70%
72.3%
�
New PI
N/A
80%
85%
SCC/042b ���� (formerly SCC/008b) The average time taken to complete initial assessments that took longer than 7 working days to complete
<12 days
14 days
����
New PI
N/A
Explanation: There has been an increase in referrals / allocations for assessment alongside the growth in children in need and child protection concerns. Target is set in accordance with CSSIW's Early Signs guidance. Action: We have commissioned a substantial piece of work to look at intake arrangements and IA work.
<12 days
<12 days
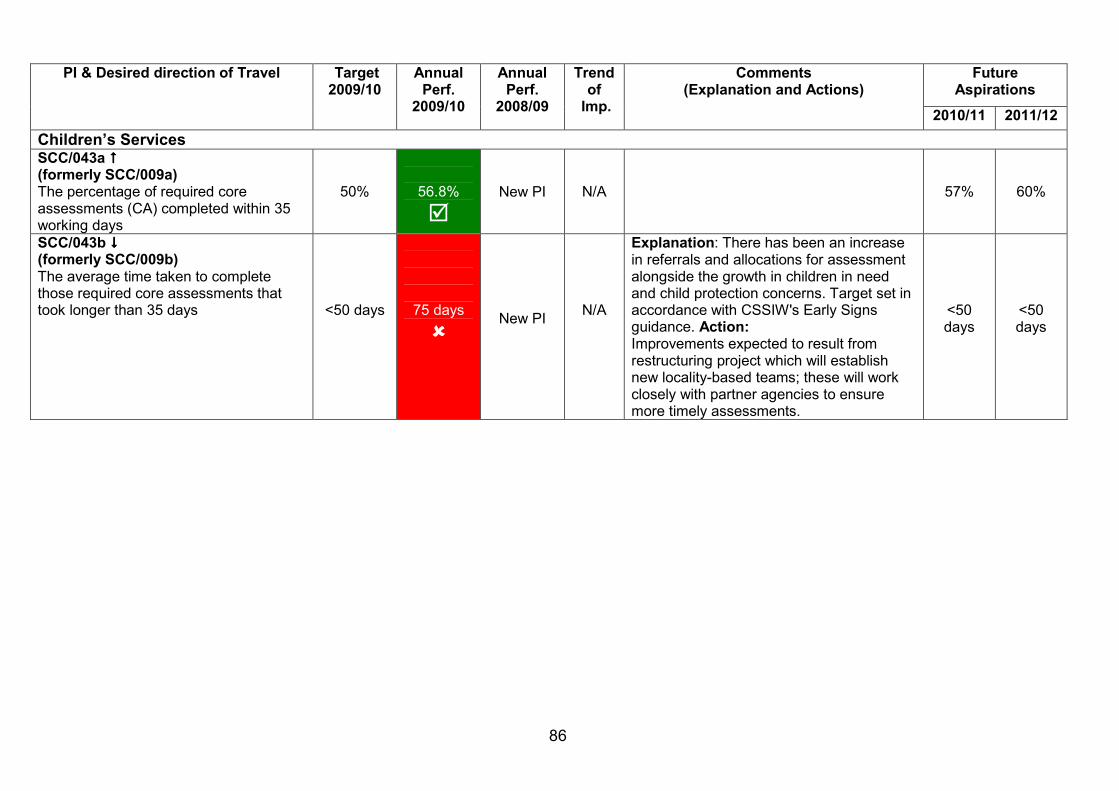
86
Future
Aspirations PI & Desired direction of Travel Target
2009/10 Annual Perf.
2009/10
Annual Perf.
2008/09
Trend of
Imp.
Comments (Explanation and Actions)
2010/11 2011/12
Children’s Services SCC/043a ���� (formerly SCC/009a) The percentage of required core assessments (CA) completed within 35 working days
50%
56.8%
�
New PI
N/A
57%
60%
SCC/043b ���� (formerly SCC/009b) The average time taken to complete those required core assessments that took longer than 35 days
<50 days
75 days
����
New PI
N/A
Explanation: There has been an increase in referrals and allocations for assessment alongside the growth in children in need and child protection concerns. Target set in accordance with CSSIW's Early Signs guidance. Action: Improvements expected to result from restructuring project which will establish new locality-based teams; these will work closely with partner agencies to ensure more timely assessments.
<50 days
<50 days
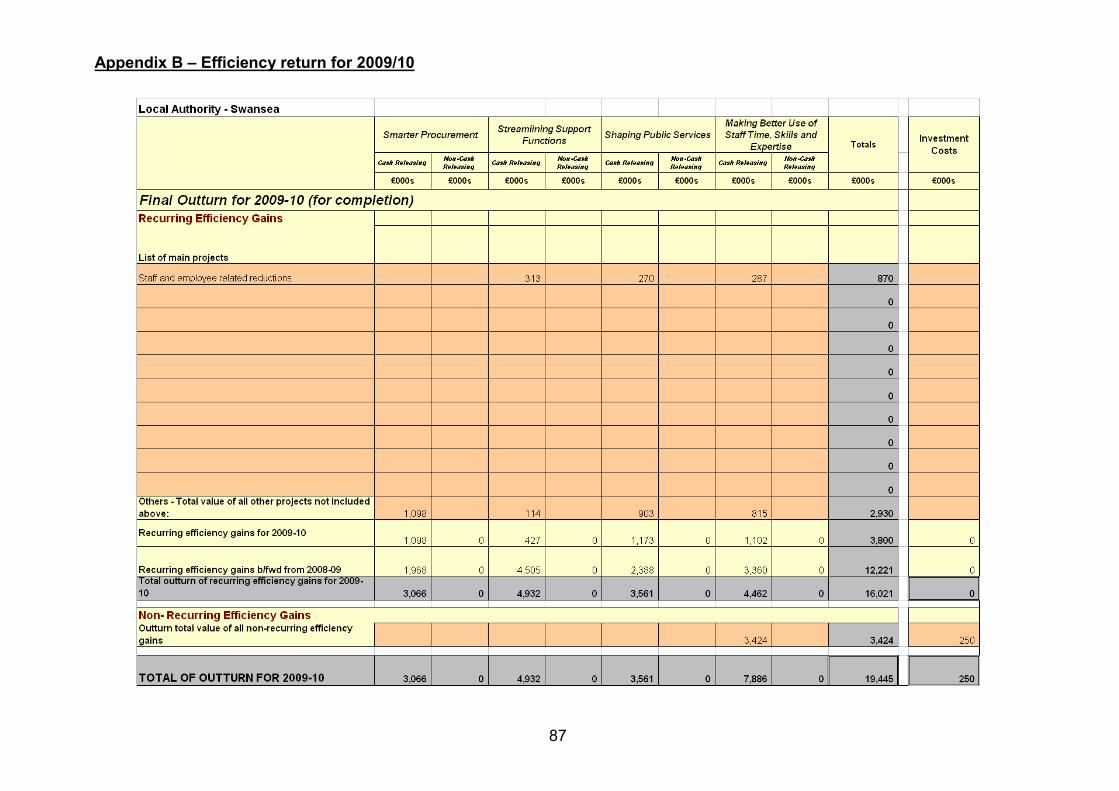
87
Appendix B – Efficiency return for 2009/10