Embed Size (px)
Citation preview
MARINE ECOLOGY PROGRESS SERIESMar Ecol Prog Ser
Vol. 523: 1–14, 2015doi: 10.3354/meps11239
Published March 16
INTRODUCTION
Seamounts have considerable biological value, aspotential stepping stones for dispersal (Hubbs 1959,Wilson & Kaufmann 1987), oases of high faunalabundance and biomass (Rowden et al. 2010b) andhotspots of species richness (Samadi et al. 2006,
© Inter-Research 2015 · www.int-res.com*Corresponding author: [email protected];[email protected]
FEATURE ARTICLE
Megabenthic assemblage structure on threeNew Zealand seamounts: implications for seafloor
massive sulfide mining
R. E. Boschen1,2,*, A. A. Rowden1, M. R. Clark1, S. J. Barton1,3, A. Pallentin1, J. P. A. Gardner2
1National Institute for Water and Atmospheric Research, Private Bag 14901, Kilbirnie, Wellington, New Zealand2School of Biological Sciences, Victoria University of Wellington, PO Box 600, Wellington 6140, New Zealand
3School of Geography, Environment and Earth Sciences, Victoria University of Wellington, PO Box 600,Wellington 6140, New Zealand
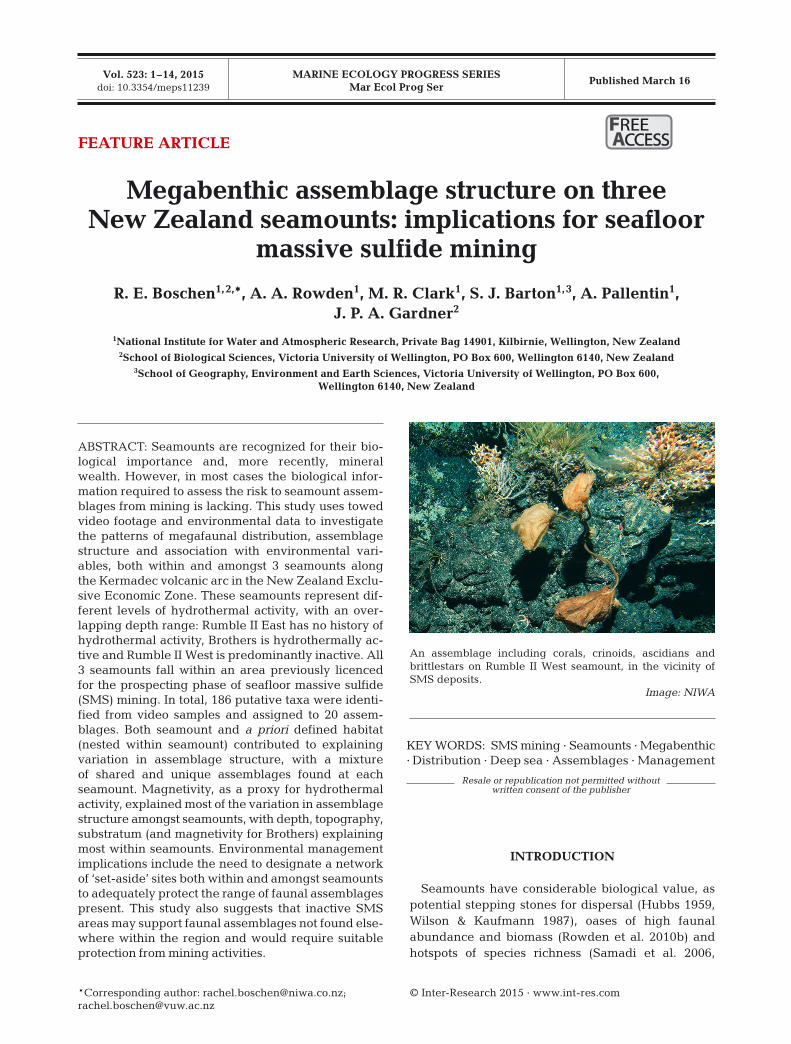
ABSTRACT: Seamounts are recognized for their bio-logical importance and, more recently, mineralwealth. However, in most cases the biological infor-mation required to assess the risk to seamount assem-blages from mining is lacking. This study uses towedvideo footage and environmental data to investigatethe patterns of megafaunal distribution, assemblagestructure and association with environmental vari-ables, both within and amongst 3 seamounts alongthe Kermadec volcanic arc in the New Zealand Exclu-sive Economic Zone. These seamounts represent dif-ferent levels of hydrothermal activity, with an over-lapping depth range: Rumble II East has no history ofhydrothermal activity, Brothers is hydrothermally ac-tive and Rumble II West is predominantly inactive. All3 seamounts fall within an area previously licencedfor the prospecting phase of seafloor massive sulfide(SMS) mining. In total, 186 putative taxa were identi-fied from video samples and assigned to 20 assem-blages. Both seamount and a priori defined habitat(nested within seamount) contributed to explainingvariation in assemblage structure, with a mixtureof shared and unique assemblages found at eachseamount. Magnetivity, as a proxy for hydrothermalactivity, explained most of the variation in assemblagestructure amongst seamounts, with depth, topography,substratum (and magnetivity for Brothers) explainingmost within seamounts. Environmental managementimplications include the need to designate a networkof ‘set-aside’ sites both within and amongst seamountsto adequately protect the range of faunal assemblagespresent. This study also suggests that inactive SMSareas may support faunal assemblages not found else-where within the region and would require suitableprotection from mining activities.
An assemblage including corals, crinoids, ascidians and brittlestars on Rumble II West seamount, in the vicinity ofSMS deposits.
Image: NIWA
KEY WORDS: SMS mining · Seamounts · Megabenthic· Distribution · Deep sea · Assemblages · Management
Resale or republication not permitted without written consent of the publisher
FREEREE ACCESSCCESS
Mar Ecol Prog Ser 523: 1–14, 2015
Morato et al. 2010), although not all seamounts havethese characteristics (see review by Rowden et al.2010a).
Seamount assemblages vary at multiple spatialscales, from habitat patches within a single seamountto variation amongst seamounts in the same or in dif-ferent regions (Clark et al. 2010). For example, atHorizon Guyot, in the central North Pacific, aspectsof the megafauna demonstrated random or patchydistribution at scales of 10 to 1000 m, with strong cor-relation to hard substratum distribution (Kaufmannet al. 1989). The degree of habitat diversity withina seamount can also influence faunal diversity, asfound in the Gulf of Alaska, where the seamountwith the greatest diversity in habitat (topography andrelief) was characterized by the highest relative faunal diversity (Raymore 1982). Seamount habitatsand faunal communities are shaped by a suite of en -vi ronmental variables, including light levels, watercolumn productivity and chemistry, hydrodynamicregime, seamount geomorphology, substratum typeand hydrothermal activity (reviewed by Clark etal. 2010).
Seamounts are vulnerable to anthropogenic pres-sures such as fishing (Clark & Tittensor 2010)and, in the future, seabed mining (Halfar & Fujita2007). Mineral resources at seamounts include co -balt-rich ferromanganese crust (also known as cobalt-rich crust or polymetallic crust) and seafloor massivesulfide (SMS) deposits. Of these 2 deposit types,SMS is expected to be mined at a commercial scalein the western Pacific in the near future (NautilusMinerals Inc.: home page at www.nautilusminerals.com/s/ Home.asp). SMS deposits form through hy -drothermal circulation to create areas of hard sub-stratum rich in sulfides and base metals. There arecurrently 165 deposits known globally (Hanningtonet al. 2011), which occur across a range of hydro -thermal settings, as reviewed by Boschen et al.(2013).
Hydrothermal activity has considerable influenceon benthic assemblages inhabiting seamounts thathost SMS deposits. Hydrothermally active areasare colonised by a chemosynthetic assemblage ofhydrothermal vent specialists (reviewed by VanDover 2000, 2014). Hydrothermal vent fauna aretypified by high biomass and low diversity (Grassle1985) and rapid growth rates (Lutz et al. 1994).Hydrothermally inactive areas are colonised by‘background’ fauna typical of hard substrata onseamounts, such as the sponges, hydroids, corals,anemones, squat lobsters, ophiuroids and holo -thurians inhabiting inactive areas of the Manus
Basin (Galkin 1997). Over a scale of 10s to 100s ofmeters, chemosynthetic and background faunal as -semblages exhibit zonation based on proximity tohydrothermal flow, with chemosynthetic assem-blages existing in close proximity to hydrothermalflow and background assemblages existing at thevent periphery (Arquit 1990, Sudarikov & Galkin1995). It has also been hypothesised that a thirdassemblage may exist at SMS deposit sites, onespecific to the unique chemical environment ofweathering inactive SMS deposits (Van Dover 2007,2011).
In order to assess the vulnerability of seamountbenthic fauna to mining activities, it is important todescribe the structure and evaluate the variabilityof benthic assemblages, both amongst and withinseamounts. There are very few studies that haveinvestigated seamount faunas associated with min-eral deposits. At Cross Seamount, in the HawaiianArchipelago, cobalt-rich crust deposits were char -acterised by low diversity and low abundance of benthic megafauna (Grigg et al. 1987). A later studyalong the Hawaiian seamount chain found differ-ences in benthic assemblage structure between sea -mounts located inside and outside the cobalt-richcrust region, driven by relative species composi -tion and abundance, rather than species richness(Schlacher et al. 2014). The only study characterisingbenthic assemblages at SMS deposits was conductedat a proposed mine and reference site in the ManusBasin, off Papua New Guinea. Here, Collins et al.(2012) found 3 faunal assemblages in active areas,which were distinct from a ‘peripheral assemblage’of Abyssocladia sponges, amphipods, stalked barna-cles, squat lobsters, lepetodrilid limpets and thyasiridclams.
The main objective of the present study was todetermine the broad-scale spatial variability in ben-thic megafaunal structure within and amongstseamounts of commercial interest for their SMSdeposits along the Kermadec volcanic arc, within theNew Zealand Exclusive Economic Zone (EEZ). Thisincluded the objective of investigating the hypothe-sised existence of an assemblage specific to inactiveSMS deposits (Van Dover 2007, 2011). The study alsoaimed to identify the environ mental variables associ-ated with patterns in benthic assemblage structure.Assessing the varia bility in assemblage structurewithin and amongst seamounts, and in particularhow SMS deposits contribute to assemblage struc-ture in the region, will provide information essentialto the envi ronmental management of any future min-ing activities.
2
Boschen et al.: Megabenthos of three New Zealand seamounts
MATERIALS AND METHODS
Study area
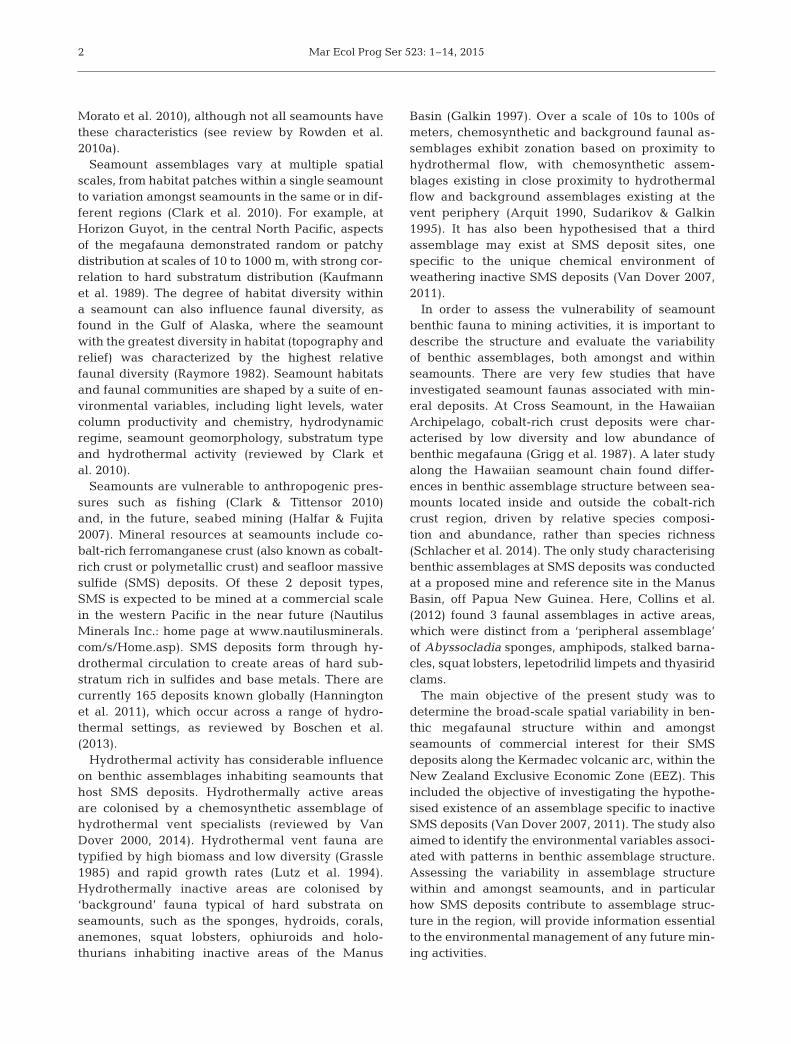
Three seamounts were targeted for survey: Rum-ble II East, Brothers and Rumble II West (Fig. 1).These volcanoes were chosen to span a range ofenvironments: Rumble II East is hydrothermallyinactive with no SMS deposits, Brothers has largehydrothermally active areas where SMS depositsare forming and Rumble II West is predominantlyhydrothermally inactive with inactive SMS de posits.These seamounts are ideal for a comparative studybecause they lie within 0.5° of latitude and haveoverlapping depth ranges (Rumble II East: 907 to3017 m [Wright 1994]; Brothers: 1350 to 2250 m[Wright & Gamble 1999]; Rumble II West: 1194 to2994 m [Wright 1994]). Both Brothers and Rumble IIWest have SMS deposits of potential interest to min-ing companies, with prospecting permits for bothseamounts having been issued to Neptune Mineralsin 2002 (Fig. 1; https:// www. nzpam. govt.nz/cms/banner_ template/ CMINPSCURR).
Image data collection and analysis
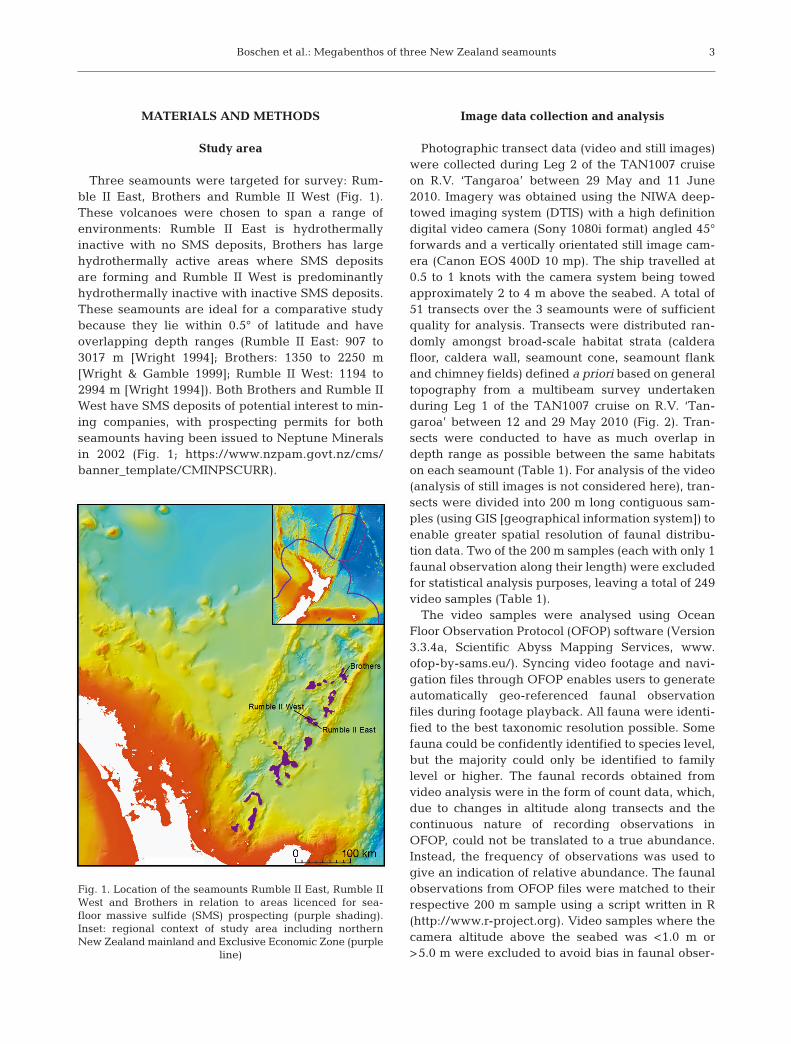
Photographic transect data (video and still images)were collected during Leg 2 of the TAN1007 cruiseon R.V. ‘Tangaroa’ between 29 May and 11 June2010. Imagery was obtained using the NIWA deep-towed imaging system (DTIS) with a high definitiondigital video camera (Sony 1080i format) angled 45°forwards and a vertically orientated still image cam-era (Canon EOS 400D 10 mp). The ship travelled at0.5 to 1 knots with the camera system being towedapproximately 2 to 4 m above the seabed. A total of51 transects over the 3 seamounts were of sufficientquality for analysis. Transects were distributed ran-domly amongst broad-scale habitat strata (calderafloor, caldera wall, seamount cone, seamount flankand chimney fields) defined a priori based on generaltopography from a multibeam survey undertakenduring Leg 1 of the TAN1007 cruise on R.V. ‘Tan-garoa’ between 12 and 29 May 2010 (Fig. 2). Tran-sects were conducted to have as much overlap indepth range as possible between the same habitatson each seamount (Table 1). For analysis of the video(analysis of still images is not considered here), tran-sects were divided into 200 m long contiguous sam-ples (using GIS [geographical information system]) toenable greater spatial resolution of faunal distribu-tion data. Two of the 200 m samples (each with only 1faunal observation along their length) were excludedfor statistical analysis purposes, leaving a total of 249video samples (Table 1).
The video samples were analysed using OceanFloor Observation Protocol (OFOP) software (Version3.3.4a, Scientific Abyss Mapping Services, www.ofop-by-sams.eu/). Syncing video footage and navi-gation files through OFOP enables users to generateautomatically geo-referenced faunal observationfiles during footage playback. All fauna were identi-fied to the best taxonomic resolution possible. Somefauna could be confidently identified to species level,but the majority could only be identified to familylevel or higher. The faunal records obtained fromvideo analysis were in the form of count data, which,due to changes in altitude along transects and thecontinuous nature of recording observations inOFOP, could not be translated to a true abundance.Instead, the frequency of observations was used togive an indication of relative abundance. The faunalobservations from OFOP files were matched to theirrespective 200 m sample using a script written in R(http://www.r-project.org). Video samples where thecamera altitude above the seabed was <1.0 m or>5.0 m were excluded to avoid bias in faunal obser-
3
Fig. 1. Location of the seamounts Rumble II East, Rumble IIWest and Brothers in relation to areas licenced for sea -floor massive sulfide (SMS) prospecting (purple shading).Inset: regional context of study area including northernNew Zealand mainland and Exclusive Economic Zone (purple
line)
Mar Ecol Prog Ser 523: 1–14, 2015
vations resulting from camera altitude and conse-quent changes in image quality. The altimeter mal-functioned during 1 transect (Stn 33), so altimetrydata were obtained by regression using the distancebetween the laser scaling dots on 101 still imagesfrom stations where altimetry was known. Thisregression was then applied to 128 images from Stn33, to match the faunal observations in OFOP to theirnearest altitude measurement as calculated from theimages. Matched resemblance matrix tests (RELATE)in PRIMER 6 (Clarke & Gorley 2006) were used toassess whether the altitude within the range chosenfor analysis and the percentage of excluded observa-tions had an influence on the faunal distribution pat-terns observed. These pre-analysis tests revealedthat neither altitude nor percentage of excludedobservations had an influence that would likely con-found the main analysis (i.e. the Rho values werevery small; altitude = 0.087, number of excludedobservations = 0.002).
Environmental data
Substratum type was described and identified fromthe video using OFOP. Substratum was described ina hierarchical fashion to include information on mor-phology/particle size class and potential chemicalstaining (Table 2). Substratum was quantified throughsemi-continuous recording, with observations beingmade every few seconds.
Position information was obtained from the DTISnavigation file. Additional environmental data—depth, backscatter (acoustic reflectivity), rugosity,aspect, slope and 3 measures of curvature (curvature,plan curvature, profile curvature: used to describethe relative position of terrain features)—were ex -tracted from multibeam data, collected using anEM300 multibeam echo-sounder (IMHO) and pro-cessed using C&C Technologies HydroMap. Cleaneddata were gridded to a resolution of 25 m cell sizeand exported to ESRI grid formats for use in ArcGIS.Backscatter data derived from multibeam were pro-cessed using SonarScope (Augustin & Lurton 2005).Processing consisted of statistical compensation ofthe signal as a function of its incidence angle on theseafloor, to attenuate the strong signal from specularreflection at the nadir and the rapid decrease ofthe signal strength with increasing incidence angle(Hughes Clarke et al. 1997, Le Chenadec et al. 2007,Fonseca et al. 2009). Magnetivity data were collectedat 500 m resolution over all 3 seamounts duringTAN1007 using a Sea Spy Magnetics overhauser
4
Fig. 2. Distribution of towed-camera transects across the 5 apriori defined habitat strata (caldera: caldera floor; chimney:chimney fields; cone: seamount cone; flank: seamount flank;wall: caldera wall) at the 3 study seamounts (Rumble II East,
Brothers and Rumble II West)
Boschen et al.: Megabenthos of three New Zealand seamounts
magnetometer, with data acquisition at 1 Hz usingMarine Magnetics Sealink software. Magnetivitydata were also obtained at 25 m resolution for Broth-ers Seamount (see Caratori Tontini et al. 2012a,b).The mean and standard deviation for each of the
multibeam-derived variables and mag-netivity at both spatial scales were cal-culated for each 200 m video sample.This was achieved by splitting the200 m DTIS line segments into pointswith 1 m spacing along the track, andadding the grid cell value of all relevantlayers as an attribute to the point layer.Mean and standard deviation for eachrelevant attribute value were then cal-culated for all points of 1 segment, generating a list of line segments andthe mean and standard deviation for theunderlying grid cell values. Means andstandard deviations were calculated atdifferent grid sizes (25 m and focalmeans of 3, 5, 7 and 15) to enable envi-ronmental influences on assemblagestructure to be investigated at the most
appropriate spatial scale. Focal means consisted of3 × 3, 5 × 5, 7 × 7 and 15 × 15 grid cells of the original25 m grids.
Data analysis
The faunal distribution data from the video sam-ples were analysed using multivariate routines in thestatistical software package PRIMER 6 (Clarke &Gorley 2006) with PERMANOVA+ (Anderson et al.2008). Prior to analysis, count data were transformed.After trialling a range of transforms, square roottransformation was used, as it down-weighted theeffect of abundant fauna sufficiently for the signalfrom rarer taxa to be observed, whilst still enablingthe relative differences in abundance of taxa to in -fluence the patterns in assemblage structure. A Bray-Curtis resemblance matrix was created from thetransformed data. Hierarchical cluster analysis (CLUS-TER) was performed on the resemblance matrix witha SIMPROF test (at p = 0.05) to determine samplegroup structure in the faunal data, i.e. identify‘assemblages’. Multidimensional scaling (MDS) plotswere produced to visualise patterns in the groupingof samples associated with seamount, habitat andSIMPROF assemblage group. Similarity percentages—species contributions (SIMPER) was performed onthe transformed data to identify the taxa characteris-ing each SIMPROF assemblage group (with a 50%cumulative cut off).
The spatial variability in the assemblage structure,both amongst and within seamounts, was describedusing permutational multivariate analysis of variance
5
Seamount Habitat Transects No. of 200 m Depth range substratum samples (m)
Rumble II East Cone 8 59 940−2110Caldera 4 17 1020−1400
Brothers Cone 5 22 1200−1730Flank 5 30 1350−1960Caldera 2 11 960−1880Wall 4 22 1390−1700Chimney 3 11 1530−1910
Rumble II West Cone 4 14 1160−1450Flank 4 16 1250−1710Caldera 4 18 1340−1450Wall 3 6 1190−1460Chimney 5 23 1180−1470
Total 51 249 940−2110
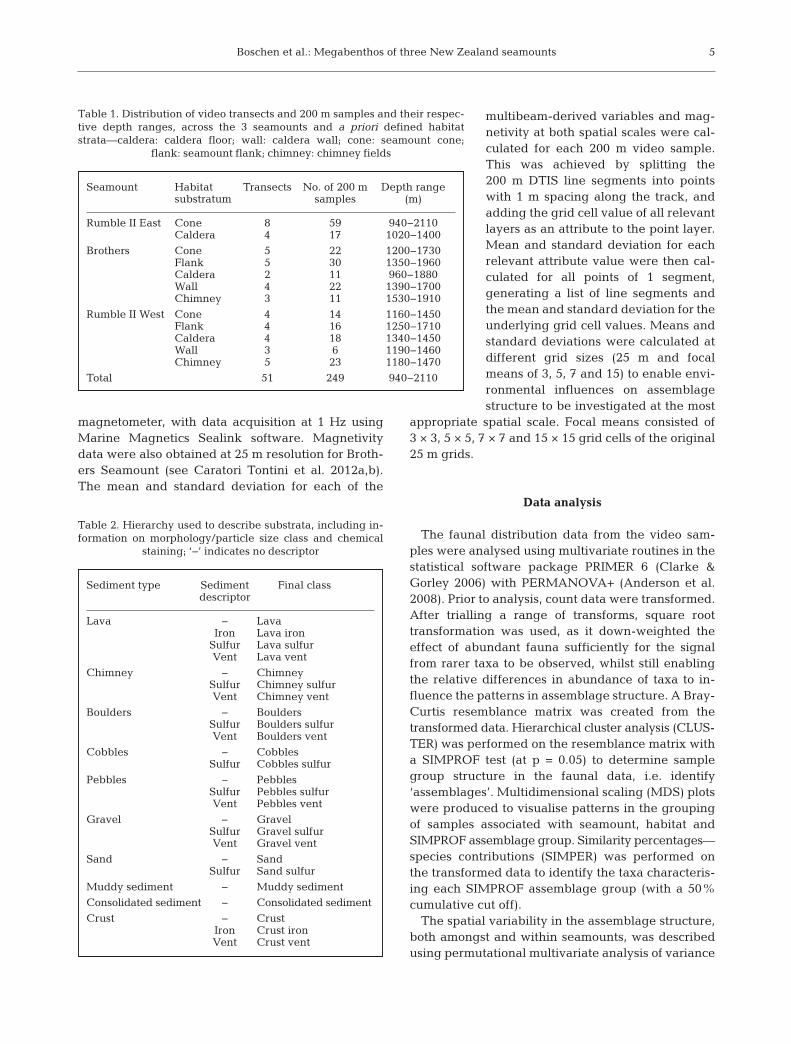
Table 1. Distribution of video transects and 200 m samples and their respec-tive depth ranges, across the 3 seamounts and a priori defined habitatstrata—caldera: caldera floor; wall: caldera wall; cone: seamount cone;
flank: seamount flank; chimney: chimney fields
Sediment type Sediment Final classdescriptor
Lava − LavaIron Lava iron
Sulfur Lava sulfurVent Lava vent
Chimney − ChimneySulfur Chimney sulfurVent Chimney vent
Boulders − BouldersSulfur Boulders sulfurVent Boulders vent
Cobbles − CobblesSulfur Cobbles sulfur
Pebbles − PebblesSulfur Pebbles sulfurVent Pebbles vent
Gravel − GravelSulfur Gravel sulfurVent Gravel vent
Sand − SandSulfur Sand sulfur
Muddy sediment − Muddy sediment
Consolidated sediment − Consolidated sediment
Crust − CrustIron Crust ironVent Crust vent
Table 2. Hierarchy used to describe substrata, including in-formation on morphology/particle size class and chemical
staining; ‘−’ indicates no descriptor
Mar Ecol Prog Ser 523: 1–14, 2015
(PERMANOVA). Prior to PERMANOVA, the poten-tial effect of multivariate dispersion was assessedusing a distance-based test for homogeneity of multi-variate dispersions (PERMDISP), with 999 permuta-tions. Deviations from centroid was chosen as themethod giving the best overall results in terms ofType I error and power (Anderson 2006). PERMDISPanalyses suggested there was significant dispersionfor both seamount (F = 6.9058, df1 = 2, df2 = 246,p[perm] = 0.001) and habitat (F = 6.9012, df1 = 4,df2 = 244, p[perm] = 0.001), but, as this dispersion oc -curred equally amongst different levels of the factors,it was not expected to affect the PERMANOVA results.
The effects of seamount and habitat nested withinseamount were assessed using PERMANOVA, withType III (partial) sums of squares, permutations ofresiduals under a mixed model and 999 permuta-tions. Type III (partial) sums of squares was chosen asthe most conservative model in which the order thatterms are fitted is not important (Anderson et al.2008). Permutation of residuals under a mixed modelwas selected as having the best power and being themost accurate regarding Type I error (Anderson &Legendre 1999, Anderson & ter Braak 2003).
The effect of environmental parameters on assem-blage structure was assessed both amongst and withinseamounts using distance-based linear models (DIS-TLM). Prior to DISTLM, draftsman plots and correla-tion matrices were produced to assess the distribu-tion of each variable and to identify co-correlatingvariables. Where pairs of variables had a Pearson’scorrelation coefficient of 0.9 or larger, 1 of the co- correlating variables was excluded from the analysis.If variables demonstrated skew within the draftsmanplots, they were square root transformed to nor-malise their distribution. Initially, DISTLM was runwith topographic variables at different grid sizes(25 m and focal means of 3, 5, 7 and 15) to assesswhich spatial scale best explained the assemblagestructuring observed. A focal mean of 15 (covering anarea of 0.14 km2) had the highest R2 value for boththe grouped variable and ungrouped variable mod-els and was chosen for all further analysis.
For the amongst-seamount analysis, the environ-mental variables were grouped according to datatype: depth, topography (rugosity, curvature, plancurvature, profile curvature, slope), magnetivity,substratum (backscatter and all substratum typeswithout obvious hydrothermal signatures), substra-tum hydrothermal (substratum with observed vent-ing, sulphur or iron staining), habitat heterogeneity(the standard deviation of environmental variables)and 2-dimensional space (latitude and longitude).
Space was ultimately excluded from the analysis toavoid autocorrelation issues. DISTLM was performedby grouping variables by indicator as describedabove, with selection based on the Akaike informa-tion criterion (AIC), step-wise selection procedureand 999 permutations. AIC selection was chosen asthe method to create the most parsimonious model,as it adds a ‘penalty’ for increases in the number ofpredictor variables (Anderson et al. 2008). Step-wiseselection was chosen as it allows for both the additionand removal of a term to the model at each step(Anderson et al. 2008).
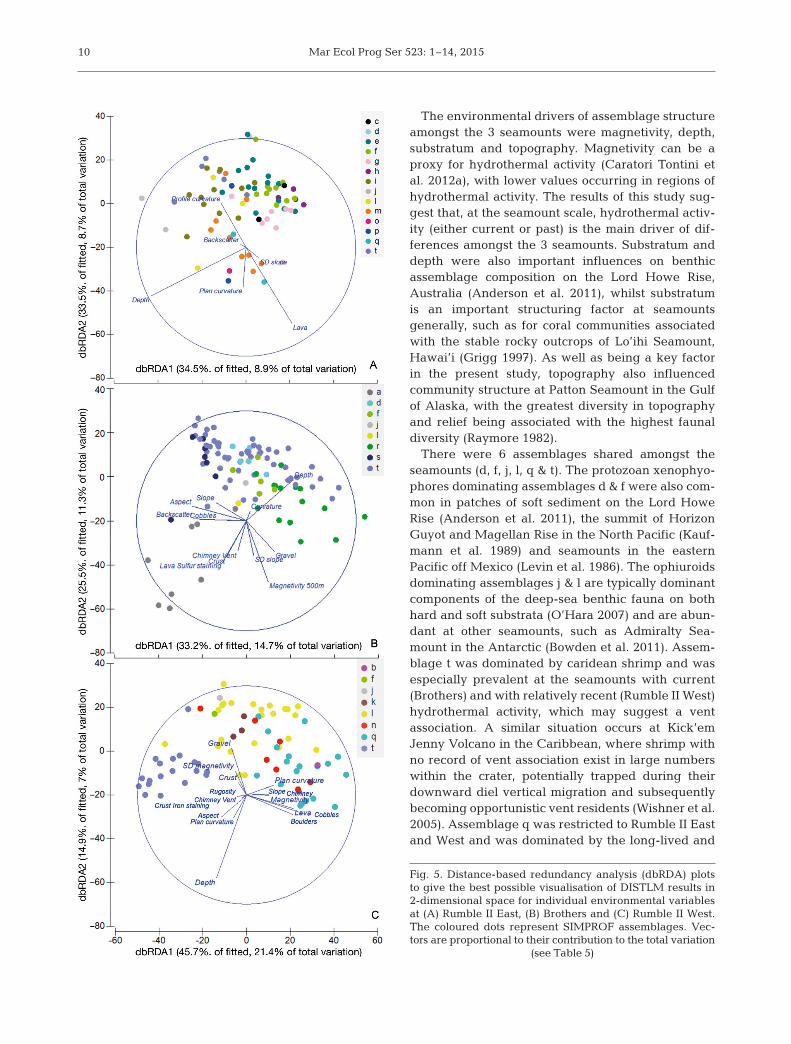
For the within-seamount analysis, DISTLM wasfirst performed using the grouping of variablesabove, and then with the environmental variablesungrouped to investigate which individual variableswere driving the observed patterns of environmentalassociation with assemblage structure. For both ofthe above, DISTLM was performed using the sameparameters as for the amongst-seamount analysis.Distance-based redundancy analysis (dbRDA) plotswere used to provide the best possible 2-dimensionalvisualisation of DISTLM results for individual envi-ronmental variables at each of the 3 seamounts, withsamples grouped by their SIMPROF assemblage andvectors proportional to their contribution to the totalvariation.
Assemblages identified by SIMPROF were mapped,using ArcMap 10, over digital terrain models gener-ated from multibeam data.
RESULTS
Assemblage structure
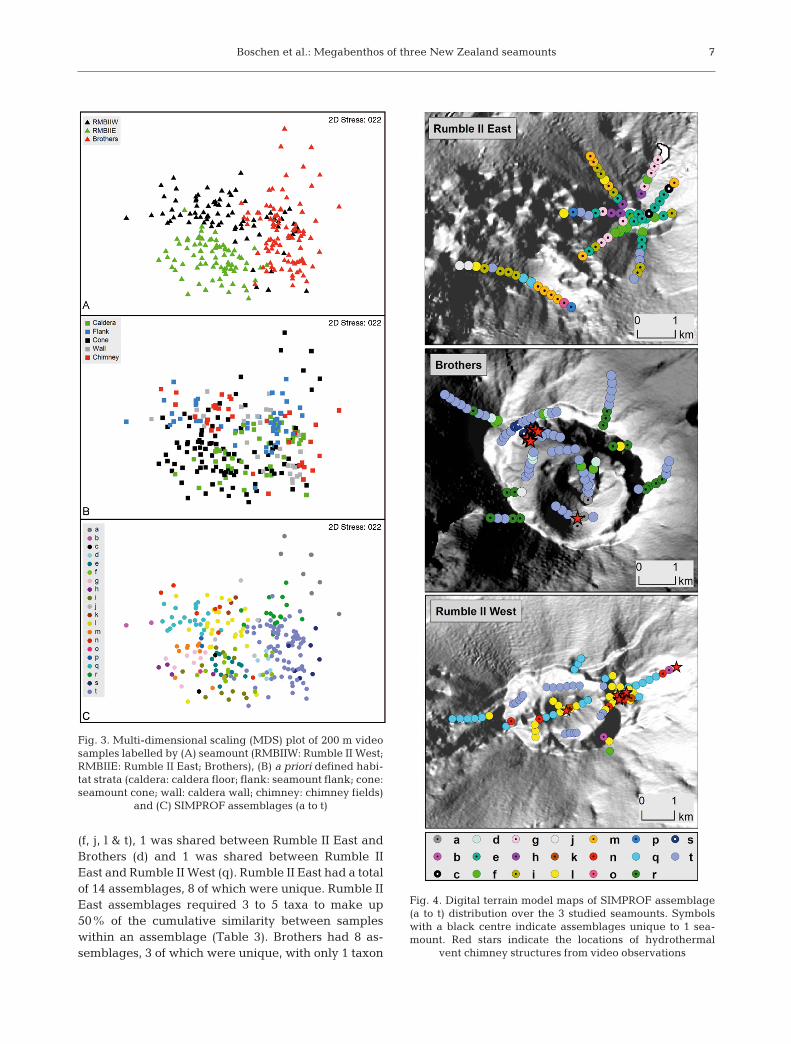
In total, 186 putative taxa were identified from 249video samples across the 3 seamounts. Cluster analy-sis indicated that the faunal records from the 200 msamples grouped both by seamount and by habitatwithin a seamount, which was visualised by MDS(Fig. 3A,B). PERMANOVA results indicated a signif-icant influence of seamount (df = 2, SS = 1.30E5,MS = 65 055, Pseudo-F = 27.2, p[perm] = 0.001) andhabitat nested within seamount (df = 9, SS = 1.08E5,MS = 12 036, Pseudo-F = 5.03, p[perm] = 0.001) onfaunal distribution.
SIMPROF analysis identified 20 assemblages acrossthe 3 seamounts, which were visualised by MDS(Fig. 3C). Six of these assemblages (d, f, j, l, q & t) wereshared amongst seamounts, whilst 14 assemblageswere unique to individual seamounts (Fig. 4). Of theshared assemblages, 4 were found at all seamounts
6
Boschen et al.: Megabenthos of three New Zealand seamounts
(f, j, l & t), 1 was shared between Rumble II East andBrothers (d) and 1 was shared between Rumble IIEast and Rumble II West (q). Rumble II East had a totalof 14 assemblages, 8 of which were unique. Rumble IIEast assemblages required 3 to 5 taxa to make up50% of the cumulative similarity between sampleswithin an assemblage (Table 3). Brothers had 8 as-semblages, 3 of which were unique, with only 1 taxon
7
Fig. 3. Multi-dimensional scaling (MDS) plot of 200 m videosamples labelled by (A) seamount (RMBIIW: Rumble II West;RMBIIE: Rumble II East; Brothers), (B) a priori defined habi-tat strata (caldera: caldera floor; flank: seamount flank; cone:seamount cone; wall: caldera wall; chimney: chimney fields)
and (C) SIMPROF assemblages (a to t)
Fig. 4. Digital terrain model maps of SIMPROF assemblage(a to t) distribution over the 3 studied seamounts. Symbolswith a black centre indicate assemblages unique to 1 sea -mount. Red stars indicate the locations of hydrothermal
vent chimney structures from video observations
Mar Ecol Prog Ser 523: 1–14, 2015
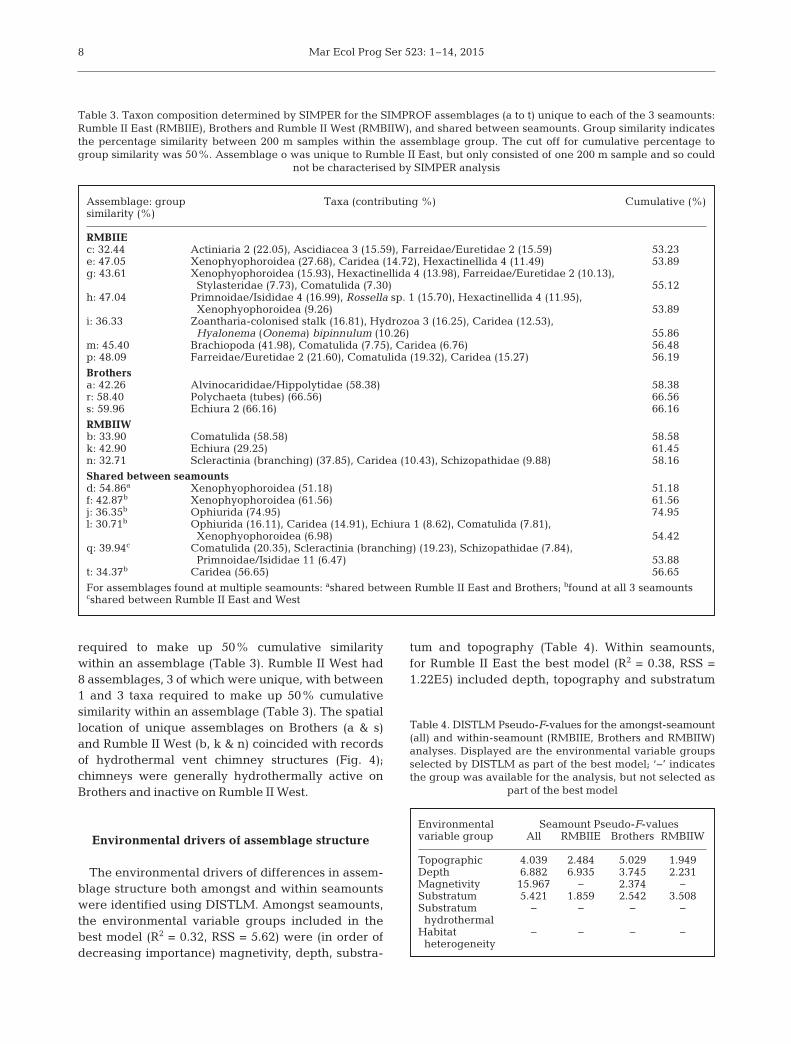
required to make up 50% cumulative similaritywithin an assemblage (Table 3). Rumble II West had8 assemblages, 3 of which were unique, with between1 and 3 taxa required to make up 50% cumulativesimilarity within an assemblage (Table 3). The spatiallocation of unique assemblages on Brothers (a & s)and Rumble II West (b, k & n) coincided with recordsof hydrothermal vent chimney structures (Fig. 4);chimneys were generally hydrothermally active onBrothers and inactive on Rumble II West.
Environmental drivers of assemblage structure
The environmental drivers of differences in assem-blage structure both amongst and within seamountswere identified using DISTLM. Amongst seamounts,the environmental variable groups included in thebest model (R2 = 0.32, RSS = 5.62) were (in order ofdecreasing importance) magnetivity, depth, substra-
tum and topography (Table 4). Within seamounts,for Rumble II East the best model (R2 = 0.38, RSS =1.22E5) included depth, topography and substratum
8
Assemblage: group Taxa (contributing %) Cumulative (%)similarity (%)
RMBIIEc: 32.44 Actiniaria 2 (22.05), Ascidiacea 3 (15.59), Farreidae/Euretidae 2 (15.59) 53.23e: 47.05 Xenophyophoroidea (27.68), Caridea (14.72), Hexactinellida 4 (11.49) 53.89g: 43.61 Xenophyophoroidea (15.93), Hexactinellida 4 (13.98), Farreidae/Euretidae 2 (10.13),
Stylasteridae (7.73), Comatulida (7.30) 55.12h: 47.04 Primnoidae/Isididae 4 (16.99), Rossella sp. 1 (15.70), Hexactinellida 4 (11.95),
Xenophyophoroidea (9.26) 53.89i: 36.33 Zoantharia-colonised stalk (16.81), Hydrozoa 3 (16.25), Caridea (12.53),
Hyalonema (Oonema) bipinnulum (10.26) 55.86m: 45.40 Brachiopoda (41.98), Comatulida (7.75), Caridea (6.76) 56.48p: 48.09 Farreidae/Euretidae 2 (21.60), Comatulida (19.32), Caridea (15.27) 56.19
Brothersa: 42.26 Alvinocarididae/Hippolytidae (58.38) 58.38r: 58.40 Polychaeta (tubes) (66.56) 66.56s: 59.96 Echiura 2 (66.16) 66.16
RMBIIWb: 33.90 Comatulida (58.58) 58.58k: 42.90 Echiura (29.25) 61.45n: 32.71 Scleractinia (branching) (37.85), Caridea (10.43), Schizopathidae (9.88) 58.16
Shared between seamountsd: 54.86a Xenophyophoroidea (51.18) 51.18f: 42.87b Xenophyophoroidea (61.56) 61.56j: 36.35b Ophiurida (74.95) 74.95l: 30.71b Ophiurida (16.11), Caridea (14.91), Echiura 1 (8.62), Comatulida (7.81),
Xenophyophoroidea (6.98) 54.42q: 39.94c Comatulida (20.35), Scleractinia (branching) (19.23), Schizopathidae (7.84),
Primnoidae/Isididae 11 (6.47) 53.88t: 34.37b Caridea (56.65) 56.65
For assemblages found at multiple seamounts: ashared between Rumble II East and Brothers; bfound at all 3 seamountscshared between Rumble II East and West
Table 3. Taxon composition determined by SIMPER for the SIMPROF assemblages (a to t) unique to each of the 3 seamounts:Rumble II East (RMBIIE), Brothers and Rumble II West (RMBIIW), and shared between seamounts. Group similarity indicatesthe percentage similarity between 200 m samples within the assemblage group. The cut off for cumulative percentage togroup similarity was 50%. Assemblage o was unique to Rumble II East, but only consisted of one 200 m sample and so could
not be characterised by SIMPER analysis
Environmental Seamount Pseudo-F-valuesvariable group All RMBIIE Brothers RMBIIW
Topographic 4.039 2.484 5.029 1.949Depth 6.882 6.935 3.745 2.231Magnetivity 15.967 − 2.374 −Substratum 5.421 1.859 2.542 3.508Substratum − − − −hydrothermal
Habitat − − − −heterogeneity
Table 4. DISTLM Pseudo-F-values for the amongst-seamount(all) and within-seamount (RMBIIE, Brothers and RMBIIW)analyses. Displayed are the environmental variable groupsselected by DISTLM as part of the best model; ‘−’ indicatesthe group was available for the analysis, but not selected as
part of the best model
Boschen et al.: Megabenthos of three New Zealand seamounts
(Table 4). The best DISTLM model for Brothers (R2 =0.47, RSS = 1.33E5) included topography, depth, sub-stratum and magnetivity (Table 4). At Rumble IIWest, the best model (R2 = 0.43, RSS = 1.30E5)selected substratum, depth and topography (Table 4).Substratum hydrothermal and habitat heterogeneitywere not included in the best model for any of theanalyses.
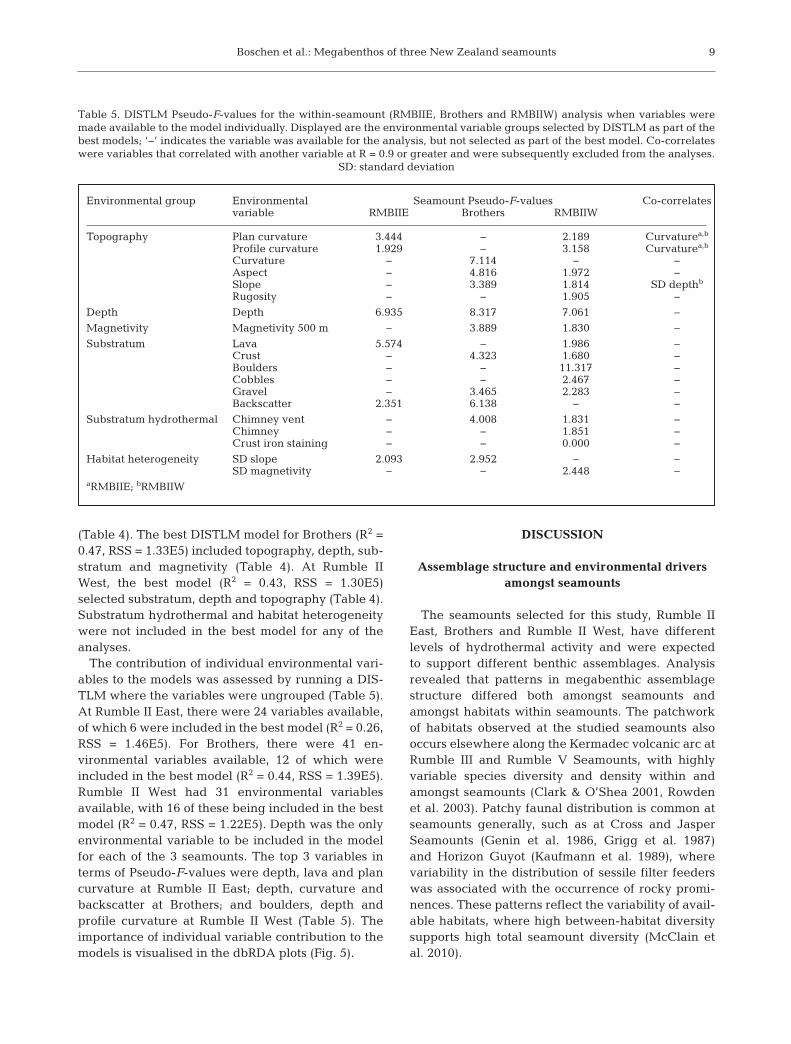
The contribution of individual environmental vari-ables to the models was assessed by running a DIS-TLM where the variables were ungrouped (Table 5).At Rumble II East, there were 24 variables available,of which 6 were included in the best model (R2 = 0.26,RSS = 1.46E5). For Brothers, there were 41 en -vironmental variables available, 12 of which wereincluded in the best model (R2 = 0.44, RSS = 1.39E5).Rumble II West had 31 environmental variablesavailable, with 16 of these being included in the bestmodel (R2 = 0.47, RSS = 1.22E5). Depth was the onlyenvironmental variable to be included in the modelfor each of the 3 seamounts. The top 3 variables interms of Pseudo-F-values were depth, lava and plancurvature at Rumble II East; depth, curvature andbackscatter at Brothers; and boulders, depth and profile curvature at Rumble II West (Table 5). Theimportance of individual variable contribution to themodels is visualised in the dbRDA plots (Fig. 5).
DISCUSSION
Assemblage structure and environmental driversamongst seamounts
The seamounts selected for this study, Rumble IIEast, Brothers and Rumble II West, have differentlevels of hydrothermal activity and were expectedto support different benthic assemblages. Analysisrevealed that patterns in megabenthic assemblagestructure differed both amongst seamounts andamongst habitats within seamounts. The patchworkof habitats observed at the studied seamounts alsooccurs elsewhere along the Kermadec volcanic arc atRumble III and Rumble V Seamounts, with highlyvariable species diversity and density within andamongst seamounts (Clark & O’Shea 2001, Rowdenet al. 2003). Patchy faunal distribution is common atseamounts generally, such as at Cross and JasperSeamounts (Genin et al. 1986, Grigg et al. 1987)and Horizon Guyot (Kaufmann et al. 1989), wherevariability in the distribution of sessile filter feederswas associated with the occurrence of rocky promi-nences. These patterns reflect the variability of avail-able habitats, where high between-habitat diversitysupports high total seamount diversity (McClain etal. 2010).
9
Environmental group Environmental Seamount Pseudo-F-values Co-correlates variable RMBIIE Brothers RMBIIW
Topography Plan curvature 3.444 − 2.189 Curvaturea,b
Profile curvature 1.929 − 3.158 Curvaturea,b
Curvature − 7.114 − −Aspect − 4.816 1.972 −Slope − 3.389 1.814 SD depthb
Rugosity − − 1.905 −
Depth Depth 6.935 8.317 7.061 −
Magnetivity Magnetivity 500 m − 3.889 1.830 −
Substratum Lava 5.574 − 1.986 −Crust − 4.323 1.680 −Boulders − − 11.317 −Cobbles − − 2.467 −Gravel − 3.465 2.283 −Backscatter 2.351 6.138 − −
Substratum hydrothermal Chimney vent − 4.008 1.831 −Chimney − − 1.851 −Crust iron staining − − 0.000 −
Habitat heterogeneity SD slope 2.093 2.952 − −SD magnetivity − − 2.448 −
aRMBIIE; bRMBIIW
Table 5. DISTLM Pseudo-F-values for the within-seamount (RMBIIE, Brothers and RMBIIW) analysis when variables weremade available to the model individually. Displayed are the environmental variable groups selected by DISTLM as part of thebest models; ‘−’ indicates the variable was available for the analysis, but not selected as part of the best model. Co-correlateswere variables that correlated with another variable at R = 0.9 or greater and were subsequently excluded from the analyses.
SD: standard deviation
Mar Ecol Prog Ser 523: 1–14, 2015
The environmental drivers of assemblage structureamongst the 3 seamounts were magnetivity, depth,substratum and topography. Magnetivity can be aproxy for hydrothermal activity (Caratori Tontini etal. 2012a), with lower values occurring in regions ofhydrothermal activity. The results of this study sug-gest that, at the seamount scale, hydrothermal activ-ity (either current or past) is the main driver of dif -ferences amongst the 3 seamounts. Substratum anddepth were also important influences on benthicassemblage composition on the Lord Howe Rise,Aus tralia (Anderson et al. 2011), whilst substratumis an important structuring factor at seamounts generally, such as for coral communities associatedwith the stable rocky outcrops of Lo’ihi Seamount,Hawai’i (Grigg 1997). As well as being a key factorin the present study, topography also influencedcommunity structure at Patton Seamount in the Gulfof Alaska, with the greatest diversity in topographyand relief being associated with the highest faunaldiversity (Raymore 1982).
There were 6 assemblages shared amongst theseamounts (d, f, j, l, q & t). The protozoan xenophyo -phores dominating assemblages d & f were also com-mon in patches of soft sediment on the Lord HoweRise (Anderson et al. 2011), the summit of HorizonGuyot and Magellan Rise in the North Pacific (Kauf-mann et al. 1989) and seamounts in the easternPacific off Mexico (Levin et al. 1986). The ophiuroidsdominating assemblages j & l are typically dominantcomponents of the deep-sea benthic fauna on bothhard and soft substrata (O’Hara 2007) and are abun-dant at other seamounts, such as Admiralty Sea -mount in the Antarctic (Bowden et al. 2011). Assem-blage t was dominated by caridean shrimp and wasespecially prevalent at the seamounts with current(Brothers) and with relatively recent (Rumble II West)hydrothermal activity, which may suggest a ventassociation. A similar situation occurs at Kick’emJenny Volcano in the Caribbean, where shrimp withno record of vent association exist in large numberswithin the crater, potentially trapped during theirdownward diel vertical migration and subsequentlybecoming opportunistic vent residents (Wishner et al.2005). Assemblage q was restricted to Rumble II Eastand West and was dominated by the long-lived and
10
Fig. 5. Distance-based redundancy analysis (dbRDA) plotsto give the best possible visualisation of DISTLM results in2-dimensional space for individual environmental variablesat (A) Rumble II East, (B) Brothers and (C) Rumble II West.The coloured dots represent SIMPROF assemblages. Vec-tors are proportional to their contribution to the total variation
(see Table 5)
Boschen et al.: Megabenthos of three New Zealand seamounts
slow-growing filter feeders typically associated withseamount hard substratum: comatulid crinoids,branching stony coral, schizopathid corals and prim-noid/isidid corals. Assemblage q was not found onhydrothermally active Brothers, consistent with thefindings of Clark & O’Shea (2001), who noted similarcommunities were almost entirely ab sent from thehydrothermally active Rumble III and Rumble VSeamounts. The absence of sessile, filter-feedingorganisms was also noted at the volcanically andhydrothermally active peak of Northwest Rota-1 Vol-cano in the Mariana Arc (Limen et al. 2006) and hasbeen attributed to environmental disturbance andthe potentially ‘hostile’ geochemical conditions ofhydrothermal activity (Grigg 1997).
Unique assemblage structure and the environmentwithin seamounts
The unique assemblages at Rumble II East (c, e, g,h, i, m & p) were generally characterised by filterfeeders, typical of communities associated with hardsubstratum on seamounts, such as ascideans, hexa-ctinellid and stalked sponges, comatulid crinoids,brachiopods, stylasterids, primnoid/isidid corals andanemones. The occurrence of xenophyophores, withtheir preference for soft sediment, however, also sug-gests a degree of habitat patchiness within some ofthe samples. The abundance of sessile, filter-feedingorganisms at Rumble II East can be partially ex -plained by the distribution of lava and plan curva-ture, which were in the model and in combinationdefine the occurrence of continuous hard substratum(lava) as well as ridges and valleys to funnel the currents (plan curvature: Wilson et al. 2007).
The unique assemblages at Brothers (a, r & s) hadlower diversity, with each assemblage dominated bya single taxon: alvinocarid/hippolytid vent shrimp,tubed polychaete worms and echiuran worms, re -spectively. The vent shrimp and echiuran wormassemblages occur within areas of hydrothermalactivity, with their low diversity being typical ofhydrothermal vent communities (Grassle 1985). Thealvinocarid/hippolytid shrimp at Brothers are pre-sumed to be reliant on chemosyntheitc vent bacteria(Ahyong 2009), in a fashion similar to the closelyrelated vent shrimp Rimicaris exoculata (Van Doveret al. 1988, Wirsen et al. 1993, Pond et al. 1997).Within the Southwest Pacific, alvinocarid shrimp alsodominate hydrothermal communities on the activepeak of Northwest Rota-1 Volcano (Limen et al.2006), whilst Lebbeus hippolytid shrimp are exclu-
sive to hydrothermally active sites, such as within theManus and Lau Basins and the Okinawa Trough(Komai et al. 2012). The echiuran worms of assem-blage s are not considered to be vent endemic. How-ever, large populations may have established them-selves in vent sediments in response to high levelsof organic matter and hydrogen sulfide, as echiuranworms have been observed to dominate organicallyenriched intertidal areas (Stull et al. 1986). The dominance of polychaete and echiuran worms can bepartially explained by curvature and backscatter inthe model. Curvature is important for describing therelative position of terrain features and inferring cur-rent flow (Wilson et al. 2007), whilst backscatter isaffected by the substratum characteristics of theseabed. In combination, curvature and backscatterrepresent the current flow and nature of the seabedand will influence the feeding ability of tube-dwelling polychaetes and echiurans (filter feedersand surface deposit feeders, respectively).
The unique assemblages at Rumble II West (b, k& n) exhibited relatively low diversity and high dominance, similar to the unique assemblages foundat Brothers. Whilst assemblage n had higher diversity(branching stony corals, caridean shrimp and schizo -pathid corals), k and b were each dominated by1 taxon: echiuran worms and comatulid crinoids,respectively. Although Rumble II West is generallyconsidered hydrothermally inactive, previous hydro -thermal activity may have enriched the sedimentsenabling large populations of echiuran worms tobecome established, as observed at Brothers. A highabundance of crinoids at Rumble II West has alsobeen observed on the hard substrate of other sea -mounts, such as Davidson and Pioneer off California(Lundsten et al. 2009) and Admiralty Seamount(Bowden et al. 2011). The abundance of crinoids andcorals in certain unique Rumble II West assemblagescan be partially explained by the factors of bouldersand profile curvature in the model. Taken in combi-nation, boulders and profile curvature identify suit-able elevated hard substratum, with higher currentflow suitable for filter feeders. The occurrence ofunique assemblages on Rumble II West coincidedwith video observations of hydrothermally inactivechimney structures, indicative of SMS areas. Thesechimneys provide elevated hard substratum andwould be suitable habitat for filter feeders, as ob -served in the Manus Basin, where inactive chimneysare also colonised by sessile, filter-feeding organ-isms, such as sponges, hydroids, corals, anemones,squat lobsters, ophiuroids and holothurians (Galkin1997, Collins et al. 2012).
11
Mar Ecol Prog Ser 523: 1–14, 2015
Implications for the management of seafloormassive sulfide mining
The studied seamounts occur within areas origi-nally licenced for SMS prospecting within the NewZealand EEZ. Prior to this study, little was reportedon benthic assemblage structure at these seamounts,information essential for developing mitigationstrategies for SMS mining.
The present study suggests considerable variabilityin habitat and biodiversity amongst seamounts. Thisis also the case when comparing seamounts of similarhydrothermal activity along the Kermadec volcanicarc: the alvinocarid/hippolytid shrimp observed onBrothers are absent from Rumble III, whilst the vent-endemic mussel Gigantidas gladius found at RumbleIII and V is not present at Brothers (Clark & O’Shea2001, Rowden et al. 2003). This has important impli-cations for designing suitable strategies for mitigatingthe impact of mining activities on benthic fauna. Oneof these proposed strategies is the provision of ‘set-aside’ areas to preserve similar habitats and asso -ciated biodiversity within the region (InternationalSeabed Authority 2010, Collins et al. 2013a,b). Thehigh variability in seamount assemblages implies thatprotecting 1 seamount to enable mining at an adja-cent seamount may not be a suitable strategy. In -stead, to conserve the suite of assemblages present, itmay be necessary to protect multiple seamounts or anetwork of sites. As impacts on SMS mining are ex-pected to be localised (e.g. the majority of sedimenta-tion impacts should occur within 1 km of the miningsite; Coffey Natural Systems 2008), a network ofsmaller set-aside sites distributed within and amongstneighbouring seamounts may be a suitable strategy.
The unique assemblages at Rumble II West alsosuggest inactive SMS areas may support assemblagesnot found elsewhere in the region; individual taxawithin these assemblages may be widely distributed,but the grouping of taxa to form these assemblagesappears to be unique. This provides some support forthe hypothesis that the unique environment of weath-ered inactive SMS deposits could host specific fauna(Van Dover 2007, 2011). The possibility of unique as-semblages at inactive SMS deposits should be con-sidered when designating set-aside sites, if they areto preserve local assemblage structure.
Acknowledgements. We thank the crew and scientistsaboard both legs of the TAN1007 cruise on R.V. ‘Tangaroa’.TAN1007 and the research reported here are part of theNational Institute of Water and Atmospheric Research(NIWA) project ‘Deep-sea mining of the Kermadec Arc—
Geophysical prospectivity and environmental impacts’funded by the New Zealand Ministry of Business, Innova-tion and Employment (formally the Foundation for ResearchScience and Technology) (Contract CO1X0702). We thankFabio Caratori Tontini (GNS Science) for providing the 25 mresolution backscatter data over Brothers, and VidetteMcGregor (NIWA) for assistance with the ‘R’ scripts. We alsothank taxonomists at NIWA (Owen Anderson, Niki Davey,Michelle Kelly, Sadie Mills, Kate Neil, Geoff Reid, KareenSchnabel and Di Tracey) and the image analysis team (DaveBowden, Caroline Chin, Rob Stewart, Peter Marriott andAlan Hart) for assistance. R.E.B. and S.J.B. were supportedby PhD scholarship funding from NIWA and Victoria Uni-versity of Wellington. We are also grateful for the commentsprovided on this manuscript by 3 anonymous reviewers.
LITERATURE CITED
Ahyong S (2009) New species and new records of hydrother-mal vent shrimps from New Zealand (Caridea: Alvino -carididae, Hippolytidae). Crustaceana 82:775−794
Anderson MJ (2006) Distance-based tests for homogeneityof multivariate dispersions. Biometrics 62:245−253
Anderson MJ, Legendre P (1999) An empirical comparisonof permutation methods for tests of partial regressioncoefficients in a linear model. J Stat Comput Simul 62:271−303
Anderson MJ, ter Braak CJF (2003) Permutation tests formulti-factorial analysis of variance. J Stat Comput Simul73:85−113
Anderson MJ, Gorley RN, Clarke KR (2008) Permanovafor primer: guide to software and statistical methods.PRIMER-E, Plymouth
Anderson TJ, Nichol SL, Syms C, Przeslawski R, Harris PT(2011) Deep-sea bio-physical variables as surrogates forbiological assemblages, an example from the Lord HoweRise. Deep-Sea Res II 58:979−991
Arquit AM (1990) Geological and hydrothermal controls onthe distribution of megafauna in Ashes vent field, Juande Fuca Ridge. J Geophys Res 95:12947−12960
Augustin JM, Lurton X (2005) Image amplitude calibrationand processing for seafloor mapping sonars. Oceans2005—Europe. IFREMER, Plouzané, p 698−701
Boschen RE, Rowden AA, Clark MR, Gardner JPA (2013)Mining of deep-sea seafloor massive sulfides: a review ofthe deposits, their benthic communities, impacts frommining, regulatory frameworks and management strate-gies. Ocean Coast Manag 84:54−67
Bowden DA, Schiaparelli S, Clark MR, Rickard GJ (2011) Alost world? Archaic crinoid-dominated assemblages onan antarctic seamount. Deep-Sea Res II 58:119−127
Caratori Tontini F, Davy B, de Ronde CEJ, Embley RW, Leybourne M, Tivey MA (2012a) Crustal magnetiza -tion of Brothers Volcano, New Zealand, measured byautonomous underwater vehicles: geophysical expressionof a submarine hydrothermal system. Econ Geol 107:1571−1581
Caratori Tontini F, de Ronde CEJ, Yoerger D, Kinsey J, TiveyM (2012b) 3-D focused inversion of near-seafloor magnetic data with application to the Brothers Vol -cano hydrothermal system, southern Pacific Ocean,New Zealand. J Geophys Res 117, B10102, doi: 10. 1029/2012 JB 009349
Clark MR, O’Shea S (2001) Hydrothermal vent and sea -
12
Boschen et al.: Megabenthos of three New Zealand seamounts
mount fauna from the southern Kermadec Ridge, NewZealand. InterRidge News 10:14−17
Clark MR, Tittensor DP (2010) An index to assess the risk tostony corals from bottom trawling on seamounts. MarEcol 31:200−211
Clark MR, Rowden AA, Schlacher T, Williams A and others(2010) The ecology of seamounts: structure, function, andhuman impacts. Annu Rev Mar Sci 2:253−278
Clarke KR, Gorley RN (2006) Primer v6: user manual/tutorial.PRIMER-E, Plymouth
Coffey Natural Systems (2008) Environmental impact state-ment, Solwara 1 project, Nautilus Minerals Niugini Limited, main report. Coffey Natural Systems, Brisbane
Collins PC, Kennedy R, Van Dover CL (2012) A biologicalsurvey method applied to seafloor massive sulphides(SMS) with contagiously distributed hydrothermal-ventfauna. Mar Ecol Prog Ser 452:89−107
Collins PC, Croot P, Carlsson C, Colaco A and others (2013a)A primer for the environmental impact assessment ofmining at seafloor massive sulfide deposits. Mar Policy42:198−209
Collins PC, Kennedy R, Copley JT, Boschen R and others(2013b) Ventbase: developing a consensus among stake-holders in the deep-sea regarding environmental impactassessment for deep-sea mining. Mar Policy 42:334−336
Fonseca L, Brown C, Calder B, Mayer L, Rzhanov Y (2009)Angular range analysis of acoustic themes from StantonBanks Ireland: a link between visual interpretation andmultibeam echosounder angular signatures. Appl Acoust70:1298−1304
Galkin SV (1997) Megafauna associated with hydrothermalvents in the Manus back-arc Basin (Bismarck Sea). MarGeol 142:197−206
Genin A, Dayton PK, Lonsdale PF, Spiess FN (1986) Coralson seamount peaks provide evidence of current acceler-ation over deep-sea topography. Nature 322:59−61
Grassle JF (1985) Hydrothermal vent animals: distributionand biology. Science 229:713−717
Grigg RW (1997) Benthic communities on Lo’ihi submarinevolcano reflect high-disturbance environment. Pac Sci51:209−220
Grigg RW, Malaboff A, Chave EH, Landahl J (1987) Sea -mount benthic ecology and potential environmentalimpact from manganese crust mining in Hawaii. In:Keating BH, Fryer P, Batiza R, Boehlert GW (eds) Sea -mounts, islands, and atolls. American Geophysical Union,Washington, DC, p 379−390
Halfar J, Fujita RM (2007) Danger of deep-sea mining. Science 316:987
Hannington M, Jamieson J, Monecke T, Petersen S,Beaulieu S (2011) The abundance of seafloor massivesulfide deposits. Geology 39:1155−1158
Hubbs CL (1959) Initial discoveries of fish faunas onseamounts and offshore banks in the eastern Pacific.Pac Sci 13:311−316
Hughes Clarke JE, Danforth BW, Valentine P (1997) Arealseabed classification using backscatter angular responseat 95 kHz. High frequency acoustics in shallow water.NATO SACLANT Undersea Research Centre, Lerici
International Seabed Authority (2010) Regulations onprospecting and exploration for polymetallic sulphidesin the area. ISBA/16/A/12/Rev.1, International SeabedAuthority, Kingston
Kaufmann RS, Wakefield WW, Genin A (1989) Distributionof epibenthic megafauna and lebensspuren on two
central North Pacific seamounts. Deep-Sea Res 36:1863−1896
Komai T, Tsuchida S, Segonzac M (2012) Records of speciesof the hippolytid genus Lebbeus White, 1847 (Crustacea:Decapoda: Caridea) from hydrothermal vents in thePacific Ocean, with descriptions of three new species.Zootaxa 3241:35−63
Le Chenadec G, Boucher JM, Lurton X (2007) Angulardependence of k-distributed sonar data. IEEE TransGeosci Rem Sens 45:1224−1235
Levin LA, Demaster DJ, McCann LD, Thomas CL (1986)Effects of giant protozoans (class Xenophyophorea) ondeep-seamount benthos. Mar Ecol Prog Ser 29:99−104
Limen H, Juniper SK, Tunnicliffe V, Clement M (2006) Ben-thic community structure on two peaks of an eruptingseamount: Northwest Rota-1 Volcano, Mariana Arc,western Pacific. Cah Biol Mar 47:457−463
Lundsten L, Barry JP, Cailliet GM, Clague DA, DeVogelaereAP, Geller JB (2009) Benthic invertebrate communitieson three seamounts off southern and central California,USA. Mar Ecol Prog Ser 374:23−32
Lutz RA, Shank TM, Fornari DJ, Haymon RM, Lilley MD,Vondamm KL, Desbruyeres D (1994) Rapid growth atdeep-sea vents. Nature 371:663−664
McClain CR, Lundsten L, Barry J, DeVogelaere A (2010)Assemblage structure, but not diversity or density,change with depth on a northeast Pacific seamount. MarEcol (Berl) 31:14−25
Morato T, Hoyle SD, Allain V, Nicol SJ (2010) Seamounts arehotspots of pelagic biodiversity in the open ocean. ProcNatl Acad Sci USA 107:9707−9711
O’Hara TD (2007) Seamounts: centres of endemism or species richness for ophiuroids? Glob Ecol Biogeogr 16:720−732
Pond DW, Dixon DR, Bell MV, Fallick AE, Sargent JR (1997)Occurrence of 16:2(n-4) and 18:2(n-4) fatty acids in thelipids of the hydrothermal vent shrimps Rimicaris exocu-lata and Alvinocaris markensis: nutritional and trophicimplications. Mar Ecol Prog Ser 156:167−174
Raymore PAJ (1982) Photographic investigations on threeseamounts in the Gulf of Alaska. Pac Sci 36:15−34
Rowden AA, Clark MR, O’Shea S, McKnight DG (2003) Ben-thic biodiversity of seamounts on the southern KermadecVolcanic Arc. NIWA, Wellington
Rowden AA, Dower JF, Schlacher TA, Consalvey M, ClarkMR (2010a) Paradigms in seamount ecology: fact, fictionand future. Mar Ecol 31:226−241
Rowden AA, Schlacher TA, Williams A, Clark MR and others (2010b) A test of the seamount oasis hypothesis:seamounts support higher epibenthic megafaunal bio-mass than adjacent slopes. Mar Ecol 31:95−106
Samadi S, Bottan L, Macpherson E, De Forges BR, BoisselierMC (2006) Seamount endemism questioned by the geo-graphic distribution and population genetic structure ofmarine invertebrates. Mar Biol 149:1463−1475
Schlacher TA, Baco AR, Rowden AA, O’Hara TD, Clark MR,Kelley C, Dower JF (2014) Seamount benthos in a cobalt-rich crust region of the central Pacific: conservation challenges for future seabed mining. Divers Distrib 20:491−502
Stull JK, Haydock CI, Montagne DE (1986) Effects ofListriolobus pelodes (Echiura) on coastal shelf benthiccommunities and sediments modified by a major Cali-fornia wastewater discharge. Estuar Coast Shelf Sci22:1−17
13
Mar Ecol Prog Ser 523: 1–14, 2015
Sudarikov SM, Galkin SV (1995) Geochemistry of the SnakePit vent field and its implications for vent and non-ventfauna. In: Parson LM, Walker CL, Dixon DR (eds)Hydrothermal vents and processes, Vol 87. GeologicalSociety of London, London, p 319−327
Van Dover CL (2000) The ecology of deep-sea hydrothermalvents. Princeton University Press, Princeton, NJ
Van Dover CL (2007) The biological environment of poly-metallic sulphide deposits, the potential impact of ex -ploration and mining on this environment, and datarequired to establish environmental baselines in ex -ploration areas. Polymetallic sulphides and cobalt-richgerromanganese crust deposits: establishment of en -vironmental baselines and an associated monitoring programme during exploration. International SeabedAuthority, Kingston, p 169−190
Van Dover CL (2011) Mining seafloor massive sulphides andbiodiversity: What is at risk? ICES J Mar Sci 68:341−348
Van Dover CL (2014) Impacts of anthropogenic disturbancesat deep-sea hydrothermal vent ecosystems: a review.Mar Environ Res
Van Dover CL, Fry B, Grassle JM, Haumphris S, Rona PA(1988) Feeding biology of the shrimp Rimicaris exoculata
at hydrothermal vents on the mid-Atlantic Ridge. MarBiol 98:209−216
Wilson RR, Kaufmann RS (1987) Seamount biota and bio-geography. In: Keating BH, Fryer P, Batiza R, BoehlertGW (eds) Seamounts, islands and atolls, Vol 43. Ameri-can Geophysical Union, Washington, DC, p 355−390
Wilson MFJ, O’Connell B, Brown C, Guinan JC, Grehan AJ(2007) Multiscale terrain analysis of multibeam bathy -metry data for habitat mapping on the continental slope.Mar Geol 30:3−35
Wirsen CO, Jannasch HW, Molyneaux SJ (1993) Chemosyn-thetic microbial activity at mid-Atlantic Ridge hydrother-mal vent sites. J Geophys Res Solid Earth 98:9693−9703
Wishner KF, Graff JR, Martin JW, Carey S, Sigurdsson H,Seibel BA (2005) Are midwater shrimp trapped in thecraters of submarine volcanoes by hydrothermal vent-ing? Deep-Sea Res I 52:1528−1535
Wright IC (1994) Nature and tectonic setting of the southernKermadec submarine arc volcanoes: an overview. MarGeol 118:217−236
Wright IC, Gamble JA (1999) Southern Kermadec submarinecaldera arc volcanoes (SW Pacific): caldera formation byeffusive and pyroclastic erruption. Mar Geol 161: 207−227
14
Editorial responsibility: Charles Peterson, Morehead City, North Carolina, USA
Submitted: December 1, 2014; Accepted: February 10, 2015Proofs received from author(s): February 27, 2015