Embed Size (px)
Citation preview
Article Citation: Akbar Norouzi Shokrlu, Mehdi Pajoohesh and Behnam Farid Gigloo The effect of aggregates stability and physico-chemical properties of gullies’ soil: a case study of Ghori-chai watershed in the Ardabil province, Iran Journal of Research in Biology (2018) 8(3): 2473 -2485
Jou
rn
al of R
esearch
in
Biology
The effect of aggregates stability and physico-chemical properties of gullies’
soil: a case study of Ghori-chai watershed in the Ardabil province, Iran
Keywords: Aggregate stability, Geometric Mean Diameter (GMD), Mean Weight Diameter (MWD), Soil sensitivity, R software.
ABSTRACT: Soil erosion, “particularly gully erosion" is considered as the most important factors of land degradation in semi-arid regions, since Iran is located in a semi-arid region, it is highly susceptible to degradation and erosion. The current study done on land was exposed to erosion in the Ghori-chai watershed, Ardabil province. In order to know the soil samples, they were collected from the gully heads of two depths (0-30, 30-60 cm) (the active points of gullies). Physico-chemical properties of soil samples were analyzed in the field and laboratory. GMD (Geometric Mean Diameter) and MWD (Mean Weight Diameter) factors were used to determine the sensitivity of the gullies' soil to erosion. Using the statistical software R, multivariable regression, and simple linear stepwise regression were applied in order to determine the relationship between soil physico-chemical properties and aggregates stability. Chi-square was used to compare parameters and differences test. Aggregate stability was low on the gullies land, and soil stability has severe and very severe limitations in this region. However the considerable organic carbon is a positive factor in aggregates stability, but high SAR (Sodium Absorption Ratio) and unsuitable land use have recognized to aggregates instability. The amounts of SAR and OM (Organic Matter) and silt/ (clay+sand) also were analyzed in both the depths and showed that the amount of SAR and OM have significant alternation (changes) in various depths and gullies. However, the amounts of MWD did not show any significant alternation in deeps and gullies.
2473-2485 | JRB | 2018 | Vol 8 | No 3
This article is governed by the Creative Commons Attribution License (http://creativecommons.org/licenses/by/4.0), which gives permission for unrestricted use, non-commercial, distribution and reproduction in all medium, provided the original work is properly cited.
www.jresearchbiology.com Journal of Research in Biology
An International
Scientific Research Journal
Authors:
Akbar Norouzi Shokrlu1,
Mehdi Pajoohesh1 and
Behnam Farid Gigloo2
Institution:
1. Department of Range and
Watershed Management,
University of Shahrekord,
Iran.
2. Department of Range and
Watershed Management,
University of Kashan,
Iran.
Corresponding author:
Akbar Norouzi Shokrlu
Web Address:
http://jresearchbiology.com/
documents/RA0672.pdf
Dates: Received: 02 Feb 2018 Accepted: 05 April 2018 Published: 10 May 2018
Journal of Research in Biology
An International Scientific Research Journal
ISSN No: Print: 2231 –6280; Online: 2231- 6299
Case Study
INTRODUCTION
Soil erosion by water is one of the most
important processes of land degradation, particularly in
semi-arid areas is considered. Among the different types
of water erosion, gully erosion is one of the most
important events contributing to the destruction of soil,
change the perspective of land and water resources and
lands are regressive (Ahmadi, 2006). Gully erosion, a
severe type of soil erosion, is a process whereby runoff
water accumulates and often recurs in narrow ‘V’ or ‘U’
shaped channels with considerable depth (Poesen et al.,
2003). Gully erosion starts with overland flow, which
erodes small rills as flow concentrates in separate
channels. Over time, rills may develop into gullies,
causing significant soil loss and land degradation
(Poesen et al., 2003; Valentin et al., 2005). Gullies are
composed of several continuous or discontinuous
channels and rills with varying slopes, which may later
develop into deep trenches, inhibiting effective
remediation by tillage (Bocco 2016; Knighton 1998;
Thomas et al., 2004; Vanwalleghem et al., 2005). Gully
formation and growth are governed by natural and
anthropogenic factors such as: topography, soil type and
texture, vegetation type and cover, precipitation amount
and duration, freeze-thaw cycles, and agricultural
activities (Lal,1994; Janeau et al., 2003; Reusser et al.,
2015). Approximately two third of the 3031 million
hectares of potential arable land worldwide is degraded.
Globally, natural erosion is estimated to a total
of 9.9 billion tons of soil a year (Lal, 1990). Based on
the results of the recent research, this type of erosion
effect on the environment from two aspects: a) the
destruction of the surface and underlying soil horizons,
is leading to large sediment production and destruction
of the bed, b) exacerbated discharge of surface runoff
and reduce the volume of groundwater flow through the
short connections between upstream and downstream
areas (Poesen et al., 2003).
According to the changes in the contribution of
this type of erosion in sediment production in different
watershed, the range of gully erosion is estimated
between 10-94 percent in different parts of the world
(Poesen et al., 2003). The contribution of gully erosion
in land degradation and soil erosion is not only lower
Shokrlu et al., 2018
2474 Journal of Research in Biology (2018) 8(3): 2473 -2485
Figure 1. Location of the study area
than other erosions types, but also in many cases this
type of erosion, is the source of much sediment
production in watersheds. For example, the contribution
of the gully erosion in Australia was of 37 percent
(Wasson et al., 1996) and in China and Belgium it was
78 and 30-40 percent, respectively (Vandaele et al.,
1996). So soil structure has important influences on
edaphic conditions and the environment. The structure
is often measured by the stability of soil aggregates (Six
et al., 2000; Bronick and Lal, 2005). Stable aggregates
are vital to erosion resistance, water accessibility, and
root development. Soils with stable aggregates at the
surface are more impervious to water erosion than other
soils, both due to the fact that soil particles are more
averse to be separated and in light of the fact that the
rate of water infiltration has a tendency to be higher on
well aggregated amassed soils. In addition to, soil
aggregation protects soil organic matter from
mineralizing because it physically reduces the
availability of organic compounds for microorganisms,
extracellular enzymes, and oxygen (Lützow et al., 2006;
Spohn and Giani, 2010). A stability is one of the best
marker of organic matter content biological activity, and
nutrient cycling in the soil. The amount of organic
matter increases after the decomposition of litter and
dead roots begins. In fact, stability of soil aggregates is
closely related to the erosion resistance of soil and,
therefore, is the effective indicators of erosion
sensitivity (Guo et al., 2007; Rachman et al., 2003;
Valmis et al., 2005).
Aggregate stability in different texture such as
clay> clay loamy> loamy> sandy loam, are reduced
respectively (Mbagwu, 1989). Clay stability is increased
when the amount of sodium in the soil is low and the
presence of sodium high negative impact on the
stability. Wustamidin and Douglas (1985) in a research
reported that there is a negative relationship between
clay and aggregate stability. By increasing of Sodium
Journal of Research in Biology (2018) 8(3): 2473 -2485 2475
Shokrlu et al., 2018
Parameters MWD OM SAR
Depth (cm) 0-30 30-60 0-30 30-60 0-30 30-60
Different test Within data 4.74 1.50 78.3** 60.2** 87.2** 76.3**
Between data 19.9 77.3** 124**
Table 1. Testing difference within and between data, using Chi-square test
** The significant level at 99 percent
(OM: Organic Matter; MWD: Mean Weight Diameter; SAR: Sodium Absorption Ratio)
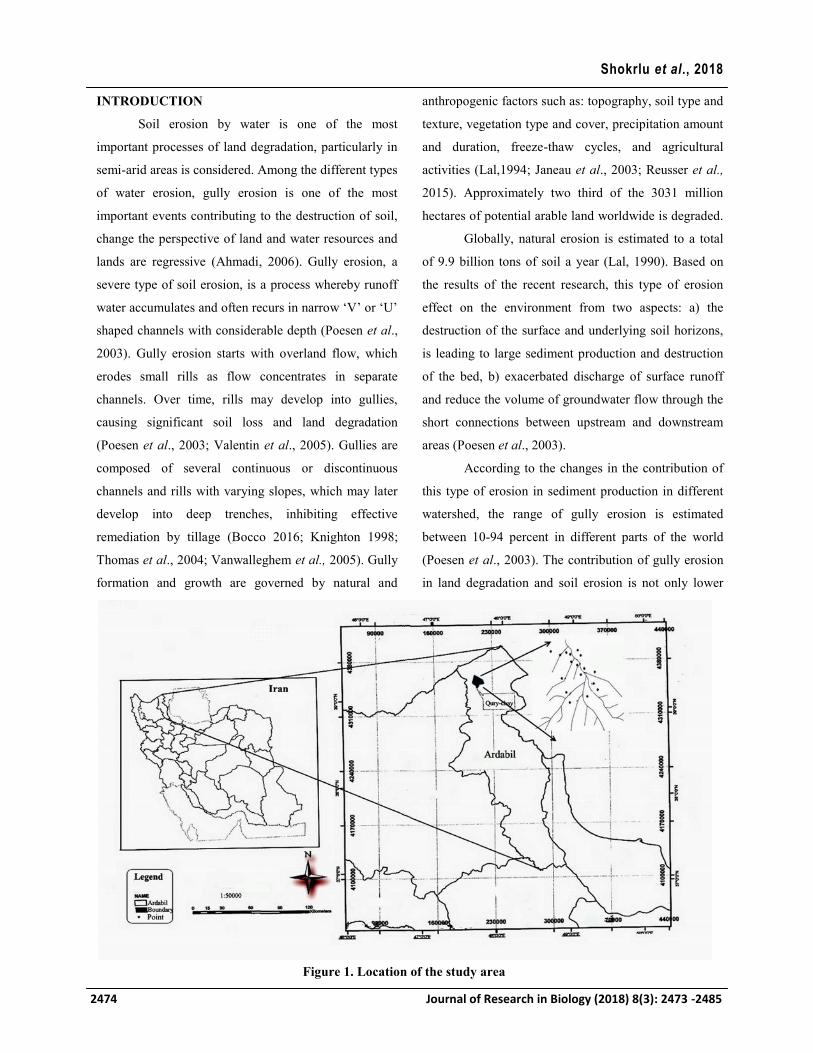
Figure 2. The amounts of MWD and GMD (mm) in soil sampling from head-cut part at a depth of 0-30 cm
Absorption Ratio (SAR), required Electrolyte
Concentration (EC) is to conclude of clay is more. Abu-
Sharar et al. (1986) and Karimi et al. (2007) reported
that soil aggregate stability and soil erosion potential in
loamy and sandy clay loam soils stated that increase in
aggregate instability due to the high concentration of
sodium and lack of organic matter. The amount of
organic matter increases after the decomposition of litter
and dead roots begins. Similarly, Soil Organic Matter
(SOM) is known to play a crucial role in soil structure
formation and aggregate stability (Abid and Lal 2008;
Chaney and Swift 1984; Bissonnais and Arrouays 1997;
Soinne et al., 2016; Benbi and Senapati 2010;
Bandyopadhyay et al., 2010; Karami et al., 2012).
MATERIALS AND METHODS
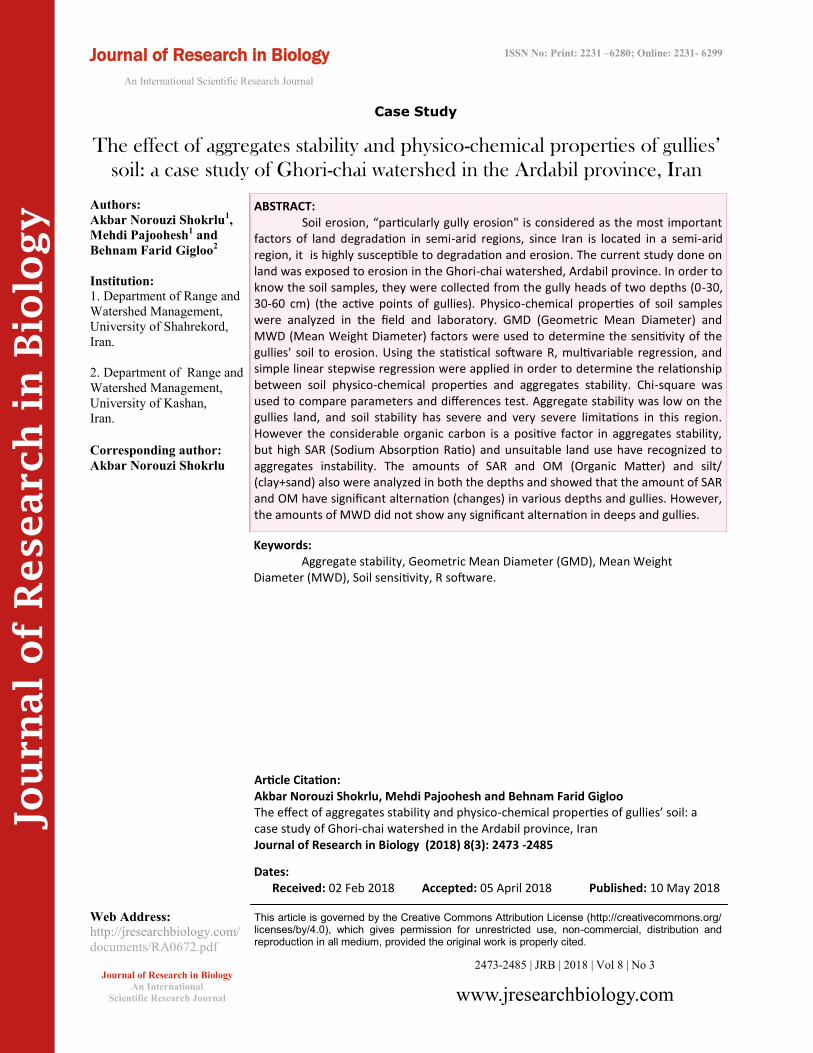
Study area
The Ghori-chai watershed is located at 48° 06'
37" E and 38° 32' 33"N in the Ardabil province, a
distance of 20 kilometers from the border of Iran and
the measurement of aggregate stability is considered to
be an indicator of soil quality that contribute to soil
fertility and its capability to support crop growth (Six et
al., 2004; Pirmoradian et al., 2005; Simansky et al.,
2008; Liu et al., 2010; Spohn and Giani 2011; Blanco-
Moure et al., 2012; Zhang et al., 2012). Soil aggregation
may be determined by the Mean Weight Diameter
(MWD), the Geometric Mean Diameter (GMD), which
is obtained by breaking the soil into aggregate classes
Shokrlu et al., 2018
2476 Journal of Research in Biology (2018) 8(3): 2473 -2485
Silt
(%)
Sand
(%)
Clay
(%)
C O
(%)
Na
(ppm)
K
(ppm)
Ca
(ppm)
Mg ppm))
SAR
PH
EC (m.
Semines /li)
Depth
(mm)
Gully
42 33 25 1.04 8.48 26.18 24.8 13.2 1.94 7.61 1.21 0-30 1
58 15 27 0.78 17.05 16.32 24 15.2 3.85 7.72 1.04 30-60
46 39 15 0.78 17 4.14 24.4 13.6 4.01 7.8 1.01 0-30 2
22 69 9 0.7 4.20 2.40 24 14 0.96 7.59 2.53 30-60
56 29 15 0.71 1.75 18.06 16 16 0.43 7.63 1.28 0-30 3
38 33 29 0.84 29.29 13.42 22.8 14 6.82 7.63 4.96 30-60
24 51 25 1.07 17.05 10.52 24 10 4.13 7.73 1.21 0-30 4
30 49 21 0.64 24.39 5.30 25.6 6 6.13 7.79 1.74 30-60
58 17 25 0.71 4.20 14.00 23.6 8.8 1.04 7.57 1.91 0-30 5
66 19 15 0.95 21.33 8.20 27.2 15.2 4.63 7.58 3.19 30-60
16 63 21 1.25 6.03 60.40 22 8 1.55 7.83 1.59 0-30 6
66 25 9 0.92 42.14 26.76 36 20.8 7.90 7.26 3.2 30-60
24 49 27 0.89 11.54 44.74 22 10.8 2.85 7.73 0.88 0-30 7
24 51 25 0.7 21.33 26.18 23.6 10.4 5.17 7.92 0.63 30-60
10 75 15 0.89 22.56 20.38 20 12.4 5.60 8.24 0.69 0-30 8
8 77 15 0.72 1.75 18.64 22 11.6 0.42 7.94 0.6 30-60
22 53 15 0.82 2.97 36.04 22.8 12.4 0.70 7.86 0.67 0-30 9
8 75 17 0.92 9.09 29.08 20 12.4 2.26 7.68 1.32 30-60
58 35 7 0.78 30.51 72.40 68 44 4.07 7.7 2.3 0-30 10
14 71 15 0.75 10.93 72.33 22.4 10.4 2.69 7.9 0.76 30-60
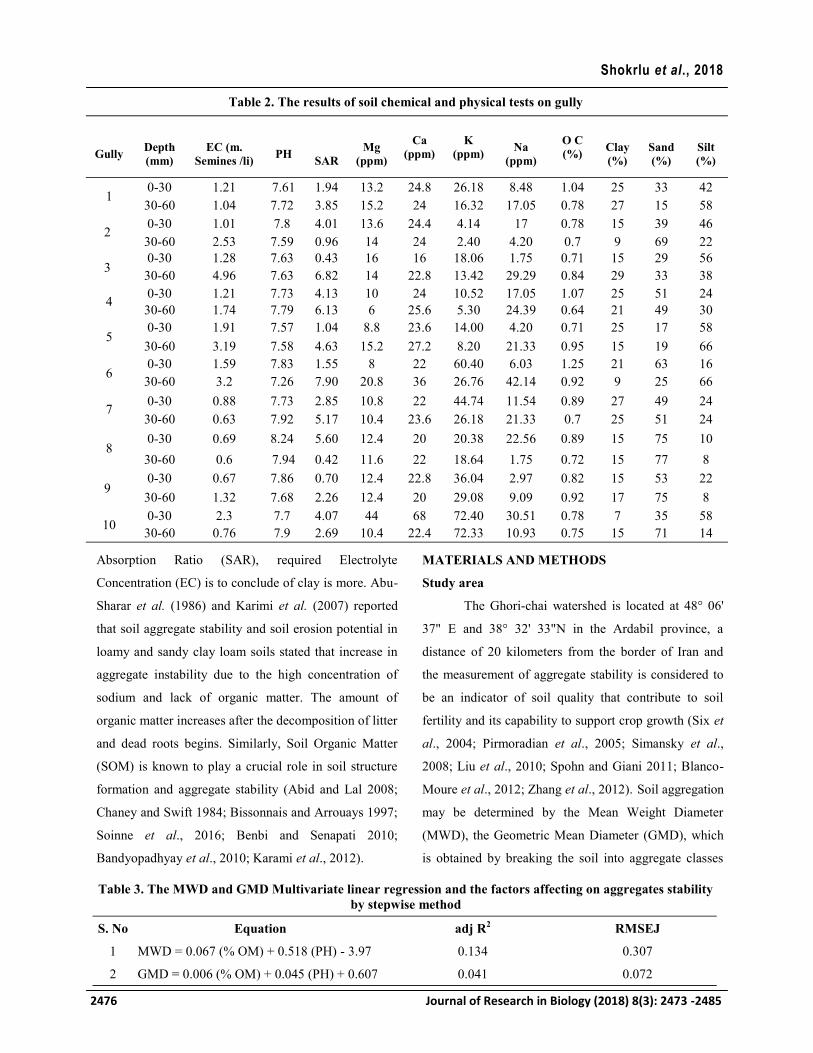
Table 2. The results of soil chemical and physical tests on gully
Equation adj R2 RMSEJ S. No
MWD = 0.067 (% OM) + 0.518 (PH) - 3.97 0.134 0.307 1
GMD = 0.006 (% OM) + 0.045 (PH) + 0.607 0.041 0.072 2
Table 3. The MWD and GMD Multivariate linear regression and the factors affecting on aggregates stability
by stepwise method
by the wet sieving method (Yoder 1936; Kemper1965;
Kemper and Chepil, 1965).
The objective of this study is to determine the
effect of aggregates stability and physico-chemical
properties of gullies soil in Ghourichai watershed in the
Ardabil province. We aimed to use the Mean Weight
Diameter (MWD) and Geometric Mean Diameter
(GMD) to determine the sensitivity of soils in gullies
erosion.
Gully erosion in Azerbaijan watershed, is
causing damage to the desirable agricultural land rural
residential land, road facilities and so on. Then, it is
necessary to investigate these factors in the
development of gully erosion in the watershed. Mean
annual temperature, mean maximum and minimum are
13.9, 19.7 and 8.7°C, respectively. The average annual
precipitation is 318.8 mm and its minimum and
maximum precipitation are related to August (9.8 mm)
and June (45.1 mm), respectively. The type of climate
based on the hyetograph curve, Domarten modified and
Emberger were determined cold semi-arid climate in
this watershed.
In terms of geomorphology, the Ghori-chai
watershed can be divided into two parts North (the
plains and quaternary hilly is the location of gully
erosion development) and the southern part (the
mountain perspective and older altitude is related to
Oligocene to Pliocene period). According to the data
from meteorological stations inside and outside the
study area and based on the map of Iranian soil moisture
and thermal regimes, are xeric and mesic regimes,
respectively. The number of sampling this study was
Journal of Research in Biology (2018) 8(3): 2473 -2485 2477
Shokrlu et al., 2018
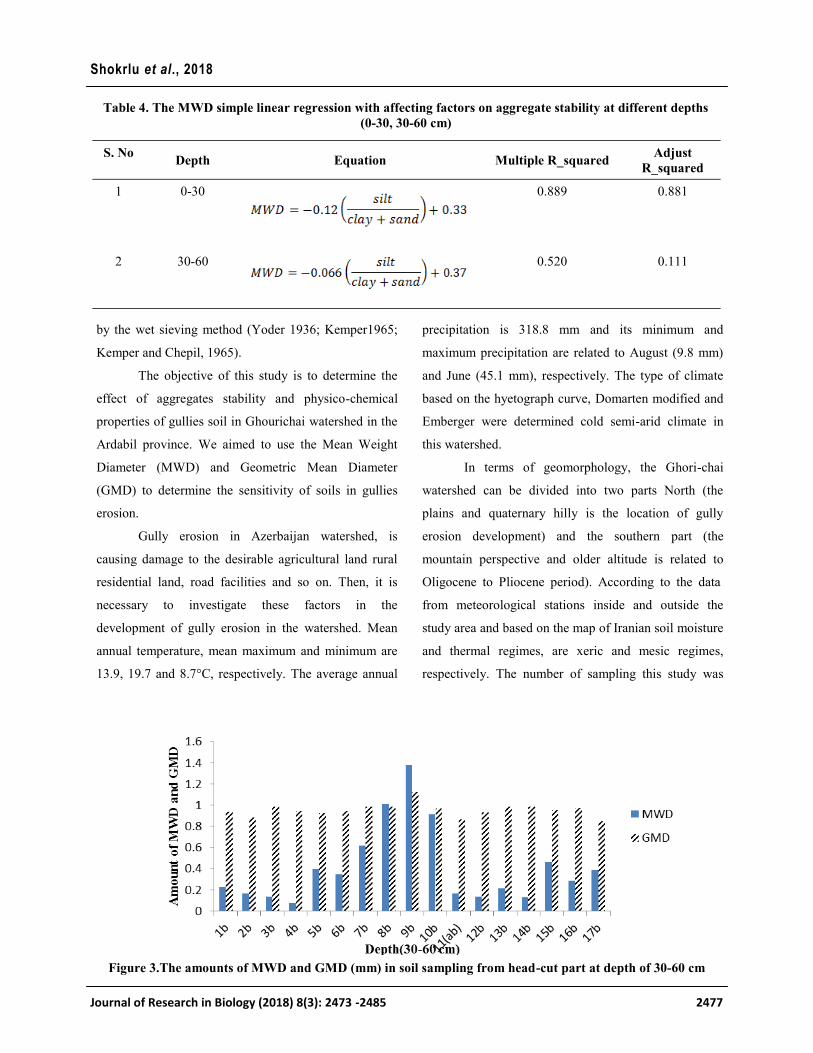
Figure 3.The amounts of MWD and GMD (mm) in soil sampling from head-cut part at depth of 30-60 cm
Depth
Equation
Multiple R_squared Adjust
R_squared
S. No
0-30 0.889 0.881 1
30-60 0.520 0.111 2
Table 4. The MWD simple linear regression with affecting factors on aggregate stability at different depths
(0-30, 30-60 cm)
carried out 34 samples in 17 gullies from the depth of 0-
30 and 30-60 cm of the head cut and in order to
determine the aggregates stability and some chemical
and physical characteristics as well as the aggregate
resistance rate against water entry. So as to prepare
samples and mean weight diameter was measured and
the diameter until aggregates to be wet capillary suction
effect, why that rapid getting wet is causing
disintegration and dispersion of the aggregates
(Movahedi and Rezaei, 2008).
Van (1949) found out mean weight diameter
(MWD) of aggregates as a statistical aggregation index.
The mean weight diameter is comparable using the area
under the curve graph of the cumulative weight percent
of the aggregates different sizes. This number is an
estimation of the aggregate mean weight size and it
presents the aggregates analysis. The mean weight
diameter is a sensitive indicator of soil conditions and
treatments. However, most available methods are
divided to two parts: (1) The amount of aggregates
available and (2) To some extent; silt and clay have
been transformed to the aggregate. To determine the
mean weight diameter used the wet- sieved method, the
soil slowly were wet for 30 min by capillary properties
Shokrlu et al., 2018
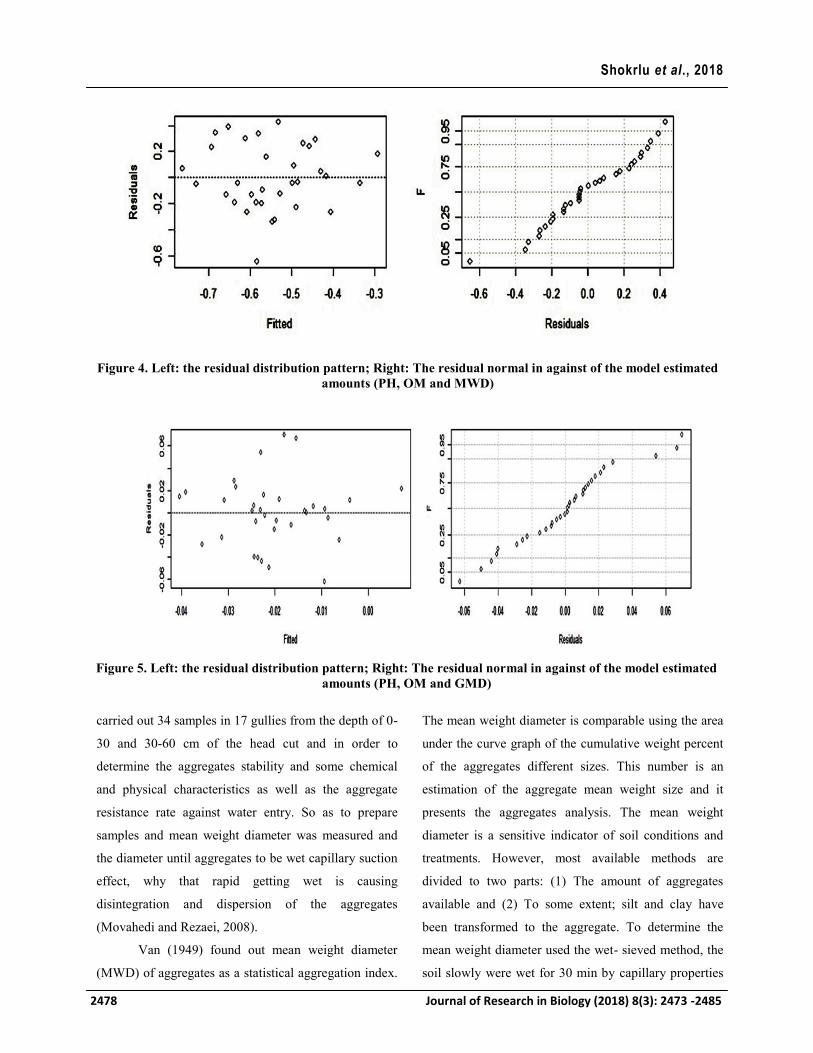
Figure 4. Left: the residual distribution pattern; Right: The residual normal in against of the model estimated
amounts (PH, OM and MWD)
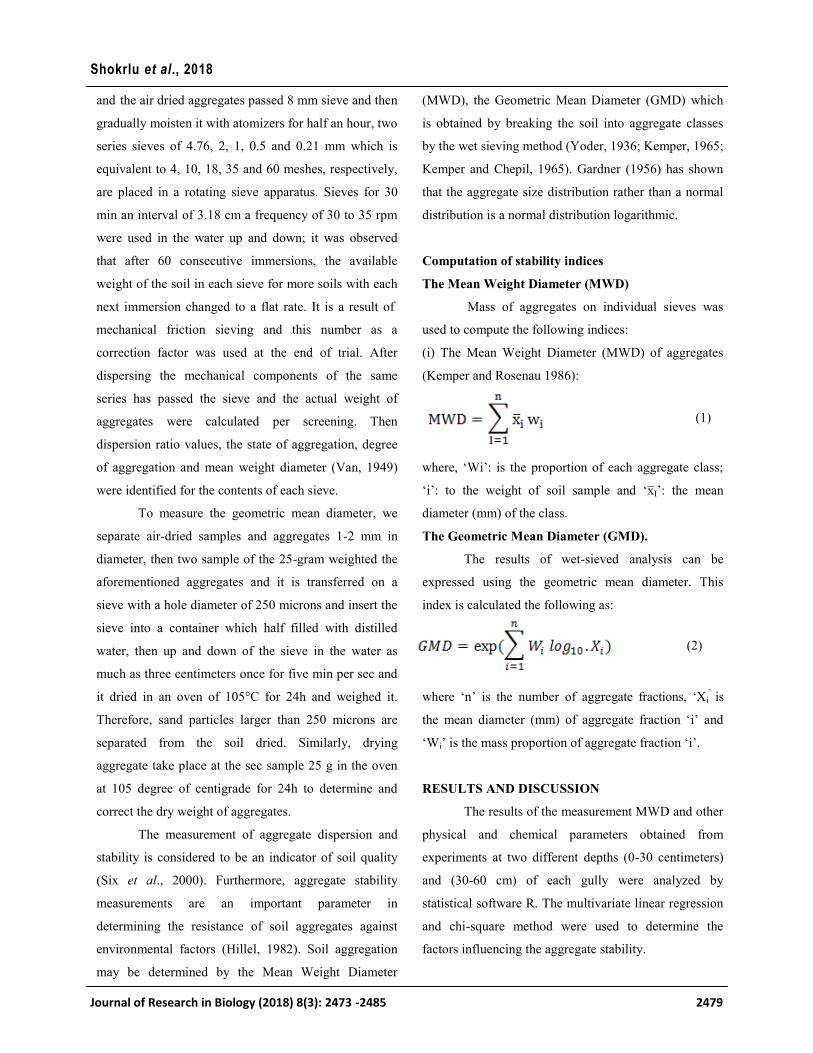
Figure 5. Left: the residual distribution pattern; Right: The residual normal in against of the model estimated
amounts (PH, OM and GMD)
2478 Journal of Research in Biology (2018) 8(3): 2473 -2485
and the air dried aggregates passed 8 mm sieve and then
gradually moisten it with atomizers for half an hour, two
series sieves of 4.76, 2, 1, 0.5 and 0.21 mm which is
equivalent to 4, 10, 18, 35 and 60 meshes, respectively,
are placed in a rotating sieve apparatus. Sieves for 30
min an interval of 3.18 cm a frequency of 30 to 35 rpm
were used in the water up and down; it was observed
that after 60 consecutive immersions, the available
weight of the soil in each sieve for more soils with each
next immersion changed to a flat rate. It is a result of
mechanical friction sieving and this number as a
correction factor was used at the end of trial. After
dispersing the mechanical components of the same
series has passed the sieve and the actual weight of
aggregates were calculated per screening. Then
dispersion ratio values, the state of aggregation, degree
of aggregation and mean weight diameter (Van, 1949)
were identified for the contents of each sieve.
To measure the geometric mean diameter, we
separate air-dried samples and aggregates 1-2 mm in
diameter, then two sample of the 25-gram weighted the
aforementioned aggregates and it is transferred on a
sieve with a hole diameter of 250 microns and insert the
sieve into a container which half filled with distilled
water, then up and down of the sieve in the water as
much as three centimeters once for five min per sec and
it dried in an oven of 105°C for 24h and weighed it.
Therefore, sand particles larger than 250 microns are
separated from the soil dried. Similarly, drying
aggregate take place at the sec sample 25 g in the oven
at 105 degree of centigrade for 24h to determine and
correct the dry weight of aggregates.
The measurement of aggregate dispersion and
stability is considered to be an indicator of soil quality
(Six et al., 2000). Furthermore, aggregate stability
measurements are an important parameter in
determining the resistance of soil aggregates against
environmental factors (Hillel, 1982). Soil aggregation
may be determined by the Mean Weight Diameter
(MWD), the Geometric Mean Diameter (GMD) which
is obtained by breaking the soil into aggregate classes
by the wet sieving method (Yoder, 1936; Kemper, 1965;
Kemper and Chepil, 1965). Gardner (1956) has shown
that the aggregate size distribution rather than a normal
distribution is a normal distribution logarithmic.
Computation of stability indices
The Mean Weight Diameter (MWD)
Mass of aggregates on individual sieves was
used to compute the following indices:
(i) The Mean Weight Diameter (MWD) of aggregates
(Kemper and Rosenau 1986):
where, ‘Wi’: is the proportion of each aggregate class;
‘i’: to the weight of soil sample and ‘x̅I’: the mean
diameter (mm) of the class.
The Geometric Mean Diameter (GMD).
The results of wet-sieved analysis can be
expressed using the geometric mean diameter. This
index is calculated the following as:
where ‘n’ is the number of aggregate fractions, ‘Xi’ is
the mean diameter (mm) of aggregate fraction ‘i’ and
‘Wi’ is the mass proportion of aggregate fraction ‘i’.
RESULTS AND DISCUSSION
The results of the measurement MWD and other
physical and chemical parameters obtained from
experiments at two different depths (0-30 centimeters)
and (30-60 cm) of each gully were analyzed by
statistical software R. The multivariate linear regression
and chi-square method were used to determine the
factors influencing the aggregate stability.
Journal of Research in Biology (2018) 8(3): 2473 -2485 2479
Shokrlu et al., 2018
(1)
(2)

Chi-square test
Chi-square test (non-parametric) is a solution
available to goodness of fit test of the nominal scale
variables with more than two categories. This test was
used to assess differences between soil properties at
different depths (within data) and differences between
Gullies (between data) and the results are presented in
Table 1.
As seen in Table 1, MWD index at various
depths of within and between data (0-30 cm) and (30-60
cm) is not significant. It means that soil texture is the
same or so did not show significant changes in different
gullies of this study. However, OM and SAR are
significant level 99 percent at depth of (0-30 cm) and
(30-60 cm), because these two parameters in depth of
(0-30 cm) and (30-60 cm) in gullies were significant.
Some soil chemical and physical tests on gully
presented in Table 2 that shows amount of cations and
anions in the study area.
The amount and type of organic matter are
considered as important factors in stabilizing soil
structure. Because the aggregate stability of soils are
influenced by quality and quantity of organic matter and
soil texture. In fact, organic matter together the particles
of soil organic act as binding factor and prevent from
the break down of aggregate (Tajik, 2004). The soil
properties and especially soil organic related properties
were significantly different in terms of land use type.
On the one hand, soil organic matter is significantly
affected by the land use (John et al., 2005; Li et al.,
2015) on the other hand, soil organic matter plays
deeply important roles in the stability and size
distribution of soil aggregates (Abiven et al., 2009;
Alagöz and Yilmaz, 2009). It is suspected that the
effects of land use on soil aggregates are driven by the
soil organic matter or its components.
As seen in Table 2, with increasing value of Na
and EC, the value of SAR is increased as well. The high
SAR is caused to created instability in soil aggregate
(Tajik, 2004). Therefore, understanding aggregate
formation and stabilization in the soils can help to
manage soils appropriately, maximizing aggregate
stability, which is essential for the success of
agricultural systems as well as for preserving
environmental quality.
Multivariate linear regression
Multivariate linear regression parameters for
relationship between aggregate stability (Mean Weight
Diameter (MWD) and Geometric Mean Diameter
(GMD)) with the factors influencing on the aggregate
stability and related formulas by stepwise method are
presented in Table 3. Stepwise regression analysis is
another way to regression analysis where they show all
independent variables that effects on the dependent
variables. According to Table 3, the results of
multivariate linear regression showed that the amount of
MWD has more correlated than GMD with the
percentage of pH and Organic Matter (OM). On the
other hand, in the GMD, the amount of RMSE is lower
than MWD. Hence, GMD model is better than MWD.
According to equation, the amount of OM is the most
important factor influencing on the aggregate stability
and MWD. Increasing the amount of organic matter
caused that increased the stability aggregate, so that
supported this discussion (Soane, 1990; Guo et al. 2007;
Rachman et al. 2003).
Simple linear regression
Simple linear regression is a measurable
strategy that enables us to outline and study connections
between two continuous (quantitative) variables. As it
were, a single linear regression model demonstrates
endeavors to clarify the relationship between at least
two variables utilizing a straight line. Table 4 explain
about the MWD simple linear regression with factors of
influencing on aggregate stability at different depth
Table 4. The MWD simple linear regression with
affecting factors on aggregate stability at different
depths (0-30 and 30-60 cm).
Shokrlu et al., 2018
2480 Journal of Research in Biology (2018) 8(3): 2473 -2485

As shown in Table 4, the MWD is significant
positive correlation, with the ratio of silt / (clay + sand)
at the depth of 0-30 cm (r=88.9%); however this ratio
has significantly weakened the MWD at depth of 30-60
cm. As the clays 2: 1 due to have a specific surface area
and high CEC are more effective than other clays on
their aggregate stability, on the other hand, a main
percentage of these clays are placed in the fine clay soil.
Thus, clays have the greatest effect on aggregation and
aggregate stability. Therefore, in aforementioned
equation, the clay is the more correlated with MWD, in
the other words, significant correlation was obtained
with MWD (Barzegar et al., 1995; Abdulqadir and
Mahmood, 2016). The amounts of MWD and GMD
(mm) in soil sampling from head-cut part at the depth of
0-30 and 30-60 cm are showed in Figure 2 and 3.
In above the Figures (2 and 3) a, b and ab are as
depth of (0-30 cm), (30-60 cm) and transitional horizon
respectively. At times, layers of soil were noted which
are very peculiar from overlying or underlying horizons
and which have attributes in excess of one master soil
horizon, however can't easily be settled into two
horizons. These layers are helpfully portrayed as
transitional horizons. As seen in Figure 2 and 3, the
mean weight diameter (MWD) are variable from 0.14 to
0.79 and from 0.07 to 0.61, at depth of 0-30 cm and 30-
60 cm, respectively which is representing severe
limitation of the aggregate stability based on Lal
classification (Lal, 1994) at lower depths. As well as,
the Geometry Weight Diameter (GMD) is variable from
0.84 to 1.12 and from 0.84 to 0.98 at a depth of 0-30 cm
and 30-60 cm respectively. According to Figure 2 and 3,
the soil aggregates stability in this area have severity
and very severity limitations. Therefore, poor aggregate
stability has led to gully erosion in the region.
Residuals versus fits plot
Once compute a fitting model, it is used for any
of the regression diagnostics commands. Graphs are
drawn against the residuals and the values fit are one of
them. Residuals are appraisals of trial errors acquired by
subtracting the observed responses from the predicted
responses. The predicted response is figured from the
chosen model, after all the unknown model parameters
have been assessed from the trial data. Investigations at
residuals is a key piece of all statistical modeling.
Careful consideration of the residuals can reveal
whether our suspicions are reasonable and our choice of
model is appropriate. It is a scatter plot of residuals on
the ‘y’ axis and fitted values (estimated responses) on
the ‘x’ axis (Figure 4 and 5). The plot is utilized to
identify non-linearity, unequal error variances, and
outliers and enhance the regression. In fact a residual
versus fit plot determine assumptions of underlying that
the regression model is useful in understanding the most
common types of inappropriateness. In other words
plots residuals help to understand and improve
regression model. If the model is appropriate to point
out this chart should ‘ei = 0’ is symmetrical and evenly
dispersed locations around the point. It means that the
error variance in this state is constant.
If graphs similarly spread residuals around a
horizontal line without distinct patterns that is a good
sign it didn't have non-linear relationships. It can be
stated that the good model data are simulated in a way
that meets the regression assumptions very well, while
the bad model data are not. In a well-fitted model, there
should be no pattern to the residuals plotted against the
fitted values-something not true of our model.
According to Figure 4 and 5, the normal residual and
the residual distribution pattern in the MWD with PH
and OM showed better results than GMD with OM and
pH. Therefore, MWD with PH and OM have the nearly
symmetrical and evenly dispersed locations around the
point and the error variance is roughly constant in this
state. On the other hand, there is a high correlation
between MWD and OM.
Shokrlu et al., 2018
Journal of Research in Biology (2018) 8(3): 2473 -2485 2481
CONCLUSION
In this study, we assessed the effect of
aggregates stability and physico-chemical properties of
gullies soil in Ghori-chai watershed in the Ardabil
province. The aggregate instability is one of the most
important factors in the development of gully erosion in
the Ghori-chai watershed. To do so, we compared the
size of the Mean Weight Diameter (MWD) and
Geometric Mean Diameter (GMD). According to the
results, MWD has a severe and very severe limitations
to create aggregate stability. There are different causes
that can be contributed in the aggregate stability of
gullies in term of physical and chemical test results on
soil samples showed that high level of sodium and
increasing the sodium absorption ratio in the study area
is caused by the aggregate instability. The results of this
study showed that the aggregate stability in the surface
depths are greater than the subsurface deep. In
conclusion, the high organic matter can cause adhesions
and aggregates whereas and high correlation with
MWD, as well as the normal residual in MWD have the
nearly symmetrical and evenly dispersed locations
around the point.
REFERENCES
Abdulqadir AS and Mahmood KS. 2016. The effect
of some soil physical and chemical properties on soil
aggregate stability in different locations in sulaimani
and halabja governorate. Open Journal of Soil Science,
6(4): 81-88.
Abid M and Lal R. 2008. Tillage and drainage impact
on soil quality I. aggregate stability, carbon and nitrogen
pools. Soil Tillage Research, 100(1-2): 89-98.
Abiven S, Menasseri S and Chenu C. 2009. The
effects of organic inputs over time on soil aggregate
stability a literature analysis. Soil Biology and
Biochemistry, 41(1): 1–12.
Abu-Sharar TM, Bingham FT, Rhoades JD. 1986.
Stability of soil aggregate as affected by electrolyte
concentration and composition. Soil Science Society of
America, 51(2): 309-314.
Ahmadi H. 2006. Applied geomorphology (water
erosion), Tehran University Press, 435 p.
Alagöz Z and Yilmaz E. 2009. Effects of different
sources of organic matter on soil aggregate formation
and stability: a laboratory study on a lithic rhodoxeralf
from Turkey. Soil and Tillage Research, 103(2): 419-
424.
Bandyopadhyay PK, Saha S, Mani PK and Mandal
B. 2010. Effects of organic inputs on aggregate
associated organic carbon concentration under long-
term rice–wheat cropping system. Geoderma, 154(3-4):
379–386.
Barzegar AR, Rengasamy P and Oades JM. 1995.
Effect of clay type and rate of wetting on the mellowing
of compacted soils. Geoderma, 68(1-2): 39-49.
Benbi DK and Senapati N. 2010. Soil aggregation and
carbon and nitrogen stabilization in relation to residue
and manure application in rice–wheat systems in
northwest India. Nutrient Cycling in Agroecosystems,
87(2): 233–247.
Le Bissonnais Y and Arrouays D. 1997. Aggregate
stability and assessment of soil crustability and
erodibility: ii application to humic loamy soils with
various organic carbon contents. European Journal of
Soil Science, 48(1): 39–48.
Blanco-Moure N, Moret-Fernandez D and Lopez
MV 2012. Dynamics of aggregate destabilization by
water in soils under long term conservation tillage in
semiarid Spain. Catena. 99: 34– 41.
Bocco G. 2016. Gully erosion analysis: why
geopedology matters? Geopedology, 24: 399–410.
Shokrlu et al., 2018
2482 Journal of Research in Biology (2018) 8(3): 2473 -2485

Bronick CJ and Lal R. 2005. Soil structure and
management: a review. Geoderma, 124(1-2): 03–22.
Chaney K and Swift RS. 1984. The influence organic
matter on aggregate stability in some British soils.
European Journal of Soil Science, 35(2): 223–230.
Gardner WR. 1956. Representation of soil aggregate
size distribution by a logarithmic-normal distribution
1,2. Soil Science Society of America, 20(2): 151–153.
Guo W, Shi ZH, Chen LD, Li CX, Yan LF and Cai
CF. 2007. Effects of topsoil aggregate size on runoff
and erosion at hillslope in red soils. Acta Ecologica
Sinica, 6: 2516-2522.
Hillel D. 1982. Introduction to soil physics. Academic
Press, San Diego. 392 p.
Janeau JL, Bricquet JP, Planchon O and Valentin C.
2003. Soil crusting and infiltration on steep slopes in
northern Thailand. European Journal of Soil Science, 54
(3): 543–544.
John B, Yamashita T, Ludwig B and Flessa H. 2005.
Storage of organic carbon in aggregate and density
fractions of silty soils under different types of land use.
Geoderma, 128(1-2): 63–79.
Karami A, Homaee M, Afzalinia S, Ruhipour H and
Basirat S. 2012. Organic resource management:
impacts on soil aggregate stability and other soil
physico-chemical properties. Agriculture, Ecosystems
and Environment, 148: 22–28.
Karimi H, Sufi D, Haghnia Gh and Khorasani M.
2007. Evaluation of aggregate stability and soil erosion
potential in loamy and sandy clay loam soils: a case
study Lamard-plain in Fars province. Journal of
Agricultural Sciences and Natural Resources, 14(1): 1-
10 p.
Kemper WD. 1965. Aggregate stability. in: black, CA.
(ed.), methods of soil analysis. American Society of
Agronomy, Madison, 511–519 p.
Kemper WD and Rosenau RC. 1986. Aggregate
stability and size distribution. in: methods of soil
analysis. part 1: physical and mineralogical methods. A.
Klute ed. No 9, 2nd ed. ASA, Madison, Wis, America.
Kemper WD and Chepil WS. 1965. Size distribution
of aggregates. in: black, ca. ed. methods of soil analysis.
American Society of Agronomy, Madison, 499–510 p.
Knighton D. 1998. Fluvial forms and processes: a new
perspective. Routledge. 31 p.
Lal R. 1990. Soil erosion and land degradation: the
global risks. Advances in Soil Science, 11: 129–72.
Lal R. 1994. Soil erosion research methods. Delray
Beach: St. Lucie Press. 340 p.
Li H, Han X, You M and Xing B. 2015. Organic
matter associated with soil aggregate fractions of a
black soil in northeast china: impacts of land-use change
and long-term fertilization. Communications in Soil
Science and Plant Analysis, 46(4): 405-423.
Liu XB, Zhang XY, Wang YX, Sui TT, Zhang SL,
Herbert SJ and Ding G. 2010. Soil degradation: a
problem threatening the sustainable development of
agriculture in northeast China. Plant Soil Environment,
56(2): 87–97.
Mbagwu JSC. 1989. Specific dispersion energy of soil
aggregates in relation to field and laboratory measured
stability indices and physical properties. Journal of East
African Agricultural and Forestry, 54(9): 173-183.
Movahedi Naini A and Rezai M. 2008. Soil physics
(fundamentals and application), Gorgan University
Press of Agricultural Sciences and Natural Resources,
474 p.
Pirmoradian N, Sepaskhah AR, Hajabbasi MA.
Shokrlu et al., 2018
Journal of Research in Biology (2018) 8(3): 2473 -2485 2483

2005. Application of fractal theory to quantify soil
aggregate stability as influenced by tillage treatments.
Biosystems Engineering, 90(2): 227–234.
Research Group on Chinese Soil Taxanomy
(RGCST). 2001. Chinese Soil Taxonomy. Science
Press, Beijing. 203 p.
Poesen J, Nachtergaele J, Verstraeten G and
Valentin C. 2003. Gully erosion and environment
change: importance and research needs. Catena, 50(2-
4): 91-133.
Rachman A, Anderson SH, Gantzer CJ and
Thompson AL. 2003. Influence of long-term cropping
systems on soil physical properties related to soil
erodibility. Soil Science Society of America, 67(2): 637-
644.
Reusser L, Bierman P and Rood D. 2015. Quantifying
human impacts on rates of erosion and sediment
transport at a landscape scale. Geology, 43(2): 171-174.
Simansky V, Tobiaˇsova E and Chlp´ık J. 2008. Soil
tillage and fertilization of orthic luvisol and their
influence on chemical properties, soil structure stability
and carbon distribution in water-stable macro-
aggregates. Soil and Tillage Research, 100(1-2): 125–
132.
Six J, Bossuyt H, Degryze S and Denef K. 2004. A
history of research on the link between (micro)
aggregates, soil biota, and soil organic matter dynamics.
Soil and Tillage Research 79(1): 7–31.
Six J, Elliott ET and Paustian K. 2000. Soil structure
and soil organic matter II. A normalized stability index
and the effect of mineralogy. Journal of Soil Science
Society of America 64(3): 1042–1049.
Soane BD. 1990. The role of organic matter in soil
compactibility: a review of some practical aspects. Soil
and Tillage Research, 16(1-2): 179–201.
Soinne H, Hyväluoma J, Ketoja E and Turtola E.
2016. Relative importance of organic carbon, land use
and moisture conditions for the aggregate stability of
post-glacial clay soils. Soil and Tillage Research, 158: 1
-9,
Spohn M and Giani L. 2011. Impacts of land use
change on soil aggregation and aggregate stabilizing
compounds as dependent on time. Soil Biology and
Biochemistry, 43(5): 1081–1088.
Spohn M and Giani L. 2010. Water-stable aggregates,
glomalin-related soil protein, and carbohydrates in a
chronosequence of sandy hydromorphic soils. Soil
Biology and Biochemistry, 42(9): 1505–1511.
Tajik F. 2004. Assessing the aggregate stability in parts
of Iran. Journal of Science and Technology of
Agriculture and Natural Resources, 8(1): 107-122.
Thomas JT, Iverson NR, Burkart MR and Kramer
LA. 2004. Long-term growth of a valley bottom gully,
western iowa. Earth Surf Process Land, 29: 995–1009.
Valentin C, Poesen J and Li Y. 2005. Gully erosion:
impacts, factors, and control. Catena, 63: 132–153.
Valmis S, Dimoyiannis D and Danalatos NG. 2005.
Assessing in Terrill erosion rate from soil aggregate
instability index, rainfall intensity and slope angle on
cultivated soils in central Greece. Soil and Tillage
Research 80(1-2): 139–147.
Van BC. 1949. Mean weight diameter of soil
aggregates as a statistical index of aggregation. Soil
Science Society of America, 14: 20–23.
Vandaele K, Poesen J, Govers G and Van Wesemael
B. 1996. Geomorphic threshold conditions for
ephemeral gully incision. Geomorphology, 16(2): 161–
173.
Vanwalleghem T, Poesen J, Van Den Eeckhaut M,
Shokrlu et al., 2018
2484 Journal of Research in Biology (2018) 8(3): 2473 -2485
Nachtergaele J and Deckers J. 2005. Reconstructing
rainfall and land-use conditions leading to the
development of old gullies. Holocene, 15(3): 378–86.
Von Lützow M, Kögel-Knabner I, Ekschmitt K,
Matzner E, Guggenberger G, Marschner B and
Flessa H. 2006. Stabilization of organic matter in
temperate soils: mechanisms and their relevance under
different soil conditions a review. European Journal of
Soil Science, 57(4): 426–445.
Wasson RJ, Olive LJ and Rosewell CJ. 1996. Rates of
erosion and sediment transport in Australia, Iahs
Publications. 236: 139-148.
Wustamidin L and Douglas A. 1985. Aggregate
breakdown in relation to raindrop energy. Soil Science,
139(3): 239-242.
Yoder RE. 1936. A direct method of aggregate analysis
of soils and a study of the physical nature of erosion
losses. American Society of Agronomy, 28(5): 337–351.
Zhang S, Li Q, Zhang X, Wei K, Chen L and Liang
W. 2012. Effects of conservation tillage on soil
aggregation and aggregate binding agents in black soil
of northeast China. Soil and Tillage Research, 124: 196-
202.
Shokrlu et al., 2018
Journal of Research in Biology (2018) 8(3): 2473 -2485 2485
Submit your articles online at www.jresearchbiology.com
Advantages
Easy online submission Complete Peer review Affordable Charges Quick processing Extensive indexing You retain your copyright
www.jresearchbiology.com/Submit.php