Embed Size (px)
Citation preview

MELBOURNESMARTCITY

© Arup 2010
C40 URBANLIFE: MELBOURNE SMART CITYPAgE 2
Contents
3 FoReWoRD
4 eXeCUtIVe sUMMARY
6 RoADMAp to A sMARt CItY
8 MelboURne sMARt CItY
8 Smart citieS
10 Why the Smart city?
11 NeW urbaN uSer experieNce
12 Smart city aS a SyStem
12 melbourNe’S GhG emiSSioNS profile
13 Smart behavioural chaNGe
14 melbourNe aS Smart city
15 Smart city StrateGieS
17 feedback loopS
17 example project ideaS
18 Next StepS
19 pRoJeCt IDeAs
20 one: 100 GREEN OASES
22 tWo: SEAmlESS mObility
24 tHRee: REAl-timE City mODEl
26 sMARt CItY CAse stUDIes
35 WoRKsHop VIsUAlIsAtIons
48 tHe WoRKsHop ItselF

C40 URBANLIFE: MELBOURNE SMART CITY PAgE 3
© Arup 2010
FOREWORD
mark Watts, Director, Arup
arup is proud to work with the city of melbourne and a select group of key stakeholders to produce this vision for ‘melbourne Smart city’.
at arup, we work hard to create solutions for cities that are characterised by smart, responsive simplicity, which both create more efficient infrastructure with a lower environmental impact, as well as more engaging, rewarding places for citizens to live and prosper.
our smart city framework addresses all these aspects, attempting to provide cities with a clear and comprehensive guide through the complexities of advanced ict and contemporary urban problems.
this is informed by our long history of working with cities, designing urban infrastructure both ‘hard’ and ‘soft’, and our ability to remain agnostic in terms of particular technology solutions.
putting this into practice, we are working with several major partners globally, both cities and developers, on interventions which will build a clear business case for transitioning to a smart city.
these solutions have a major focus on reducing greenhouse gas emissions and creating more sustainable cities in every sense, which is a clear priority for the city of melbourne. this motivation also drives arup, and we are extremely grateful for the chance to collaborate with the city to design this vision and roadmap for melbourne specifically. We also hope it may be of use to other c40 cities and beyond.
on behalf of the arup team, i would like to thank lord mayor robert doyle, and the city of melbourne team, including dr. kathy alexander, Geoff lawler, alex fearnside and matthew Willcox in particular.
We hope you enjoy this report, and find it useful in contributing to the future direction of the city.

© Arup 2010
C40 URBANLIFE: MELBOURNE SMART CITYPAgE 4
Cities are real-time systems, but rarely run as such. Governance models remain
in the 20th century, while citizens increasingly have access to 21st century tools predicated on the increasingly ubiquitous avail-ability of internet, smartphones and tablets, social media and so on. A city’s operational and planning decisions are generally based on snapshots and averages rather than the ongoing monitor-ing, insightful visualisations, and constant feedback loops that contemporary information and communications technologies (ICT) enable. While there are fundamental differences between running a city and, say, running Amazon.com, they are perhaps fewer than has been assumed.
this report outlines many of the opportunities for cities afforded by these contemporary technologies, indicating how the ‘smart city’ approach might fundamentally transform the way that cities are governed, operated, interacted with and experienced, particularly with the focus on reducing greenhouse gas emissions and becoming sustainable in the broadest sense, including in economic terms, with new jobs generated in ‘green technologies’ and ict-related activities.
amidst the vast array of various options and possibilities, which this report will attempt to cut through and organise, perhaps the core message is that now is the time for cities to assess the potential of these technologies, such that it can lead the transformation on their own terms, rather than ‘be transformed’ as some key business and cultural sectors have been.
EXECUTIVE SUMMARY
as such, the c40 urbanlife workshop, which arup delivered for city of melbourne in march 2010, describes an initial approach to understanding this new ‘soft infrastructure’ of the city, seeing the city as a system in an ‘ecological age’ vision, enabling behaviour change and demand management through urban informatics as well as deploying efficient operation and governance.
arup’s Smart city framework indicates how ‘urban informatics’ can be engaging public interfaces onto the city and its behaviour, whilst ‘urban information architecture’ can address the organisational layers behind these interfaces. in turn, these layers are fed with data from numerous sources, via ‘instrumented’ systems. taken together, all three layers describe how a city’s governance, operations and experience might be transformed, as part of an over-arching resilient urban sustainability strategy. this also implies a profound shift in the value inferred on ict within organisations and culture.
the particular focus here is melbourne’s GhG emissions, which do not compare favourably with cities worldwide. this, and a series of other organisational and operational challenges facing cities provide the impetus for assessing this subject, combined with the advances in ict described here. in fact, the answer to the former may partly lie in the latter. by mitigating resource demand through increasing engagement, and through more effectively running the city through performance-based measures, the smart city framework describes many of the core components of the newly-resilient sustainable city.

C40 URBANLIFE: MELBOURNE SMART CITY PAgE 5
© Arup 2010
MICHELLE is waiting for the imminent 07:23 tram from St. Kilda to the city but you wouldn’t know it.
She glances idly at the iPad on the table in front of her and sips the last of her espresso. The iPad’s screen indicates a small green dot moving slowly down a map of the area.
The app, powered by the City of Melbourne and State Government’s joint open data joint initiative, indicates all her mobility choices, organised around her daily patterns. In this case, it shows her she’s got two minutes to get to the tram stop a few metres away, and that the tram is only half-full.
“It’s funny,” Michelle says, “This is exactly the same tram service I had four years ago, but it now feels like a better service. All because I feel in control of it. Because I have the information at hand, I can make the right decisions. For me.”
This is a sentiment increasingly echoed by many Melburnians, and not just limited to transport. Across many walks of life in the city, and many daily activities, the city of Melbourne suddenly feels like its infrastructure is as contemporary as that of Singapore, Seoul and Shanghai to the north.
As a result of the initia-tives set in place give years ago by the then-Lord Mayor Robert Doyle, Melbourne
can genuinely claim to be a ‘smart city’.
A key early intervention was to connect together the city’s various public transit systems via the Myki system, which can now be accessed via smartphones as well as smart cards. While investment in public transport infrastructure has also increased, the shift in the experience of using it is what has had Melburnians returning to public transport in droves. Trams, buses and trains are now comfortable, switched-on experiences which offer services for commuters and others that private cars simply cannot match.
Yet congestion on the roads has also abated due to this up-tick in public transport use and smarter systems managing traffic flow and parking in the city.
The effect on the city’s carbon footprint is immediately visible in the landmark installations installed in and around many city streets.
These displays—at once public art and urban interface—have become hugely popular with visitors, tourists and residents, and variously provide informative and entranc-ing insights into how Melbourne is performing. A particular favourite seem to be the sound installations along the Yarra, which not only indicate noise levels in the city, but also mash-up the sounds of buskers in real-time, the number of different languages being spoken at key points in the city, whilst piping in the
sounds of other connected world cities from time to time, chosen on the basis of their real-time internet con-nectivity with the city. Walk past and you hear snippets of Shanghai and Seoul, The Beatles and Lady Gaga, Flinders Lane and the footy from AAMI Park. It literally speaks of Melbourne in the 21st century.
The roll-out of free public wi-fi across the city, combined with some bespoke Council-run co-working hubs, has led to people being able to shift much of their work closer to where they live, with numerous benefits in terms of health, sociability, traffic and carbon.
Importantly, under-standing carbon had been brought to the forefront of peoples’ lives throughout a series of activities and services for Melburnians. Some of these build on smart meter data, while others draw from the huge numbers of other sensors, which are easily identifiable in City of Melbourne livery and dotted around the city.
It’s unclear where all this might end. Municipal waste collection has been radically improved due to better data. Complaints to the City are down, as many citizens are able to collaborate on ‘urban fixes’ through their own neighbourhood portals, yet the complaints that are made can be tracked in detail and are used strategically by the city.
Activity on city streets has increased, thanks to the wi-fi augmenting the city’s
How we became a smart city Melbourne has transformed the way it lives, works, and playsBy Mark Sharp and Abi Davis
Special edition
already-excellent street furniture and urban design, as well as programs like the 100 Oases project, which has seen the city’s ‘green infrastructure’ heavily used and carefully maintained by a connected ‘Green Army’ of volunteers.
Numerous other social innovation campaigns are being coordinated online, many of which are powered through the City’s web services and open data feeds.
The ‘Real-time Melbourne’ city model has become the core interface for citizens, app-makers, government strategists, and other cities, all keen to learn from how Melbourne has wrangled its data into smooth-running public services and urban experiences.
This combination of better city services and better visualisations conveying the way the city is performing has helped make real progress against the city’s previously unenviable carbon profile.
While some have questioned whether the Melbourne Smart City program should have been a municipal priority, few have actually criticised the approach in practice, particularly when it became clear how quickly and cheaply— relatively—the experience of living in Melbourne could be transformed through smart technologies.
Through a considered combination of these technologies, and people-centred and
joined-up governance perhaps unusual to Australia, Melbourne managed to demonstrate how a series of rapid-fire exemplar projects might quickly coalesce to form better public services, and become something bigger than the sum of its parts.
While it clearly enables a more efficient form of government, it also seems to suggest an expanded role for government into places the private sector wouldn’t reach. Melburnians ultimately do seem to trust the City with their public data—at least compared to the alternative. Smart and professional handling of privacy and the ethics sur-rounding data capture has probably been instrumental here.
This public data has then been made available to app developers and others—via Real-time Melbourne—such that the average punter in Melbourne has access to an extraordinarily rich set of apps that provide new interfaces and activities onto their city.
It has also meant that Melbourne is now recognised globally as a key city in terms of software development and urban innovation. The tech sector here is thriving, and in ways that are obviously beneficial to citizens over and above its direct economic impact.
Michelle waves as she skips up onto the tram, pleased that her app delivered accurate results. Not least because she designed it herself.
Bikes in the City’s smart home delivery service Picture Dan Hill
Continued page 6
MELBOURNE
DAILY REPORTER.Monday 18th May 2015 Two dollarsPublished in Melbourne since 2010
Weather Warm, sunny Air quality Good Economy Upbeat Social media Strong

© Arup 2010
C40 URBANLIFE: MELBOURNE SMART CITYPAgE 6
ROADMAp TO A SMART CITY
The Age article on the preceding page is fictional, describing a vision of a Melbourne of the near future, in less than five years time.
The illustrative roadmap on the following page indicates how this vision might become reality..

C40 URBANLIFE: MELBOURNE SMART CITY PAgE 7
© Arup 2010
SEAMLESS MOBILITY Myki++ service scoping
Integration of idea into transport strategy review
SEAMLESS MOBILITY Prototyping of Myki++ service across bike/car-sharing
SEAMLESS MOBILITY Retrofit of existing stations/stops and all vehicles
Development work on existing Myki system for trams, buses, trains
SEAMLESS MOBILITY Ongoing retrofit of existing stations/stops and all vehicles
Ongoing develop-ment work integrat-ing data from multiple modes
SEAMLESS MOBILITY Extension of programme to Boxhill, Coburg and Footscray and development of plans for further areas
Full implementation of retrofitted sta-tions/stops/vehicles and coherent data/interface sharing across all modes
BUILDING DATA RETROFIT Kit of parts for visualisation opened to 1200 Buildings programme
Ongoing iterations of visualisations in existing CoM buildings
BUILDING DATA RETROFIT Kit of parts for visualisation and data-sharing opened to all built fabric, including residences and infrastructure
BUILDING DATA RETROFIT Scoping and vision/strategy work
Prototypes of building performance visualisation across CoM buildings
BUILDING DATA RETROFIT Extension of visualisations across majority of CoM buildings
GREEN INFRASTRUCTURE Extension of trials across several sites in city
GREEN INFRASTRUCTURE Majority of ‘100 Oases’ installed across city
Public art pro-gramme based on green infrastructure performance
Free public wifi installed across all 100 Oases
GREEN INFRASTRUCTURE Free public wifi extended beyond 100 Oases
Urban informatics-led public art designed for key public spaces
CITY MODEL Joint research proj-ect with university sector to co-develop real-time city model
Data from green infrastructure, seamless mobility and building retrofit programmes stored/accessed coherently
CITY MODEL Real-time city model prototype in use across CoM (integration of existing data sets and City Research programmes)
CITY MODEL Real-time city model prototype in use across CoM (integration of existing data sets and City Research programmes)
Initial integration of public feedback loops into city model, enabling public participation as well as real-time data feeds from citizens
Open interface on city model is published to enable external participation (apps, feeds etc.)
CITY MODEL Model exists as real-time platform for public participation, live data, holistic ‘what if’ analysis on aspects triple bottom-line sustain-ability as well as secure data storage
Begins to transform development pro-cesses by enabling ongoing modelling of performance of urban fabric
GREEN INFRASTRUCTURE Prototype trials of green infrastructure across several sites in the city
CITY MODEL Analysis of existing models
Requirements gathering
Initial data from green infrastructure prototypes stored/accessed coherently
ORGANISATION Appointment of new CIO in CIO+ mode
ORGANISATION CIO+ refines opera-tional and strategic ICT functions across CoM
Melbourne Open Data initiative launched
ORGANISATION Joint legislative initiative with State Government to ensure data from all smart metering can be captured
Open data initiative enables public art platform that begins to transform streets
Other departments (Tourism, Economic Development) as-sessed in terms of ‘smart city transfor-mation’
ORGANISATION Continued joint initiatives with State Government to share data from user-centred perspective
Creation of new department focused solely on interface(s) with citizens
‘MOD’ enables international data visualisation festival
ORGANISATION Development work on organisational strategy (depart-ments, functions, processes, branding) implied by smart city
2010 2011 2012 2013 2014

© Arup 2010
C40 URBANLIFE: MELBOURNE SMART CITYPAgE 8
the challenges of climate change, population growth, demographic change, ur-
banisation and resource depletion mean that the world’s great cities need to adapt to survive and thrive over the coming decades. Slash-ing greenhouse gas emissions to prevent catastrophic climate change while maintaining or increasing quality of life could be a costly and difficult process. There is an increasing interest, therefore, in the role that information and communications technologies could play in transforming existing power-hungry metropolises into low-carbon cities of the future. But, as yet, no one city has fully grasped the possibility of becom-ing a ‘smart city’...
arup and the city of melbourne worked together to produce a workshop under the c40 urbanlife programme in march 2010. the workshop addressed the possibilities of a ‘smart city’ in terms of reduction of greenhouse gas emis-sions as part of a broad urban sustain-ability agenda.
particular focus was placed on the possibilities of enabling behavioural change via community engagement using contemporary information and communications technologies (ict). the subject of that focus is generat-ing a resilient, sustainable urbanism, primarily centred initially on helping to reduce melbourne’s greenhouse gas emissions, but also drawing in other aspects of sustainability (mobility, food systems, economic development and so
MElbOURnE SMART CITY
on.) additionally, focus was placed on making better use of city of melbourne’s existing and possible data, to better understand the impact of policy and to improve management and services.
sMARt CItIes
the idea of the workshop was to explore and test the possibilities of contemporary ict in transforming the city into a ‘smart city’.
a smart city is one in which the seams and structures of the various urban systems are made clear, simple, responsive and even malleable via contemporary technology and design. citizens are not only engaged and informed in the relationship between their activities, their neighbourhoods, and the wider urban ecosystems, but are actively encouraged to see the city itself as something they can collectively tune, such that it is efficient, interactive, engaging, adaptive and flexible, as op-posed to the inflexible, mono-functional and monolithic structures of many 20th century cities.
this is not simply a philosophical aspiration but can directly address core strategic drivers, such as reducing costs or greenhouse gas (GhG) emissions, and increasing competitiveness.
key to this is the idea of measure-ment; of infrastructure, buildings and activities reporting their state and be-haviour to systems that learn and adapt in response. these systems could be technological, legislative or social. the maxim “if you can’t measure it, you can’t manage it” applies here, and so the idea that urban fabric and activity can be

C40 URBANLIFE: MELBOURNE SMART CITY PAgE 9
© Arup 2010
being transformed by the internet, and businesses themselves increasingly understand and position themselves as data-driven organisations. this often entails moving information manage-ment, and its associated ict, from a back-room activity right to the front of organisations, in which they are reconceived as key strategic drivers. if the city is to be increasingly run on data, ict can become a major tool of public policy in smart cities.
the smart city vision does involve hard infrastructure—such as introduc-ing smart grids alongside various forms of renewable energy generation, and building new systems of mobility based on distributed networks—but is perhaps primarily articulated through ‘soft infra-structure’ i.e. social networks and com-munities, legal and cultural systems, various forms of ict. this fast-moving layer is perhaps more approachable and appealing for cities, offering a way to quickly ‘retro-fit’ existing buildings and infrastructure with smart elements at relatively low-cost, whilst planning carefully for the longer-term shift to the ‘heavier’ forms of smart infrastructure.
equally, the output of such thinking, through the emerging medium of urban informatics, can often be engaging, informative, even beautiful, realised in the form of increasingly refined audio-visual displays and interfaces, installa-tions, websites and systems, all driven via these real-time learning layers overlaid onto the existing city. this has the effect of ‘making the invisible vis-
‘instrumented’ and measured in detail, and acted upon in instantly, enables a new form of management, operation and engagement, perhaps equivalent to the difference between a traditional high-street bookstore and amazon.com. the latter is a constantly shifting, scalable system that is automatically generated ‘on the fly’ by constant learning from millions of interactions in near-real-time, within a framework that enables both top-down intervention and bottom-up organisation.
every single interaction within amazon.com reconfigures the offering in real-time. the offering itself is largely constructed from the actions of its users, such that it near-effortlessly moulds itself around the apparent desires of its users. for policy-makers, often accused of being out-of-touch, and only capable of taking the temperature of their citizens via ad-hoc, expensive opinion surveys or unrepresentative focus groups, this level of engagement seems impossible, yet the smart city vision en-tails a similar shift in thinking. ict gives city governments a way of involving citizens more directly in the direction and operation of their city, and by doing so, creates a platform through which the city can learn from their actions.
yet even though the city is also a form of distributed, even emergent real-time system in reality, it is rarely run as such. most city governments retain the structure and operational modes of the 20th century city.
in contrast, many if not all contem-porary business and cultural sectors are
eCoMAp
Urban ecoMap is an interactive web service that displays environmental footprints for Amsterdam and san Francisco. (footprint comprises Co2 emissions, waste and transportation activity, broken down by postal code.)
Created by Cisco and others, ecoMap attempts to raise awareness and build community activity around reduction of GHG emissions.
HARD INFRASTRUCTURESOFT INFRASTRUCTURE
If a soft city can be retrofitted onto the existing city, what soft infrastructure does a city build?

© Arup 2010
C40 URBANLIFE: MELBOURNE SMART CITYPAgE 10
gap at the local level, but who also suffer from an inability to scale, an inability to connect.
We might also compare this with emergence of new media and social media-based services that have trans-formed apparently unrelated sectors, such as facebook or itunes for example, which not only have levels of engage-ment that city governments might only dream of—33% of the australian popula-tion is on facebook alone; 25% of all mu-sic sales in the uS are through itunes alone; both these services are only six and seven years old respectively—but also indicate a new kind of system, one that is user-centred, responsive, real-time, flexible, local and global, pervasive, location-based, platform-based, and so on. compared to these new kinds of systems, how do existing city systems stack up?
this perhaps implies that the expec-tations of citizens will become increas-ingly key. perhaps the city’s systems will seem ‘broken’ in comparison, unless they too evolve?
however, it also implies that this evolution of technology is something that city governments can also take advantage of. these internet-based systems are predicated on a kind of connectivity quite different to the traditional corporate it department and is almost becoming a de facto standard that defines how systems in general should be.
So this presents both a challenge and an opportunity to cities, in that citizens
ible’ thus raising awareness about urban infrastructure, activity and ecosystem.
WHY tHe sMARt CItY?
the benefits of pursuing a smart city strategy are manyfold. the necessity of doing so is becoming increasingly obvious, to both cities and citizens.
harvard business School academics rosabeth moss kanter and Stanley S. litow have described a ‘smarter city manifesto’ in order to address the many problems facing city governments in particular1. With a slant towards North american cities, the authors outline issues such as the silo-based structures governments ended up with at the end of the 20th century, combined with the inability of governments to stretch their services over the large sprawling distances and conditions of the contem-porary city, a weakened civic leadership, and a focus on delivery rather than addressing the cause of problems (described as a lack of ‘strategic impact orientation’).
this can leave city governments in a position where they are unable to scale, where they are inefficient in delivery, where they are unable to create holistic, interconnected services due to a fragmented approach to strategic data, branding, operations and management.
kanter and litow compare this with the not-for-profit or social innovation sector, who have been able to plug the
1 “Informed and Interconnected: A Manifesto for Smarter Cities”, Rosabeth Moss Kanter and Stanley S. Litow, Harvard Business School Working Paper 09-141, 2009
tRAsHtRACK
Developed by MIt’s senseable Cities lab, trashtrack is an experimental use of wireless sensor networks to trace the movement of waste in the city.
Using simple mobile phone technology, sensors are attached to consumer waste products, such as aluminium cans or coffee cups. the sensors report the location of the object in real-time, as it embarks on its journey to landfill or recycling. this is then visualised and mapped, indicating how such techniques can provide insight into otherwise imperceptible urban processes.
Will contemporary ICT transform city services and government, as it is other sectors?
CITY GOVERNMENT
+ URBAN SERVICES
LOGISTICS RETAILMEDIA
DESIGNHEALTH ADVERTISING
INTERNET- OR REAL-TIME INFORMATION-BASED TRANSFORMATION
C40 URBANLIFE: MELBOURNE SMART CITY PAgE 11
© Arup 2010
may increasingly expect urban systems to behave how the other systems in the rest of their life behave, but also that a city’s ict services could also take advantage of these contemporary approaches.
neW URbAn UseR eXpeRIenCe
What might this mean in practice? the smart city is already around us all the time, to some extent2. urban infra-structure now includes smartphones, wireless internet, netbooks and tablets, media façades, sensor networks, smart meters, rfid tags and so on, upon which sits a rich layer of sophisticated user experiences, comprising social media like twitter and foursquare, ‘apps’ and maps and augmented reality, as well as so-called ‘e-government’ services.
however, the smart city also de-scribes a step-change in both intensity and extent of connection, in that almost all aspects of infrastructure—from transit networks to energy, waste and water; from housing to street trees—can wirelessly broadcast their state and activity in real-time through the use of robust, cheap and discreet sensors. this concept is known as ‘the internet of things’, in which almost every inanimate object can become aware to some degree. as with contemporary engine control systems, smart urban infra-structure can tirelessly watch its own operation, predicting faults before they
2 “The Street As Platform”, Dan Hill, in best Technology Writ-ing 2009, Steven Johnson (ed.), Yale University Press, 2009. Also published at http://cityofsound.com/blog/2008/02/the-street-as-p.html
occur, optimising delivery of resources or services to match demand.
equally, sensors can be placed on ex-isting infrastructure, as in installations that monitor water quality or air quality or mobile phone data revealing patterns of movement of people in the city.
multiply this by the increasing interest in both individual citizens and communities logging their own descrip-tive data about their lives and activi-ties3, and by a vast and varied range of technologies of both input and output, and the smart city emerges as a vision in which almost every urban activity is enabled by pervasive, wireless technol-ogy.
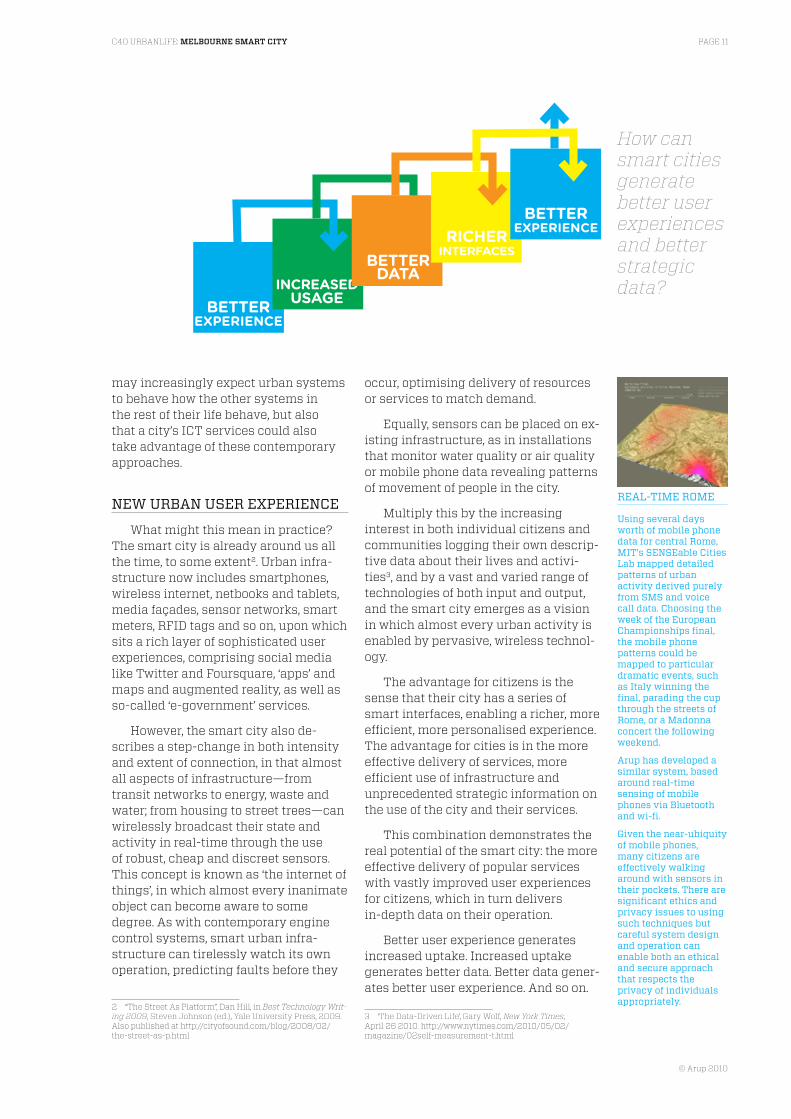
the advantage for citizens is the sense that their city has a series of smart interfaces, enabling a richer, more efficient, more personalised experience. the advantage for cities is in the more effective delivery of services, more efficient use of infrastructure and unprecedented strategic information on the use of the city and their services.
this combination demonstrates the real potential of the smart city: the more effective delivery of popular services with vastly improved user experiences for citizens, which in turn delivers in-depth data on their operation.
better user experience generates increased uptake. increased uptake generates better data. better data gener-ates better user experience. and so on.
3 ‘The Data-Driven Life’, gary Wolf, new York Times, April 26 2010. http://www.nytimes.com/2010/05/02/magazine/02self-measurement-t.html
How can smart cities generate better user experiences and better strategic data?
BETTER EXPERIENCE
INCREASED USAGE
BETTER DATA
RICHER INTERFACES
BETTER EXPERIENCE
ReAl-tIMe RoMe
Using several days worth of mobile phone data for central Rome, MIt’s senseable Cities lab mapped detailed patterns of urban activity derived purely from sMs and voice call data. Choosing the week of the european Championships final, the mobile phone patterns could be mapped to particular dramatic events, such as Italy winning the final, parading the cup through the streets of Rome, or a Madonna concert the following weekend.
Arup has developed a similar system, based around real-time sensing of mobile phones via bluetooth and wi-fi.
Given the near-ubiquity of mobile phones, many citizens are effectively walking around with sensors in their pockets. there are significant ethics and privacy issues to using such techniques but careful system design and operation can enable both an ethical and secure approach that respects the privacy of individuals appropriately.
© Arup 2010
C40 URBANLIFE: MELBOURNE SMART CITYPAgE 12
oriented around users, which intrinsi-cally enables interoperability and lateral connectivity, which intrinsically binds disparate structures together rather than allowing them to float free of each other.
So the idea of the smart city has become important not simply due to the emergence of the internet over the last two decades but also due to political, organisational, social, cultural and spatial challenges now facing city governments.
While smart city thinking can address virtually every walk of life, as indicated by the internet’s extraordinary reach, climate change has substantially focused the thinking around smart cities in terms of reducing GhG emissions. melbourne is no exception.
MelboURne’s GHG eMIssIons pRoFIle
melbourne’s principal strategy for carbon emission reduction, ‘Zero Net emissions by 2020’ (hereafter referred to as ‘Zeronet’), is part of a wider series of holistic strategic initiatives address-ing urban sustainability4.
however, even when taking into account the complexities of municipal boundaries affecting the city of mel-bourne (and most other australian cities), projections comparing the city to equivalent cities — for example, toronto, london, New york, São paulo — it is
4 City of Melbourne Environmental Policies http://www.melbourne.vic.gov.au/AboutCouncil/PlansandPublications/strategies/Pages/Environmentalpolicies.aspx
sMARt CItY As A sYsteM
contemporary thinking about the integrated sustainable city—of the city as a system—can only be turned into reality with a smart, integrated ap-proach to both delivery and strategy.
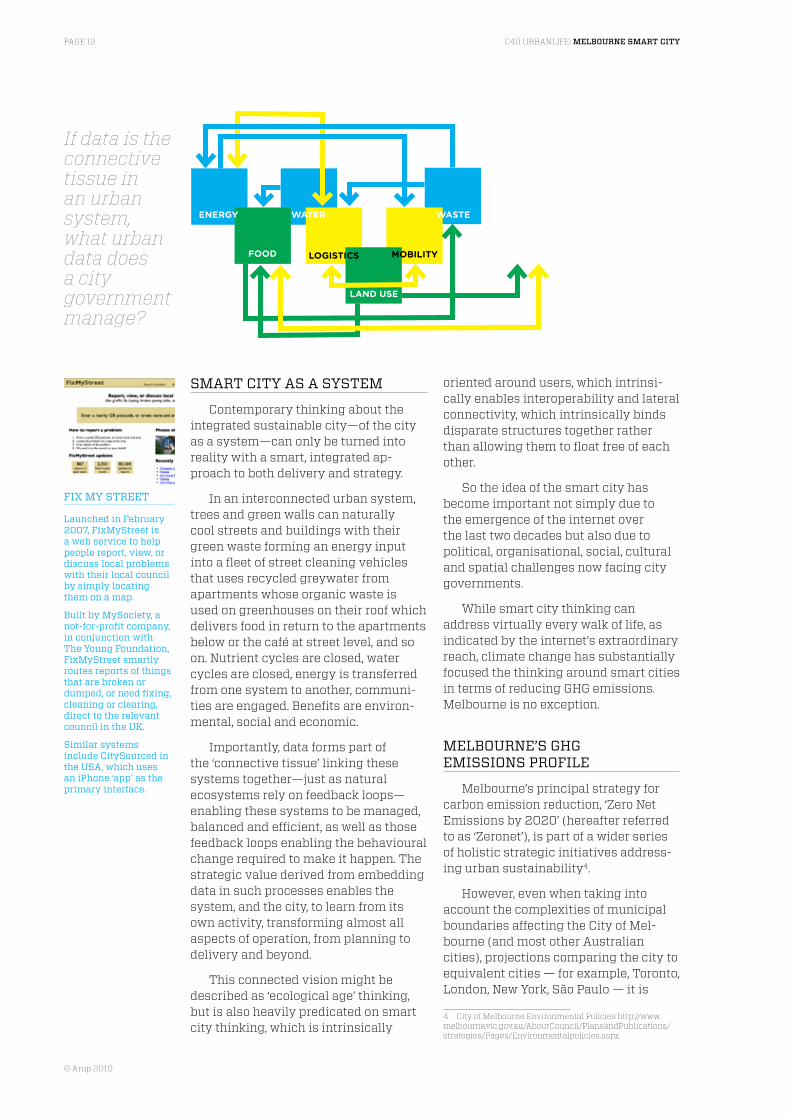
in an interconnected urban system, trees and green walls can naturally cool streets and buildings with their green waste forming an energy input into a fleet of street cleaning vehicles that uses recycled greywater from apartments whose organic waste is used on greenhouses on their roof which delivers food in return to the apartments below or the café at street level, and so on. Nutrient cycles are closed, water cycles are closed, energy is transferred from one system to another, communi-ties are engaged. benefits are environ-mental, social and economic.
importantly, data forms part of the ‘connective tissue’ linking these systems together—just as natural ecosystems rely on feedback loops—enabling these systems to be managed, balanced and efficient, as well as those feedback loops enabling the behavioural change required to make it happen. the strategic value derived from embedding data in such processes enables the system, and the city, to learn from its own activity, transforming almost all aspects of operation, from planning to delivery and beyond.
this connected vision might be described as ‘ecological age’ thinking, but is also heavily predicated on smart city thinking, which is intrinsically
If data is the connective tissue in an urban system, what urban data does a city government manage?
LAND USE
FOOD MOBILITYLOGISTICS
WATERENERGY WASTE
FIX MY stReet
launched in February 2007, FixMystreet is a web service to help people report, view, or discuss local problems with their local council by simply locating them on a map.
built by Mysociety, a not-for-profit company, in conjunction with the Young Foundation, FixMystreet smartly routes reports of things that are broken or dumped, or need fixing, cleaning or clearing, direct to the relevant council in the UK.
similar systems include Citysourced in the UsA, which uses an iphone ‘app’ as the primary interface.

C40 URBANLIFE: MELBOURNE SMART CITY PAgE 13
© Arup 2010
the relationship between behavioural change and such approaches.
building on the need to address emissions and the potential of a smart infrastructure for engagement and management, a core premise is that people make bad decisions due to poor information and that with better infor-mation, behaviour change will follow, which can cut emissions and increase quality of life.
this premise is supported by behavioural psychology research that indicates two key drivers of behavioural change are ‘active learning’ and ‘social proof’ i.e. trying something out, and seeing others doing it too. contemporary ict, such as social media, can enable this self-learning and self-reflection, as well as reinforce these broader social patterns; making ‘social proof’ visible, essentially. drawing out these wider civic patterns of use may balance the individualising tendencies of only see-ing personal data, say via smart meters, as well as leading to greater behavioural change.
a precedent also exists in terms of water use in australia, where significant behavioural change has been achieved through a combination of regulation (restrictions) and information (more focused and contextualised information on usage, sometimes indicating an individual’s performance in a wider social context or against targets set for the city). household water use dimin-ished by 7% from 2000-01 to 2004-05, despite an increase in population during this period. (it’s worth noting that
clear that both total and per capita emissions for melbourne are projected to remain higher than for many of its counterparts.
a major contributing factor to this is the contribution of coal to australia’s energy generation, yet the relatively low take-up of public transport and relatively high energy use from home appliances are also key contributors.
Given these last two ‘demand-side’ factors, amongst others, the workshop focused on this sector in terms of possible solutions, not least as the area of behaviour change is often omitted from urban sustainability strategies (e.g. Zeronet itself, or climateworks’ recent low Carbon Growth Plan for Australia5 etc.)
sMARt beHAVIoURAl CHAnGe
as discussed, the area of smart cities encompasses a number of different technology-led or -enabled advances, running from the hard infrastructure of smart grids through to a soft infrastruc-ture of community engagement.
the c40 urbanlife workshop was pitched largely between this hard and soft infrastructure, rather that focusing on one or the other. ‘Smart cities think-ing’ also addresses the new products, services, protocols, and governance lay-ers enabled by these contemporary ict, and so the area also addresses organi-sational and cultural aspects, including
5 low Carbon Growth plan for Australia, ClimateWorks, 2010. http://www.climateworksaustralia.com/low_carbon_growth_plan.html
If people make bad decisions because of poor information, is the opposite true?
2004-05
+1.4%POPULATION
HOUSEHOLD WATER USE
-7%
2000-01
CAbspottInG
Cabspotting, by san Francisco exploratorium and design firm stamen, traces san Francisco’s taxi cabs as they travel throughout the bay Area. the patterns traced by each cab create a real-time map of patterns of movement and urban activity across the city.
the data is derived from Gps tracking devices fitted into Yellow Cabs and used by dispatchers.
numerous visualisations have been produced based on the data, all exploring what insightful information about the city can be derived from apparently mundane data.

© Arup 2010
C40 URBANLIFE: MELBOURNE SMART CITYPAgE 14
this action was in response to severe drought i.e. a clear and present external environmental signal.)
balancing reports of waning public interest in government policies ad-dressing climate change in australia, the large number of ict-enabled community-driven initiatives is proof of a strong appetite amongst citizens for their cities, and for forms of urban sustainability.
While many cities have been reluc-tant to directly address the possibility of sustainability-related behaviour change amongst citizens, perhaps understand-ably given their history and culture, some cities are beginning to realise that it could significantly contribute to both a more sustainable city and a higher qual-ity of life. london is expecting that 30% of its reduction in carbon emissions will be driven by behavioural change. in helsinki, the low2No project explicitly states that 50% of a citizen’s carbon footprint concerns lifestyle choices and has launched an informatics-enabled behavioural change workstream accord-ingly.
other sectors, such as media, marketing, product/service design, social innovation and non-profits, aim to enable behavioural change as a core mission. although they might have different motives and drivers, cities can also use these tools to effect more sustainable urban systems.
accordingly, the city of melbourne has now expressed an aspiration to build upon these kinds of active
engagement via ict, such that both ‘social proof’ and the so-called ‘network effect’ enable a wider, deeper, more meaningful engagement between citizens and their city.
MelboURne As sMARt CItY
melbourne is well-placed to lead in terms of developing itself into a ‘smart city’ for a number of reasons. these include the strength of the city in terms of knowledge industries and a particu-larly strong higher education sector, a background in technical innovation including industrial design, an emerg-ing new media sector, and a world-renowned focus on urban design and the quality of the urban environment.
building on this, the c40 urbanlife workshop and associated outputs has now demonstrated an approach to developing a Smart city vision and strategy centred on melbourne, as detailed in this report.
equally, few cities are yet to demon-strate coherent, holistic thinking about the possibilities of smart cities. recent years have witnessed advances around ‘open data’ and ‘open government’ or ‘government 2.0’ in several cities, and while have been innovations in par-ticular areas—around cultural centres, transit or community engagement, for example—few cities have consolidated and communicated a genuinely all-encompassing smart cities vision and strategy.
Is IT too important for the IT department?
1 Head of IT Corporate IT Provide IT services to city employees
2
3CIO eGovernment Provide city services online to citizens
CIO+ Smart City Address city’s major strategic issues
tRACInG VelIb’
Researcher Fabien Girardin has created a visualisation of daily usage patterns for both the bicing bike-sharing network in barcelona, and its equivalent, Velib’, in paris.
Using a technique known as ‘scraping’, Girardin used the data published on the bike-sharing network websites, indicating the number of bikes left at each hub. He then overlaid a simple excel-style visualisation over a Google Map of the city, creating an animation of how the bikes move around the city.
In this way, it’s easy to see, for example, how the bikes in barcelona move from the city to the beach and back again, on a sunny sunday afternoon, or how the bikes shift in and out of the centre of paris around lunchtime. simple daily patterns are perceptible in the performance of infrastructure, and such data can be drawn simply from municipal websites.

C40 URBANLIFE: MELBOURNE SMART CITY PAgE 15
© Arup 2010
ARCHITECTURE ORGANISATION
time was spent creating and developing opportunities for possible smart city projects in the city.
emerging from this, and other smart city projects arup has been involved with, it is possible to discern three interlinked component parts of a smart city vision, each of which is necessary to complete the holistic view of the smart city. (it should be noted that any smart city strategy is itself necessarily inte-grated into other strategies i.e. mobility, sustainability, economic development and so on.)
the overarching framework or layer is that of urban information architec-ture. this describes the most obviously organisational set of activities, from the procurement, design and operational models of ict services and infrastruc-ture through to the shape, profile and staffing of the city government itself. the implication here is that the smart city is so different in essence to the 20th century city that the governance models and organisational frameworks themselves must evolve.
in simple terms, cities will have a housing strategy, a transport strategy, a sustainability strategy and so on, yet the it strategy, if it exists, will tend to be focused on streamlining administration, cutting basic operational costs and perhaps internal knowledge manage-ment. yet when it is so integral to the functioning of the 21st century city, why would this not assume a similar level of significance as those public-facing strategies? particularly if it enables more effective ways of delivering
as a result, it can be argued that no major city has as yet taken advantage of the possibilities afforded by both contemporary understanding of ‘the city as a system’ and the synergies, efficien-cies and creative possibilities enabled by smart cities thinking.
melbourne could play an important catalyst role in terms of capturing and developing the thinking that emerged from the c40 urbanlife workshop, such that it outlines a way forward for both the city itself and for other cities with similar opportunities.
the outcome may not simply be in directly enabling reductions in GhG emissions. as cities increasingly compete with each other, and reinforce their positions as the primary drivers of economic activity, city brands become ever more important. cities which are perceived to be leaders in both urban sustainability and smart city thinking are only likely to benefit in terms of international competitiveness.
equally, there will be economic activity associated with creation and operation of smart city services. the challenge now is to create a strategic framework by which these various activities might be aligned and encour-aged.
sMARt CItY stRAteGIes
While the workshop’s activities included setting the scene both in terms of melbourne’s emissions and the possibilities of the smart city, significant
How should a smart city organise itself? What departments exist in the 21st century city government?
INFORMATICS INTERFACE
MeDIAlAb pRADo
the media façade offers the opportunity to create feedback loops into civic spaces. Here, the Medialab prado’s well-designed leD display is integrated into the form of the building and the content is integrated into the programming of the organisation. Here, the feedback loops concern the work created by the organisation rather than any particular sustainability information, yet indicate how informatics might highlight and reinforce patterns of work and play as well as infrastructure.
INFRASTRUCTUREINSTRUMENTATION

© Arup 2010
C40 URBANLIFE: MELBOURNE SMART CITYPAgE 16
of their chief information officer (cio). yet there is far more to it than one role. So an urban information architecture may be required to help the city in defin-ing projects, making decisions about outsourcing, procurement and technical design, operational frameworks and management, organisational structure, data protocols and policies. it trans-forms a smart city vision into strategy.
Within a smart city, urban informat-ics plays the role of making data tan-gible, by creating design-led interven-tions, often drawing from real-time data on urban activity. it provides the new interfaces through which citizens can engage with their city. it encompasses web and mobile services, urban-scale displays, installations within architec-ture and infrastructure, and extends from analytical dashboards to public art.
examples might include feedback loops on energy consumption or envi-ronmental quality, real-time transport information, visualisations of traffic, network activity or food miles and so on (case studies are dotted throughout this report). Not all of these examples need be commissioned, managed or owned by city governments—indeed, a contemporary approach might be for a public body to publish and manage civic data, upon which others could build.
this layer is the most obvious to citizens, and so it is through informatics that activities enabling behavioural change might be effected and coordi-nated. urban informatics is the public interface onto the smart city.
those strategies. an urban information architecture would describe how this might occur.
this involves a strategic re-framing of how ict is thought of in the organisa-tion. at one level it needs to re-badge ict itself. Within australian culture, it is usually described as ‘it’, and taken to mean those back-room administrative operations, somewhat subservient to other more strategic functions.
yet this doesn’t reflect the con-temporary cultural status associated with internet-based communications technology.
in other words, can we really de-scribe a teenager updating her facebook status from her mobile as she walks down the street as ‘it’? technically, it might be, but it is also obviously deeply social and cultural, highly-valued and intimate, increasingly a core part of how people perceive themselves and what they are.
perhaps ‘it’ is too important for the it department?
by this, it should not be inferred that a city’s current it department is without value; quite the opposite. rather, it means realising the smart city vision will entail repositioning ict at the strategic heart of the organisation, with the new culture, status and approach intimated to above.
cities will be at differing stages along this evolution, and this progress can often be discerned from indicators such as the presence, status, and budget
If informatics is the public interface onto the smart city, who builds and manages it?
GOVERNMENT
CITIZ
ENS
bARAnGARoo
the barangaroo project in sydney is a major urban development project on the harbour foreshore.
Arup, working with Rogers stirk Harbour + partners and bovis lend lease, are developing an informatics strategy for the site which includes smart demand management techniques via engaging public interfaces onto the state-of-the-art sustainable infrastructure being developed for the project.
the informatics services will address water use, energy use and other resource use. Yet the development will also benefit from a pervasive approach to ICt that enables smart workplaces, in office spaces, co-working spaces and across the public domain. Responsive public interfaces will display sustainable infrastructure patterns, real-time transit activity and community information, as well as enable a public art strategy.

C40 URBANLIFE: MELBOURNE SMART CITY PAgE 17
© Arup 2010
i.e. modify the operation of infrastruc-ture (re-route trams to where demand exists, for example) or inform citizens about environmental qualities, and so on. this can create a virtuous cycle, if well-designed and well-run.
at a basic level, this is how smart meters appear to be dramatically modifying energy use in the home. the meter (sensor) monitors energy use (activity), which is then quickly analy-sed (modelled) and displayed (feedback) to the user, who drops their energy use. this drop in energy use can be between 5-25%, depending on the trial, and up to 44% when combined with real-time pricing. While the longitudinal patterns of activity around these simple feedback loops are yet to be gathered and as-sessed, this ‘smart meter effect’ begins to indicate their potential nonetheless.
eXAMple pRoJeCt IDeAs
drawing on all these concepts, the workshop generated at least three distinct smart city-related project ideas centred on melbourne that could kick-start a smart city programme for the city.
many more ideas emerged during the various workshop exercises, yet the three that the workshop focused on comprised an ‘informational retrofit’ of melbourne’s transport infrastructure, a sensor-based series of services highlighting the performance and role of the city’s green infrastructure, and a real-time city model that functions as a broker for all urban data.
the third layer, instrumenting resource systems, is a genuine enabler of the other components. it involves the design—for either new-build or retrofit—of sensor networks, and associated technologies, that report on the activity and performance of infrastructure. this reporting is increasingly real-time, recognising that efficient operation requires on immediate feedback loops, and is built upon a platform of software services and wireless sensor networks distributed across much of the city’s infrastructure, including natural ecosys-tems as well as built fabric.
interpreting the concept of sensors widely, they could include the data from integrated ticketing systems such as myki6 and the melbourne bikeshare scheme, as well as comments from the general public via council web services, or derived from ‘bottom-up’ commu-nity-initiated services. they provide a constant, ongoing feedback that drives both informatics and operations as well as building longitudinal data to inform strategic decision-making.
FeeDbACK loops
the interplay between these three systems enables feedback loops on urban activity.
urban activity is instrumented and monitored by sensors, which feeds data to an organisational layer or model, which is then fed back via informatics, such as that it can affect urban activity
6 Myki is Victoria’s integrated ticketing solution covering buses, trams and trains; it is currently being rolled out across the Melbourne metropolitan area.
Will the ‘smart meter’ feedback loop effect work at the civic scale?
SENSORS FEEDBACK
ACTIVITY
MODEL
loW2no
this urban development project in Jätkäsaari, Helsinki features a wide range of pervasive informatics strategies and services aimed at significant reduction in the carbon footprint of the community.
With informatics strategy and services currently being developed by Arup and experientia, these services will include in-street displays that report on personal and civic footprints in real-time, next-generation smart meter concepts for apartments and displays and services that highlight patterns of production—including urban agriculture and knowledge-based work—in order to reinforce innovation processes in the area.
the low2no development is intended to become an exemplar in terms of carbon neutral urban development, including smart city solutions.
© Arup 2010
C40 URBANLIFE: MELBOURNE SMART CITYPAgE 18
the ideas are detailed over the following pages.
(another project idea emerged dur-ing the workshop, involving the ongoing retrofit of city of melbourne buildings, in terms of creating public and private visualisations of building performance. contemporary building management systems (bmS) are being installed in several council buildings, enabling possible behavioural change amongst occupants by creating compelling feedback loops, as well as showcasing the retrofitted buildings’ sustainable performance to the street and via the web.)
neXt steps
Subsequent to the workshop, arup is helping city of melbourne frame a roadmap for a smart city vision for mel-bourne as well as the potential project ideas. this will be then be shared with other c40 cities.
While the first two project ideas are strong enough to be move forward in some shape or form, as discrete ideas, and essentially within particular depart-ments, they cannot fully capitalise on the smart city vision.
only with the kind of strategic work implicit in project three, the real-time city model, can an ‘urban information ar-chitecture’ for melbourne be articulated. this would provide the mechanism by which the emerging vision of ‘mel-bourne Smart city’ becomes strategy, and then reality.
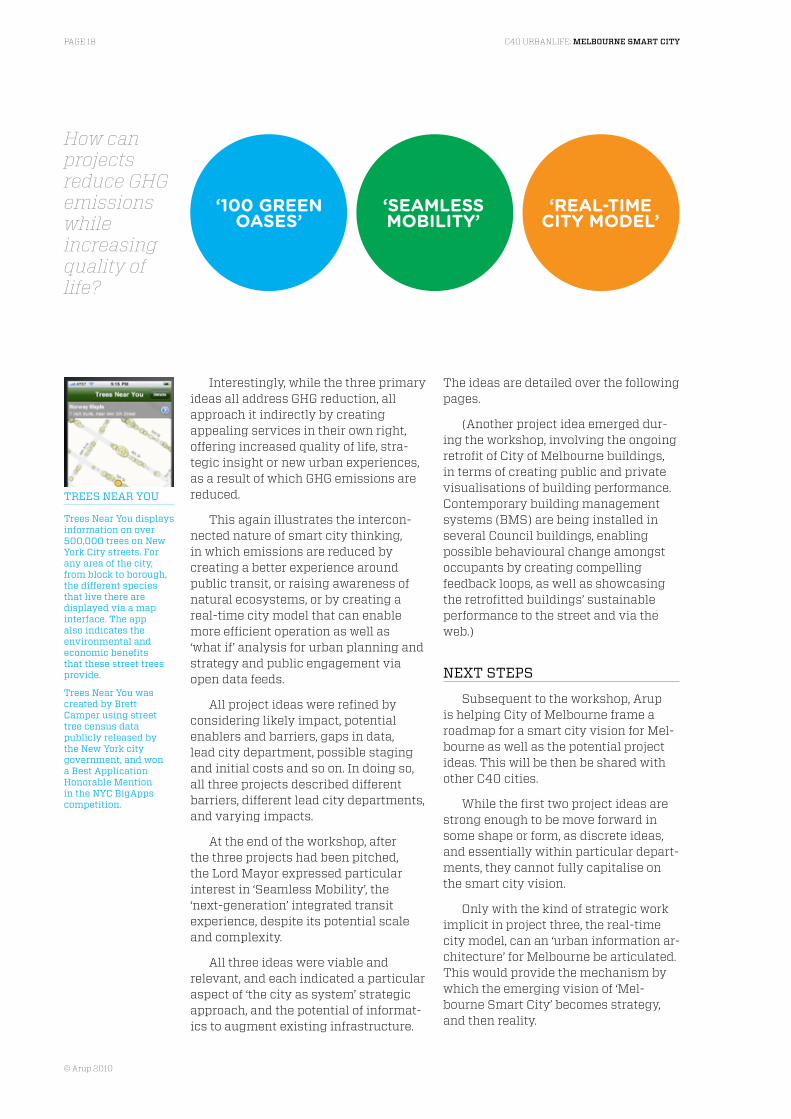
interestingly, while the three primary ideas all address GhG reduction, all approach it indirectly by creating appealing services in their own right, offering increased quality of life, stra-tegic insight or new urban experiences, as a result of which GhG emissions are reduced.
this again illustrates the intercon-nected nature of smart city thinking, in which emissions are reduced by creating a better experience around public transit, or raising awareness of natural ecosystems, or by creating a real-time city model that can enable more efficient operation as well as ‘what if’ analysis for urban planning and strategy and public engagement via open data feeds.
all project ideas were refined by considering likely impact, potential enablers and barriers, gaps in data, lead city department, possible staging and initial costs and so on. in doing so, all three projects described different barriers, different lead city departments, and varying impacts.
at the end of the workshop, after the three projects had been pitched, the lord mayor expressed particular interest in ‘Seamless mobility’, the ‘next-generation’ integrated transit experience, despite its potential scale and complexity.
all three ideas were viable and relevant, and each indicated a particular aspect of ‘the city as system’ strategic approach, and the potential of informat-ics to augment existing infrastructure.
How can projects reduce GHG emissions while increasing quality of life?
tRees neAR YoU
trees near You displays information on over 500,000 trees on new York City streets. For any area of the city, from block to borough, the different species that live there are displayed via a map interface. the app also indicates the environmental and economic benefits that these street trees provide.
trees near You was created by brett Camper using street tree census data publicly released by the new York city government, and won a best Application Honorable Mention in the nYC bigApps competition.
‘100 GREEN OASES’
‘SEAMLESS MOBILITY’
‘REAL-TIME CITY MODEL’

C40 URBANLIFE: MELBOURNE SMART CITY PAgE 19
© Arup 2010
1 100 GREEN OASES Connected sensor networks monitor the performance of Melbourne’s green infrastructure (‘oases’) in real-time, indicating their value whilst enabling deeper engagement from volunteers and users.
SEAMLESS MOBILITY A genuinely integrated mobility system, connecting Melbourne’s installed transit infrastructure together via information, generat-ing strategic data, whilst upgrading the transit experience.
REAL-TIME CITY MODEL A visual real-time model of the city that provides Council with the plat-form for integrating all urban data, running services, enabling analysis, as well as publishing to internal/external clients and open feeds.
2
3
pROJECT IDEAS
the following pages outline the project ideas as created during the c40 urbanlife workshop. each idea was co-created by a multi-disciplinary group of city of melbourne staff and external stakeholders from private and public sector. Steps included assessing barriers, enablers, key organisations and strategic value, and each idea was ‘pitched’ to the lord mayor at the end of the workshop. they are presented here as examples of smart city thinking, as the output of this particular workshop format, and as potential project ideas that melbourne and other cities may wish to develop.

© Arup 2010
C40 URBANLIFE: MELBOURNE SMART CITYPAgE 20
Challenge: How can we create a sense of value in the city’s green infrastructure?
melbourne has a rich ‘green infrastructure’ of »parks, street trees, ponds, allotments and other elements across the city.
however, little coherent information exists on »their location, condition and impact — which leads to a lack of perceived value.
Wireless sensor networks for environment »monitoring are increasingly cheap, robust, discreet and accessible.
What if we could articulate the value of green urban infrastructure and empower people to create it and support it? these elements are often invisible to citizens, and although perhaps implicitly valued, it’s difficult to perceive the effect of green infrastructure upon the city, and thus its value. that the effects are often longer-term exacerbates this. for instance, street trees can radically reduce urban heat island effect and aid with storm water retention (as well as increase property prices and potentially grow food), but how do you show this?
one way to do would be to start monitoring, measur-ing, visualising and otherwise communicating this distributed infrastructure. measuring is a first step towards valuing and enables better management by the city; communication helps enable engagement from citizens and other stakeholders.
in terms of measurement, networks of simple, robust and cheap wireless sensors embedded in environments can convey the environmental qualities of green infra-structure (and compare with ‘non-green’ infrastructure). these might include water quality, air quality, soil moisture, temperature, humidity, noise and light levels and so on. Web-cams, with machine analysis of images, can indicate growth patterns, change in biodiversity and other aspects of ‘performance’. Numerous facets of environmental quality can be simply monitored, with real-time feeds emerging directly from trees, bushes, plants and urban spaces.
DRIVeRs
potentIAl pRoJeCt
1
OnE: 100 GREEN OASES
2
companies such as hewlett packard and cisco are at-tempting this on a global scale. initiatives in los angeles and the amazon rainforest are working at a local scale. there are initiatives looking at street trees specifically (trees Near you). yet few cities have approached this in comprehensive, holistic fashion, and communicated the value with imagination.
this workshop project described a layer of digital infrastructure overlaid onto melbourne’s green infrastruc-ture, measuring and communicating its effect in real-time (and enabling longitudinal analysis), as well as enabling citizen-facing web services highlighting its location and value. the former would be achieved by ‘sprinkling’ this layer of sensors over the city’s green infrastructure, centred initially on ‘100 oases’.
this first set of pinpointed ‘oases’ could be described and communicated via digital maps indicating ‘your nearest oasis’ and highlighting its particular character-istics (it might be quiet, or noisy; have wi-fi for outside working; have a sunny aspect; clean air and running water etc.) While this is articulated as a genuine service for citizens — somewhere between public infrastructure and marketing — it also provides an interface for describing and valuing this layer on the city (and can be exported to other city mapping services.) installations in situ might imaginatively communicate their effect (cf. amphibious architecture and water quality; in the air by medialab prado in madrid and air quality.)
lest this appear a fully digital experience, the ‘100 oases’ idea also described the creation of ‘a green army’ of volunteers and others who would tend the green infrastructure. these activities could also be logged, via ‘digital logbooks’, and so measured and valued. With urban food production, this aspect becomes increasingly important, with its requirement for regular cultivation and harvesting, and also highlights a social networking overlay onto the ‘100 oases’.
if energy production becomes distributed, and to some extent focused on renewables such as biofuels, the waste component of the ‘100 oases’ can be seen as an energy input into the city’s systems (and measured accordingly.) Similarly, green waste can be harvested for compost for urban food production. these activities can also be monitored and valued. this recasts the various disparate elements of green infrastructure as a distrib-uted productive network for the city, and productive in the widest sense.
The project would use real-time measurement and communication of the performance and impact of green infrastructure to make great, productive urban places.

C40 URBANLIFE: MELBOURNE SMART CITY PAgE 21
© Arup 2010
sInCe tHe WoRKsHop, A seRIes oF sMAll pRoJeCts HAVe AlReADY eMeRGeD RelAtInG to enVIRonMentAl MonItoRInG FoR CItY oF MelboURne. A seConD WoRKsHop WItH tHe CItY CoUlD DeVelop tHe ‘100 oAses’ IDeA.
WoRKsHop3
4 neXt steps

© Arup 2010
C40 URBANLIFE: MELBOURNE SMART CITYPAgE 22
Challenge: High carbon emissions due to low take-up of public transport, despite relatively good installed infrastructure.
melbourne already has a good installed base »of public transport infrastructure. however, it has a low take-up, with relatively low levels of service, and a system that is rarely seen as genuinely interconnected.
this low take-up is a major contributor to »melbourne’s emissions profile.
little coherent data exists on how people get »around melbourne, holistically.
New services, such as car-sharing, bike-shar- »ing, and integrated ticketing, are predicated on smart cards, which generate data.
there is strong consumer demand for real-time »location- and social media-based services, on smart connected devices.
by incorporating and increasing the use of car-sharing and bike-sharing, the system can truly extend to the ‘last kilometre’ i.e. from the tram-stop or train station to the front door. ultimately, additional new services - such as ‘smart’ home delivery - can be incorporated into the framework. in the long run, even a driver’s licence and e-tag could be a ‘mobility application’ in this sense.
data from all these applications is used to enhance the transit experience i.e. real-time information on oc-cupancy and patterns of movement can help passengers find the best, cheapest or quietest routes.
this also generates unprecedented levels of strategic and operational data for service providers, and others interested in mobility patterns (from sustainability policy makers to retailers). a certain level of information becomes an ‘open data’ service, which enables further innovation around the system by third-party developers. privacy, security and ethics is carefully respected as part of the system.
Genuinely holistic data is generated in real-time for the first time, which enables real-time operations as well as longitudinal analysis. data can be used for planning - deploying bike paths where people are observed cycling - as well as feeding city information models. ultimately it can be used for real-time provision of transit i.e. vehicles moving towards demand, rather than timetable-driven services. in the short-term it enables accurate calculation of transit-related emissions as well as effective operation.
a key opportunity is the re-casting of public transport as a genuinely high-quality public space, based on increased safety, predictability, flexibility, ease of access, provision of services. applications should be of the high-est quality, taking advantage of the advanced location-based features and interaction design possibilities of the latest smartphones as well as earlier models. tram stops, bus stops and train stations should aspire to the quality of mini-Qantas lounges where possible, in order to compete with the comfort of cars.
as well as high quality application design, by taking an ‘apps’ approach to mobility, different cards can be cre-ated to enable a range of ‘identities’ around mobility i.e. a kids card can be pre-loaded with public transport credits; a tourist’s ‘smartcard-lite’ can be distributed via hotels, again pre-loaded with transport credits to encourage sustainable movement around the city; students cards might be loaded with other credits; drivers license could even be thought of as a mobility application running on a card, and so on. in the long run, cards are usable across other cities, such as Sydney, brisbane and perth, as well as other c40 cities worldwide.
We can use information services to bind together and augment the existing mobility infrastructure in Melbourne. this would extend the existing myki ap-plication across all possible smart card-based transit systems in the melbourne area, such that it is short-hand for accessing any form of transit. this includes trams, buses, trains but also car-sharing i.e. a card should also be able to open both a flexicar or GoGet car, as well as bike-sharing, car-pooling, taxis etc.
these are all ‘applications’, running across various cards, as well as supported by applications built for phones, tablets and other devices. ultimately, access could be entirely via mobile-based applications rather than smartcards.
real-time wayfinding services could connect the currently disparate modes of transport together into one holistic system, projected into the urban environment - through lighting, media facades etc. as well as on transit stops and stations and in vehicles themselves - as well as visible on personal devices.
DRIVeRs
potentIAl pRoJeCt
1
TWO: SEAmlESS mObility
2

C40 URBANLIFE: MELBOURNE SMART CITY PAgE 23
© Arup 2010
FURtHeR ReFIneMent AnD eVAlUAtIon oF tHe IDeA Into tHe CItY oF MelboURne’s tRAnspoRt stRAteGY ReVIeW (JUlY-septeMbeR 2010)
WoRKsHop3
4 neXt steps

© Arup 2010
C40 URBANLIFE: MELBOURNE SMART CITYPAgE 24
comparative data. Subsequently, the model can offer up ‘transformed’ data to public-facing products and services.
So it is at once a repository of data pertaining to the city and its citizens, an analytical tool to facilitate strategy and design, and a core component of the city’s various services.
With the first in mind, it seemed clear that city government could have a strong role to play in being an arbiter of public data. in fact, who better to play this role? Without this, public data, or data pertaining to the public, continues to be generated but is not collected coherently, collated, analysed, filtered, and stored in such a way that it remains public, with appropriate levels of privacy and ethical concerns taken care of. Without this public body stepping in, urban data may become privatised, and so impossible to join together for the benefit of citizens.
there are already analogous example of this. cur-rently, for instance, data around citizens’ energy use is collected by utility companies and not available coher-ently or easily to the city.
analytical processes can be hugely improved through the contemporary approaches to comparing data. currently, much data exists in silos, just as much departmental organisation can tend naturally towards silos. if done well, the model can become a manifestation of the ‘city as system’ idea, indicating flows and processes as well as structures.
by drawing data together, we can model urban pro-cesses in a more holistic fashion, such that the executive can model the effects of large and small interventions on the city, as well as continually analyse how existing processes are affecting the city. the model can be enhanced with live data from real-time sensors and other urban informatics, which inform predictive processes via accurate information on actual use.
the city model is a multi-layered platform capable of handling and combining numerous disparate data sources, some of which are real-time. it is used as part of a design process, for public engagement, for conveying and running the real-time city.
the model can enable an interface with citizens - a form of ‘my city’, which also enables feedback loops from people themselves. as well as an interface onto the city, it also forms a kind of interface for the organisation, possibly even indicating how to change the organisation itself.
The model in effect delivers the knowledge city to the citizens and executive and translates data into action.
Challenge: The city will create unprecedented levels of data to be analysed; how will this be stored and visualised?
the city of melbourne, citizens, organisations, »infrastructure and the environment itself is already created unprecedented levels of data. this will continue to increase exponentially in both volume and subject matter.
despite this, little coherent meaning is being »generated and there is a lack of coordination.
the city increasingly needs to model inte- »grated ‘city as system’ thinking in order to reduce GhG emissions and create an effective, productive city with a higher quality of life.
the workshop generally described how data will in-creasingly emerge from all aspects of the city — citizens, buildings, street furniture, infrastructure, environmental conditions, design and planning processes, and so on. (a recent special edition of the Economist described this ‘data deluge’ 1).
the city of melbourne generates its own data of course, through its city research team, comprising a wide range of analytical approaches and tools. however, the city is not currently set up to take advantage of the increasingly volume of real-time and other data that is starting to emerge from the urban environment. these advantages could include both new operational services made possible by real-time data — such as the previous two project ideas — but could also radically transform strategic analysis and design processes for the city.
We propose, then, that the city commissions a real-time city model, which can be the repository and ‘clearing house’ for all relevant urban data arising from melbourne. this repository should also be an analytical tool for comparing data from disparate sources. this might include facilitating planning and urban design processes, including public and private interfaces onto data, as well as other analyses of urban processes enabled by rich
1 “According to one estimate, mankind created 150 exabytes (billion giga-bytes) of data in 2005. This year, it will create 1200 exabytes” (The Economist, February 25th 2010)
DRIVeRs
potentIAl pRoJeCt
1
THREE: REAl-timE City mODEl
2

C40 URBANLIFE: MELBOURNE SMART CITY PAgE 25
© Arup 2010
sInCe tHe WoRKsHop, seVeRAl CollAboRAtIVe ReseARCH pRoposAls eMeRGeD, WHICH VARIoUslY eXploRe tHe CItY MoDel IDeA. A seConD WoRKsHop WItH tHe CItY CoUlD eXploRe tHe oRGAnIsAtIonAl IMplICAtIons.
WoRKsHop3
4 neXt steps

© Arup 2010
C40 URBANLIFE: MELBOURNE SMART CITYPAgE 26
SMART CITY CASE STUDIES
The following case studies indicate some of the potential of the smart city, and were used throughout the workshop to aid and inform the participants’ understanding of the area.

C40 URBANLIFE: MELBOURNE SMART CITY PAgE 27
© Arup 2010
CAse stUDY: NUAGE VERt, HElSiNKi
during february 2008, a low-energy green laser shone onto the smoke emitting from the Salmisaari substation, in the ruoholahti area of helsinki. as energy generation is a real-time phenomenon, the size of the smoke indicated the output of the power station.
coordinated with an ‘un-plug’ event on february 29, which involved 4000 residents and 5 large scale local companies, the load of the substation decreased by 2mva, with the effect of the unplug event for ‘Nuage vert’ in particular estimated at 800kva.
Nuage vert broke new ground in terms of monitoring of collective consumption of energy, and won numerous awards. perhaps more importantly, the local energy company and partner in the project, helsingin energia, subsequently announced they will release more real-time data about energy consumption in the helsinki area.
KEYWORDS: Urban informatics, energy, feedback loops, behaviour change, public art
ORGANISATION: Pixelache Festival, Helsingin Energia
LOCATION: Helsinki, Finland
© Arup 2010
C40 URBANLIFE: MELBOURNE SMART CITYPAgE 28
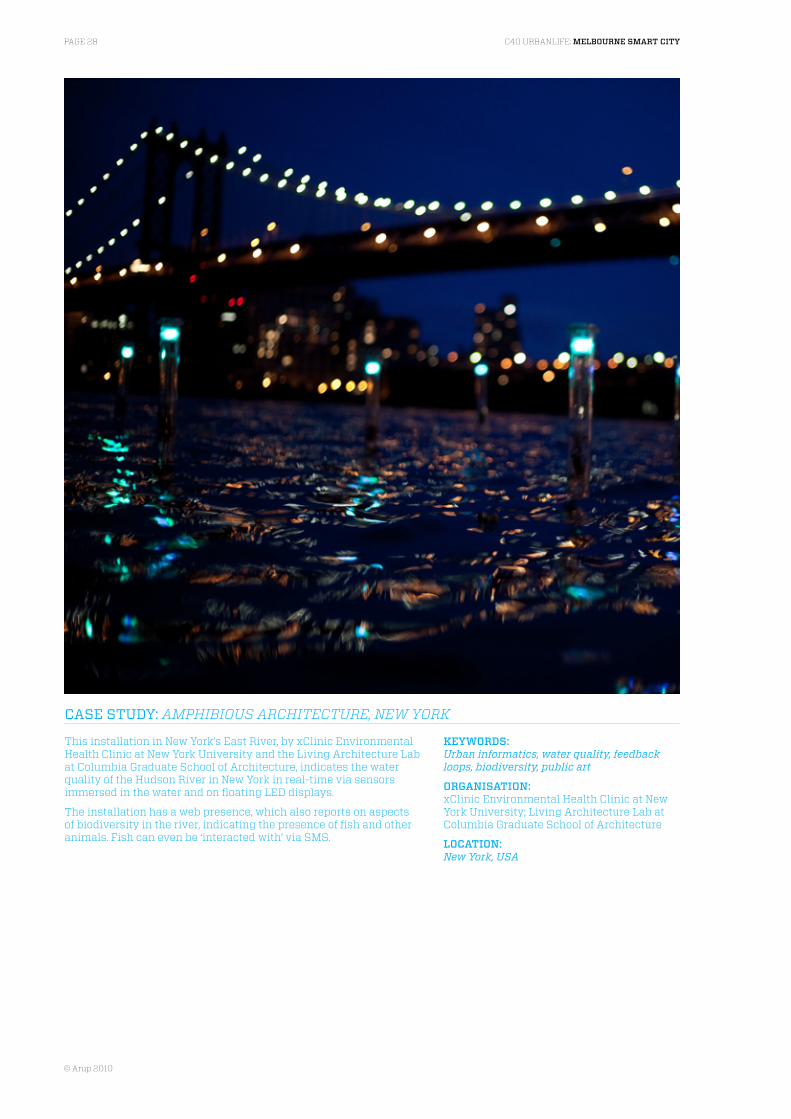
CAse stUDY: AmPHibiOUS ARCHitECtURE, NEW yORK
this installation in New york’s east river, by xclinic environmental health clinic at New york university and the living architecture lab at columbia Graduate School of architecture, indicates the water quality of the hudson river in New york in real-time via sensors immersed in the water and on floating led displays.
the installation has a web presence, which also reports on aspects of biodiversity in the river, indicating the presence of fish and other animals. fish can even be ‘interacted with’ via SmS.
KEYWORDS: Urban informatics, water quality, feedback loops, biodiversity, public art
ORGANISATION: xclinic environmental health clinic at New york university; living architecture lab at columbia Graduate School of architecture
LOCATION: New York, USA

C40 URBANLIFE: MELBOURNE SMART CITY PAgE 29
© Arup 2010
CAse stUDY: COmPStAt, VARiOUS CitiES, USA
compStat, pioneered by commissioner William bratton at the New york police department but later implemented in boston, los angeles and other cities, indicates the potential of using ict to analyse data, visualising and mapping crimes and allocating officers accordingly.
crime reports are now publicly available via website-based ‘crime maps’, such as via the los angeles police department website.
published results have included a reduction in the rates of violent crime combined with more cost-efficient policing.
KEYWORDS: Crime, information visualisation, mapping, performance-based monitoring
ORGANISATION: Originally New York Police Department
LOCATION: Various North American cities, including New York, Los Angeles, Boston, Detroit and others.

© Arup 2010
C40 URBANLIFE: MELBOURNE SMART CITYPAgE 30
CAse stUDY: PROCEDURAl City ENGiNE, ZÜRiCH
city modelling enables planners and urban designers to model urban form, and increasingly urban processes. procedural’s cityengine, like many in its field, has grown out of video game software, generating urban form automatically through algorithms, and is still used by film producers.
however, firms such as Zaha hadid architects and foster + partners also use cityengine to design and plan urban environments, including the masdar eco-city in abu dhabi for instance.
Several other city modelling applications exist, often specialising in particular angles, such as buildings, urban form (including impact on wind, energy, noise etc.), energy (and carbon), or pedestrian and traffic patterns (growing out of specialised transport planning simulations).
however, the real promise of such city models is in combining these various currently-disparate variables through a single platform, and in incorporating real-time data drawn from the city. this would enable strategic analysis of how the city is actually performing, highlighting the detailed relationships between, say, transport, noise, retail patterns and rental values. the city model could become both a repository for data as well as a strategic planning tool, used for operation as well as design.
KEYWORDS: City modelling
ORGANISATION: Procedural
LOCATION: Developed in Zürich, applied in Masdar, UAE, and other cities

C40 URBANLIFE: MELBOURNE SMART CITY PAgE 31
© Arup 2010
CAse stUDY: tHE ClOUD, lONDON
the cloud is a proposal for a ‘civic-scale smart meter’ for london, connected to the 2012 olympic Games.
a giant viewing structure, the cloud is composed of etfe bubbles, laced with thousands of energy-efficient led lights. these can be addressed to form pixellated patterns, which are high-resolution when viewed from a distance. in this way, the structure display video — such as the Games itself — or be used as an enormous data visualisation platform displaying, say, the internet traffic patterns of london (assessing the ‘mood’ of the city, as well as its global connectivity), public transport activity, energy consumption and so on.
the viewing experience for those within the cloud, looking down on london, creates a form of augmented reality, in which visualisations can be overlaid onto the city beneath.
KEYWORDS: Urban informatics, information visualisation
ORGANISATION: MIT, Arup, Atmos, Google
LOCATION: London

© Arup 2010
C40 URBANLIFE: MELBOURNE SMART CITYPAgE 32
CAse stUDY: lONDON DAtAStORE, lONDON
the london datastore has been created by the Greater london authority (Gla) as a first step towards freeing london’s data.
the Gla is releasing this data in order to stimulate innovation and engagement around civic services—by enabling others to use the data, and build applications and services upon it, for free—as well as encouraging other public sector organisations to release their data. this objective is backed strongly by boris johnson, mayor of london.
KEYWORDS: Open data, gov2.0, information visualisation
ORGANISATION: Greater London Authority, City of London
LOCATION: London

C40 URBANLIFE: MELBOURNE SMART CITY PAgE 33
© Arup 2010
CAse stUDY: NEW SONGDO City, iNCHEON
this new ‘eco-city’ constructed on marshland near incheon, South korea, is a private development by Gale international, supported by new ‘hard infrastructure’ provided by incheon, and designed by kohn pedersen fox and arup, amongst others.
however, the ‘soft infrastructure’ is arriving courtesy of cisco’s technology, who envisage a layer of urban services supporting residents and workers in the city, including direct access to healthcare, education, local municipal services, video conferencing, information and recreational facilities, amongst other everyday urban activities. these are delivered over high-speed networks and to multiple platforms in the home and office.
With such developments, cisco suggest embedding such an ‘urban services layer’ into the city can generate significant additional returns for developers, ranging from an extra uS$3 per m2 as ‘standard’, to uS$8 per m2 in an ‘advanced’ implementation, to uS$13 per m2 in a ‘transformational’ development, in which smart city services are integrated from the very beginning of the project.
KEYWORDS: Smart cities, smart infrastructure, urban services
ORGANISATION: Incheon Municipal Council, Gale International, Cisco, Kohn Pedersen Fox, Arup
LOCATION: Incheon, South Korea
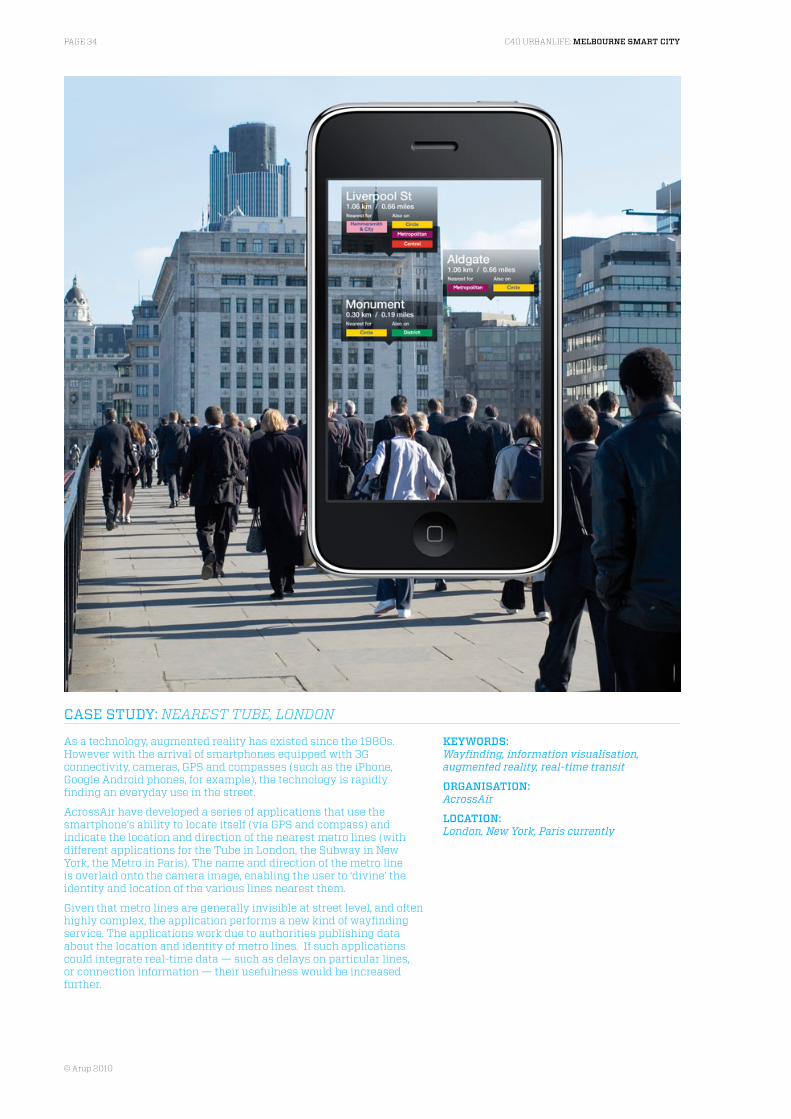
© Arup 2010
C40 URBANLIFE: MELBOURNE SMART CITYPAgE 34
CAse stUDY: NEARESt tUbE, lONDON
as a technology, augmented reality has existed since the 1980s. however with the arrival of smartphones equipped with 3G connectivity, cameras, GpS and compasses (such as the iphone, Google android phones, for example), the technology is rapidly finding an everyday use in the street.
acrossair have developed a series of applications that use the smartphone’s ability to locate itself (via GpS and compass) and indicate the location and direction of the nearest metro lines (with different applications for the tube in london, the Subway in New york, the metro in paris). the name and direction of the metro line is overlaid onto the camera image, enabling the user to ‘divine’ the identity and location of the various lines nearest them.
Given that metro lines are generally invisible at street level, and often highly complex, the application performs a new kind of wayfinding service. the applications work due to authorities publishing data about the location and identity of metro lines. if such applications could integrate real-time data — such as delays on particular lines, or connection information — their usefulness would be increased further.
KEYWORDS: Wayfinding, information visualisation, augmented reality, real-time transit
ORGANISATION: AcrossAir
LOCATION: London, New York, Paris currently

C40 URBANLIFE: MELBOURNE SMART CITY PAgE 35
© Arup 2010
WORKSHOp VISUAlISATIOnS
Arup produced a series of fictional example visualisations of potential informatics services centred on both Melbourne and the workshop’s themes. These worked as ‘sketches’ to help make concrete the content of the workshop without directing it. note that not all are intended to be exemplars; some illustrate issues with visualisation- or informatics-led approaches.

© Arup 2010
C40 URBANLIFE: MELBOURNE SMART CITYPAgE 36
Civ
ic s
mar
t met
erC
ity-w
ide
serv
ice
in w
hich
str
eets
and
blo
cks
can
broa
dcas
t the
ir r
esou
rce
data
(ene
rgy,
wat
er e
tc.)
to a
City
of M
elbo
urne
ser
vice
, whi
ch c
olla
tes
and
ve
rifie
s th
e da
ta, a
nd th
en d
istr
ibut
es to
pub
lic
disp
lays
ena
blin
g ci
vic
prid
e ar
ound
sus
tain
abili
ty.
Res
ourc
es
Eac
h bu
ildin
g, b
lock
or
stre
et
has
a pu
blic
‘dig
ital s
hado
w’
conv
eyin
g m
ore
deta
iled
data
on
its
perf
orm
ance
and
targ
ets.
As
smar
t met
ers
beco
me
mor
e pr
eval
ent,
build
ings
, blo
cks
and
st
reet
s ca
n de
liver
thei
r da
ta to
a
City
of M
elbo
urne
agg
rega
tor.
C40
Urb
anLi
fe: M
elb
our
ne S
mar
t C
ity
Dis
play
s ar
e de
sign
ed to
del
iver
de
taile
d in
form
atio
n up
-clo
se,
and
prov
ide
‘gla
nce-
able
’ in
form
atio
n fr
om a
dis
tanc
e.

C40 URBANLIFE: MELBOURNE SMART CITY PAgE 37
© Arup 2010
‘Tra
nspa
rent
’ City
bui
ldin
gsA
ll C
ity o
f Mel
bour
ne b
uild
ings
con
vey
info
rmat
ion
abou
t the
ir r
eal-
time
reso
urce
use
(pri
mar
ily
elec
tric
ity, g
as a
nd w
ater
) via
sm
art n
etw
orke
d
disp
lays
fixe
d to
out
side
of e
ach
build
ing.
The
re is
a
corr
espo
ndin
g w
ebpa
ge fo
r ea
ch b
uild
ing
(als
o
acce
ssib
le v
ia Q
R c
ode
disp
laye
d on
-scr
een.
)
Res
ourc
es
Dis
play
s at
tach
ed to
out
side
of
all C
ity o
f Mel
bour
ne b
uild
ings
co
nvey
ing
real
-tim
e da
ta o
n bu
ildin
g re
sour
ce u
se.
Dis
play
s ar
e de
sign
ed to
del
iver
de
taile
d in
form
atio
n up
-clo
se,
and
prov
ide
‘gla
nce-
able
’ in
form
atio
n fr
om a
dis
tanc
e.
C40
Urb
anLi
fe: M
elb
our
ne S
mar
t C
ity
Dis
play
indi
cate
s ta
rget
s fo
r en
ergy
(t
op) a
nd w
ater
(bot
tom
), an
d re
port
s in
‘rea
l-tim
e’, h
ourl
y, fe
d by
bui
ldin
g
man
agem
ent s
yste
ms.
Eac
h bu
ildin
g ha
s a
disp
lay,
with
QR
co
de le
adin
g to
mor
e de
tail
for
that
bu
ildin
g.
Dis
play
is le
gibl
e fr
om a
dis
tanc
e (r
ed
mea
ns b
uild
ing
is o
ver
its ta
rget
s,
curr
ently
) as
wel
l as
up-c
lose
.

© Arup 2010
C40 URBANLIFE: MELBOURNE SMART CITYPAgE 38
Wat
er s
culp
ture
An
inst
alla
tion
in th
e R
iver
Yar
ra th
at u
ses
rive
r w
ater
itse
lf to
con
vey
the
wat
er q
ualit
y in
the
rive
r, an
d in
the
litte
r tr
aps
that
dot
the
bank
s. In
doi
ng s
o,
it ill
ustr
ates
the
effe
ct a
nd v
alue
of c
lean
ing
the
rive
r.
Env
ironm
ent
Inst
alla
tion
is v
isib
le a
t diff
eren
t tim
es a
long
the
cour
se o
f the
Ya
rra,
yet
whe
n no
t act
ivat
ed
does
not
impi
nge
upon
the
view
of
the
rive
r or
its
activ
ity.
Pum
ps c
an b
e po
wer
ed b
y th
e tid
e of
the
rive
r its
elf,
and
use
the
rive
r w
ater
as
the
disp
lay.
Jets
of w
ater
bur
st
inte
rmitt
ently
to v
isua
lise
leve
ls
of w
ater
qua
lity
in th
e lit
ter
trap
(n
ear
jet)
and
in th
e ri
ver
(far
jet)
.
Foun
tain
jets
can
be
lit to
indi
cate
w
ater
qua
lity
(red
= b
ad).
Jets
sto
p/st
art t
o ‘d
raw
’ wor
ds a
nd n
umbe
rs in
th
e w
ater
, illu
stra
ting
chan
ge in
dat
a.
C40
Urb
anLi
fe: M
elb
our
ne S
mar
t C
ity

C40 URBANLIFE: MELBOURNE SMART CITY PAgE 39
© Arup 2010
Sta
dium
as
canv
as fo
r vi
sual
isat
ion
Con
tem
pora
ry b
uild
ings
can
be
used
as
a ca
nvas
fo
r di
spla
y of
info
rmat
ion,
suc
h as
dat
a vi
sual
isat
ion.
H
ere,
Mel
bour
ne’s
AA
MI P
ark
stad
ium
con
veys
rea
l-tim
e da
ta o
n bi
ke u
se v
s. c
ar u
se w
ithin
the
city
, whi
le
the
stad
ium
is n
ot in
use
Hea
lth
Sta
dium
pan
els
are
lit (v
ia
embe
dded
LE
D) t
o in
dica
te
prop
ortio
n of
bik
es (g
reen
) ve
rsus
pro
port
ion
of p
riva
te
vehi
cles
(gre
y).
Rea
l-tim
e da
ta o
n bi
ke u
se in
th
e ci
ty is
dra
wn
from
var
ious
se
nsor
s do
tted
aro
und
the
city
.
LED
s ar
e of
ten
depl
oyed
with
in
build
ings
like
the
this
sta
dium
. The
re
may
be
an o
ppor
tuni
ty to
re-u
se s
uch
build
ings
as
disp
lays
.
Key
land
mar
ks, s
uch
as th
e A
AM
I P
ark
stad
ium
, can
act
as
‘civ
ic-s
cale
sm
art m
eter
s’, c
onve
ying
dat
a vi
sibl
e at
the
urba
n sc
ale.
C40
Urb
anLi
fe: M
elb
our
ne S
mar
t C
ity

© Arup 2010
C40 URBANLIFE: MELBOURNE SMART CITYPAgE 40
Vél
o sm
art b
ike
gara
geA
dis
trib
uted
, net
wor
ked
bike
infr
astr
uctu
re,
feat
urin
g ‘r
obot
’ bik
e ga
rage
s w
hich
con
veys
thei
r st
ate
(occ
upan
cy, e
mis
sion
s sa
ved
by c
yclin
g et
c.) i
n re
al-t
ime
on th
eir
exte
rior
s an
d on
to s
mar
t pol
es &
sc
reen
s ar
ound
the
city
as
wel
l as
phon
es/w
eb.
Hea
lth
Faca
de o
f bui
ldin
g in
dica
tes
curr
ent o
ccup
ancy
leve
l by
LED
sc
reen
com
pone
nt a
nd n
eon
bike
scu
lptu
re w
hich
mov
es
acro
ss th
e ro
of
Bui
ldin
g/sy
stem
trac
ks
pres
ence
of c
yclis
ts in
the
area
an
d re
gula
tes
build
ing
syst
ems
acco
rdin
gly
Sm
art c
ard-
base
d bi
ke h
ire
syst
em g
ener
ates
det
aile
d da
ta
on a
ctiv
ity in
rea
l-tim
e
At n
ight
, bik
e in
dica
tor
is li
t (by
LE
D)
and
func
tiona
l dis
play
bec
omes
ur
ban
perf
orm
ance
.
‘Vél
o’ s
yste
m d
istr
ibut
es d
ata
to
scre
ens
and
smar
t pol
es a
roun
d th
e ci
ty a
s w
ell a
s to
pho
nes/
web
.
C40
Urb
anLi
fe: M
elb
our
ne S
mar
t C
ity
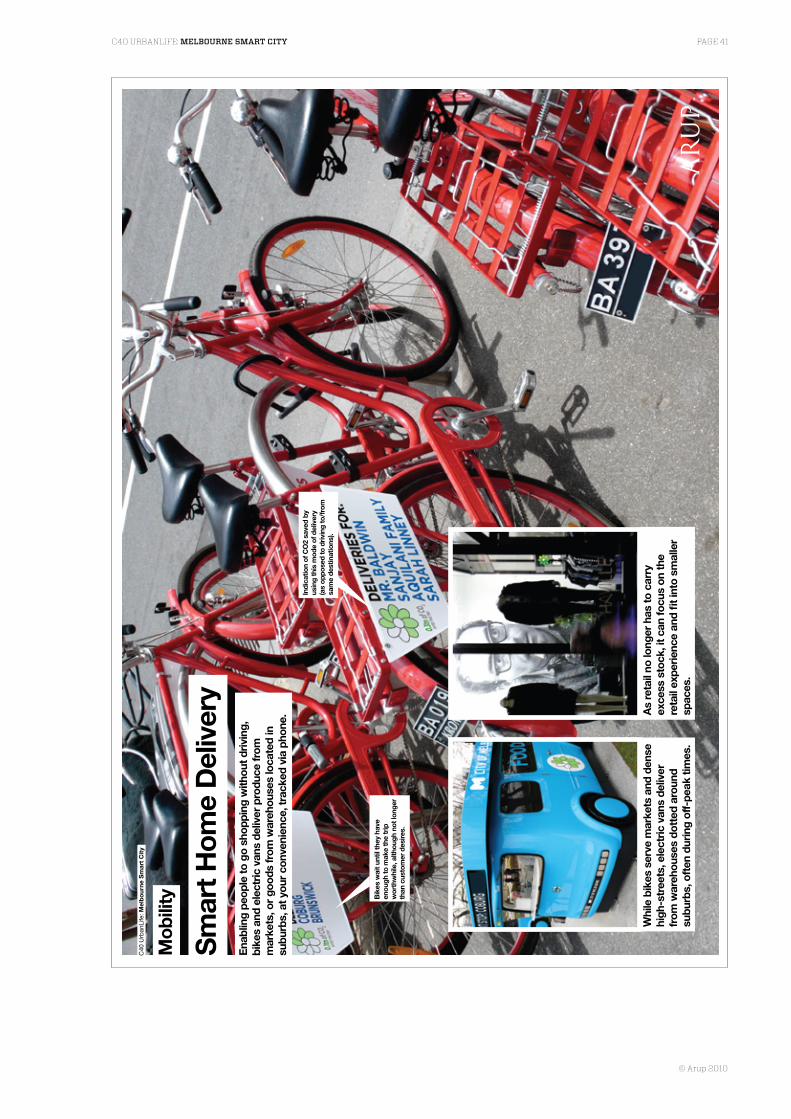
C40 URBANLIFE: MELBOURNE SMART CITY PAgE 41
© Arup 2010
Sm
art H
ome
Del
iver
yE
nabl
ing
peop
le to
go
shop
ping
with
out d
rivi
ng,
bike
s an
d el
ectr
ic v
ans
deliv
er p
rodu
ce fr
om
mar
kets
, or
good
s fr
om w
areh
ouse
s lo
cate
d in
su
burb
s, a
t you
r co
nven
ienc
e, tr
acke
d vi
a ph
one.
Mob
ility
Indi
catio
n of
CO
2 sa
ved
by
usin
g th
is m
ode
of d
eliv
ery
(as
oppo
sed
to d
rivi
ng to
/fro
m
sam
e de
stin
atio
ns).
As
reta
il no
long
er h
as to
car
ry
exce
ss s
tock
, it c
an fo
cus
on th
e re
tail
expe
rien
ce a
nd fi
t int
o sm
alle
r sp
aces
.
Whi
le b
ikes
ser
ve m
arke
ts a
nd d
ense
hi
gh-s
tree
ts, e
lect
ric
vans
del
iver
fr
om w
areh
ouse
s do
tted
aro
und
su
burb
s, o
ften
dur
ing
off-
peak
tim
es.
C40
Urb
anLi
fe: M
elb
our
ne S
mar
t C
ity
Bik
es w
ait u
ntil
they
hav
e en
ough
to m
ake
the
trip
w
orth
whi
le, a
lthou
gh n
ot lo
nger
th
an c
usto
mer
des
ires.

© Arup 2010
C40 URBANLIFE: MELBOURNE SMART CITYPAgE 42
Dis
trib
uted
mob
ility
Rea
l-tim
e da
ta in
dica
ting
loca
tion,
spe
ed,
occu
panc
y et
c. is
dra
wn
dire
ctly
from
tram
s, b
uses
an
d tr
ains
. Thi
s da
ta is
vis
ualis
ed in
to in
tera
ctiv
e ‘li
ving
map
s’ o
f the
city
’s tr
ansi
t (w
hich
is c
ombi
ned
w
ith b
ike
and
pede
stri
an w
ayfin
ding
info
rmat
ion)
.
Mob
ility
Rea
l-tim
e vi
sual
isat
ion
of tr
ams,
bu
ses
and
trai
ns in
Mel
bour
ne,
indi
catin
g co
nnec
tions
& d
elay
s,
draw
n di
rect
from
the
vehi
cles
.
Tram
-sto
ps, b
us-s
tops
and
trai
n st
atio
ns a
re ‘i
nfor
mat
iona
lly-r
ich’
sp
aces
, em
bedd
ed w
ith r
eal-
time
tran
sit d
ata
& w
ayfin
ding
ele
men
ts.
Dis
trib
utin
g pe
rvas
ivel
y (m
obile
, web
, st
reet
) inc
reas
es th
e am
enity
and
qu
ality
of s
ervi
ce a
ssoc
iate
d w
ith
wal
king
, cyc
ling
and
publ
ic tr
ansi
t.
C40
Urb
anLi
fe: M
elb
our
ne S
mar
t C
ity
Pro
ject
ed s
igns
con
tain
re
al-t
ime
info
rmat
ion
as w
ell
as d
irect
ions
, and
hig
hlig
ht
conn
ectiv
ity b
etw
een
mod
es.

C40 URBANLIFE: MELBOURNE SMART CITY PAgE 43
© Arup 2010
Pub
lic tr
ansp
ort s
pace
Vehi
cles
suc
h as
tram
s, b
uses
and
trai
ns a
re s
een
as
high
-qua
lity
publ
ic s
pace
, off
erin
g am
eniti
es s
uch
as
free
wi-
fi as
wel
l as
real
-tim
e lo
catio
n-ba
sed
info
rmat
ion.
Th
ese
serv
ices
pro
vide
use
rs w
ith u
npar
alle
led
serv
ice,
as
wel
l gen
erat
ing
real
-tim
e da
ta o
n m
obili
ty p
atte
rns,
oc
cupa
ncy
rate
s, in
tera
ctio
n an
d so
on.
Mob
ility
C40
Urb
anLi
fe: M
elb
our
ne S
mar
t C
ity
All
tram
s, b
uses
and
trai
ns
offe
r fr
ee p
ublic
wi-
fi on
-boa
rd,
prov
idin
g a
leve
l of s
ervi
ce th
at
cars
can
not c
ompe
te w
ith.
Vehi
cles
, ins
ide
and
outs
ide,
can
al
so in
corp
orat
e in
form
atio
n to
co
nvey
its
posi
tion,
occ
upan
cy
leve
ls, d
estin
atio
n et
c.

© Arup 2010
C40 URBANLIFE: MELBOURNE SMART CITYPAgE 44
Info
rmat
iona
l am
enity
Tram
-sto
ps, b
us-s
tops
and
trai
n st
atio
ns a
re
‘info
rmat
iona
lly-r
ich’
spa
ces,
em
bedd
ed w
ith r
eal-
time
tran
sit d
ata
& w
ayfin
ding
ele
men
ts. V
ehic
les,
su
ch a
s tr
ams
and
buse
s, a
re e
quip
ped
with
free
w
i-fi
for
cust
omer
s, a
nd r
epor
t the
ir p
ositi
on in
rea
l-tim
e, g
ener
atin
g da
ta o
n al
l pub
lic m
obili
ty.
Mob
ility
C40
Urb
anLi
fe: M
elb
our
ne S
mar
t C
ity
Pro
min
ent s
igns
are
focu
sed
on
mak
ing
core
info
rmat
ion
visi
ble
and
legi
ble
from
a d
ista
nce
Free
pub
lic w
i-fi
is a
vaila
ble
at
all t
ram
- an
d bu
s-st
ops
and
trai
n st
atio
ns a
s w
ell a
s on
-boa
rd
tram
s, b
uses
, and
trai
ns.
Mul
ti-la
ngua
ge s
uppo
rt fo
r to
uris
ts a
nd o
ther
s bu
ilt in
to a
ll si
gnag
e.
Mul
ti-to
uch
disp
lays
ena
ble
navi
gatio
n an
d w
ayfin
ding
th
roug
h re
al-t
ime
disp
lays
of
conn
ecte
d M
elbo
urne
tran
sit.

C40 URBANLIFE: MELBOURNE SMART CITY PAgE 45
© Arup 2010
‘The
Net
’: pu
blic
dat
a in
stal
latio
nA
laye
red
net o
f LE
D li
ghts
han
gs o
ver
a Fe
dera
tion
Squ
are
‘lane
way
’, di
spla
ying
civ
ic d
ata
in r
eal-
time.
Dat
a is
der
ived
from
ene
rgy-
and
oth
er
reso
urce
-rel
ated
pat
tern
s of
use
, as
wel
l as
othe
r ur
ban
activ
ities
, and
vis
ualis
ed a
s an
eth
erea
l and
en
gagi
ng p
ublic
art
inst
alla
tion.
Res
ourc
es
‘The
Net
’ is
capa
ble
of b
eing
su
spen
ded
over
lane
way
s, a
nd
com
pris
es a
laye
red
latt
ice
of
ener
gy-e
ffici
ent L
ED
ligh
ting.
Muc
h of
the
data
is d
raw
n di
rect
fr
om C
ity o
f Mel
bour
ne s
yste
ms,
as
wel
l as
offe
ring
inte
ract
ive
way
findi
ng a
nd e
vent
s.
‘The
Net
’ can
be
view
ed fr
om a
di
stan
ce, a
s a
subt
le in
terv
entio
n in
to
the
city
, as
wel
l as
inte
ract
ed w
ith
dire
ctly
via
cel
lpho
nes.
C40
Urb
anLi
fe: M
elb
our
ne S
mar
t C
ity

© Arup 2010
C40 URBANLIFE: MELBOURNE SMART CITYPAgE 46
Urb
an A
ctiv
ity M
onito
rP
eopl
e le
ave
digi
tal ‘
trac
es’ o
f the
ir a
ctiv
ity v
ia th
eir
phon
es (e
sp. s
mar
tpho
nes)
and
net
book
s/ta
blet
s.
Thes
e ca
n be
sim
ply
sens
ed in
rea
l-tim
e, p
rovi
ding
un
prec
eden
ted
leve
l of d
etai
l (in
clud
ing
indi
vidu
al
patt
erns
of a
ctiv
ity, r
epea
t vis
its &
c.).
This
dat
a ca
n be
use
d fo
r st
rate
gic/
desi
gn in
sigh
t, or
to d
rive
rea
l-tim
e se
rvic
es.
Mob
ility
Indi
vidu
al c
itize
ns c
an b
e sp
otte
d vi
a th
eir
phon
e’s
uniq
ue
ID (w
hich
is a
nony
mis
ed) s
uch
that
rep
eat v
isits
can
be
seen
.
Agg
rega
ted
patt
erns
of a
ctiv
ity
give
a s
ense
of h
ow th
e ci
ty is
be
ing
used
in r
eal-
time.
Ele
men
ts o
f thi
s da
ta —
onc
e an
onym
ised
and
agg
rega
ted
to
pres
erve
pri
vacy
and
sec
urity
— c
an
be d
ispl
ayed
in s
itu.
Urb
an a
ctiv
ity —
suc
h as
vol
umes
of
peo
ple
at a
pla
ce, d
raw
n fr
om
volu
mes
of c
ellp
hone
act
ivity
— c
an
be v
isua
lised
for
the
city
.
C40
Urb
anLi
fe: M
elb
our
ne S
mar
t C
ity

C40 URBANLIFE: MELBOURNE SMART CITY PAgE 47
© Arup 2010
‘Thi
s Is
You
r C
ity’ d
ashb
oard
A c
usto
mis
able
das
hboa
rd fo
r C
ity o
f M
elbo
urne
sta
ff, w
hich
sits
‘on
top’
of
exis
ting
syst
ems
and
pres
ents
a r
eal-
time
upda
te o
n in
form
atio
n re
leva
nt to
them
. P
erva
sive
dis
trib
utio
n m
eans
that
sta
ff g
et
used
to ‘l
ivin
g w
ith d
ata’
.
Pro
duct
ivity
Cus
tom
ised
for
each
sta
ff
mem
ber,
by e
ach
staf
f mem
ber,
enab
ling
each
to c
onfig
ure
wha
t the
y’re
inte
rest
ed in
.
‘Rea
l-tim
e’ d
ata
in fa
st-m
ovin
g
new
sfee
d/tic
ker,
draw
ing
from
bu
sine
ss s
yste
ms,
ext
erna
l w
ebsi
tes,
bui
ldin
gs, s
enso
rs &
c.
Map
-bas
ed n
avig
atio
n av
aila
ble
for
data
-set
s w
ith lo
catio
n in
form
atio
n.
Das
hboa
rd m
odul
es a
re fu
lly
cust
omis
able
to u
ser,
draw
n fr
om
cons
tant
ly u
pdat
ed s
uite
man
aged
by
CIO
func
tions
.
C40
Urb
anLi
fe: M
elb
our
ne S
mar
t C
ity
‘Slo
wer
-mov
ing’
dat
a is
low
er
dow
n th
e sc
reen
.
Agg
rega
tes
exis
ting
syst
ems
(i.e.
CoM
ser
vice
req
uest
s ak
a “S
Rs”
and
equ
ival
ent)
into
one
ov
eral
l vie
w.

© Arup 2010
C40 URBANLIFE: MELBOURNE SMART CITYPAgE 48
THE WORKSHOp ITSElF
The workshop ran for a day and a half at the end of March 2010, featuring participants from private and public sector, including both State and City government.

C40 URBANLIFE: MELBOURNE SMART CITY PAgE 49
© Arup 2010
WoRKsHop AGenDA
Tuesday
1300 Welcome (Andrew Wisdom)
1305overview: the City of Melbourne (Geoff lawler)
1315Context: Why smarter Cities in Melbourne (Alex Fearnside)
1340 Introductions
1400 C40 Urbanlife (Mark Watts)
1410Urban Information Architecture (Volker buscher)
1445 Urban Informatics (Dan Hill)
1535exercise: Individual energy Consumption (Dan Hill)
1555Melbourne’s Footprint in Context (Mark Watts)
1615exercise: Urban Informatics projects (Dan Hill)
1615 tomorrow’s agenda (Mark Watts)
1715the Urban Challenge (peter Head / John Miles)
Wednesday
0915 overview (Mark Watts)
0925 exercise - recap (susan Claris)
0950projects: worked example (léan Doody & Dan Hill)
1020 exercise - key challenges (Mark Watts)
1110 exercise - project ideas (Mark Watts)
1330 exercise - action plan (Mark Watts)
1500exercise - prepare project pitch (Mark Watts)
1600Report out and discussion with lord Mayor (Mark Watts)
1650 Concluding remarks (John Miles)
1700 Workshop close
WoRKsHop pARtICIpAnts
City of Melbourne
Geoff brown, ian dryden, alex fearnside, helen hardwick, david hassett, Geoff lawler, austin ley, jade knight, david mayes, krista milne, robert moore, yuriy onyschchuk, katherine ryan, Sam Schwartz, richard Smithers, ralph Webster, matthew Willcox, adam Zaborszczyk
Arup
volker buscher, Susan claris, léan doody, peter head, dan hill, debra lam, adam leggett, andrew maher, jason mcdermott, john miles, mark Watts, Shane power, meghan reis, james Selth, andrew Wisdom
Victorian Government
Nick bailey, julian Smith
Academia/business
Sofie bouteligier (university of leuven), mark elliot (collabforge) jane-frances kelly (Grattan institute), dr. Slaven marusic (uni. of melbourne), dr. darryn mcevoy (rmit), dianne moy (veil/uni. of melbourne), daniel muller (Grattan institute), jodi Newcome (climate Group), prof. marimuthu Swami palaniswami (uni. of melbourne), yolande Strengers (rmit), michael trudgeon (crowd/veil/uni. of melbourne)
Workshop participants at end of day two lord mayor robert doyle