Embed Size (px)
Citation preview

Membrane Gas Separation Unit Operation Laboratory - Sarkeys E111
January 21st & 28th, 2015
ChE 3432 - Section 3
Eric Henderson
Eddie Rich
Xiaorong Zhang
Mikey Zhou
1

2
ABSTRACT
The purpose of this experiment was to determine the effectiveness of PRISM® gas
membranes to separate an incoming air stream into nitrogen and oxygen rich streams. Gas
membrane separators are common industrial tools found in chemical plants, so knowing how to
optimize such a device is an important skill as a chemical engineer. In order to do this, pressure
and flow rate were varied and the efficiency of co-current vs. counter-current flow could then be
compared. Data collection was acquired via oxygen meters of permeate and non-permeate flows
which were connected to a computer for analysis. At each steady state pressure, 30, 45, 60, 75, 90
psig, the non-permeate flow rate was changed to 4, 8, and 12 SLPM (standard liters per minute).
Once the chosen pressures and flow rates reached steady state, the non-permeate and permeate
oxygen contents were recorded. For each scenario, incoming air would flow through two PRISM®
gas membranes; one having either co-current or counter-current flow and the other only having
counter-current flow. The second membrane was not used for separation in this experiment. Once
the data was plotted a clear trend between pressure, flow rate, and directional flow to the overall
air separation process was apparent and the theoretical outcome of each variable change was
evaluated. Increasing the system pressure led to an overall increase in system productivity,
recovery, and enrichment ratio for both co-current and counter-current flow. In contrast, an
increase in total flow rate decreased the enrichment ratio and recovery, and had a negligible effect
on productivity for both co-current and counter-current flow. Using statistical analysis, the P value
was found to be above 5% for all aspects of co-current vs. counter-current flow, therefore,
changing the flow direction did not make a significant difference in obtained results.

3
INTRODUCTION AND THEORY
The efficiency of PRISM® gas separating membranes to separate incoming air into
nitrogen and oxygen rich streams were compared in relation to changing variables such as pressure,
flow rate, and directional flow for this study. We studied the effects of co-current and counter-
current flow in relation to the efficiency of the system to separate air into its components.
A membrane is a region of discontinuity between two
phases that can be gaseous, liquid, solid, or a combination
thereof, and can be used to separate materials for various
applications1. Once the materials such as air are separated, they
become more valuable, as pure substances can be used in a
broader range of scenarios. Oxygen rich air can be used in the
medical field to aid patients with breathing disabilities, as well
as in the chemical industry to make acids and boost reaction rates and oxidation of unwanted
compounds. Hot oxygen air is essential to make iron and steel in blast furnaces, and it is ideal for
welding, melting, and cutting metals2. Nitrogen rich air, on the other hand, can be used as an
anesthetic, coolant, cryopreservant, or as an inert gas for chemical and fuel blanketing3.
The two vertically oriented PRISM® nonporous separating membranes used in this
experiment consist of a bundle of hollow polymer fibers encased in an acrylonitrile butadiene
styrene (ABS) shell4 (Figure 1). These devices act as a molecular filter and are a cost effective and
efficient method to separate compressed air into individual components, such as nitrogen and
oxygen rich streams. Membranes operate by means of permeation; they act as a selective barrier
that permit liquid, gases, and vapors to pass through at different rates1. The rate of diffusion of a
material through the membrane will determine how it interacts with the material, and thus, where
FIGURE 1. PRISM® gas separating
membrane cut to show hollow
polymer fibers5.

4
it will end up. Variables such as the inlet air volumetric flow rate and system pressure, and
attributes such as the partial pressure difference of each component are the primary driving forces
that move the molecules across the membrane. In this gas phase separation, the higher diffusivity
of oxygen, compared to nitrogen, enables it to be selectively removed as primary component of
the permeate stream. Therefore, as more oxygen is separated, the nitrogen concentration increases
in the non-permeate stream.
Gas separating membranes have two major flow patterns, tube-side and shell-side feed
flow. Tube-side feed is where pressurized gas enters the feed side of the tube and is split into two
parts. The first part permeates through the walls of the hollow polymer fibers and exits through
the fiber conduits, or the shell-side, while the second part flows the length of the polymer fibers6.
Tube feed is the only type of flow used in this experiment. Since the pressure drops linearly along
the length of the tube with tube-side, and shell-side exhibits a pressure drop mostly around the
input, tube-side feed flow yields the best performance7.
Co-current and counter-current flows can also be configured to achieve maximum
membrane gas separation. This allows for the permeate flow’s configuration
in relation to the feed to be varied. Co-current flow occurs when the permeate and non-permeate
flows go in the same direction, whereas counter-current flow occurs when both steams flow in
opposite directions. Counter-current is theoretically the most effective, followed by outward flow
(flow radially outward from the membrane), and then co-current flow7. Counter-current’s high
level of effectiveness comes from the maximization of the partial pressure gradient driving force
between the two streams at all points down the separator’s length.
The following equations can be utilized to solve to the numerous components of this gas
membrane system. Fick’s law: (Eq. 1) is used to express the rate of species diffusion, assuming

5
the system operates at steady state, where 𝐽𝐴𝑧 is the diffusional flux of component Az, DAB is the
diffusivity constant/coefficient, and is the concentration gradient of component A.
Fick’s law can then be simplified to 𝐽𝐴𝑧=
𝐷𝐴𝐵 (𝐶𝐵−𝐶𝐴)
𝑙𝑚 (Eq. 2) once it is assumed that temperature
remains constant, where CA and CB denote the concentrations of components A and B, and lm is the
membrane thickness. This can then be converted to:
Ni H iDi
lmpio piL H i
ci
pi (Eq. 3 & 4)
which accounts for the partial pressure driving forces of a non-porous membrane. Ni is the flux, pi
is the partial pressure, and pio is the initial partial pressure.
Henry’s law, 𝐶𝑖 = 𝑆𝑖𝑝𝑖 (Eq. 5), can then be used to relate a compound’s surface
concentration to its partial pressure in the gas phase, where Si = Henry’s law constant8.
Furthermore, the combination of Eq. 2 and 𝐽𝐴𝑧=
𝑃𝐴𝐵 (𝑝𝐵−𝑝𝐴)
𝑙𝑚 (Eq. 6) yields
(Eq. 7), where PAB denotes the system pressure, FF is the system flow
rate, FNP is the non-permeate flow rate, FP is the permeate flow rate, and O2NP and O2P stand for
the oxygen content in the non-permeate and permeate streams. This is useful in order to determine
the amount of material moving through system, along with mole balances and flow rate equations
(Eq. 8 & 9), assuming an isothermal steady-state system containing 21% oxygen and 79% nitrogen
by volume, and no accumulation. The non-permeate nitrogen concentration can also be defined by
Eq. 10.
(Eq. 8)
(Eq. 9) (Eq. 10)

6
Essential equations such as enrichment ratio, oxygen recovery, and productivity (Eq. 11 –
13, respectively) can then be utilized, along with the proper unit conversion (Eq. 14).
(Eq. 11) (Eq. 13)
(Eq. 12) (Eq. 14)
Nomenclature
APPARATUS AND OPERATING PROCEDURES
Safety
When doing this experiment, a few things need to be considered to make sure each group
member has a safe working environment. First of all, the inlet pressure should not exceed 150 psig,
as this is the maximum system pressure. In addition, safety glasses should be worn at all times
while in the laboratory. Although we are not dealing with hazardous materials for this experiment,
safety glasses are a necessary precaution. The oxygen sensors are filled with potassium hydroxide,
𝐽𝐴𝑧 = Diffusional flux of component Az
DAB , Di = Diffusivity constant/coefficient
= Concentration gradient of component A
CA , CB = Concentrations of components A & B
Ni = Flux of component i
l , lm = Membrane thickness
pi = Partial pressure of component i
pio = Initial partial pressure of component i
piL = Partial pressure of component i at length of pore
Si = Henry’s law constant
PAB = Pressure
ER = Enrichment ratio
R = Recovery
P = Productivity
FNP = Flow rate in non-permeate stream
[SCFH]
FP = Flow rate in permeate stream
[SCFH]
O2P = O2 content in permeate stream
[vol%]
O2NP = O2 content in non-permeate
stream [vol%]
N2NP = N2 content in non-permeate
stream [vol%]
SCFH = Standard Cubic Feet per Hour
SLPM = Standard Liters per Minute

7
which, if leaked can cause skin burns. In the event of contact with potassium hydroxide, the
affected area should be rinsed with water.
Equipment Description
This experiment used an apparatus whose key components were two PRISM® separators,
two Teledyne Oxygen Analyzers, an Omega Pressure Transducer, a 3D Instruments Pressure
Gauge, and a Porter Mass Flowmeter. Data was recorded on a computer via LabVIEW data
acquisition software. Inside the PRISM® separators were polysulfone fibers that acted as the
membrane used to separate oxygen and nitrogen from the inlet feed. Connected to the PRISM
separators were the mass flowmeter and oxygen analyzers. The flowmeter measured the non-
permeate stream’s flow rate, while the oxygen analyzers measured the percent oxygen in the
permeate and non-permeate streams. The inlet pressure could be manipulated by the user, and this
pressure was read by the 3D Instruments Pressure Gauge. A maximum gauge pressure of 150 psig
could be read with this instrument. On the gauge were major tick marks every 10 psig, and minor
tick marks every 1 psig for increased precision. The Omega Pressure Transducer converted the
pressure into an analog electrical signal that could be displayed digitally on the PC used in the lab9.
Time (seconds), non-permeate stream flow rate (SLPM), oxygen content in each stream (%) was
recorded with the LabVIEW data acquisition software.
When this equipment is running, the air flows from the “Air Supply” to the first membrane
separator, P1, as indicated by the green line in Figure 3. We used the Feed Pressure Control Valve,
V-2, to adjust the gauge pressure of the inlet air stream. After air enters the separator, the permeate
flow follows the path of the blue line, while the non-permeate flow follows the red line. The non-
permeate flow rate can be varied by turning the non-permeate flow controller, V-10. After the
streams enter the oxygen analyzers, the data for the inlet pressure, oxygen content for permeate

8
and non-permeate streams, and the total operating time will be displayed by the LabVIEW data
acquisition software.
FIGURE 3. Separation system flow chart
Operating Procedures
For this experiment, the inlet feed was run through the membrane separators at varied
pressures and flow rates in both co- and counter-current flow configurations. The maximum gauge
pressure achieved was 90 psig, and the highest flow rate attainable at the lowest pressure of 30
psig was 13 SLPM (Standard Liters Per Minute). The experiment was run under five different
pressures (30, 45, 60, 75, 90 psig) at flow rates of 4, 8, and 12 SLPM each. It was desirable to run
the experiment at five different pressures and three different flow rates in order to obtain a trend
that would allow analysis of the effect of pressure and flow rates on the separation of oxygen and
nitrogen. Data was recorded after the system reached steady state. Steady state was assumed to be
reached when the concentrations of oxygen in both the permeate and non-permeate streams

9
remained constant with respect to time. The valve settings necessary to achieve co-current or
counter-current flow is displayed in Table 1.
TABLE 1.Valves control for co-current and counter-current runs
RESULTS AND DISCUSSION
General Trends
From the experimental data collected, it appears that the general trend is that for a co-
current flow configuration, as the inlet feed pressure is increased, the oxygen content in the
permeate stream is decreased (Figure 4). This trend is not observed when the set-up is in counter-
current flow (Figure 5). Furthermore, it was generally observed that the oxygen content in the
permeate stream is higher when the set-up was in co-current flow than in counter-current flow.
This data is contradictory to the theory that a counter-current flow configuration would yield
higher permeate oxygen content7. It should be noted that the permeate oxygen content was never
observed to exceed 40%. In fact, with even just three data points per pressure, there seems to be
an asymptote at around 40% permeate oxygen content. This suggests that the membrane used in
this experiment has a maximum purification capability at near 40% oxygen in the permeate, a
value that is within the 30-45% range expected of current gas permeation membranes6.
Figure 6 shows that for both co- and counter-current flow set-ups, increasing the total flow
causes a decrease in non-permeate stream nitrogen content. These trends can be explained by
realizing that a higher inlet flow rate means that the feed stream travels through the membrane
faster. This decreases the time the feed stream spends in the gas separator, and thus it decreases
the time oxygen has to separate through the membrane. The result is that there will be more oxygen
Valves v1 v2 v4 v5 v6 v7 v8 v10
Co-current closed closed closed closed open closed closed closed
Counter-
current closed closed open closed closed closed closed closed

10
in the non-permeate stream, thereby decreasing the nitrogen content. The maximum non-permeate
nitrogen content found was at 94.5%, slightly under the 95-99.9% range given in literature6.
0.20
0.25
0.30
0.35
0.40
10.00 20.00 30.00 40.00
Per
mea
te O
2Fr
acti
on
Total Flow Rate (SCFH)
30 PSIG Co- 45 PSIG Co- 60 PSIG Co-
75 PSIG Co- 90 PSIG Co-
0.20
0.25
0.30
0.35
0.40
10.00 20.00 30.00 40.00
Per
mea
te O
2Fr
acti
on
Total Flow Rate (SCFH)
30 PSIG Counter- 45 PSIG Counter- 60 PSIG Counter-
75 PSIG Counter- 90 PSIG Counter-
FIGURE 4. Permeate oxygen content versus total
flow rate at varying inlet pressures in co-current
flow configuration.
FIGURE 5. Permeate oxygen content versus
total flow rate at varying inlet pressures in
counter-current flow configuration.
0.75
0.80
0.85
0.90
0.95
1.00
10.00 20.00 30.00 40.00
No
np
erm
eate
N2
Frac
tio
n
Total Flow Rate (SCFH)
30 PSIG Co- 45 PSIG Co- 60 PSIG Co- 75 PSIG Co- 90 PSIG Co-
30 PSIG Counter- 45 PSIG Counter- 60 PSIG Counter- 75 PSIG Counter- 90 PSIG Counter-
FIGURE 6. Non-permeate nitrogen content versus total flow rate at varying pressures
for both co and counter-current flow configurations.

11
Figure 7 displays the relationship between productivity (total oxygen flow in the permeate
stream) versus total flow rate and inlet pressure for both co- and counter-current flow set-ups.
While varying the flow rate appears to have minimal effect on productivity, it is clearly seen that
productivity increases as the inlet pressure increases. Moreover, the productivity yields are higher
in co-current flow than in counter-current flow. This goes against literature results since counter-
current configuration should theoretically yield a higher oxygen content in the permeate stream1.
Figure 8 shows that the enrichment ratio (ratio of oxygen content in the permeate stream
to the oxygen content in the non-permeate stream) is not heavily affected by flow configuration.
Adopting a co-current flow set-up yields only slightly better enrichment ratios than adopting
counter-current flows. This goes against what theory would predict – counter-current configuration
should result in higher oxygen content in the permeate stream, and thus a higher enrichment ratio.
It is easily seen that the enrichment ratio increases with increasing pressure. This is because the
pressure gradient, the driving force for gas separation, is greater at higher pressures4. It is also seen
that increasing the flow rate decreases the enrichment ratio. As mentioned above, increasing the
FIGURE 7. Productivity of oxygen separation versus total flow rate at varying pressures for both
co and counter-current configurations.
0.00
2.00
4.00
6.00
8.00
10.00 20.00 30.00 40.00
Pro
du
ctiv
ity
Total Flow Rate (SCFH)
30 PSIG Co- 45 PSIG Co- 60 PSIG Co- 75 PSIG Co- 90 PSIG Co-
30 PSIG Counter- 45 PSIG Counter- 60 PSIG Counter- 75 PSIG Counter- 90 PSIG Counter-

12
total flow rate increases the oxygen content in the non-permeate stream. Because this value is the
denominator of the enrichment ratio, an increase in non-permeate oxygen content decreases the
enrichment ratio.
Figure 9 depicts observed trends in recovery, the fraction of oxygen from the feed that is
recovered in the permeate stream. Recovery values were slightly higher when the trials were run
in a co-current configuration than in a counter-current configuration. This differs from theoretical
predictions, once again, as one would expect a counter-current flow situation to produce greater
recovery due to higher oxygen content in the permeate. Similar to the trend observed with the
enrichment ratio, recovery also increases with increased pressure and decreases with increased
flow rate. The reasons for this observed trend is similar to the reasons for the trend in enrichment
ratio. A higher pressure means better gas diffusion, which increases the oxygen content in the
permeate stream, while a higher flow rate decreases the time oxygen has to permeate through the
membrane, thus decreasing the amount of oxygen in the permeate stream.
0.00
2.00
4.00
6.00
10.00 20.00 30.00 40.00
Enri
chm
ent
Rat
io
Total Flow Rate (SCFH)
30 PSIG Co- 45 PSIG Co- 60 PSIG Co- 75 PSIG Co- 90 PSIG Co-
30 PSIG Counter- 45 PSIG Counter- 60 PSIG Counter- 75 PSIG Counter- 90 PSIG Counter-
FIGURE 8. Enrichment ratio versus total flow rate at varying pressures for both co and
counter-current configurations.

13
In comparing two flow configurations, it was found that a set-up with co-current flow
yielded higher productivity, enrichment, and recovery values. This is not in agreement with
theoretical predictions, as theory states that a counter-current flow configuration should provide
better gas separation.
Data Reproducibility
During week two of lab, all the trials were re-run to ensure statistical reliability. Using
statistical analysis, the P value was shown to be greater than 5% between week one and week two
data; therefore, the difference between each week’s data is insignificant.
Experimental Limitations
Originally, the group’s approach was to run trials varying the pressure from 30 psig to 150
psig. However, it was quickly discovered that even a pressure of 120 psig would be difficult to
maintain. During week one, a maximum pressure of 120 psig was reached for several runs, but this
0.00
0.50
1.00
10.00 20.00 30.00 40.00
Rec
ove
ry
Total Flow Rate (SCFH)
30 PSIG Co- 45 PSIG Co- 60 PSIG Co- 75 PSIG Co- 90 PSIG Co-
30 PSIG Counter- 45 PSIG Counter- 60 PSIG Counter- 75 PSIG Counter- 90 PSIG Counter-
FIGURE 9. Recovery of oxygen versus total flow rate at varying pressures for both co and
counter-current configurations.

14
maximum slowly decreased down to 110 psig, and then again to 100 psig. As a result, during week
one, data collected for maximum pressure was collected at 90 psig. It is speculated that the pressure
drop was due to other experiments being run simultaneously, some of which may have also been
using pressure manipulation devices.
RECOMMENDATIONS
1) Better inlet pressure control – the maximum pressure should not be dependent on whether
concurrent experiments were being run
2) More data points should be taken at each pressure value – trends would be more clear had
data points been taken at 2, 4, 6, 8, 10, and 12 SLPM
3) Human error could be considerably diminished if the data acquisition software could
directly input values into Excel
CONCLUSION
1) The data collected did not agree with theoretical predictions that a counter-current flow
configuration is more effective for gas separation.
2) Increasing pressure produces best results with respect to enrichment, productivity, and
recovery.
3) Increasing flow rate reduces enrichment and recovery values.

15
REFERENCES
1. Hwang, Sun Tak. "Membranes in Separations." Ed. Arnold Weissberger. Techniques of
Chemistry. Vol. 7. New York: Wiley-Interscience, 1970. 2-20. Print.
2. "Uses of Oxygen." Usesof.net. N.p., n.d. Web. <http://www.usesof.net/uses-of-
oxygen.html>.
3. "Uses of Nitrogen." Usesof.net. N.p., n.d. Web. <http://www.usesof.net/uses-of-
nitrogen.html>.
4. Rosenzweig, Mark D. "Unique Membrane System Spurs Gas Separations." Chemical
Engineering (1981): 66. Print.
5. "PRISM® PA6050-P3 Nitrogen Membrane Separators." N.p., n.d. Web.
<http://www.globalspec.com/FeaturedProducts/Detail/AirProductsPRISMMembranes/PR
ISM_PA6050P3_Nitrogen_Membrane_Separators/241794/0>.
6. Seader, JD and E.J. Henley; Separations Process Principles: Second Edition, John Wiley and
Sons, Inc, NJ (2006). Page 525.
7. Antonson, C. "Analysis of Gas Separation by Permeation in Hollow Fibers." Industrial and
Chemical Engineering Research 16.4 (1977): 465-68. Print.
8. MacLean, D. L., D. J. Stookey, and T. R. Metzger. "Fundamentals of Gas Permeation."
Hydrocarbon Processing (1983): 47-49. Print.
9. "Pressure Transducers and Transmitters." Pressure Transducers and Transmitters. Omega,
n.d. Web. 02 Feb. 2015. <http://www.omega.com/prodinfo/pressuretransducers.html>.

16
Sample Calculations Using Measured Values
Conditions (Week 1): Co-Current, 30 psig, 4 SLPM
𝑺𝑳𝑷𝑴 → 𝑺𝑪𝑭𝑯: 𝑆𝐶𝐹𝐻 = (𝐿
𝑚𝑖𝑛) ∗ (
60 𝑚𝑖𝑛
1 ℎ𝑜𝑢𝑟) ∗ (
1 𝑓𝑡3
28.317 𝐿) (1)
The measured units are given in Standard Liters Per Minute then it is converted into
Standard Cubic Feet Per Hour.
Example: (4 𝐿
𝑚𝑖𝑛) ∗ (
60 𝑚𝑖𝑛
1 ℎ𝑜𝑢𝑟) ∗ (
1 𝑓𝑡3
28.317 𝐿) = 8.45
𝑓𝑡3
ℎ𝑜𝑢𝑟
Mole Balance O2: (𝐹𝑇𝑜𝑡𝑎𝑙)(𝑂2,𝐹𝑒𝑒𝑑) = (𝑂2,𝑃) ∗ (𝐹𝑃) + (𝑂2,𝑁𝑜𝑛−𝑃) ∗ (𝐹𝑁𝑜𝑛−𝑃) (2)
A mole balance on oxygen is needed because both the permeate stream flow rate and
total flow rate are unknown in the total mass balance.
Total Flow Rate:
𝐹𝑇𝑜𝑡𝑎𝑙 = 𝐹𝑃 + 𝐹𝑁𝑜𝑛−𝑃 𝐹𝑃 = 𝐹𝑇𝑜𝑡𝑎𝑙 − 𝐹𝑁𝑜𝑛−𝑃 (Plug into oxygen mole balance)
𝐹𝑇𝑜𝑡𝑎𝑙 =(𝐹𝑃) ∗ (𝑂2,𝑃) + (𝐹𝑁𝑜𝑛−𝑃) ∗ (𝑂2,𝑁𝑜𝑛−𝑃)
(𝑂2,𝐹𝑒𝑒𝑑)
=(𝐹𝑇𝑜𝑡𝑎𝑙 − 𝐹𝑁𝑜𝑛−𝑃) ∗ (𝑂2,𝑃) + (𝐹𝑁𝑜𝑛−𝑃) ∗ (𝑂2,𝑁𝑜𝑛−𝑃)
(𝑂2,𝐹𝑒𝑒𝑑)
(Solve for the total flow rate)
(𝐹𝑇𝑜𝑡𝑎𝑙) ∗ (𝑂2,𝐹𝑒𝑒𝑑) = (𝐹𝑇𝑜𝑡𝑎𝑙 − 𝐹𝑁𝑜𝑛−𝑃) ∗ (𝑂2,𝑃) + (𝐹𝑁𝑜𝑛−𝑃) ∗ (𝑂2,𝑁𝑜𝑛−𝑃)
= (𝐹𝑇𝑜𝑡𝑎𝑙) ∗ (𝑂2,𝑃) − (𝐹𝑁𝑜𝑛−𝑃) ∗ (𝑂2,𝑃) + (𝐹𝑁𝑜𝑛−𝑃) ∗ (𝑂2,𝑁𝑜𝑛−𝑃)

17
(𝐹𝑇𝑜𝑡𝑎𝑙) ∗ (𝑂2,𝐹𝑒𝑒𝑑) − (𝐹𝑇𝑜𝑡𝑎𝑙) ∗ (𝑂2,𝑃) = (𝐹𝑁𝑜𝑛−𝑃) ∗ (𝑂2,𝑁𝑜𝑛−𝑃) − (𝐹𝑁𝑜𝑛−𝑃) ∗ (𝑂2,𝑃)
(𝐹𝑇𝑜𝑡𝑎𝑙) ∗ (𝑂2,𝐹𝑒𝑒𝑑 − 𝑂2,𝑃) = (𝐹𝑁𝑜𝑛−𝑃) ∗ (𝑂2,𝑁𝑜𝑛−𝑃) − (𝐹𝑁𝑜𝑛−𝑃) ∗ (𝑂2,𝑃)
𝐹𝑇𝑜𝑡𝑎𝑙 = (𝐹𝑁𝑜𝑛−𝑃)∗[(𝑂2,𝑁𝑜𝑛−𝑃)−(𝑂2,𝑃)]
(𝑂2,𝐹𝑒𝑒𝑑)−(𝑂2,𝑃) (3)
Example: 𝐹𝑇𝑜𝑡𝑎𝑙 = (8.45
𝑓𝑡3
ℎ𝑟)∗(.1540−.3490)
(.21−.3490)= 11.86
𝑓𝑡3
ℎ𝑟
Permeate Flow Rate: 𝐹𝑃 = (𝐹𝑇𝑜𝑡𝑎𝑙) − (𝐹𝑁𝑜𝑛−𝑃) (4)
After the total flow rate is known, the permeate flow rate can be calculated from the total
mass balance.
Example: 𝐹𝑃 = (11.86 𝑓𝑡3
ℎ𝑟) − (8.45
𝑓𝑡3
ℎ𝑟) = 3.40
𝑓𝑡3
ℎ𝑟
Non-Permeate N2: 𝑁2,𝑁𝑜𝑛−𝑃 = 1 − (𝑂2,𝑁𝑜𝑛−𝑃) (5)
The nitrogen content is calculated by subtracting the oxygen content from one.
Example: 𝑁2,𝑁𝑜𝑛−𝑃 = 1 − .1540 = .8460
Productivity: 𝑃 = (𝐹𝑃) ∗ (𝑂2,𝑃) (6)
Productivity is the volumetric flow rate of oxygen exiting the permeate stream.
Example: 𝑃 = (3.40 𝑓𝑡3
ℎ𝑟) ∗ (. 3490) = 1.19
𝑓𝑡3∗𝑂2
ℎ𝑟
Enrichment Ratio: 𝐸𝑅 = (𝑂2,𝑃)
(𝑂2,𝑁𝑜𝑛−𝑃) (7)

18
The enrichment ratio is the ratio of the oxygen content in the permeate stream to the
oxygen content in the non-permeate stream.
Example: 𝐸𝑅 = .3490
.1540= 2.27
Recovery: 𝑅 = [(𝐹𝑃)∗(𝑂2,𝑃)]
[(𝐹𝑇𝑜𝑡𝑎𝑙)∗(𝑂2,𝐹𝑒𝑒𝑑)] (8)
Recovery is the ratio of the oxygen flow rate being separated into the permeate stream to
the oxygen flow rate that is leaving in the non-permeate stream.
Example: 𝑅 = [(3.40
𝑓𝑡3
ℎ𝑟)∗(.3490)]
[(11.86 𝑓𝑡3
ℎ𝑟)∗(.21)]
= .48
Average: �̅� =1
𝑛∑ 𝑎𝑖
𝑛𝑖=1 (9)
This equation is used to find the average of the week 1 and 2 values.
Example: �̅� = (1
2) ∗ (11.86 + 12.25 ) = 12.05 𝑆𝐶𝐹𝐻
Standard Deviation: 𝜎 = √∑(𝑥𝑖−x̅)2
(𝑛−1) (10)
Excel’s built in standard deviation function was used in our calculations.
Percent Uncertainty: % 𝑢𝑛𝑐𝑒𝑟𝑡𝑎𝑖𝑛𝑡𝑦 =𝜎𝑥
𝑥∗ 100 (11)
The percent uncertainty measures the size of error of a value using the standard deviation.
Example: % 𝑢𝑛𝑐𝑒𝑟𝑡𝑎𝑖𝑛𝑡𝑦 𝑜𝑓 𝑝𝑒𝑟𝑚𝑒𝑎𝑡𝑒 𝑂2 =.01
.3490∗ 100 = 3.78

19
Flow
Inle
t Pre
ssure
PSIG
SLPM
SCFH
We
ek 1
We
ek 2
We
ek 1
We
ek 2
average
We
ek 1
We
ek 2
average
We
ek 1
We
ek 2
average
We
ek 1
We
ek 2
average
Co
-curre
nt
304
8.453.40
3.8011.86
12.2512.05
0.15400.1552
0.15460.3490
0.33180.3404
0.84600.8448
0.8454
Co
-curre
nt
308
16.902.78
3.4319.69
20.3320.01
0.18440.1805
0.18250.3654
0.35550.3605
0.81560.8195
0.8176
Co
-curre
nt
3012
25.352.38
2.7627.73
28.1127.92
0.19450.1928
0.19370.3751
0.36820.3717
0.80550.8072
0.8064
Co
un
ter-C
urre
nt
304
8.453.76
3.9512.22
12.4012.31
0.15610.1552
0.15570.3310
0.32730.3292
0.84390.8448
0.8444
Co
un
ter-C
urre
nt
308
16.903.47
4.0720.37
20.9720.67
0.18500.1801
0.18260.3318
0.33410.3330
0.81500.8199
0.8175
Co
un
ter-C
urre
nt
3012
25.352.87
2.2028.22
27.5527.89
0.19530.1978
0.19660.3400
0.35050.3453
0.80470.8022
0.8035
Co
-curre
nt
454
8.456.94
7.5815.39
16.0315.71
0.12050.1170
0.11880.3190
0.31370.3164
0.87950.8830
0.8813
Co
-curre
nt
458
16.906.20
6.0423.10
22.9423.02
0.15590.1565
0.15620.3574
0.35970.3586
0.84410.8435
0.8438
Co
-curre
nt
4512
25.355.28
5.7430.64
31.1030.87
0.17520.1725
0.17390.3770
0.37550.3763
0.82480.8275
0.8262
Co
un
ter-C
urre
nt
454
8.457.12
6.6215.57
15.0715.32
0.11970.1204
0.12010.3172
0.32440.3208
0.88030.8796
0.8800
Co
un
ter-C
urre
nt
458
16.906.04
6.1922.94
23.1023.02
0.15730.1555
0.15640.3574
0.35870.3581
0.84270.8445
0.8436
Co
un
ter-C
urre
nt
4512
25.355.60
5.4830.95
30.8330.89
0.17330.1739
0.17360.3762
0.37700.3766
0.82670.8261
0.8264
Co
-curre
nt
604
8.4511.86
11.2120.32
19.6619.99
0.09010.0931
0.09160.2954
0.29810.2968
0.90990.9069
0.9084
Co
-curre
nt
608
16.907.55
8.9124.45
25.8125.13
0.13460.1348
0.13470.3789
0.35260.3658
0.86540.8652
0.8653
Co
-curre
nt
6012
25.357.84
8.7133.19
34.0733.63
0.15350.1536
0.15360.3928
0.37410.3835
0.84650.8464
0.8465
Co
un
ter-C
urre
nt
604
8.4511.09
10.7319.54
19.1819.36
0.09220.0957
0.09400.2998
0.30000.2999
0.90780.9043
0.9061
Co
un
ter-C
urre
nt
608
16.9010.60
9.4627.50
26.3626.93
0.12980.1324
0.13110.3379
0.34860.3433
0.87020.8676
0.8689
Co
un
ter-C
urre
nt
6012
25.3511.11
8.1236.46
33.4734.97
0.15000.1555
0.15280.3469
0.38020.3636
0.85000.8445
0.8473
Co
-curre
nt
754
8.4516.68
16.2025.13
24.6524.89
0.07180.0733
0.07260.2800
0.28130.2807
0.92820.9267
0.9275
Co
-curre
nt
758
16.9013.34
12.1430.24
29.0429.64
0.11240.1137
0.11310.3337
0.34410.3389
0.88760.8863
0.8870
Co
-curre
nt
7512
25.3511.86
11.9937.21
37.3437.27
0.13760.1370
0.13730.3648
0.36440.3646
0.86240.8630
0.8627
Co
un
ter-C
urre
nt
754
8.4516.14
14.7124.59
23.1723.88
0.07500.0761
0.07560.2807
0.28690.2838
0.92500.9239
0.9245
Co
un
ter-C
urre
nt
758
16.9012.22
11.5929.12
28.5028.81
0.11640.1200
0.11820.3395
0.34120.3404
0.88360.8800
0.8818
Co
un
ter-C
urre
nt
7512
25.3511.26
11.2936.61
36.6436.62
0.13890.1381
0.13850.3701
0.37150.3708
0.86110.8619
0.8615
Co
-curre
nt
904
8.4529.18
26.4337.64
34.8836.26
0.05390.0561
0.05500.2552
0.25920.2572
0.94610.9439
0.9450
Co
-curre
nt
908
16.9016.11
16.4733.01
33.3733.19
0.09820.0985
0.09840.3273
0.32440.3259
0.90180.9015
0.9017
Co
-curre
nt
9012
25.3514.52
14.6439.88
39.9939.93
0.12350.1240
0.12380.3610
0.35890.3600
0.87650.8760
0.8763
Co
un
ter-C
urre
nt
904
8.4524.20
21.8832.65
30.3431.49
0.05650.0598
0.05820.2636
0.26800.2658
0.94350.9402
0.9419
Co
un
ter-C
urre
nt
908
16.9014.28
16.4431.18
33.3532.26
0.10450.0950
0.09980.3349
0.32820.3316
0.89550.9050
0.9003
Co
un
ter-C
urre
nt
9012
25.3513.83
14.3339.18
39.6839.43
0.12580.1250
0.12540.3644
0.36040.3624
0.87420.8750
0.8746
No
n-P
erm
eate
d Flo
w R
ateSC
FHSC
FH
Total Flo
w R
ateN
on
-Pe
rme
ated
O2
Pe
rme
ated
Flow
Rate
Pe
rme
ated
O2
No
n-P
erm
eate
d N
2

20

21

22
23
0
10
20
30
40
50
60
70
80
90
100
0.00 5.00 10.00
Pre
ssu
re (
psi
g)
Productivity
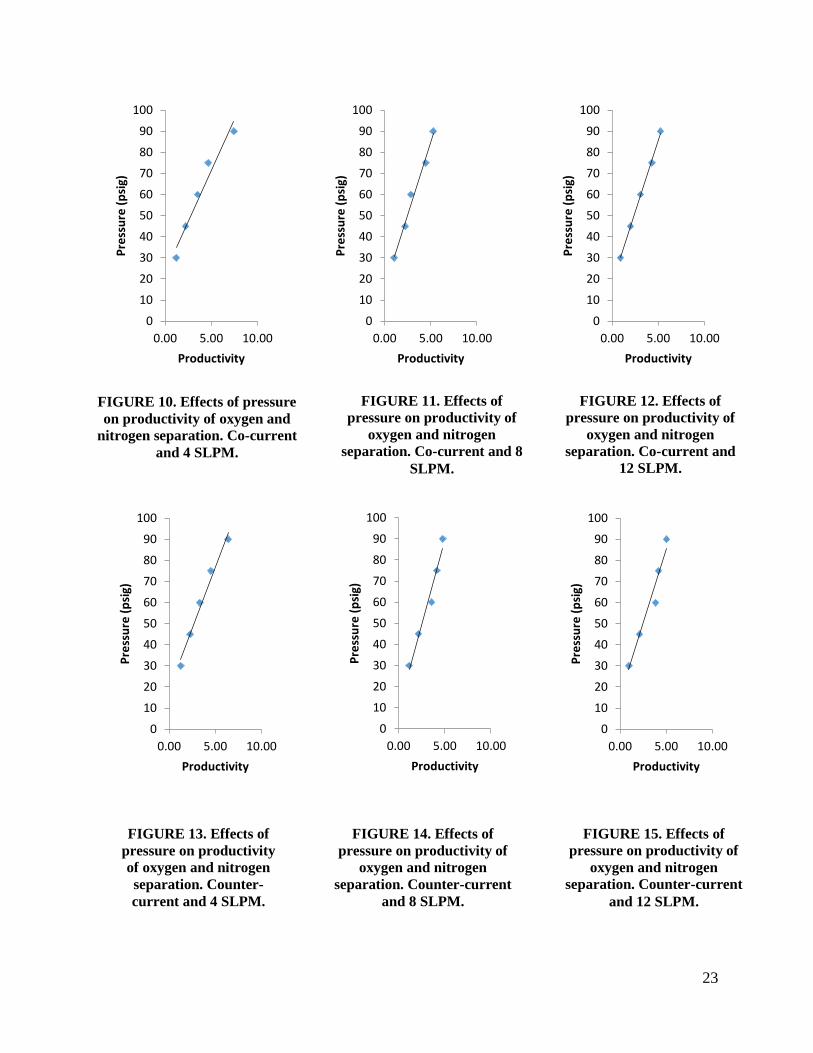
FIGURE 10. Effects of pressure
on productivity of oxygen and
nitrogen separation. Co-current
and 4 SLPM.
0
10
20
30
40
50
60
70
80
90
100
0.00 5.00 10.00P
ress
ure
(p
sig)
Productivity
FIGURE 11. Effects of
pressure on productivity of
oxygen and nitrogen
separation. Co-current and 8
SLPM.
0
10
20
30
40
50
60
70
80
90
100
0.00 5.00 10.00
Pre
ssu
re (
psi
g)
Productivity
FIGURE 12. Effects of
pressure on productivity of
oxygen and nitrogen
separation. Co-current and
12 SLPM.
0
10
20
30
40
50
60
70
80
90
100
0.00 5.00 10.00
Pre
ssu
re (
psi
g)
Productivity
FIGURE 13. Effects of
pressure on productivity
of oxygen and nitrogen
separation. Counter-
current and 4 SLPM.
0
10
20
30
40
50
60
70
80
90
100
0.00 5.00 10.00
Pre
ssu
re (
psi
g)
Productivity
FIGURE 14. Effects of
pressure on productivity of
oxygen and nitrogen
separation. Counter-current
and 8 SLPM.
0
10
20
30
40
50
60
70
80
90
100
0.00 5.00 10.00
Pre
ssu
re (
psi
g)
Productivity
FIGURE 15. Effects of
pressure on productivity of
oxygen and nitrogen
separation. Counter-current
and 12 SLPM.