Embed Size (px)
Citation preview

SRK Consulting (Canada) Inc. 2200–1066 West Hastings Street Vancouver, BC V6E 3X2
T: +1.604.681.4196 F: +1.604.687.5532 [email protected] www.srk.com
CBK/SJD MPM_PolleyFlats_CuGCM_1CI008.003_20161223_CBK December 2016
Memo To: Colleen Hughes Client: Mount Polley Mining Corp.
From: Chris Kennedy, SRK Pierre Stecko, Minnow Environmental Cheryl Wiramanaden, Minnow Environmental
Project No: 1CI008.003
Cc: ‘Lyn Anglin, Imperial Metals Stephen Day, SRK
Date: December 23, 2016
Subject: Mount Polley Spilled Tailings: Polley Flats Copper Geochemical Conceptual Model – FINAL
1 Introduction This memo presents a geochemical conceptual model (GCM) to explain the dissolved concentrations of copper in ditches and various ponds and pools that are collecting contact water from tailings materials in the upper Hazeltine Creek area (also referred to as the Polley Flats or Polley Plug area). The tailings were released during the tailings dam breach on August 4, 2014 at the Mount Polley Mine (MPM), located approximately 55 km north-east of Williams Lake, BC. Note that what is referred to as tailings in this document is a mixture of tailings, native soils, glacial sediment including till, and vegetation debris.
Mount Polley Mining Corporation (MPMC) requested that SRK and Minnow Environmental develop the GCM presented herein to help explain and evaluate the current and future copper concentrations that may impact water quality in Hazeltine Creek. This memo has been prepared for internal use by MPMC and its consulting team in response to a request from the BC Ministry of Environment (BC MOE, letter to Dale Reimer dated June 20, 2016) for the MPM to manage copper leaching impacts on Hazeltine Creek from the Polley Flats area. SRK and Minnow understand that this memo may also be provided to the BC MOE, Williams Lake Indian Band, Soda Creek First Nation, and others including the public.
The Polley Flats Copper GCM provides a basis for the following components:
• Source of copper leaching;
• Solubility control of copper;
• Influence of suboxic conditions;
• Influence of organic acids on leaching; and
SRK Consulting and Minnow Environmental Page 2
CBK/SJD MPM_PolleyFlats_CuGCM_1CI008.003_20161223_CBK December 2016
• A prediction of future copper concentrations.
Following the GCM, this memo also provides general inputs into reclamation planning based on the GCM, to limit copper loadings from the Polley Flats tailings (and sub-aerial tailings in general).
The GCM focuses mainly on copper, pH, and dissolved organic carbon (DOC) at this time given the need to specifically address the concerns raised by the BC MOE and the respective Indian Bands. Iron is also included in the latter part of the assessment to assist with data interpretation. More complete assessment of other parameters will be provided in a kinetic testing completion report to be provided at a later date.
2 Background As part of investigations of the tailings materials that spilled from the August 2014 tailings dam breach, geochemical characterization studies were completed by SRK (2015a, 2015b) to determine the composition, mineralogy, and leaching rates of the spilled tailings.
The main geochemical finding of these previous studies was that the MPM tailings are not potentially acid rock drainage (ARD) generating, which is consistent with the mineralogy of the tailings, the historical understanding of the tailings, and the low sulphur nature of the ore deposit (SRK 2015a). Weathering and leaching of the tailings would be expected to occur under neutral to basic pH conditions only, which results in low mineral and metal-specific solubility compared to acidic conditions. This is fundamental to understanding the long term copper leaching from the spilled tailings at Mount Polley, as release rates and copper concentrations will be constrained at neutral pH conditions.
Examples of copper concentration control are seen in available data sets from waste rock seepage monitoring at MPM and a number of other copper porphyry mine sites in British Columbia (Day and Rees 2006) (Figure 2-1), where copper concentrations are constrained around an average of 0.01 mg/L at pH 8. As the MPM tailings have an excess of carbonate that will neutralize any acidity produced from sulphide oxidation, pH is not predicted to ever go below 7; and the much higher copper concentrations associated with lower pH in Figure 2-1 will not develop at Mount Polley. The Day and Rees (2006) dataset is for waste rock, which will have coarser particles along with fine-grained material, but the study illustrates the first principle relationship between copper and pH from mine sites. Given that the tailings from the MPM are crushed rock, SRK considers that the Day and Rees (2006) dataset is applicable to the GCM for the MPM.
SRK Consulting and Minnow Environmental Page 3
CBK/SJD MPM_PolleyFlats_CuGCM_1CI008.003_20161223_CBK December 2016
Figure 2-1: Copper concentrations in waste rock seepage from BC Copper Porphyry Mines. Source: Modified from Day and Rees (2006)
MPM tailings are enriched in copper when compared to typical crustal rocks (basalt) (Price 1997). Previous work at MPM (SRK 2015a, b) indicates that the leachable or reactive portion of copper is only associated with sulphide minerals and requires oxidation to be leached. A significant portion of the copper in the tailings (often greater than 50%) is associated with a relatively inert non-sulphide phase.
MPM and the BC MOE have found dissolved copper concentrations upwards of 0.05 mg/L in the ditches and pools alongside the upper reaches of Hazeltine Creek. The ditches were created partly as temporary water diversion structures, but also to collect tailings contact water during the initial restoration efforts of Hazeltine Creek. Restoration efforts have included removing tailings down to native materials (i.e. glacial till) along the engineered flow path of Hazeltine Creek and rock-armoring the channel with low sulphur waste rock from the MPM.
SRK understands that the BC MOE has requested a plan from MPM to address copper leaching from the Polley Flats area. Before a remediation plan can be prepared, the source and fate of copper needs to be understood. The conceptual model presented herein provides input in support of effective seep management decisions.
3 Approach An initial GCM was developed for the tailings (SRK 2015a) and the model presented herein builds from the initial work, but is more specific to the Polley Flats area. The initial GCM was based on
0.0001
0.001
0.01
0.1
1
10
100
1000
2 3 4 5 6 7 8 9
Dis
solv
ed C
oppe
r (m
g/L)
pH
Island Copper
C
Huckleberry
Kitsault
Kemess
Mount Polley

SRK Consulting and Minnow Environmental Page 4
CBK/SJD MPM_PolleyFlats_CuGCM_1CI008.003_20161223_CBK December 2016
the current understanding of the site geology, ore processing, tailings deposition, and characterization results of tailings collected along the banks of Hazeltine Creek and within Quesnel Lake and Polley Lake.
Since the initial GCM, some of the tailings in the Polley Flats area have been excavated to natural ground as part of the remediation work on Hazeltine Creek. Additional data, including site monitoring data and over a year of laboratory column testing (i.e. a weathering test) are also available. The new configuration of the Polley Flats area and the additional data has been used to further develop the GCM model and confirm or revise previous assumptions. Data used in this GCM is presented in Section 4.
4 Supporting Information 4.1 Polley Flats Area
The Polley Flats (POF) area is located between the Tailings Storage Facility (TSF) and the upper portion of Hazeltine Creek immediately below Polley Lake but upstream of the water discharge location from the MPM water treatment plant (i.e. up to the HAC-13 monitoring location). This area is approximately 1 km at its widest (east-west) and extends from Polley Lake downstream (north-south) to HAC-13, over a distance of approximately 0.85 km, or a total surface area of 85 ha (Figure 4-1). Tailings in this area were also the deepest observed of the depositional areas downstream of the TSF and are typically over 1 metre, but less than 5 metres deep. Intermixed with the tailings materials are construction materials from the tailings dam and natural sediments (e.g. peat and soils as well as glacial sediments) and vegetation debris such as trees.

SRK Consulting and Minnow Environmental Page 5
CBK/SJD MPM_PolleyFlats_CuGCM_1CI008.003_20161223_CBK December 2016
Figure 4-1: Aerial view of Polley Flats Area.
Source: Aerial image taken in June 2016 by MPMC.
Notes: Reclamation progress since the photo was taken has resulted in removal of POF-3, and POF-2 now flows to the water treatment plant (WTP) discharge location.
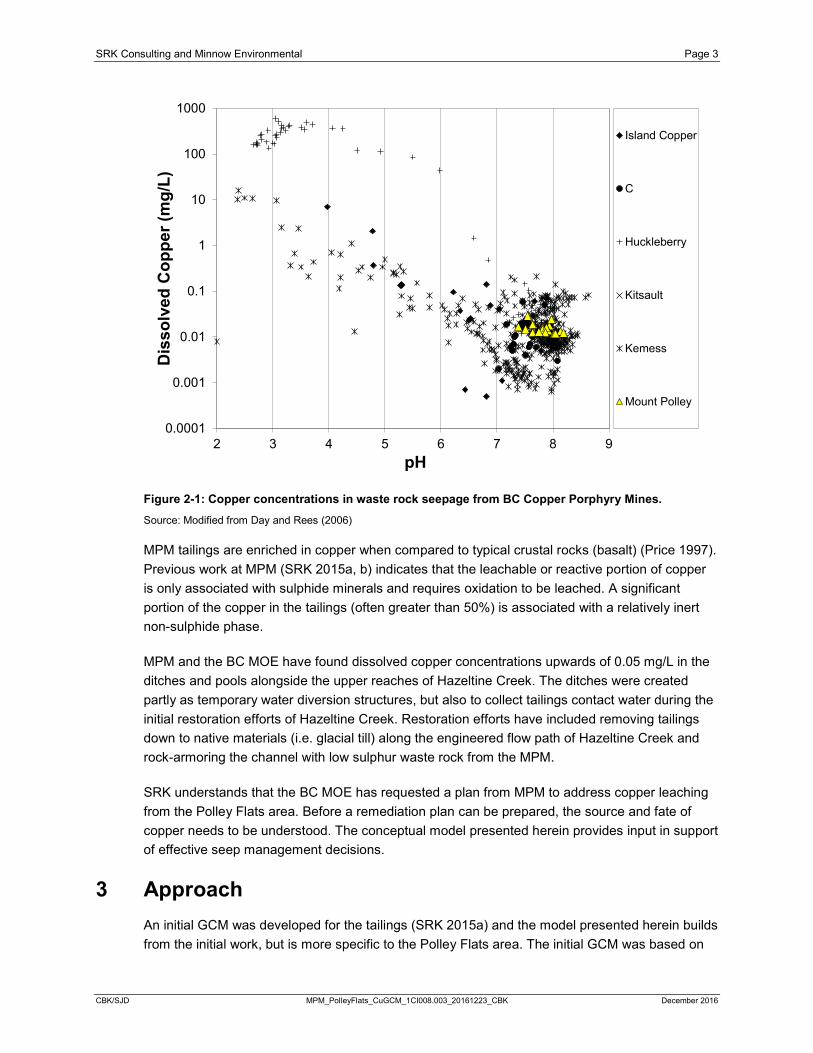
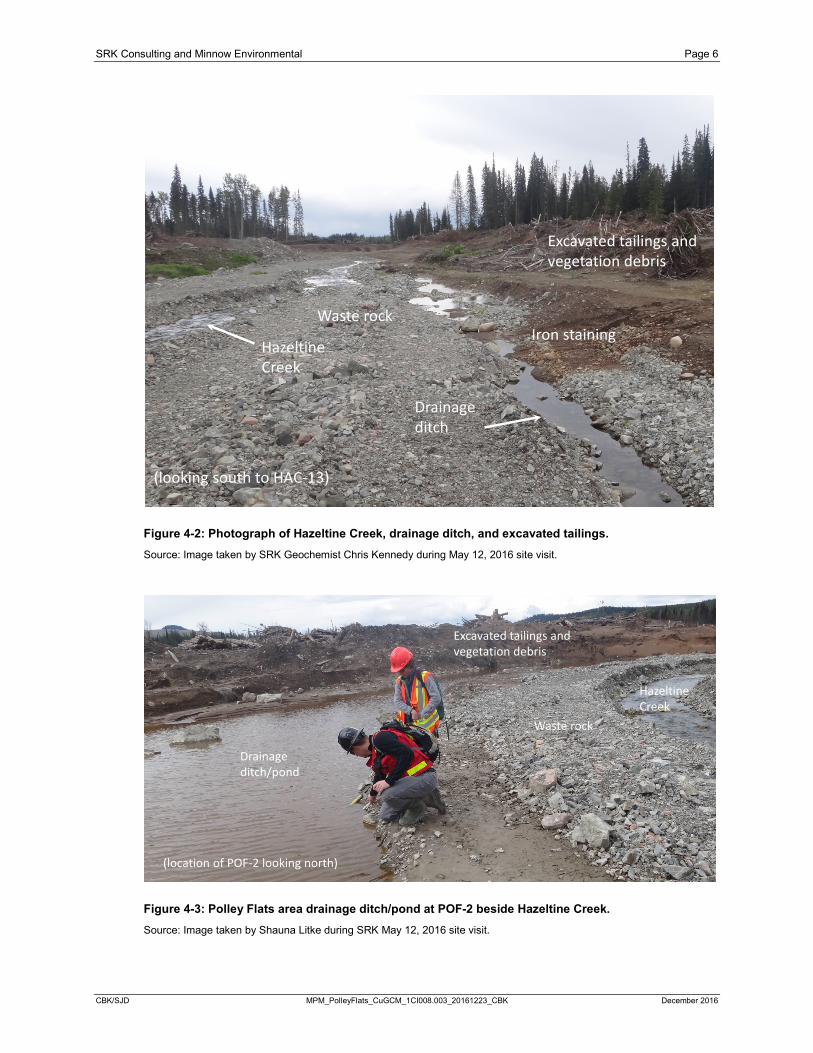
Crossing through the Polley Flats area from Polley Lake is Hazeltine Creek. As previously described (Section 2), the Hazeltine Creek flow path was created by excavating the tailings down to natural ground and lining the channel with low sulphur non-acid generating waste rock from the MPM. Water collection ditches have been established parallel to Hazeltine Creek, with some eventually draining into Hazeltine Creek, and others remaining isolated on the surface (although infiltration to groundwater is expected). Groundwater seeps can be seen in some of the locations and some are stained orange-red, likely due to neutral pH iron hydroxide precipitation. A photograph of one segment of Hazeltine Creek and a small drainage ditch is provided in Figure 4-2. A photograph of one of the larger pools of water beside Hazeltine Creek is provided in Figure 4-3. The locations of Figure 4-2 and Figure 4-3 are shown in Figure 4-1.
Polley Flats Area
Tailings Storage Facility
PolleyLake
Polley Lake Weir
HAC-10
Hazeltine Creek
Drainage ditches
HAC-13
N
Figure 4-3 location
Figure 4-2 location
POF-ESSPOF-2
POF-1
POF-3
WTP
WTP discharge
SRK Consulting and Minnow Environmental Page 6
CBK/SJD MPM_PolleyFlats_CuGCM_1CI008.003_20161223_CBK December 2016
Figure 4-2: Photograph of Hazeltine Creek, drainage ditch, and excavated tailings. Source: Image taken by SRK Geochemist Chris Kennedy during May 12, 2016 site visit.
Figure 4-3: Polley Flats area drainage ditch/pond at POF-2 beside Hazeltine Creek. Source: Image taken by Shauna Litke during SRK May 12, 2016 site visit.
Hazeltine Creek
Drainage ditch
(looking south to HAC-13)
Excavated tailings and vegetation debris
Waste rock Iron staining
Excavated tailings and vegetation debris
Waste rock
Drainage ditch/pond
Hazeltine Creek
(location of POF-2 looking north)

SRK Consulting and Minnow Environmental Page 7
CBK/SJD MPM_PolleyFlats_CuGCM_1CI008.003_20161223_CBK December 2016
4.2 Field Monitoring
A large number of locations around the MPM are being monitored for water chemistry. Dissolved metal concentrations are being used rather than total metal concentrations because totals are affected by suspended sediment whereas dissolved concentrations provide a better measure of the metal fraction associated with leaching.
Six locations were chosen for use in this assessment to help understand copper concentrations in seeps associated with tailings prior to entering Hazeltine Creek and also within Hazeltine Creek itself. The locations are shown in Figure 4-1 and summarized in Table 4-1. Of note are the POF-2 and POF-3 locations, which were locations of water draining a cedar swamp that was passing through (and over) the tailings. These two locations no longer exist due to 2016 reclamation activities and the water now drains to the water treatment plant discharge location as opposed to through the tailings.
Table 4-1: Field sampling locations used in GCM. Location (UTM Zone 10U) Sample ID Sample Description Easting Northing
HAC-10 Outlet of Polley Lake at weir 595754 5820776 HAC-13 Hazeltine Creek upstream of discharge 595924 5819913 POF-1 Contact water from tailings 595736 5820295 POF-2 Cedar swamp water passing through tailings 595663 5820169 POF-3 Cedar swamp water passing through tailings 595703 5820102
POF-ESS East side contact water from tailings 595775 5820258 Source: MPM and Z:\01_SITES\Mt_Polley\1CI008.003_Privileged_and_Confidential\500_Reporting\6.PolleyFlats_GCM\memo\[Tables_POF_GCM_1CI008.003_REV00_CBK.xlsx]
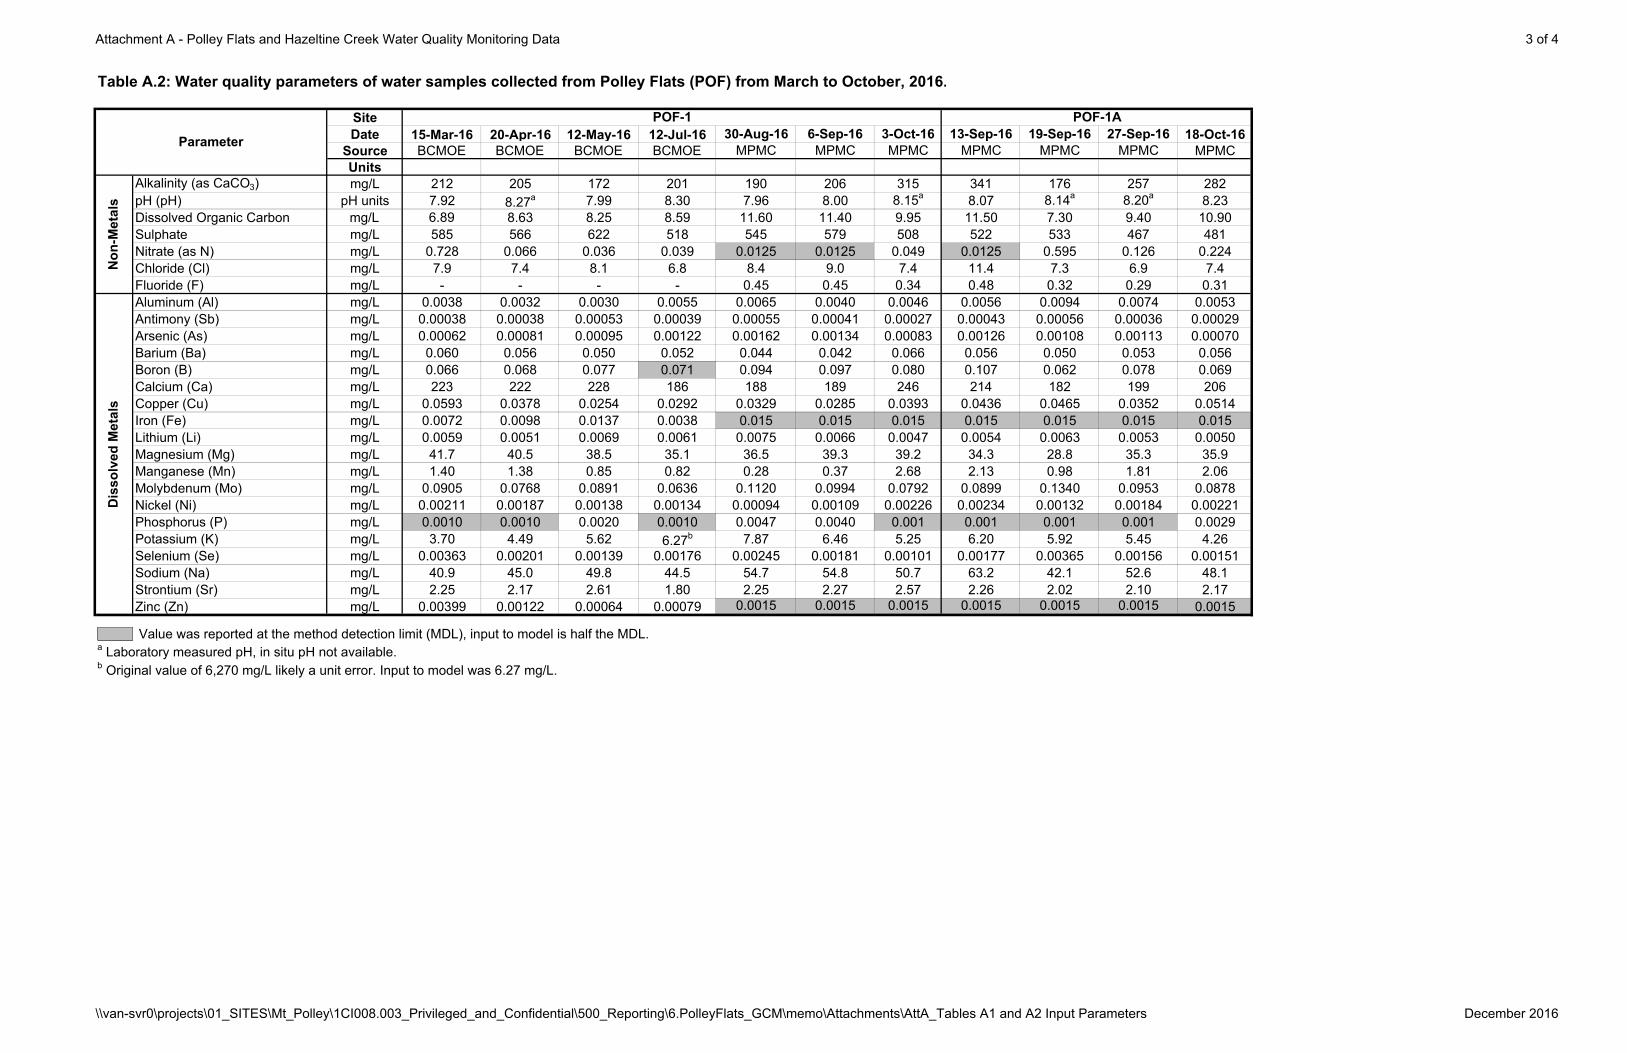
Monitoring results forwarded by BC MOE and MPMC for pH, copper, and DOC in 2015 and 2016 are provided in Figure 4-4, Figure 4-5, and Figure 4-6, respectively. SRK did not review the data for quality assurance or quality control, but samples collected by MPMC were subject to their internal QA/QC manual and SRK assumed the data were valid. Flow volumes were not available so it is not possible to present chemical loading. Relevant monitoring chemistry is provided as Attachment A.
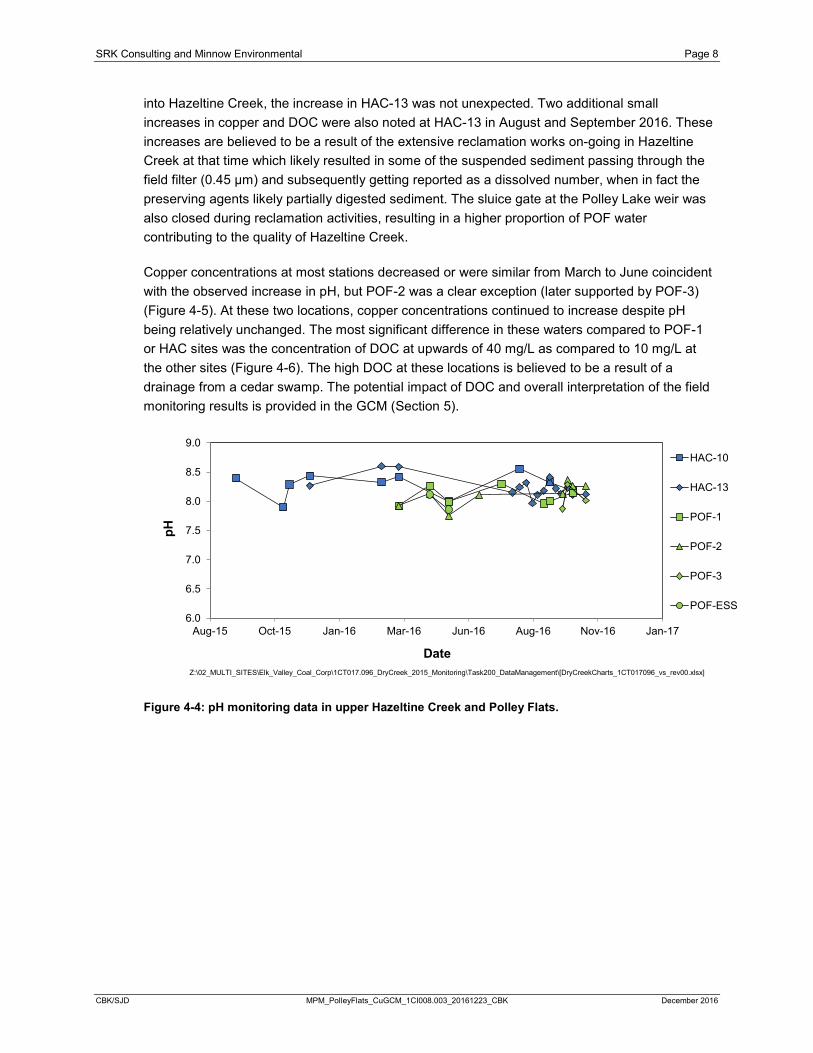
Hazeltine Creek and the Polley Flats contact water have remained pH neutral to alkaline since the tailings spill. This is consistent with the geochemical characterization of the MPM solids which indicated that the potential for ARD from these tailings is negligible (SRK 2015a). A slight increase in pH (7.6 to 8.3) in the Polley Flats waters was noted from the early spring (March 2016) to the most recent sampling date (October 2016 (Figure 4-4)).
Higher copper concentrations in the Polley Flats seep waters, compared to Hazeltine Creek were not unexpected as the seep waters effectively represent tailings contact/pore water with minimal dilution. Hazeltine Creek is likely dominated by drainage from Polley Lake given that it is primarily acting as a drainage conduit to Quesnel Lake. Generally, copper concentrations in Hazeltine Creek were relatively stable. An increase at HAC-13 in March 2016 was noted at the same time that concentrations in the Polley Flats waters were also highest. Given that Hazeltine Creek is passing through nearly a 1 km stretch surrounded by tailings with many of the ditches draining
SRK Consulting and Minnow Environmental Page 8
CBK/SJD MPM_PolleyFlats_CuGCM_1CI008.003_20161223_CBK December 2016
into Hazeltine Creek, the increase in HAC-13 was not unexpected. Two additional small increases in copper and DOC were also noted at HAC-13 in August and September 2016. These increases are believed to be a result of the extensive reclamation works on-going in Hazeltine Creek at that time which likely resulted in some of the suspended sediment passing through the field filter (0.45 µm) and subsequently getting reported as a dissolved number, when in fact the preserving agents likely partially digested sediment. The sluice gate at the Polley Lake weir was also closed during reclamation activities, resulting in a higher proportion of POF water contributing to the quality of Hazeltine Creek.
Copper concentrations at most stations decreased or were similar from March to June coincident with the observed increase in pH, but POF-2 was a clear exception (later supported by POF-3) (Figure 4-5). At these two locations, copper concentrations continued to increase despite pH being relatively unchanged. The most significant difference in these waters compared to POF-1 or HAC sites was the concentration of DOC at upwards of 40 mg/L as compared to 10 mg/L at the other sites (Figure 4-6). The high DOC at these locations is believed to be a result of a drainage from a cedar swamp. The potential impact of DOC and overall interpretation of the field monitoring results is provided in the GCM (Section 5).
Figure 4-4: pH monitoring data in upper Hazeltine Creek and Polley Flats.
6.0
6.5
7.0
7.5
8.0
8.5
9.0
Aug-15 Oct-15 Jan-16 Mar-16 Jun-16 Aug-16 Nov-16 Jan-17
pH
Date
HAC-10
HAC-13
POF-1
POF-2
POF-3
POF-ESS
Z:\02_MULTI_SITES\Elk_Valley_Coal_Corp\1CT017.096_DryCreek_2015_Monitoring\Task200_DataManagement\[DryCreekCharts_1CT017096_vs_rev00.xlsx]

SRK Consulting and Minnow Environmental Page 9
CBK/SJD MPM_PolleyFlats_CuGCM_1CI008.003_20161223_CBK December 2016
Figure 4-5: Copper (dissolved) monitoring data in upper Hazeltine Creek and Polley Flats.
Figure 4-6: Dissolved organic carbon monitoring data in upper Hazeltine Creek and Polley Flats.
4.3 Laboratory Column Testing Data
Complete details of testing set-up are provided in SRK (2015b), but for ease of reference the key components of the test are provided below.
Three column tests have been running since April 2015. Columns one and two are magnetite sands while the third is grey tailings. Eighty-one (81) weeks of data had been received as of the date of this memo. The grey tailings sample is finer grained than the magnetite sand samples and it takes several weeks to collect enough water to perform an analysis, as opposed to one week per magnetite sands samples, resulting in fewer data points for the grey tailings. The samples being tested represent the mean and upper (i.e. ~95th percentile) range of solid phase copper
0.00
0.02
0.04
0.06
0.08
0.10
Aug-15 Oct-15 Jan-16 Mar-16 Jun-16 Aug-16 Nov-16 Jan-17
Dis
solv
ed C
oppe
r (m
g/L)
Date
HAC-10
HAC-13
POF-1
POF-2
POF-3
POF-ESS
Z:\02_MULTI_SITES\Elk_Valley_Coal_Corp\1CT017.096_DryCreek_2015_Monitoring\Task200_DataManagement\[DryCreekCharts_1CT017096_vs_rev00.xlsx]
0
5
10
15
20
25
30
35
40
45
Aug-15 Oct-15 Jan-16 Mar-16 Jun-16 Aug-16 Nov-16 Jan-17Dis
solv
ed O
rgan
ic C
arbo
n (m
g/L)
Date
HAC-10
HAC-13
POF-1
POF-2
POF-3
POF-ESS
Z:\02_MULTI_SITES\Elk_Valley_Coal_Corp\1CT017.096_DryCreek_2015_Monitoring\Task200_DataManagement\[DryCreekCharts_1CT017096_vs_rev00.xlsx]

SRK Consulting and Minnow Environmental Page 10
CBK/SJD MPM_PolleyFlats_CuGCM_1CI008.003_20161223_CBK December 2016
content identified during the initial characterization work on the samples collected along Hazeltine Creek (i.e. between 900 and 1200 mg/kg Cu).
The intent of the column tests is to establish weathering rates under atmospheric conditions and to evaluate the effect of longer water flow paths and lower water to solids ratios than are represented by the standard humidity cells. The lower water to solids ratios were specifically chosen to simulate field conditions as closely as possible in order to evaluate reasonable worse-case concentrations expected from the tailings. Biasing the tests to worse-case concentrations also provided the basis to evaluate whether a concentration maximum would be reached through attenuation processes such as secondary mineral formation.
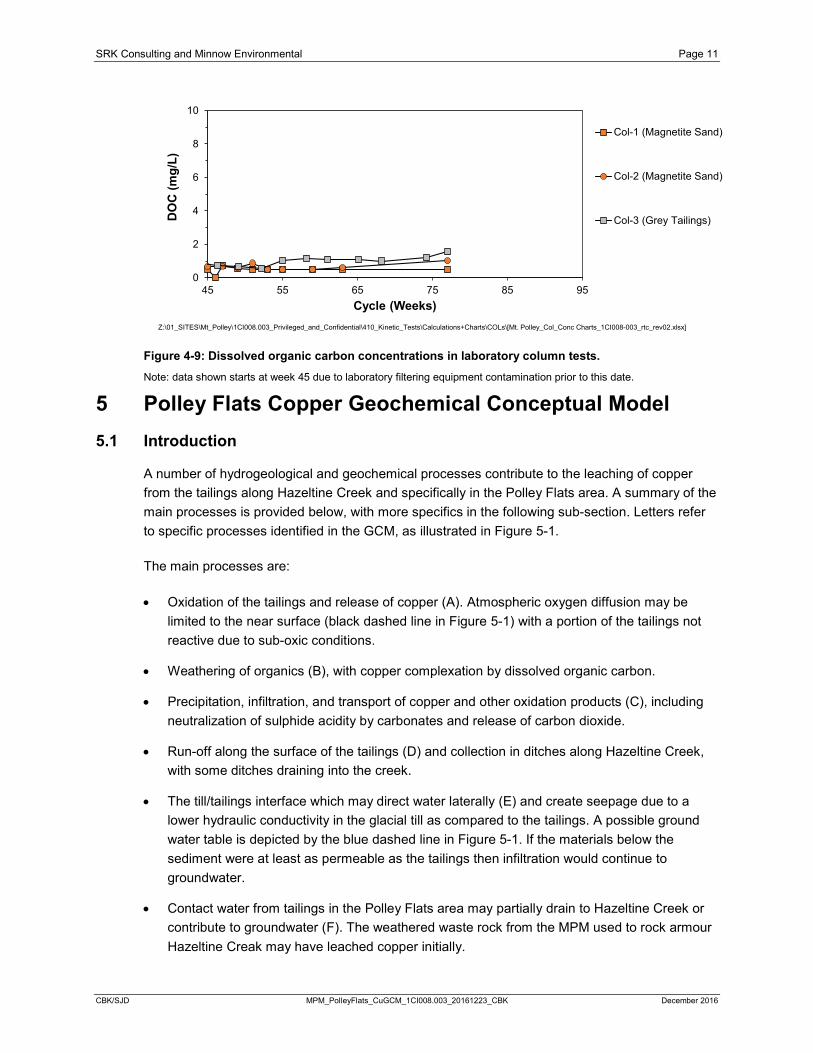
Leachates showed an initial increase in pH from around 7.5 to 8.2 (Figure 4-7) during the first five weeks of testing with a coincident copper concentration decrease in all tests from a maximum of 0.054 mg/L to 0.013 mg/L in COL-1, which is the test containing approximately 1200 mg/kg solid phase copper (Figure 4-8). The pH changes and related copper concentrations are similar to what were measured in the POF-1 samples. Concentrations of DOC were relatively low compared to the field and more typical of pore water in mine waste material (Figure 4-9). The interpretation of these concentrations is provided in the GCM (Section 5).
Figure 4-7: pH in laboratory column tests.
Figure 4-8: Copper concentrations in laboratory column tests.
6.0
6.5
7.0
7.5
8.0
8.5
9.0
0 20 40 60 80 100
pH
Cycle (Weeks)
Col-1 (Magnetite Sand)
Col-2 (Magnetite Sand)
Col-3 (Grey Tailings)
Z:\01_SITES\Mt_Polley\1CI008.003_Privileged_and_Confidential\410_Kinetic_Tests\Calculations+Charts\COLs\[Mt. Polley_Col_Conc Charts_1CI008-003_rtc_rev02.xlsx]
0.00
0.02
0.04
0.06
0.08
0.10
0 20 40 60 80 100
Dis
solv
ed C
oppe
r (m
g/L)
Cycle (Weeks)
Col-1 (Magnetite Sand)
Col-2 (Magnetite Sand)
Col-3 (Grey Tailings)
Z:\01_SITES\Mt_Polley\1CI008.003_Privileged_and_Confidential\410_Kinetic_Tests\Calculations+Charts\COLs\[Mt. Polley_Col_Conc Charts_1CI008-003_rtc_rev02.xlsx]
SRK Consulting and Minnow Environmental Page 11
CBK/SJD MPM_PolleyFlats_CuGCM_1CI008.003_20161223_CBK December 2016
Figure 4-9: Dissolved organic carbon concentrations in laboratory column tests. Note: data shown starts at week 45 due to laboratory filtering equipment contamination prior to this date.
5 Polley Flats Copper Geochemical Conceptual Model 5.1 Introduction
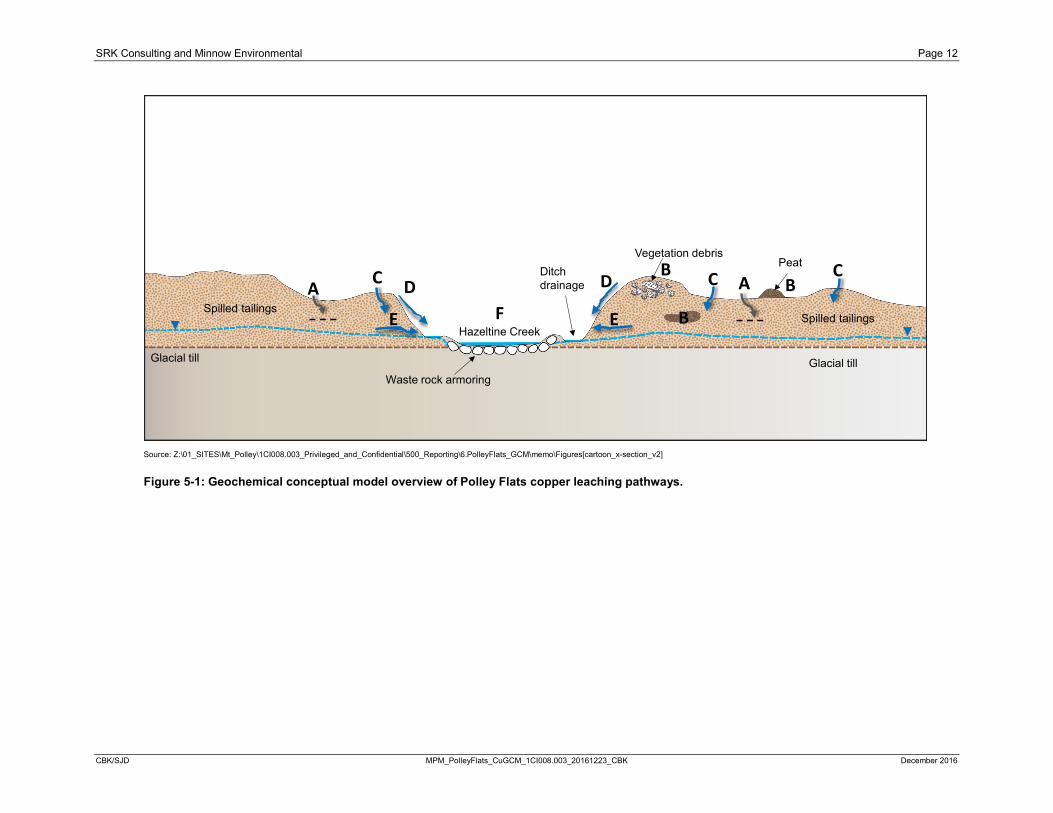
A number of hydrogeological and geochemical processes contribute to the leaching of copper from the tailings along Hazeltine Creek and specifically in the Polley Flats area. A summary of the main processes is provided below, with more specifics in the following sub-section. Letters refer to specific processes identified in the GCM, as illustrated in Figure 5-1.
The main processes are:
• Oxidation of the tailings and release of copper (A). Atmospheric oxygen diffusion may be limited to the near surface (black dashed line in Figure 5-1) with a portion of the tailings not reactive due to sub-oxic conditions.
• Weathering of organics (B), with copper complexation by dissolved organic carbon.
• Precipitation, infiltration, and transport of copper and other oxidation products (C), including neutralization of sulphide acidity by carbonates and release of carbon dioxide.
• Run-off along the surface of the tailings (D) and collection in ditches along Hazeltine Creek, with some ditches draining into the creek.
• The till/tailings interface which may direct water laterally (E) and create seepage due to a lower hydraulic conductivity in the glacial till as compared to the tailings. A possible ground water table is depicted by the blue dashed line in Figure 5-1. If the materials below the sediment were at least as permeable as the tailings then infiltration would continue to groundwater.
• Contact water from tailings in the Polley Flats area may partially drain to Hazeltine Creek or contribute to groundwater (F). The weathered waste rock from the MPM used to rock armour Hazeltine Creak may have leached copper initially.
0
2
4
6
8
10
45 55 65 75 85 95
DO
C (m
g/L)
Cycle (Weeks)
Col-1 (Magnetite Sand)
Col-2 (Magnetite Sand)
Col-3 (Grey Tailings)
Z:\01_SITES\Mt_Polley\1CI008.003_Privileged_and_Confidential\410_Kinetic_Tests\Calculations+Charts\COLs\[Mt. Polley_Col_Conc Charts_1CI008-003_rtc_rev02.xlsx]
SRK Consulting and Minnow Environmental Page 12
CBK/SJD MPM_PolleyFlats_CuGCM_1CI008.003_20161223_CBK December 2016
Source: Z:\01_SITES\Mt_Polley\1CI008.003_Privileged_and_Confidential\500_Reporting\6.PolleyFlats_GCM\memo\Figures[cartoon_x-section_v2]
Figure 5-1: Geochemical conceptual model overview of Polley Flats copper leaching pathways.
Spilled tailings
Ditch drainage CA
E
D AF
B
Glacial till
Spilled tailings
Glacial till
PeatVegetation debris
B
BC C
E
D
Hazeltine Creek
Waste rock armoring

SRK Consulting and Minnow Environmental Page 13
CBK/SJD MPM_PolleyFlats_CuGCM_1CI008.003_20161223_CBK December 2016
5.2 Weathering of Tailings by Oxygen
Some of the tailings in the Polley Flats area are now exposed to atmospheric conditions. As a result, sulphide minerals (e.g. pyrite (FeS2) and chalcopyrite (CuFeS2)) will react in the presence of atmospheric oxygen, produce acid, and leach copper. The acid produced is present in micro-environments (grain scale) but as water moves through the tailings, this acid will interact with carbonate minerals and be neutralized. Macro-scale acidity (i.e. acidic seepage) is not predicted as there is an excess of carbonate neutralization potential over acid potential in the tailings (SRK 2015a). Any copper that is leached from the tailings will be subject to an upper limit in terms of concentrations, as secondary minerals (e.g. malachite (Cu2CO3(OH)2)) will precipitate from solution and provide mineral solubility control (Section 5.3).
The lower pH measured at the start of the column test, and in the Polley Flats drainage ditches in March 2016, is attributed to grain-scale acidity around oxidizing sulphide minerals before it is flushed and neutralized by carbonate minerals. The samples for the column test were collected and stored in the laboratory for several months before testing began. During this time, the sulphide minerals would still have been oxidizing but the acidity formed could not be neutralized by the available carbonate minerals as there was no flow of water through the sample. As the column test started and water was passed through the tailings, pH increased and copper concentrations decreased, reflecting the flushing of the (micro) grain-scale acidity (Figure 4-7 and Figure 4-8). The accumulation of sulphide oxidation products was also confirmed by sulphate concentrations in the column tests which started out relatively high (upwards of 2,000 mg/L) during the first few weeks of testing and decreased to less than 100 mg/L over the same time period as copper concentrations declined SRK (2015b).
A similar process is expected to occur in the Polley Flats tailings. During the winter, the majority of tailings are no longer receiving infiltration due to snow and ice cover allowing oxidation products and acidity to accumulate around the sulphide grains as most of the tailings are expected to remain above freezing temperatures and continue to oxidize. Once freshet begins, these oxidation products and acidity will be neutralized and get flushed from the tailings, with pH increasing while copper concentrations decrease each spring (Figure 4-4 and Figure 4-5). This process is also expected after prolonged periods of dry weather followed by precipitation, which could occur in the fall. This may present a bi-modal copper concentration in the Polley Flats waters of higher concentrations at the very beginning of freshet and early fall, with a repeating pattern year over year.
As sulphide weathering continues, oxidation products (e.g. iron hydroxides) will also build-up around the sulphide grains, which may limit oxygen diffusion and therefore sulphide reaction rates and result in lower rates of copper leaching. Over time, as the tailings age and weather, tailings contact waters are predicted to exhibit a slightly downward trending, oscillating curve. Seasonal precipitation and temperature variations year over year would also be expected to result in concentrations varying in magnitude, but overall the trend is expected to be downward as conceptually depicted in Figure 5-2. The role of DOC and mineral solubility controls on copper concentrations are discussed in the following sections.

SRK Consulting and Minnow Environmental Page 14
CBK/SJD MPM_PolleyFlats_CuGCM_1CI008.003_20161223_CBK December 2016
Figure 5-2: Conceptual copper concentration curve from Polley Flats tailings contact waters.
5.3 Mineral Solubility Control of Copper Concentrations
As acidic conditions are not predicted to develop in the spilled tailings, copper leaching at the MPM is considered only under neutral to basic pH.
In many mine settings, secondary minerals like malachite (Cu2CO3(OH)2), tenorite (CuO), and copper hydroxides (Cu(OH)2) control the solubility of copper, and hence the copper concentration in water, through reactions that either dissolve or precipitate these minerals, depends primarily on pH. What this means is that if these minerals are present, the concentration of copper (the ionic or non-complexed form) in water cannot exceed their solubility. If the copper concentration is below the solubility limit, the mineral can dissolve. At higher copper concentrations exceeding the solubility limit the mineral may precipitate from the water.
The potential for a mineral to dissolve or precipitate is determined by its saturation index (SI), which is calculated based on the total chemistry of the water. SI is the ratio of the product of activities (approximately equivalent to concentrations) of the dissolved ions of the mineral (ion activity product, IAP) to the thermodynamically-determined solubility product (Ksp):
SI = log(IAP/Ksp)
Geochemical equilibrium models like PHREEQC (Parkhurst and Appelo 1999) are often used to calculate SIs as they can conveniently access mineral thermodynamic data. In the interpretation of mineral SIs, positive values indicate that the given mineral phase is “oversaturated” and could precipitate whereas negative values indicate that the mineral phase could dissolve
0.00
0.01
0.02
0.03
0.04
0.05
0.06
0.07
0.08
0.09
0.10
0 1 2 3 4 5
Cu
(mg/
L)
Time (years)Z:\01_SITES\Mt_Polley\1CI008.003_Privileged_and_Confidential\500_Reporting\6.PolleyFlats_GCM\[MP_tails_Cu_solubility_curves_1CI008.003_REV00_CBK.xlsx]

SRK Consulting and Minnow Environmental Page 15
CBK/SJD MPM_PolleyFlats_CuGCM_1CI008.003_20161223_CBK December 2016
(“under saturated”). SIs close to zero (“saturation”) indicate that the mineral will neither precipitate nor dissolve and that the concentration would be expected to show little fluctuation provided the concentrations of other ions do not change.
While solubility of secondary copper minerals under basic pH is low when compared to acidic conditions, even small changes in pH from 7.5 to 8.2 can impact solubility resulting in copper concentrations that can change by two to three times. To illustrate this effect, solubility curves of malachite, tenorite, and Cu(OH)2 from pH 6 to 9 are provided in Figure 5-3. The curves were created using the geochemical equilibrium model PHREEQC (version 3.0.6.7757) (Parkhurst and Appelo 1999) with the thermodynamic database MINTEQ v8 for waters containing sulphate (585 mg/L), alkalinity (212 mg/L), and major cations (Ca, Mg, Na, K at 223 mg/L, 42 mg/L, 41 mg/L, and 4 mg/L, respectively) as reported in POF-1 waters on March 15, 2016 at 10°C. The pH was adjusted by adding sulphuric acid in the model and ionically balancing the solution with calcium under conditions assumed to allow instantaneous exchange with atmospheric gases. This latter assumption primarily affects how much carbon dioxide dissolves in the water which in turn affects the SI for carbonate-containing minerals such as malachite.
A saturation index of zero was used for all three secondary copper minerals, but a saturation index of 0.5 was also used for malachite. While theoretically minerals will precipitate at zero, often activation energy barriers need to be overcome before a mineral can precipitate, which requires a higher degree of saturation. Malachite was chosen to evaluate a range as it is the most likely mineral control based on its presence in the tailings (SRK 2015a) and it was slightly oversaturated in the column test once pH stabilized (Figure 5-4). Malachite is also present in the ore at MPM, and while it could be primary (i.e. formation during alteration of the ore before it was mined), the ability of this copper mineral to form as a secondary mineral is well established at this mine site (SRK 2015a).
Shown in Figure 5-3 are copper concentrations and pH from the laboratory column test (COL-1) (containing material with the 95th percentile copper solids concentration), Polley Flats sampling results, and the HAC-13 monitoring site. There is a reasonable fit for samples from the column test, POF-1 and HAC-13, but the fit for POF-2 and POF-3 is poor compared to the predicted concentrations based on laboratory pH and mineral solubility. The results from POF-2 and POF-3 are also not consistent with the relationship shown by Day and Rees (2006) (Figure 2-1).

SRK Consulting and Minnow Environmental Page 16
CBK/SJD MPM_PolleyFlats_CuGCM_1CI008.003_20161223_CBK December 2016
Figure 5-3: Secondary copper mineral solubility curves and monitoring results.
Figure 5-4: Saturation index for malachite during humidity cell testing.
0.001
0.01
0.1
1
6 7 8 9
Dis
solv
ed C
u (m
g/L)
pH
Malachite (S.I. = 0)
Malachite (S.I. = 0.5)
Tenorite
Cu(OH)2
COL-1
HAC-13
POF-1
POF-2
POF-3
Z:\01_SITES\Mt_Polley\1CI008.003_Privileged_and_Confidential\500_Reporting\6.PolleyFlats_GCM\[MP_tails_Cu_solubility_curves_1CI008.003_REV00_CBK.xlsx]
-2.5
-2.0
-1.5
-1.0
-0.5
0.0
0.5
1.0
0.000
0.005
0.010
0.015
0.020
0.025
0.030
0.035
0.040
0.045
0.050
0 10 20 30 40 50 60
Satu
ratio
n In
dex
Cu
(mg/
L)
Cycle (Weeks)
Col-1(MagnetiteSand)
Malachite_SI
SI = 0
Z:\01_SITES\Mt_Polley\1CI008.003_Privileged_and_Confidential\410_Kinetic_Tests\Calculations+Charts\COLs\[Mt. Polley_Col_Conc Charts_1CI008-003_rtc_rev01.xlsx]

SRK Consulting and Minnow Environmental Page 17
CBK/SJD MPM_PolleyFlats_CuGCM_1CI008.003_20161223_CBK December 2016
5.4 Influence of Organics on Copper Leaching
Concentrations of copper in water samples collected from Polley Flats and Hazeltine Creek often exceeded the hardness-based BC MOE water quality guideline (Attachment A). Closer examination of the copper concentrations revealed higher concentrations than expected based on mineral phase solubility data (Figure 5-3) and that the elevated copper concentrations appear to coincide with elevated concentrations of DOC (Figure 4-5 and Figure 4-6). Somewhat elevated concentrations (i.e. greater than 0.1 mg/L) of iron were also found in the same samples (Appendix A), which is not typical of neutral pH waters where dissolved iron is typically below 0.01 mg/L. One hypothesis is that the solubility of copper (and potentially of iron) is enhanced by metal binding with DOC. Copper and iron are known to bind strongly with organic ligands in aquatic environments (Millero 1975; Tipping 2002), and copper speciation in the water column is often dominated by copper-organic complexes that are generally not bioavailable (Stumm and Morgan 1996). Because inorganic copper and the free (hydrated) ion (Cu2+) are the most toxic forms of copper, copper binding by aquatic ligands such as DOC decreases copper bioavailability and toxicity (e.g., Grosell 2012). Therefore, organic complexation of copper would have two effects: 1) to increase the apparent solubility of copper bound in mineral phases; and 2) to decrease the bioavailability and toxicity of dissolved copper (Stumm and Morgan 1996; Grosell 2012).
Copper and iron speciation, and potential copper toxicity in these water samples, were investigated. Concentrations of appropriate parameters for the water samples from Hazeltine Creek and Polley Flats were input to two models: 1) a geochemical model called Visual MINTEQ; and 2) a biotic ligand model called the HydroQual BLM. The speciation of copper and iron can be modelled using the thermodynamic equilibrium model Visual MINTEQ and provides the predicted chemical forms (including organic forms) of each metal and their concentrations. These concentrations may then be applied to the existing geochemical model being used to understand copper concentrations in these creeks on the basis of mineral phase solubility products (Section 5.3). Biotic ligand models (BLM) account for key factors that influence the bioavailability and toxicity of metals (e.g., DiToro et al. 2001; Niyogi and Wood 2004; USEPA 2007; Erickson 2013). The models treat organisms as “biotic ligands” that are in competition for metal binding (and uptake) with other ligands (such as dissolved organic matter), and account for competition between metals and major ions for both abiotic and biotic ligands. BLMs are particularly well accepted for copper due to the strong affinity of copper and aquatic ligands (e.g., Santore et al. 2001; USEPA 2007; Peters et al. 2011). Although several BLM software tools are available, the HydroQual BLM (HydroQual 2007) was selected due to its broad use and its adoption by the United States Environmental Protection Agency as the basis for ambient water quality criteria for copper in freshwater (USEPA 2007).
Included in this section are brief summaries of the capabilities of the software tools that were used, followed by the methods and input data used. Results summarize the model outputs, and provide context for interpretation, and conclusions.

SRK Consulting and Minnow Environmental Page 18
CBK/SJD MPM_PolleyFlats_CuGCM_1CI008.003_20161223_CBK December 2016
5.4.1 Models
Visual MINTEQ ver 3.1
Visual MINTEQ is a software tool that uses established thermodynamic equilibrium constants to numerically solve metal chemical speciation in a given system or water sample (Gustafsson 2014). The model assumes thermodynamic equilibrium for the final results, and requires all input parameters that will influence metal speciation, including all major cations and anions, pH, and concentrations of the metal of interest. In addition, DOC can be entered as a parameter. Briefly, the binding of a metal by DOC is modelled using the Stockholm Humic Model (SHM; Gustafsson 2001) which describes organic-metal binding and competitive interactions over a wide range of conditions. The SHM assumes metal complexation via two functional groups (phenolic acid and carboxylic acid), where each functional group has four sites, each with a slightly different acidity and affinity for the metal. The affinity for the metal is based on an acidity of the functional group which is distributed around the median acidity of the functional group.
Precipitation of solid phases was also allowed as a modelling option, and is particularly important for iron. If, after the first iteration of modelling, the remaining concentration of inorganic iron, (that which is not bound to DOC), is found to be supersaturated, then the model would recalculate the species distribution assuming that the solution is in equilibrium with respect to the solid (i.e., some of the inorganic iron would precipitate). The final concentrations of each species are solved iteratively, refining the amount of free ion with each iteration, and the component with the strongest binding affinity (in the case of copper and iron, this is DOC) for the metal taking priority in each iteration. However, allowing for precipitation may effectively remove iron from the system (the aqueous environment), which may not be representative of actual water samples, given that these high iron concentrations were measured as dissolved concentrations (e.g., if the high iron concentrations were stabilized by the presence of low abundance high affinity ligands, or if precipitation is hindered due to kinetic considerations). Therefore, as a worst case scenario, all samples were also modelled under a scenario where no precipitation was allowed. This may not necessarily reflect conditions of a thermodynamic equilibrium but it would provide an understanding of the variability in modelling results, ranging from assuming that precipitation occurs to not allowing for any iron to leave the system (i.e., by providing a lower bound [worst case] estimate of copper complexation by organic matter in the presence of higher than anticipated free iron concentrations).
Visual MINTEQ assumes thermodynamic equilibrium in order to predict a species distribution. Therefore, if the model predicts precipitation, it would mean that the sample (input dissolved concentration data) could not have been at thermodynamic equilibrium or that the modelling parameters are not representative of the water sample. If the water sample was not at thermodynamic equilibrium when collected, the lack of precipitation is likely due to kinetic constraints, and the water sample would have been supersaturated. These kinetic considerations would explain differences between in-situ water samples (with no precipitate) and their corresponding predictions (with precipitate). An alternative explanation is that the relative amounts of organic binding sites in the model are not representative of the DOC in the water sample.

SRK Consulting and Minnow Environmental Page 19
CBK/SJD MPM_PolleyFlats_CuGCM_1CI008.003_20161223_CBK December 2016
HydroQual ver 2.2.3
The HydroQual BLM software tool was developed and maintained by HydroQual1 (HydroQual 2007). It uses an acute toxicity endpoint, LA50 (i.e., the lethal accumulation of copper on the biotic ligand that results in 50% mortality during an acute exposure) and calculates the total dissolved concentration of copper that will result in 50% mortality of an exposed population (DiToro et al. 2001). Toxicity data is based on comprehensive studies of fathead minnows (Pimephales promelas), rainbow trout (Oncorhynchus mykiss), and Cladoceran species (e.g., Ceriodaphnia dubia). The model considers the free ion, Cu2+, to be the only toxic species (chemical form) of copper. As Cu2+ is the important copper species, competition by Ca2+, for example, at the biotic ligand receptor site has a strong influence on the final calculated acute toxicity threshold. HydroQual data inputs include major ions (calcium, magnesium, sodium, potassium, sulphate, and chloride), pH, and dissolved organic carbon (DOC) concentrations. The HydroQual BLM incorporates earlier equilibria models (CHESS- chemical equilibria of soils and solutions and WHAM- Windermere Humic Aqueous Model) which allow modelling of chemical and electrostatic interactions of organic molecules and use humic acids as the model organic molecules. If the humic acid (HA) component of the DOC is unknown, a 10% HA content of DOC is assumed (HydroQual 2007). This is likely a lower proportion of humic acid content than would be expected; typically, humic acids make up between 40 and 99% of the total DOC (Morel and Hering 1983). This lower proportion would result in an under-estimate of the amount of copper or iron that was complexed by DOC.
The HydroQual BLM has a US EPA Instantaneous Water Quality Criteria (EPA IWQC) calculation function for copper. The acute toxicity output for the EPA IWQC is the Final Acute Value (FAV), a concentration of copper that is an estimate of the 5th percentile of a sensitivity distribution represented by average LC50’s and EC50’s of the tested genera, (i.e., a hypothetical genus that is more sensitive than 95% of the tested genera). The criterion maximum concentration (CMC) is calculated as half the FAV, and is presented in order to provide a safety factor for effect concentrations. The criterion continuous concentration (CCC), a chronic value, is calculated from the FAV using a Final Acute-to-Chronic Ratio (FACR) of 3.22 (US EPA 2007).
5.4.2 Model Development
The Visual MINTEQ input parameters were selected from available water quality sampling results provided by BC MOE and MPMC (Attachment A) on the basis of three criteria: 1) if they contributed toward charge balance, 2) if they were deemed to directly influence copper or iron speciation, and 3) if they potentially influenced copper or iron speciation through competition for binding sites (e.g., aluminum is known to compete for organic binding sites). All input parameters provided in Attachment A were included in the model. There were two instances where input data were adjusted; this was because potassium concentrations for two samples were reported at 1,000x the concentrations of all other samples. In these two cases (POF-1 12-JUL-2016 BC MOE, and HAC-10 08-Sep-2015 BC MOE), it was assumed that a unit error had been made and the samples were run using assumed potassium concentrations at 1,000x less than the reported
1 The HydroQual BLM is now maintained by Windward Environmental, LLC.

SRK Consulting and Minnow Environmental Page 20
CBK/SJD MPM_PolleyFlats_CuGCM_1CI008.003_20161223_CBK December 2016
concentration. The temperature was input at a standard 15oC on the basis that the samples collected had a mean temperature of 13.4oC and a median temperature of 16.0oC.
HydroQual BLM input parameters were temperature, pH, DOC, alkalinity, calcium, magnesium, sodium, potassium, sulphate, chloride, and copper, with an assumed percent humic acid of 10% (conservative). An assumed negligible concentration of sulphide is also a required input. HydroQual input temperature data were the same as assumed for Visual MINTEQ and all samples were input at 15oC.
5.4.3 Model Results
Iron Speciation Distribution (Visual MINTEQ)
The iron speciation results, for all water samples, showed that at least 99.95% of iron was organically complexed (Attachment B, Appendix Tables B.3 and B.4). The remaining iron was predicted to be inorganically complexed. In all cases, iron was predicted to precipitate as an iron oxide. High concentrations of DOC had the effect of stabilizing high concentrations of iron that would otherwise have precipitated on the basis of the low solubility of iron (III) (Pullin and Cabaniss 2003). However, iron concentrations were sufficiently high that, despite the stabilizing effect of DOC, iron was still predicted to precipitate. The effect of the stabilization of high iron concentrations by DOC is well known in aquatic environments (Stumm and Morgan 1996; Tipping et al. 2002).
The discrepancy between prediction of iron precipitation in all samples, and the fact that in-situ samples did not contain solid phases (the input data were dissolved concentrations) may suggest that iron concentrations in the water were not at thermodynamic equilibrium, and kinetic constraints would be preventing iron from precipitating. Under this regime, it is possible that iron precipitation will occur in these receiving environments further downstream or later in time. An alternative explanation for the discrepancy between modelled and actual iron concentrations, is an actual higher proportion of the low abundance high affinity iron binding sites (i.e., the phenolic binding sites) in humic matter relative to that which was modelled in Visual MINTEQ which models lower concentrations of the four phenolic sites compared to the weaker carboxylic sites.
As the in-situ samples did not contain solid phases, the input data were also modelled with the constraint of not allowing precipitation. In this case, where more dissolved iron was present, a slightly lower proportion of iron was complexed to organic carbon (i.e., a minimum 98% complexation by DOC in a POF-ESS sample (Appendix Tables A.5 and A.6), compared to a minimum 99.99% complexation by DOC when precipitation was modelled (Attachment B)). These results show that precipitation of iron (and/or the presence of low abundance high affinity binding sites) does not have a large effect on the proportion of iron that is organically complexed.
Copper Speciation Distribution (Visual MINTEQ)
Speciation distribution for the water samples, showed that in all cases, 99 to 100% of the total dissolved copper at Hazeltine Creek and Polley Flats, was complexed by organic ligands when precipitation of iron was allowed (Attachment B). The remaining proportion of copper that was not organically bound was mostly inorganically complexed, with the free copper ion present at
SRK Consulting and Minnow Environmental Page 21
CBK/SJD MPM_PolleyFlats_CuGCM_1CI008.003_20161223_CBK December 2016
concentrations at least an order of magnitude lower than the inorganic copper. These results are in keeping with the understanding that the majority of copper in natural surface waters is organically complexed if sufficient organic ligands are present (Millero 1975; USEPA 2007; Grosell 2012).
When iron was not allowed to precipitate in the model, the proportion of copper that was organically complexed was lower due to greater competition from iron for organic binding sites (Attachment C, Tables C.5 and C.6). When precipitation was allowed, the range of the proportion of organically complexed copper was 99 to 100%; this range decreased to 93 to 100% when precipitation was not allowed. The minimum of 93% was for one POF-ESS sample. This is explained by the competition of iron with copper for binding sites on organic carbon - when iron is allowed to precipitate, the total dissolved iron concentration decreases, resulting in decreased competition by iron for organic binding sites. Iron competition with copper for binding sites is well known (Peters et al. 2001). Under either scenario (with precipitate or no precipitate of iron allowed by the model), a high proportion of copper (≥93%) is organically bound.
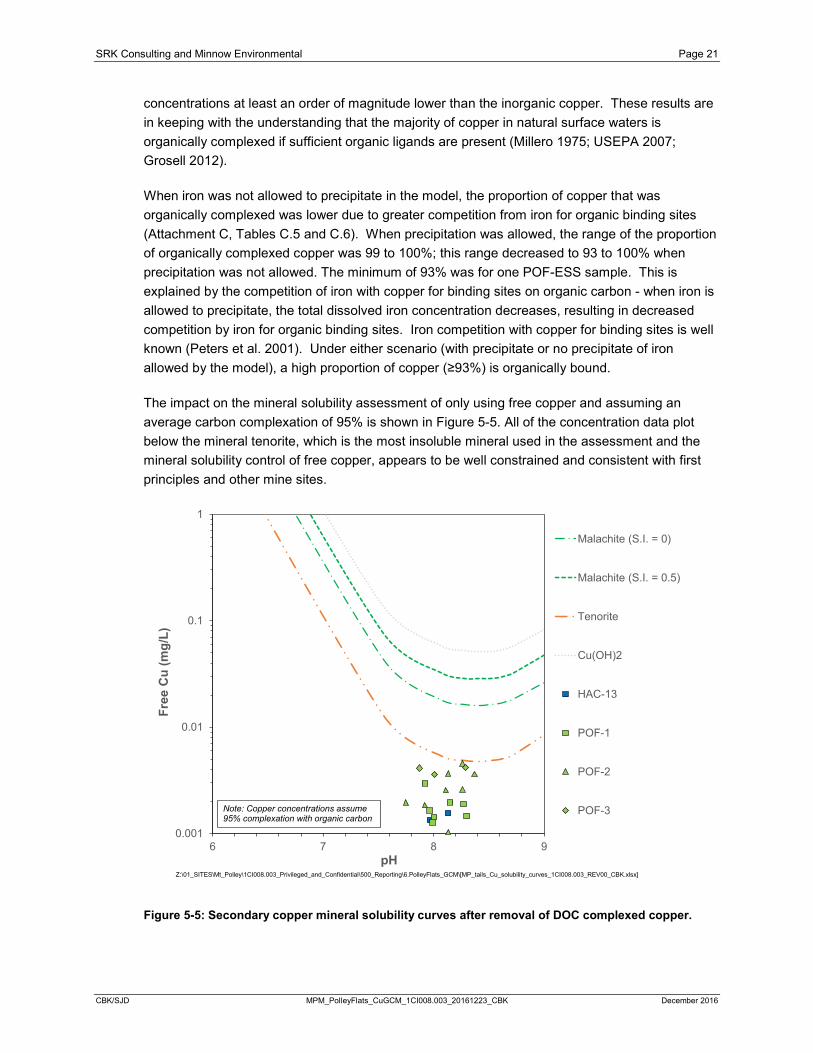
The impact on the mineral solubility assessment of only using free copper and assuming an average carbon complexation of 95% is shown in Figure 5-5. All of the concentration data plot below the mineral tenorite, which is the most insoluble mineral used in the assessment and the mineral solubility control of free copper, appears to be well constrained and consistent with first principles and other mine sites.
Figure 5-5: Secondary copper mineral solubility curves after removal of DOC complexed copper.
0.001
0.01
0.1
1
6 7 8 9
Free
Cu
(mg/
L)
pH
Malachite (S.I. = 0)
Malachite (S.I. = 0.5)
Tenorite
Cu(OH)2
HAC-13
POF-1
POF-2
POF-3
Z:\01_SITES\Mt_Polley\1CI008.003_Privileged_and_Confidential\500_Reporting\6.PolleyFlats_GCM\[MP_tails_Cu_solubility_curves_1CI008.003_REV00_CBK.xlsx]
Note: Copper concentrations assume 95% complexation with organic carbon
SRK Consulting and Minnow Environmental Page 22
CBK/SJD MPM_PolleyFlats_CuGCM_1CI008.003_20161223_CBK December 2016
Copper Biotic Ligand Model (HydroQual)
The US EPA Instantaneous Water Quality Criteria (IWQC) calculation mode was used to calculate the CCC and the Criterion Maximum Concentration (CMC) for copper. There was one sample that exceeded the (chronic) CCC, and no samples exceeded the (acute) CMC (Attachment D). The one exceedance (of the CCC only) was a sample collected from Polley Flats (POF-1 15-Mar-2016).
5.4.4 Modelling Conclusions
The Visual MINTEQ modelling showed that, in all cases, 93 to 99% of copper was organically complexed whether or not precipitation by iron oxides were modelled. Iron was modelled to be 99 to 100% organically complexed. However, when allowed by the model, some iron was predicted to precipitate, suggesting that the water samples were not at thermodynamic equilibrium, or that the proportion of low abundance high affinity organic binding sites was under-represented by the model.
As an extension to the substantial organic complexation documented using Visual MINTEQ, application of the BLM (which accounts for complexation [including organic] and competition for copper uptake by aquatic organisms) showed that, despite copper concentrations of up to 0.091 mg/L, no water samples (seep or creek) exceeded the USEPA (2007) CMC (i.e., the IWQC acute concentration). No samples of Hazeltine Creek water exceeded the USEPA (2007) CCC (i.e. the IWQC chronic concentration), while only one sample from Polley Flats seeps exceeded the CCC. The tailings contact water POF samples are not considered to be representative of receiving environment water quality.
5.5 Weathering Effects under Sub-Oxic Conditions
A number of iron-oxide precipitating seeps have been observed along the base of the tailings alongside Hazeltine Creek. Since the pH of the seep waters are near neutral, iron is expected to be precipitating due to oxidation of dissolved ferrous iron to ferric iron as shown in Section 5.4.3. Ferrous iron formation is not unexpected as it forms by dissolution of iron-bearing minerals in natural soils and the tailings when oxygen concentrations are low, which has been observed by Golder (2016) within and below the fine-grained tailings near the forest edge along Hazeltine Creek. Carbon from overlying peat and vegetation debris can also provide an organic carbon source for microorganisms that facilitate the conversion of natural ferric oxides in the tailings and natural sediments to readily-soluble ferrous forms.
The sequential extraction work previously completed (SRK 2015a) showed that copper minerals are not susceptible to the same dissolution reactions as those for iron under low oxygen conditions. These low oxygen conditions actually help limit sulphide oxidation and therefore the release of copper.
The seeps may have one potential impact to slightly depress pH. A depression in pH may be caused by an excess of carbon dioxide in the water that has accumulated from carbonate mineral dissolution and that has not had a chance to off-gas to the atmosphere. This has been confirmed by comparing field and laboratory pH as well as PHREEQC modeling on the POF-1 samples,

SRK Consulting and Minnow Environmental Page 23
CBK/SJD MPM_PolleyFlats_CuGCM_1CI008.003_20161223_CBK December 2016
which were calculated by the model to be oversaturated with respect to carbon dioxide by nearly an order of magnitude. Another possible impact on pH could be from the oxidation of ferrous iron and subsequent hydrolysis of ferric iron to form oxyhydroxides (i.e. the fluffy iron precipitates) as this process will release some acidity. While the Polley Flats ditch water had a slightly lower pH at times compared to Hazeltine Creek, it was always neutral and the acidity from iron precipitation is not likely an important process of copper leaching in the Polley Flats area. If iron hydrolysis acidity was controlling pH, then it might be expected that pH would remain below 8.0 and would not increase, unlike what is observed in the monitoring data. The flushing of the tailings during freshet (or other precipitation events) would also likely lower carbon dioxide oversaturation, which is what is observed in the alkalinity data from March to May 2016 in the POF samples.
5.6 Copper Concentration Predictions
The concentrations of copper measured at POF-1 in 2016 likely represent the upper end concentrations for free copper that can be expected at present and in the future from the Polley Flats. While this location is still impacted by DOC concentrations that are complexing copper, this site had the lowest amount of DOC compared to POF-2 and POF-3. The pH is not expected to change significantly other than potential minor fluctuations (e.g. between 7.5 and 8.3) during the beginning of freshet and following other extended dry times of the year. As a result, copper concentrations, especially free copper, will be well constrained.
The 99th and 95th percentile copper concentrations for porewater in unsaturated (i.e. drained) tailings predicted by SRK (2016) as part of other studies for the MPM were 0.05 and 0.04 mg/L, respectively. These concentrations are consistent with malachite solubility with an SI of between 0 and 0.5, upper end concentrations at POF-1 (even without considering carbon complexation), and other mine sites (e.g. Figure 2-1). During later stages of freshet or times of year when precipitation is infiltrating the tailings, porewater concentrations are expected to decrease as pH goes above 8.0. Conservatively, it should be assumed that these upper end predictions are reached each season, but long term downward trends are probable, as discussed in Section 5.1.
6 Inputs to Reclamation Planning The presence of a secondary mineral control on copper concentrations is an important finding for reclamation planning. This is because any efforts to encourage surface run-off of precipitation from the Polley Flats (i.e. grading) or evapotranspiration through soil covers and vegetation growth will likely result in a decreased loading of copper to the receiving environment. Mineral solubility control will maintain free copper concentrations at a fixed level, so despite steady upper limit copper concentrations, with less water moving through the tailings, less copper can be transported. The establishment of vegetation on the top of the tailings will also help slow down oxygen diffusion into the tailings and probably result in lower rates of sulphide oxidation and therefore primary copper leaching rates, although penetration of the tailings by roots may limit this potential benefit.
Since the time of writing this memo, SRK and Minnow Environmental understand that the high DOC containing water at POF-2 has been redirected away from the Polley Flats towards the water treatment discharge location to avoid contact with the tailings. Monitoring of this water is

SRK Consulting and Minnow Environmental Page 24
CBK/SJD MPM_PolleyFlats_CuGCM_1CI008.003_20161223_CBK December 2016
continuing under the site location name of the ‘Cedar Swamp Ditch’ (CSD). As a result, POF-3 has stopped flowing and less copper will likely be complexed with carbon from this location. Continued monitoring will help confirm this understanding and where possible, diversion of high DOC water away from direct interaction with the tailings will likely result in lower copper complexation with carbon.
7 Closing The copper concentrations observed in the Polley Flats area in ditches and pooled water can be explained from geochemical first principles considering processes that release copper to solution then constrain the resulting copper concentrations by the solubility of copper oxides, as described in the GCM. Copper concentrations that were not constrained by mineral solubility were shown to be predominantly complexed with DOC. The resulting free copper concentrations are low and typical for waters in contact with non-acidic carbonate-containing materials with copper concentrations expected to be stable in the long term.
Application of water quality criteria that account for organic complexation indicate no exceedances of chronic guidelines for copper in any of the Hazeltine Creek samples. This is encouraging because copper concentrations in Hazeltine Creek are expected to decrease over time due to the aging processes discussed in this memo and MPM’s ongoing rehabilitation of Hazeltine Creek and its watershed.
Field monitoring should continue to help validate or, if necessary, revise the existing model. The GCM presented herein may also be considered for inclusion in a broader model for the spilled tailings incorporating hydrogeology and geochemistry processes to assess future water quality in Hazeltine Creek.
SRK Consulting and Minnow Environmental Page 25
CBK/SJD MPM_PolleyFlats_CuGCM_1CI008.003_20161223_CBK December 2016
Original Signed By Chris Kennedy, PGeo Principal Consultant (Geochemistry) SRK Consulting (Canada) Inc. Original Signed By Cheryl Wiramanaden, Ph.D. Senior Aquatic Chemist Minnow Environmental Inc. Review by: Original Signed By Stephen Day, PGeo Corporate Consultant (Geochemistry) SRK Consulting (Canada) Inc Original Signed By Pierre Stecko, M.Sc., RPBio Senior Aquatic Scientist Minnow Environmental Inc. Disclaimer—SRK Consulting (Canada) Inc. has prepared this document for Mount Polley Mining Corp.. Any use or decisions by which a third party makes of this document are the responsibility of such third parties. In no circumstance does SRK accept any consequential liability arising from commercial decisions or actions resulting from the use of this report by a third party.
The opinions expressed in this report have been based on the information available to SRK at the time of preparation. SRK has exercised all due care in reviewing information supplied by others for use on this project. Whilst SRK has compared key supplied data with expected values, the accuracy of the results and conclusions from the review are entirely reliant on the accuracy and completeness of the supplied data. SRK does not accept responsibility for any errors or omissions in the supplied information, except to the extent that SRK was hired to verify the data.
SRK Consulting and Minnow Environmental Page 26
CBK/SJD MPM_PolleyFlats_CuGCM_1CI008.003_20161223_CBK December 2016
8 References Clymo, R.S., Kramer, J.R., Hammerton, D. 1984. Sphagnum-Dominated Peat Bog: A Naturally
Acid Ecosystem. Philosophical Transactions of the Royal Society of London. Series B, Biological Sciences Vol. 305, No. 1124, Ecological Effects of Deposited Sulphur and Nitrogen Compounds (May 1, 1984), pp. 487-499.
Day, S. and Rees, B. 2006. Geochemical controls on waste-rock dump seepage chemistry at several porphyry mines in the Canadian cordilleran. International Conference on Acid Rock Drainage (ICARD 2006).
DiToro, D.M., H. Allen, H. Bergman, J. Meyer, P. Paquin and R. Santore. 2001. A Biotic Ligand Model of the Acute Toxicity of Metals: I. Technical Basis. Environmental Toxicology and Chemistry. 20(10):2383-2396.
Erickson, R.J. 2013. The Biotic Ligand Model Approach for Addressing Effects of Exposure Water Chemistry on Aquatic Toxicity of Metals: Genesis and Challenges. Environ. Toxicol. Chem. 32(6): 1212-1214.
Golder 2016. Mount Polley Mine Tailings Storage Facility, Perimeter Embankment Breach. Update Report: Post-Event Environmental Impact Report. Report prepared by Golder Associates Ltd for Mount Polley Mining Corp, June 2016.
Grosell, M. 2012. Copper. In: Homeostasis and Toxicology of Essential Metals. C.M. Wood, A.P. Farrell and C.J. Baruners Eds. pp. 53-133.
Gustafsson, JP. 2001. Modeling the acid-base properties and metal complexation of humic substances with the Stockholm Humic Model. Journal of Colloid and Interface Science. 244: 102-112.
Gustafsson, JP. 2014. Visual MINTEQ 3.1 user guide. August 2014. pp 73. (vminteq.lwr.kth.se).
HydroQual, Inc. 2007. Biotic ligand model Windows interface, version 2.2.3. User’s Guide and Reference Manual. June 2007. Mahwah, NJ, USA.
Millero, FJ. 1975. The physical chemistry of estuaries. Chapter 2 in: Marine Chemistry in the Coastal Environment. ACS Symposium Series, Vol. 18. American Chemical Society, June 1975. pp 25-55.
Morel, FMM., Hering, JG. 1983. Principles and Applications of Aquatic Chemistry. Wiley New York. NY. USA. pp 588.
Niyogi, S. and C.M. Wood. 2004. Biotic Ligand Model: A Flexible Tool for Developing Site-Specific Water Quality Guidelines for Metals. Environ. Sci. Technol. 38(23): 6177-6192.

SRK Consulting and Minnow Environmental Page 27
CBK/SJD MPM_PolleyFlats_CuGCM_1CI008.003_20161223_CBK December 2016
Parkhurst, David L., and C.A.J. Appelo. 1999. User’s Guide to Phreeqc (Version 2) - A Computer Program for Speciation, Batch-Reaction, One-Dimensional Transport, and Inverse Geochemical Calculations, Water-Resources Investigations Report 99-4259.
Peters, A., G. Merrington, K. De Schamphelaere and K. Delbeke. 2011. Regulatory Consideration of Bioavailability for Metals: Simplification of Input Parameters for the Chronic Copper Biotic Ligand Model. Integr. Environ. Assess. Manage. 7(3): 437-444.
Peters, AJ, Hamilton-Taylor, J, Tipping, E. 2001. Americium binding to humic acid. Environ. Sci. Technol. 35: 3495-3500.
Price, W. 1997. Draft Guidelines and Recommended Methods for the Prediction of Metal Leaching and Acid Rock Drainage at Minesites in British Columbia. Reclamation Section, British Columbia Ministry of Energy and Mines. April 1997.
Pullin, MJ, Cabaniss, SE. 2003. The effects of pH, ionic strength, and iron-fulvic acid interactions on the kinetics of non-photochemical iron transformations. I. Iron (II) oxidation and iron (III) colloid formation. Geochim. Cosmochim. Acta. 21: 4067-4077.
Santore, R.C., D.M. Di Toro, P.R. Paquin, H.E. Allen and J.S. Meyer. 2001. Biotic Ligand Model of the Acute Toxicity of Metals. 2. Application to Acute Copper Toxicity in Freshwater Fish and Daphnia. Environ. Toxicol. Chem. 20(10): 2397-2402.
SRK 2015a. Mount Polley Mine Tailings Dam Failure: Geochemical Characterization of Spilled Tailings. Provided in Mount Polley Mining Corporation Post Event Environmental Impact Assessment Report. Prepared by Golder Associates for Mount Polley Mining Corporation. July 2015
SRK 2015b. Mount Polley Mine Tailings Dam Failure: Update on Geochemical Characterization of Spilled Tailings. Report prepared for Mount Polley Mining Corporation by SRK Consulting (Canada) Inc. November 2015.
SRK 2016. Derivation of Geochemical Source Terms, Mount Polley Mine – DRAFT. Report prepared for Mount Polley Mining Corporation by SRK Consulting (Canada) Inc. May 2016.
Stumm, W., Morgan, JJ. 1996. Aquatic Chemistry, Third Edition. John Wiley and Sons Inc. New York. NY, USA. pp 1022.
Tipping, E. 2002. Cation Binding by Humic Substances. Cambridge Environmental Chemistry Series 12. Cambridge University Press. 434 pp.
Tipping, E., Rey-Castro, C., Bryan, SE., Hamilton-Taylor, J. 2002. Al(III) and Fe(III) binding by humic substance in freshwaters and implications for trace metal speciation. Geochim. Cosmochim. Acta. 66: 3211-3324.
United States Environmental Protection Agency (US EPA). 2007. Aquatic ambient freshwater quality criteria – copper. February 2007.

Attachment A – Polley Flats and Hazeltine Creek Water Quality Monitoring Data

Attachment A - Polley Flats and Hazeltine Creek Water Quality Monitoring Data 1 of 4
Table A.1: Water quality parameters of water samples collected from Hazeltine Creek (HAC) from September 2015 to October 2016.
Site HAC-12Date 8-Sep-15 2-Nov-15 9-Nov-15 3-Dec-15 24-Feb-16 15-Mar-16 12-May-16 2-Aug-16 6-Sep-16 3-Oct-16 18-Oct-16
Source BCMOE BCMOE BCMOE BCMOE BCMOE BCMOE BCMOE MPMC MPMC MPMC MPMCUnits
Alkalinity (as CaCO3) mg/L 104 115 99.3 104 95.4 90.5 97.3 93.9 97.2 98.3 86.2pH (pH) pH 8.40 7.90 8.29 8.44 8.33 8.42 8.00 8.56 8.33 8.19a 7.96Dissolved Organic Carbon mg/L 6.31 6.90 6.10 6.08 6.66 8.23 6.31 6.08 5.96 5.53 6.01Sulphate mg/L 48.8 51.8 48.2 47.9 47.8 44.4 45.7 45.3 46.6 45.9 355Nitrate (as N) mg/L 0.009 0.642 0.084 0.083 0.189 0.195 0.0015 0.0025 0.0025 0.0025 5.14Chloride (Cl) mg/L 1.38 1.55 1.34 1.40 1.36 1.27 1.29 1.23 1.28 1.24 7.8Fluoride (F) mg/L - - - - - - - 0.089 0.090 0.084 0.420Aluminum (Al) mg/L 0.00375 0.00986 0.00136 0.00139 0.00691 0.02540 0.00447 0.0072 0.0044 0.0015 0.0312Antimony (Sb) mg/L 0.00013 0.00014 0.00010 0.00009 0.00011 0.00011 0.00011 0.00011 0.00010 0.00010 0.00105Arsenic (As) mg/L 0.00125 0.00094 0.00087 0.00147 0.00090 0.00093 0.00080 0.00103 0.00088 0.00083 0.00090Barium (Ba) mg/L 0.0138 0.0290 0.0116 0.0154 0.0115 0.0108 0.0112 0.0138 0.0123 0.0112 0.0525Boron (B) mg/L 0.0396 0.0390 0.0368 0.0608 0.0357 0.0292 0.0279 0.0250 0.0260 0.0240 0.0860Calcium (Ca) mg/L 47.1 39.4 34.3 35.3 36.3 41.0 44.8 42.0 38.9 38.1 106Copper (Cu) mg/L 0.00401 0.01010 0.00259 0.00380 0.00319 0.00435 0.00345 0.00372 0.00309 0.00302 0.00744Iron (Fe) mg/L 0.0206 0.0034 0.0054 0.0089 0.0201 0.0382 0.0078 0.015 0.015 0.015 0.037Lithium (Li) mg/L 0.00089 0.00084 0.00067 0.00114 0.00076 0.00091 0.00081 0.0005 0.0005 0.0005 0.0083Magnesium (Mg) mg/L 6.16 7.64 5.75 4.95 5.84 5.86 5.69 5.82 5.78 5.23 21.10Manganese (Mn) mg/L 0.0313 0.0002 0.0072 0.0361 0.0079 0.0085 0.0253 0.0192 0.0128 0.0082 0.0610Molybdenum (Mo) mg/L 0.0104 0.0144 0.0139 0.0170 0.0096 0.0090 0.0089 0.0092 0.0092 0.0088 0.0955Nickel (Ni) mg/L 0.00019 0.00027 0.00017 0.00013 0.00019 0.00031 0.00019 0.00025 0.00025 0.00025 0.00055Phosphorus (P) mg/L 0.0062 0.0090 0.0149 0.0198 0.0302 0.0239 0.0045 0.0045 0.0052 0.0057 0.0048Potassium (K) mg/L 1.43b 1.58 1.41 1.62 1.31 1.28 1.35 1.45 1.32 1.25 10.2Selenium (Se) mg/L 0.00093 0.00144 0.00078 0.00060 0.00083 0.00075 0.00062 0.00063 0.000709 0.000739 0.0192Sodium (Na) mg/L 10.0 11.3 10.1 11.2 9.5 9.1 9.2 9.9 9.4 8.7 38.1Strontium (Sr) mg/L 0.336 0.285 0.285 0.262 0.270 0.297 0.305 0.304 0.302 0.295 1.560Zinc (Zn) mg/L 0.00086 0.00025 0.00078 0.00455 0.00116 0.00176 0.00220 0.00330 0.0015 0.0015 0.0015
Value was reported at the method detection limit (MDL), input to model is half the MDL.a Laboratory measured pH, in situ pH not available.b Original value of 1,430 mg/L likely a unit error. Input to model was 1.43 mg/L.
Analyte
HAC-10N
on-M
etal
sD
isso
lved
Met
als
\\van-svr0\projects\01_SITES\Mt_Polley\1CI008.003_Privileged_and_Confidential\500_Reporting\6.PolleyFlats_GCM\memo\Attachments\AttA_Tables A1 and A2 Input Parameters December 2016

Attachment A - Polley Flats and Hazeltine Creek Water Quality Monitoring Data 2 of 4
Table A.1: Water quality parameters of water samples collected from Hazeltine Creek (HAC) from September 2015 to October 2016.
SiteDate 3-Dec-15 24-Feb-16 15-Mar-16 25-Jul-16 2-Aug-16 10-Aug-16 17-Aug-16 23-Aug-16 30-Aug-16 6-Sep-16 13-Sep-16 19-Sep-16 27-Sep-16 2-Oct-16 3-Oct-16 18-Oct-16
Source BCMOE BCMOE BCMOE MPMC MPMC MPMC MPMC MPMC MPMC MPMC MPMC MPMC MPMC MPMC MPMC MPMCUnits
Alkalinity (as CaCO3) mg/L 143 105 105 106 119 119 177 122 108 106 126 148 118 106 108 119pH (pH) pH 8.27 8.60 8.59 8.15 8.24 8.32 7.97 8.12 8.18 8.41 8.22a 8.13a 8.23a 8.12a 8.11a 8.12Dissolved Organic Carbon mg/L 6.88 7.10 8.84 8.13 6.99 6.63 13.1 6.26 5.61 5.59 6.14 11.3 6.49 5.56 5.51 7.77Sulphate mg/L 106 63.1 75.4 55.6 78.7 75.7 75.5 60.1 54.5 59.1 96.2 225 74.9 55.1 58.8 83.8Nitrate (as N) mg/L 0.225 0.169 0.181 0.012 0.059 0.113 0.006 0.134 0.042 0.043 1.220 1.220 0.100 0.011 0.025 0.053Chloride (Cl) mg/L 2.59 1.59 1.71 1.39 1.83 1.72 2.44 1.47 1.39 1.47 2.18 3.90 1.59 1.36 1.42 1.78Fluoride (F) mg/L - - - 0.100 0.137 0.132 0.165 0.131 0.106 0.105 0.149 0.180 0.103 0.092 0.096 0.114Aluminum (Al) mg/L 0.0014 0.0079 0.0282 0.0074 0.0078 0.0149 0.0311 0.0219 0.0259 0.0195 0.0184 0.0125 0.0133 0.0072 0.0064 0.0139Antimony (Sb) mg/L 0.00011 0.00013 0.00013 0.00013 0.00021 0.00030 0.00026 0.00029 0.00019 0.00017 0.00033 0.00042 0.00019 0.00014 0.00015 0.00016Arsenic (As) mg/L 0.00050 0.00086 0.00086 0.00091 0.00095 0.0010 0.00202 0.0010 0.00087 0.00080 0.00089 0.00086 0.00071 0.00077 0.00069 0.00073Barium (Ba) mg/L 0.0283 0.0151 0.0163 0.0172 0.0271 0.0330 0.0503 0.0401 0.0335 0.0324 0.0434 0.0633 0.0316 0.0191 0.0229 0.0240Boron (B) mg/L 0.073 0.037 0.032 0.029 0.032 0.030 0.034 0.029 0.026 0.025 0.034 0.042 0.031 0.027 0.027 0.028Calcium (Ca) mg/L 54.5 40.3 54.0 47.5 58.3 54.4 79.5 44.4 42.6 43.2 58.1 97.5 56.0 47.9 46.1 53.8Copper (Cu) mg/L 0.0106 0.0077 0.0138 0.0079 0.0132 0.0133 0.0268 0.0164 0.0130 0.0097 0.0117 0.0311 0.0147 0.0089 0.0104 0.0162Iron (Fe) mg/L 0.015 0.060 0.118 0.015 0.015 0.015 0.108 0.015 0.015 0.015 0.015 0.015 0.015 0.015 0.015 0.0320Lithium (Li) mg/L 0.0016 0.0010 0.0013 0.0012 0.0013 0.0011 0.0016 0.001 0.0005 0.0010 0.0005 0.0025 0.0013 0.0005 0.0005 0.0005Magnesium (Mg) mg/L 10.20 7.29 7.96 6.63 9.02 8.17 12.1 7.50 6.67 6.88 9.08 15.30 8.55 6.60 6.57 8.63Manganese (Mn) mg/L 0.0991 0.0755 0.1260 0.0405 0.0228 0.0259 0.2150 0.0001 0.00014 0.00019 0.0381 0.1980 0.0190 0.0204 0.0044 0.1040Molybdenum (Mo) mg/L 0.0214 0.0124 0.0157 0.0126 0.0167 0.0176 0.0228 0.0152 0.0130 0.0130 0.0231 0.0552 0.0168 0.0118 0.0119 0.0156Nickel (Ni) mg/L 0.00030 0.00032 0.00046 0.00025 0.00025 0.00025 0.00078 0.0005 0.00025 0.00025 0.00025 0.00062 0.00025 0.00025 0.00025 0.00025Phosphorus (P) mg/L 0.0058 0.0252 0.0163 0.0059 0.0033 0.0052 0.0281 0.0070 0.0068 0.0045 0.0049 0.0062 0.0074 0.0051 0.0044 0.0067Potassium (K) mg/L 1.85 1.43 1.54 1.49 2.02 1.77 5.28 1.77 1.59 1.53 1.94 3.00 1.83 1.44 1.45 1.74Selenium (Se) mg/L 0.00111 0.00087 0.00092 0.00079 0.00090 0.00123 0.00104 0.00125 0.00103 0.00097 0.00182 0.00301 0.00089 0.00076 0.00086 0.00084Sodium (Na) mg/L 19.4 10.1 11.4 10.8 14 12.4 18.5 11.4 10.4 10.9 14.0 21.3 12.3 10.3 10.4 12.5Strontium (Sr) mg/L 0.467 0.335 0.419 0.382 0.454 0.431 0.665 0.355 0.336 0.349 0.449 0.922 0.466 0.386 0.372 0.452Zinc (Zn) mg/L 0.00036 0.00096 0.00145 0.0060 0.0071 0.0015 0.0015 0.0015 0.0015 0.0015 0.0015 0.0015 0.0015 0.0015 0.0015 0.0015
Value was reported at the method detection limit (MDL), input to model is half the MDL.a Laboratory measured pH, in situ pH not available.
Dis
solv
ed M
etal
s
Analyte
HAC-13N
on-M
etal
s
\\van-svr0\projects\01_SITES\Mt_Polley\1CI008.003_Privileged_and_Confidential\500_Reporting\6.PolleyFlats_GCM\memo\Attachments\AttA_Tables A1 and A2 Input Parameters December 2016
Attachment A - Polley Flats and Hazeltine Creek Water Quality Monitoring Data 3 of 4
Table A.2: Water quality parameters of water samples collected from Polley Flats (POF) from March to October, 2016.
SiteDate 15-Mar-16 20-Apr-16 12-May-16 12-Jul-16 30-Aug-16 6-Sep-16 3-Oct-16 13-Sep-16 19-Sep-16 27-Sep-16 18-Oct-16
Source BCMOE BCMOE BCMOE BCMOE MPMC MPMC MPMC MPMC MPMC MPMC MPMCUnits
Alkalinity (as CaCO3) mg/L 212 205 172 201 190 206 315 341 176 257 282pH (pH) pH units 7.92 8.27a 7.99 8.30 7.96 8.00 8.15a 8.07 8.14a 8.20a 8.23Dissolved Organic Carbon mg/L 6.89 8.63 8.25 8.59 11.60 11.40 9.95 11.50 7.30 9.40 10.90Sulphate mg/L 585 566 622 518 545 579 508 522 533 467 481Nitrate (as N) mg/L 0.728 0.066 0.036 0.039 0.0125 0.0125 0.049 0.0125 0.595 0.126 0.224Chloride (Cl) mg/L 7.9 7.4 8.1 6.8 8.4 9.0 7.4 11.4 7.3 6.9 7.4Fluoride (F) mg/L - - - - 0.45 0.45 0.34 0.48 0.32 0.29 0.31Aluminum (Al) mg/L 0.0038 0.0032 0.0030 0.0055 0.0065 0.0040 0.0046 0.0056 0.0094 0.0074 0.0053Antimony (Sb) mg/L 0.00038 0.00038 0.00053 0.00039 0.00055 0.00041 0.00027 0.00043 0.00056 0.00036 0.00029Arsenic (As) mg/L 0.00062 0.00081 0.00095 0.00122 0.00162 0.00134 0.00083 0.00126 0.00108 0.00113 0.00070Barium (Ba) mg/L 0.060 0.056 0.050 0.052 0.044 0.042 0.066 0.056 0.050 0.053 0.056Boron (B) mg/L 0.066 0.068 0.077 0.071 0.094 0.097 0.080 0.107 0.062 0.078 0.069Calcium (Ca) mg/L 223 222 228 186 188 189 246 214 182 199 206Copper (Cu) mg/L 0.0593 0.0378 0.0254 0.0292 0.0329 0.0285 0.0393 0.0436 0.0465 0.0352 0.0514Iron (Fe) mg/L 0.0072 0.0098 0.0137 0.0038 0.015 0.015 0.015 0.015 0.015 0.015 0.015Lithium (Li) mg/L 0.0059 0.0051 0.0069 0.0061 0.0075 0.0066 0.0047 0.0054 0.0063 0.0053 0.0050Magnesium (Mg) mg/L 41.7 40.5 38.5 35.1 36.5 39.3 39.2 34.3 28.8 35.3 35.9Manganese (Mn) mg/L 1.40 1.38 0.85 0.82 0.28 0.37 2.68 2.13 0.98 1.81 2.06Molybdenum (Mo) mg/L 0.0905 0.0768 0.0891 0.0636 0.1120 0.0994 0.0792 0.0899 0.1340 0.0953 0.0878Nickel (Ni) mg/L 0.00211 0.00187 0.00138 0.00134 0.00094 0.00109 0.00226 0.00234 0.00132 0.00184 0.00221Phosphorus (P) mg/L 0.0010 0.0010 0.0020 0.0010 0.0047 0.0040 0.001 0.001 0.001 0.001 0.0029Potassium (K) mg/L 3.70 4.49 5.62 6.27b 7.87 6.46 5.25 6.20 5.92 5.45 4.26Selenium (Se) mg/L 0.00363 0.00201 0.00139 0.00176 0.00245 0.00181 0.00101 0.00177 0.00365 0.00156 0.00151Sodium (Na) mg/L 40.9 45.0 49.8 44.5 54.7 54.8 50.7 63.2 42.1 52.6 48.1Strontium (Sr) mg/L 2.25 2.17 2.61 1.80 2.25 2.27 2.57 2.26 2.02 2.10 2.17Zinc (Zn) mg/L 0.00399 0.00122 0.00064 0.00079 0.0015 0.0015 0.0015 0.0015 0.0015 0.0015 0.0015
Value was reported at the method detection limit (MDL), input to model is half the MDL.a Laboratory measured pH, in situ pH not available.b Original value of 6,270 mg/L likely a unit error. Input to model was 6.27 mg/L.
POF-1
Parameter
POF-1AN
on-M
etal
sD
isso
lved
Met
als
\\van-svr0\projects\01_SITES\Mt_Polley\1CI008.003_Privileged_and_Confidential\500_Reporting\6.PolleyFlats_GCM\memo\Attachments\AttA_Tables A1 and A2 Input Parameters December 2016

Attachment A - Polley Flats and Hazeltine Creek Water Quality Monitoring Data 4 of 4
Table A.2: Water quality parameters of water samples collected from Polley Flats (POF) from March to October, 2016.
SiteDate 15-Mar-16 20-Apr-16 12-May-16 16-Jun-16 21-Sep-16 27-Sep-16 3-Oct-16 18-Oct-16 21-Sep-16 27-Sep-16 18-Oct-16 20-Apr-16 12-May-16
Source BCMOE BCMOE BCMOE BCMOE MPMC MPMC MPMC MPMC MPMC MPMC MPMC BCMOE BCMOEUnits
Alkalinity (as CaCO3) mg/L 236 120 322 304 262 277 323 259 194 201 169 106 150pH (pH) pH units 7.92 8.13a 7.75 8.11 8.13a 8.37a 8.26a 8.26 7.87a 8.29a 8.01 8.12a 7.86Dissolved Organic Carbon mg/L 30.7 8.62 32.6 36.9 31.5 30.8 31.8 27.5 37.4 40.4 30.2 8.2 12.9Sulphate mg/L 228 63.9 458 341 246 226 231 170 183 185 97.4 51.1 78.2Nitrate (as N) mg/L 0.025 0.131 0.0075 0.027 0.187 0.176 0.138 0.038 0.0125 0.0125 0.0025 0.0767 0.0015Chloride (Cl) mg/L 5.4 1.61 7.8 7.3 4.2 4.4 5.6 4.1 1.25 1.25 1.49 1.38 2.12Fluoride (F) mg/L - - - - 0.16 0.17 0.21 0.18 0.12 0.12 0.13 - -Aluminum (Al) mg/L 0.0272 0.0160 0.0077 0.0201 0.0145 0.0137 0.0100 0.0140 0.0372 0.0210 0.0595 0.0338 0.0155Antimony (Sb) mg/L 0.00019 0.00022 0.00019 0.00021 0.00032 0.00030 0.00055 0.00021 0.00021 0.00014 0.00005 0.00015 0.00020Arsenic (As) mg/L 0.00085 0.00078 0.00063 0.00096 0.00111 0.00112 0.00129 0.000780 0.00109 0.00117 0.00070 0.000772 0.000582Barium (Ba) mg/L 0.0587 0.0344 0.0720 0.0592 0.0816 0.0817 0.0827 0.0571 0.0951 0.0952 0.0590 - -Boron (B) mg/L 0.0300 0.0266 0.0458 0.0529 0.031 0.032 0.037 0.023 0.019 0.022 0.011 0.027 0.029Calcium (Ca) mg/L 133 52.2 230 150 129 140 149 121 106 125 90.9 47.2 64.6Copper (Cu) mg/L 0.0369 0.0207 0.0392 0.0512 0.0731 0.0728 0.0909 0.0517 0.0825 0.0835 0.0717 0.0327 0.0298Iron (Fe) mg/L 1.37 0.058 0.072 0.186 0.126 0.153 0.087 0.206 0.308 0.379 0.802 0.347 0.138Lithium (Li) mg/L 0.00450 0.00138 0.00412 0.00410 0.0033 0.0029 0.0034 0.00270 0.0015 0.0012 0.0011 0.00107 0.00157Magnesium (Mg) mg/L 20.0 8.2 34.8 28.2 18.4 21.7 23.5 18.3 11.3 13.8 9.8 6.5 10.4Manganese (Mn) mg/L 1.490 0.161 2.390 0.788 0.046 0.080 0.139 0.106 0.232 0.165 0.270 0.113 0.244Molybdenum (Mo) mg/L 0.0535 0.0140 0.0443 0.0413 0.0302 0.0397 0.0456 0.0313 0.0103 0.0147 0.0073 0.0102 0.0148Nickel (Ni) mg/L 0.00110 0.00044 0.00263 0.00165 0.00086 0.00122 0.00115 0.00105 0.00105 0.00132 0.00127 0.000433 0.000671Phosphorus (P) mg/L 0.0283 0.0128 0.0010 0.0785 0.0221 0.017 0.0135 0.0151 0.0356 0.0367 0.0266 0.0105 0.0054Potassium (K) mg/L 6.12 2.20 6.69 7.07 7.92 8.84 9.45 5.68 7.16 8.79 4.72 1.41 2.33Selenium (Se) mg/L 0.00124 0.00079 0.00068 0.00093 0.00124 0.00112 0.00226 0.000844 0.000516 0.000512 0.000342 0.000785 0.000799Sodium (Na) mg/L 29.4 11.9 47.8 41.2 25.7 28.6 36.5 23.6 10.9 13.2 9.0 10.4 15.2Strontium (Sr) mg/L 1.25 0.417 1.87 1.47 1.16 1.24 1.41 1.10 0.772 0.929 0.648 0.322 0.536Zinc (Zn) mg/L 0.00140 0.00025 0.00081 0.00051 0.0015 0.0015 0.0015 0.0015 0.0033 0.0015 0.0015 0.00066 0.00031
*East Side Seep Value was reported at the method detection limit (MDL), input to model is half the MDL.
a Laboratory measured pH, in situ pH not available.
Non
-Met
als
Dis
solv
ed M
etal
sPOF-ESS*
Parameter
POF-2 POF-3
\\van-svr0\projects\01_SITES\Mt_Polley\1CI008.003_Privileged_and_Confidential\500_Reporting\6.PolleyFlats_GCM\memo\Attachments\AttA_Tables A1 and A2 Input Parameters December 2016

Attachment B – Speciation Modelling Results - Precipitation Allowed

Attachment B – Speciation Modelling Results - Precipitation Allowed 1 of 2
Table B.3: Selected results of speciation modelling, with precipitation allowed, using Visual MINTEQ v.3.1 for copper and iron in water samples collected from Hazeltine Creek ( September 2015 to October 2016.
Site HAC-12Date 8-Sep-15 2-Nov-15 9-Nov-15 3-Dec-15 24-Feb-16 15-Mar-16 12-May-16 2-Aug-16 6-Sep-16 3-Oct-16 18-Oct-16Units
Free Ion mg/L 4.26E-09 1.88E-07 2.86E-09 6.80E-09 3.32E-09 3.11E-09 2.08E-08 3.62E-09 4.43E-09 8.55E-09 1.81E-07Inorganic (plus free mg/L 2.59E-07 5.53E-06 1.59E-07 5.22E-07 1.88E-07 1.85E-07 6.18E-07 2.84E-07 2.45E-07 3.78E-07 2.89E-06Organic mg/L 4.01E-03 1.01E-02 2.59E-03 3.80E-03 3.19E-03 4.35E-03 3.45E-03 3.72E-03 3.09E-03 3.02E-03 7.44E-03Free Ion mg/L 3.10E-21 1.08E-19 6.70E-21 2.32E-21 5.05E-21 2.67E-21 5.24E-20 9.97E-22 5.18E-21 1.35E-20 1.03E-19Inorganic (plus free mg/L 1.53E-10 4.18E-10 1.86E-10 1.44E-10 1.73E-10 1.48E-10 3.35E-10 1.22E-10 1.74E-10 2.25E-10 3.82E-10Organic mg/L 4.02E-05 3.84E-05 7.98E-05 1.71E-05 6.49E-05 5.29E-05 7.79E-05 1.50E-05 4.74E-05 5.46E-05 2.35E-05Free Ion % 0.00 0.00 0.00 0.00 0.00 0.00 0.00 0.00 0.00 0.00 0.00Inorganic (plus free % 0.01 0.05 0.01 0.01 0.01 0.00 0.02 0.01 0.01 0.01 0.04Organic % 99.99 99.95 99.99 99.99 99.99 100.00 99.98 99.99 99.99 99.99 99.96Free Ion % 0.00 0.00 0.00 0.00 0.00 0.00 0.00 0.00 0.00 0.00 0.00Inorganic (plus free % 0.00 0.00 0.00 0.00 0.00 0.00 0.00 0.00 0.00 0.00 0.00Organic % 100.00 100.00 100.00 100.00 100.00 100.00 100.00 100.00 100.00 100.00 100.00
SiteDate 3-Dec-15 24-Feb-16 15-Mar-16 25-Jul-16 2-Aug-16 10-Aug-16 17-Aug-16 23-Aug-16 30-Aug-16 6-Sep-16 13-Sep-16 19-Sep-16 27-Sep-16 2-Oct-16 3-Oct-16 18-Oct-16Units
Free Ion mg/L 5.19E-08 6.56E-09 1.76E-08 5.01E-08 1.32E-07 8.42E-08 3.26E-07 2.98E-07 1.88E-07 4.22E-08 1.14E-07 3.91E-07 1.55E-07 1.17E-07 1.66E-07 1.97E-07Inorganic (plus free mg/L 3.12E-06 6.41E-07 1.35E-06 1.98E-06 6.00E-06 4.60E-06 1.14E-05 1.29E-05 8.38E-06 2.80E-06 5.27E-06 1.22E-05 7.03E-06 4.36E-06 6.33E-06 7.64E-06Organic mg/L 1.06E-02 7.74E-03 1.38E-02 7.91E-03 1.32E-02 1.33E-02 2.68E-02 1.64E-02 1.30E-02 9.68E-03 1.17E-02 3.11E-02 1.47E-02 8.93E-03 1.04E-02 1.62E-02Free Ion mg/L 8.67E-21 7.84E-22 8.61E-22 1.84E-20 1.01E-20 5.79E-21 7.16E-20 2.36E-20 1.49E-20 2.87E-21 1.20E-20 2.68E-20 1.08E-20 2.27E-20 2.45E-20 2.39E-20Inorganic (plus free mg/L 1.95E-10 1.17E-10 1.18E-10 2.45E-10 2.05E-10 1.77E-10 3.63E-10 2.63E-10 2.31E-10 1.50E-10 2.14E-10 2.62E-10 2.10E-10 2.60E-10 2.66E-10 2.62E-10Organic mg/L 1.62E-05 1.29E-05 7.91E-06 2.58E-05 7.56E-06 7.90E-06 3.48E-05 8.51E-06 7.60E-06 6.70E-06 9.75E-06 1.17E-05 7.77E-06 1.39E-05 1.13E-05 1.37E-05Free Ion % 0.00 0.00 0.00 0.00 0.00 0.00 0.00 0.00 0.00 0.00 0.00 0.00 0.00 0.00 0.00 0.00Inorganic (plus free % 0.03 0.01 0.01 0.03 0.05 0.03 0.04 0.08 0.06 0.03 0.05 0.04 0.05 0.05 0.06 0.05Organic % 99.97 99.99 99.99 99.97 99.95 99.97 99.96 99.92 99.94 99.97 99.95 99.96 99.95 99.95 99.94 99.95Free Ion % 0.00 0.00 0.00 0.00 0.00 0.00 0.00 0.00 0.00 0.00 0.00 0.00 0.00 0.00 0.00 0.00Inorganic (plus free % 0.00 0.00 0.00 0.00 0.00 0.00 0.00 0.00 0.00 0.00 0.00 0.00 0.00 0.00 0.00 0.00Organic % 100.00 100.00 100.00 100.00 100.00 100.00 100.00 100.00 100.00 100.00 100.00 100.00 100.00 100.00 100.00 100.00
Cu
Fe
Cu
Fe
HAC-10
HAC-13
Analyte
Cu
Fe
Cu
Fe
Analyte
\\van-svr0\projects\01_SITES\Mt_Polley\1CI008.003_Privileged_and_Confidential\500_Reporting\6.PolleyFlats_GCM\memo\Attachments\AttB_Tables B3 and B4 Minteq results with ppt December 2016
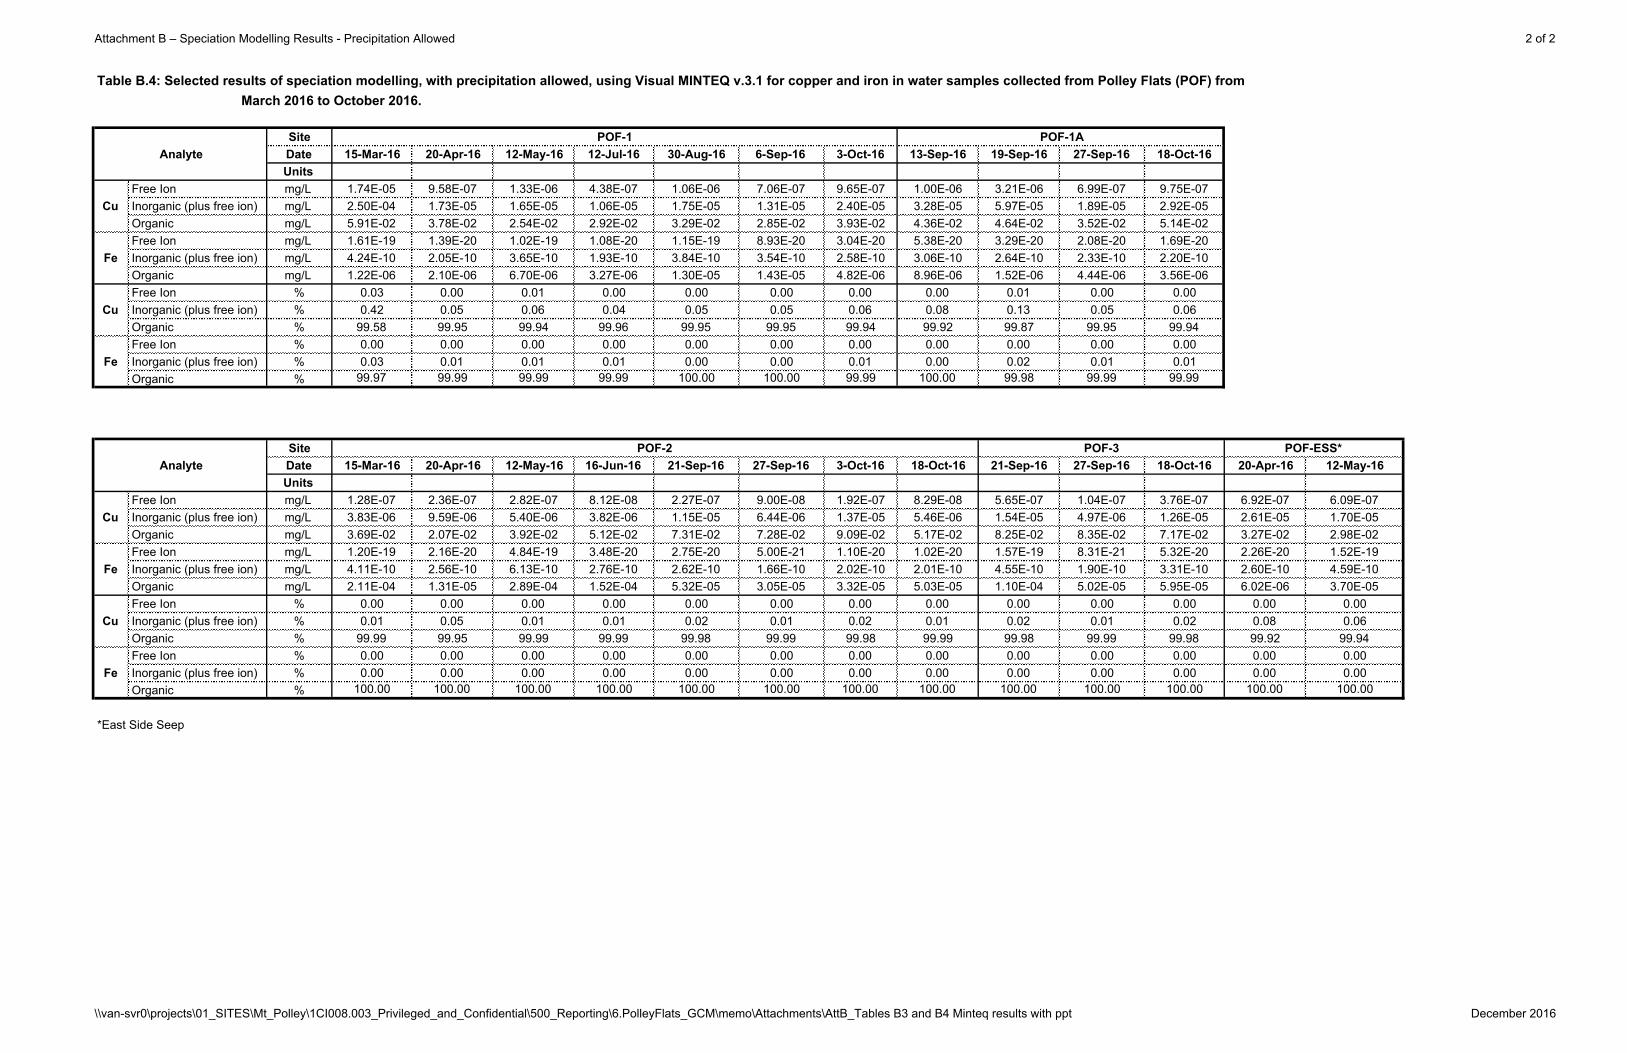
Attachment B – Speciation Modelling Results - Precipitation Allowed 2 of 2
Table B.4: Selected results of speciation modelling, with precipitation allowed, using Visual MINTEQ v.3.1 for copper and iron in water samples collected from Polley Flats (POF) from March 2016 to October 2016.
SiteDate 15-Mar-16 20-Apr-16 12-May-16 12-Jul-16 30-Aug-16 6-Sep-16 3-Oct-16 13-Sep-16 19-Sep-16 27-Sep-16 18-Oct-16Units
Free Ion mg/L 1.74E-05 9.58E-07 1.33E-06 4.38E-07 1.06E-06 7.06E-07 9.65E-07 1.00E-06 3.21E-06 6.99E-07 9.75E-07Inorganic (plus free ion) mg/L 2.50E-04 1.73E-05 1.65E-05 1.06E-05 1.75E-05 1.31E-05 2.40E-05 3.28E-05 5.97E-05 1.89E-05 2.92E-05Organic mg/L 5.91E-02 3.78E-02 2.54E-02 2.92E-02 3.29E-02 2.85E-02 3.93E-02 4.36E-02 4.64E-02 3.52E-02 5.14E-02Free Ion mg/L 1.61E-19 1.39E-20 1.02E-19 1.08E-20 1.15E-19 8.93E-20 3.04E-20 5.38E-20 3.29E-20 2.08E-20 1.69E-20Inorganic (plus free ion) mg/L 4.24E-10 2.05E-10 3.65E-10 1.93E-10 3.84E-10 3.54E-10 2.58E-10 3.06E-10 2.64E-10 2.33E-10 2.20E-10Organic mg/L 1.22E-06 2.10E-06 6.70E-06 3.27E-06 1.30E-05 1.43E-05 4.82E-06 8.96E-06 1.52E-06 4.44E-06 3.56E-06Free Ion % 0.03 0.00 0.01 0.00 0.00 0.00 0.00 0.00 0.01 0.00 0.00Inorganic (plus free ion) % 0.42 0.05 0.06 0.04 0.05 0.05 0.06 0.08 0.13 0.05 0.06Organic % 99.58 99.95 99.94 99.96 99.95 99.95 99.94 99.92 99.87 99.95 99.94Free Ion % 0.00 0.00 0.00 0.00 0.00 0.00 0.00 0.00 0.00 0.00 0.00Inorganic (plus free ion) % 0.03 0.01 0.01 0.01 0.00 0.00 0.01 0.00 0.02 0.01 0.01Organic % 99.97 99.99 99.99 99.99 100.00 100.00 99.99 100.00 99.98 99.99 99.99
SiteDate 15-Mar-16 20-Apr-16 12-May-16 16-Jun-16 21-Sep-16 27-Sep-16 3-Oct-16 18-Oct-16 21-Sep-16 27-Sep-16 18-Oct-16 20-Apr-16 12-May-16Units
Free Ion mg/L 1.28E-07 2.36E-07 2.82E-07 8.12E-08 2.27E-07 9.00E-08 1.92E-07 8.29E-08 5.65E-07 1.04E-07 3.76E-07 6.92E-07 6.09E-07Inorganic (plus free ion) mg/L 3.83E-06 9.59E-06 5.40E-06 3.82E-06 1.15E-05 6.44E-06 1.37E-05 5.46E-06 1.54E-05 4.97E-06 1.26E-05 2.61E-05 1.70E-05Organic mg/L 3.69E-02 2.07E-02 3.92E-02 5.12E-02 7.31E-02 7.28E-02 9.09E-02 5.17E-02 8.25E-02 8.35E-02 7.17E-02 3.27E-02 2.98E-02Free Ion mg/L 1.20E-19 2.16E-20 4.84E-19 3.48E-20 2.75E-20 5.00E-21 1.10E-20 1.02E-20 1.57E-19 8.31E-21 5.32E-20 2.26E-20 1.52E-19Inorganic (plus free ion) mg/L 4.11E-10 2.56E-10 6.13E-10 2.76E-10 2.62E-10 1.66E-10 2.02E-10 2.01E-10 4.55E-10 1.90E-10 3.31E-10 2.60E-10 4.59E-10Organic mg/L 2.11E-04 1.31E-05 2.89E-04 1.52E-04 5.32E-05 3.05E-05 3.32E-05 5.03E-05 1.10E-04 5.02E-05 5.95E-05 6.02E-06 3.70E-05Free Ion % 0.00 0.00 0.00 0.00 0.00 0.00 0.00 0.00 0.00 0.00 0.00 0.00 0.00Inorganic (plus free ion) % 0.01 0.05 0.01 0.01 0.02 0.01 0.02 0.01 0.02 0.01 0.02 0.08 0.06Organic % 99.99 99.95 99.99 99.99 99.98 99.99 99.98 99.99 99.98 99.99 99.98 99.92 99.94Free Ion % 0.00 0.00 0.00 0.00 0.00 0.00 0.00 0.00 0.00 0.00 0.00 0.00 0.00Inorganic (plus free ion) % 0.00 0.00 0.00 0.00 0.00 0.00 0.00 0.00 0.00 0.00 0.00 0.00 0.00Organic % 100.00 100.00 100.00 100.00 100.00 100.00 100.00 100.00 100.00 100.00 100.00 100.00 100.00
*East Side Seep
POF-ESS*
Cu
Fe
Cu
Fe
POF-1 POF-1A
POF-2 POF-3
Analyte
Cu
Fe
Cu
Fe
Analyte
\\van-svr0\projects\01_SITES\Mt_Polley\1CI008.003_Privileged_and_Confidential\500_Reporting\6.PolleyFlats_GCM\memo\Attachments\AttB_Tables B3 and B4 Minteq results with ppt December 2016

Attachment C – Speciation Modelling - No Precipitation Allowed

Attachment C - Speciation Modelling - No Precipitation Allowed 1 of 2
Site HAC-12Date 8-Sep-15 2-Nov-15 9-Nov-15 3-Dec-15 24-Feb-16 15-Mar-16 12-May-16 2-Aug-16 6-Sep-16 3-Oct-16 18-Oct-16Units
Free Ion mg/L 7.74E-08 4.90E-07 2.17E-08 3.60E-08 6.05E-08 8.32E-08 1.32E-07 3.57E-08 6.02E-08 1.01E-07 3.08E-06Inorganic (plus free ion) mg/L 6.61E-06 1.48E-05 1.41E-06 3.47E-06 4.14E-06 6.63E-06 4.27E-06 4.06E-06 4.14E-06 5.17E-06 6.59E-05Organic mg/L 4.00E-03 1.01E-02 2.59E-03 3.80E-03 3.19E-03 4.34E-03 3.45E-03 3.72E-03 3.09E-03 3.01E-03 7.37E-03Free Ion mg/L 0.00E+00 0.00E+00 0.00E+00 0.00E+00 0.00E+00 0.00E+00 0.00E+00 0.00E+00 0.00E+00 0.00E+00 0.00E+00Inorganic (plus free ion) mg/L 4.09E-06 1.29E-07 1.44E-07 7.59E-07 2.70E-06 9.09E-06 3.77E-07 3.00E-06 1.92E-06 1.87E-06 2.93E-05Organic mg/L 2.06E-02 3.40E-03 5.40E-03 8.90E-03 2.01E-02 3.82E-02 7.80E-03 1.50E-02 1.50E-02 1.50E-02 3.70E-02Free Ion % 0.00 0.00 0.00 0.00 0.00 0.00 0.00 0.00 0.00 0.00 0.04Inorganic (plus free ion) % 0.16 0.15 0.05 0.09 0.13 0.15 0.12 0.11 0.13 0.17 0.89Organic % 99.84 99.85 99.95 99.91 99.87 99.85 99.88 99.89 99.87 99.83 99.11Free Ion % 0.00 0.00 0.00 0.00 0.00 0.00 0.00 0.00 0.00 0.00 0.00Inorganic (plus free ion) % 0.02 0.00 0.00 0.01 0.01 0.02 0.00 0.02 0.01 0.01 0.08Organic % 99.98 100.00 100.00 99.99 99.99 99.98 100.00 99.98 99.99 99.99 99.92
SiteDate 3-Dec-15 24-Feb-16 15-Mar-16 25-Jul-16 2-Aug-16 10-Aug-16 17-Aug-16 23-Aug-16 30-Aug-16 6-Sep-16 13-Sep-16 19-Sep-16 27-Sep-16 2-Oct-16 3-Oct-16 18-Oct-16Units
Free Ion mg/L 2.69E-07 2.87E-07 1.30E-06 2.22E-07 4.65E-07 3.70E-07 7.85E-06 1.19E-06 8.37E-07 2.20E-07 5.48E-07 1.14E-06 6.17E-07 5.57E-07 7.02E-07 1.28E-06Inorganic (plus free ion) mg/L 2.18E-05 3.96E-05 1.69E-04 1.08E-05 2.99E-05 2.88E-05 3.76E-04 6.10E-05 4.47E-05 1.98E-05 3.52E-05 6.23E-05 3.87E-05 2.53E-05 3.18E-05 6.29E-05Organic mg/L 1.06E-02 7.70E-03 1.36E-02 7.90E-03 1.32E-02 1.33E-02 2.64E-02 1.63E-02 1.30E-02 9.66E-03 1.17E-02 3.10E-02 1.47E-02 8.90E-03 1.04E-02 1.61E-02Free Ion mg/L 0.00E+00 0.00E+00 0.00E+00 0.00E+00 0.00E+00 0.00E+00 0.00E+00 0.00E+00 0.00E+00 0.00E+00 0.00E+00 0.00E+00 0.00E+00 0.00E+00 0.00E+00 0.00E+00Inorganic (plus free ion) mg/L 1.84E-06 8.55E-05 6.00E-04 1.21E-06 2.47E-06 2.76E-06 7.51E-05 3.14E-06 3.68E-06 3.63E-06 3.07E-06 1.43E-06 2.88E-06 2.75E-06 2.88E-06 8.43E-06Organic mg/L 1.45E-02 6.00E-02 1.17E-01 1.50E-02 1.50E-02 1.50E-02 1.08E-01 1.50E-02 1.50E-02 1.50E-02 1.50E-02 1.50E-02 1.50E-02 1.50E-02 1.50E-02 3.20E-02Free Ion % 0.00 0.00 0.01 0.00 0.00 0.00 0.03 0.01 0.01 0.00 0.00 0.00 0.00 0.01 0.01 0.01Inorganic (plus free ion) % 0.21 0.51 1.22 0.14 0.23 0.22 1.40 0.37 0.34 0.20 0.30 0.20 0.26 0.28 0.31 0.39Organic % 99.79 99.49 98.78 99.86 99.77 99.78 98.60 99.63 99.66 99.80 99.70 99.80 99.74 99.72 99.69 99.61Free Ion % 0.00 0.00 0.00 0.00 0.00 0.00 0.00 0.00 0.00 0.00 0.00 0.00 0.00 0.00 0.00 0.00Inorganic (plus free ion) % 0.01 0.14 0.51 0.01 0.02 0.02 0.07 0.02 0.02 0.02 0.02 0.01 0.02 0.02 0.02 0.03Organic % 99.99 99.86 99.49 99.99 99.98 99.98 99.93 99.98 99.98 99.98 99.98 99.99 99.98 99.98 99.98 99.97
Table C.5: Selected results of speciation modelling, with no precipitation allowed, using Visual MINTEQ v.3.1 for copper and iron in water samples collected from Hazeltine Creek (HAC) from September 2015 to October 2016.
AnalyteHAC-10
HAC-13
Cu
Fe
Cu
Fe
Cu
Fe
Cu
Fe
Analyte
\\van-svr0\projects\01_SITES\Mt_Polley\1CI008.003_Privileged_and_Confidential\500_Reporting\6.PolleyFlats_GCM\memo\Attachments\AttC_Tables C5 and C6 Vminteq results no PPT Allowed December 2016

Attachment C - Speciation Modelling - No Precipitation Allowed 2 of 2
SiteDate 15-Mar-16 20-Apr-16 12-May-16 12-Jul-16 30-Aug-16 6-Sep-16 3-Oct-16 13-Sep-16 19-Sep-16 27-Sep-16 18-Oct-16Units
Free Ion mg/L 3.11E-05 2.17E-06 3.42E-06 8.36E-07 2.78E-06 1.98E-06 3.14E-06 3.36E-06 8.48E-06 2.25E-06 2.95E-06Inorganic (plus free ion) mg/L 1.22E-03 1.85E-04 1.28E-04 3.44E-05 1.12E-04 9.29E-05 3.11E-04 3.02E-04 4.79E-04 2.11E-04 3.25E-04Organic mg/L 5.81E-02 3.76E-02 2.53E-02 2.92E-02 3.28E-02 2.84E-02 3.90E-02 4.33E-02 4.60E-02 3.50E-02 5.11E-02Free Ion mg/L 0.00E+00 0.00E+00 0.00E+00 0.00E+00 0.00E+00 0.00E+00 0.00E+00 0.00E+00 0.00E+00 0.00E+00 0.00E+00Inorganic (plus free ion) mg/L 5.13E-06 2.75E-06 2.81E-06 4.85E-07 1.63E-06 1.52E-06 3.61E-06 2.36E-06 9.10E-06 3.60E-06 3.71E-06Organic mg/L 7.19E-03 9.80E-03 1.37E-02 3.80E-03 1.50E-02 1.50E-02 1.50E-02 1.50E-02 1.50E-02 1.50E-02 1.50E-02Free Ion % 0.05 0.01 0.01 0.00 0.01 0.01 0.01 0.01 0.02 0.01 0.01Inorganic (plus free ion) % 2.06 0.49 0.50 0.12 0.34 0.33 0.79 0.69 1.03 0.60 0.63Organic % 97.94 99.51 99.50 99.88 99.66 99.67 99.21 99.31 98.97 99.40 99.37Free Ion % 0.00 0.00 0.00 0.00 0.00 0.00 0.00 0.00 0.00 0.00 0.00Inorganic (plus free ion) % 0.07 0.03 0.02 0.01 0.01 0.01 0.02 0.02 0.06 0.02 0.02Organic % 99.93 99.97 99.98 99.99 99.99 99.99 99.98 99.98 99.94 99.98 99.98
SiteDate 15-Mar-16 20-Apr-16 12-May-16 16-Jun-16 21-Sep-16 27-Sep-16 3-Oct-16 18-Oct-16 21-Sep-16 27-Sep-16 18-Oct-16 20-Apr-16 12-May-16Units
Free Ion mg/L 5.01E-05 2.96E-06 2.37E-06 1.46E-06 2.00E-06 1.22E-06 1.37E-06 2.35E-06 1.31E-05 3.87E-06 3.73E-05 5.05E-05 1.83E-05Inorganic (plus free ion) mg/L 2.52E-03 1.52E-04 9.58E-05 1.05E-04 1.84E-04 2.10E-04 2.09E-04 3.00E-04 5.18E-04 4.11E-04 1.87E-03 2.30E-03 6.05E-04Organic mg/L 3.44E-02 2.05E-02 3.91E-02 5.11E-02 7.29E-02 7.26E-02 9.07E-02 5.14E-02 8.20E-02 8.31E-02 6.98E-02 3.04E-02 2.92E-02Free Ion mg/L 0.00E+00 0.00E+00 0.00E+00 0.00E+00 0.00E+00 0.00E+00 0.00E+00 0.00E+00 0.00E+00 0.00E+00 0.00E+00 0.00E+00 0.00E+00Inorganic (plus free ion) mg/L 1.06E-02 3.36E-05 2.70E-06 1.67E-05 1.17E-05 2.67E-05 7.15E-06 6.72E-05 7.84E-05 1.64E-04 2.71E-03 6.61E-03 1.62E-04Organic mg/L 1.36E+00 5.78E-02 7.22E-02 1.86E-01 1.26E-01 1.53E-01 8.70E-02 2.06E-01 3.08E-01 3.79E-01 7.99E-01 3.40E-01 1.38E-01Free Ion % 0.14 0.01 0.01 0.00 0.00 0.00 0.00 0.00 0.02 0.00 0.05 0.15 0.06Inorganic (plus free ion) % 6.84 0.73 0.24 0.20 0.25 0.29 0.23 0.58 0.63 0.49 2.61 7.03 2.03Organic % 93.16 99.27 99.76 99.80 99.75 99.71 99.77 99.42 99.37 99.51 97.39 92.97 97.97Free Ion % 0.00 0.00 0.00 0.00 0.00 0.00 0.00 0.00 0.00 0.00 0.00 0.00 0.00Inorganic (plus free ion) % 0.77 0.06 0.00 0.01 0.01 0.02 0.01 0.03 0.03 0.04 0.34 1.91 0.12Organic % 99.23 99.94 100.00 99.99 99.99 99.98 99.99 99.97 99.97 99.96 99.66 98.09 99.88
*East Side Seep
Table C.6: Selected results of speciation modelling, with no precipitation allowed, using Visual MINTEQ v.3.1 for copper and iron in water samples collected from Polley Flats (POF) from March 2016 to October 2016.
Analyte
Cu
Fe
POF-3 POF-ESS*POF-2
POF-1 POF-1A
Fe
Cu
Fe
Analyte
Cu
Fe
Cu
\\van-svr0\projects\01_SITES\Mt_Polley\1CI008.003_Privileged_and_Confidential\500_Reporting\6.PolleyFlats_GCM\memo\Attachments\AttC_Tables C5 and C6 Vminteq results no PPT Allowed December 2016

Attachment D – Biotic Ligand Model Results using HydroQual v.2.2.3 for Copper

Attachment D - Biotic Ligand Model Results using HydroQual v.2.2.3 for Copper 1 of 1
Table 5-1: Biotic ligand model results using HydroQual v.2.2.3 for copper concentrations in water samples collected from Hazeltine Creek (HAC), and Polley Flats (POF).
DOC Cu CCC1 CMC2 FAV3
mg/L mg/L mg/L mg/L mg/LHAC-10 8-Sep-15 6.31 0.004 0.040 0.064 0.128HAC-10 2-Nov-15 6.90 0.010 0.027 0.044 0.088HAC-10 9-Nov-15 6.10 0.003 0.034 0.055 0.109HAC-10 3-Dec-15 6.08 0.004 0.038 0.062 0.124HAC-10 24-Feb-16 6.66 0.003 0.039 0.062 0.124HAC-10 15-Mar-16 8.23 0.004 0.052 0.083 0.167HAC-10 12-May-16 6.31 0.003 0.027 0.044 0.089HAC-10 2-Aug-16 6.08 0.004 0.043 0.069 0.138HAC-10 6-Sep-16 5.96 0.003 0.035 0.056 0.111HAC-10 3-Oct-16 5.53 0.003 0.028 0.045 0.091HAC-12 18-Oct-16 6.01 0.007 0.030 0.048 0.097HAC-13 3-Dec-15 6.88 0.011 0.041 0.066 0.132HAC-13 24-Feb-16 7.10 0.008 0.052 0.083 0.166HAC-13 15-Mar-16 8.84 0.014 0.066 0.107 0.213HAC-13 25-Jul-16 8.13 0.008 0.042 0.067 0.134HAC-13 2-Aug-16 6.99 0.013 0.040 0.065 0.130HAC-13 10-Aug-16 6.63 0.013 0.040 0.065 0.129HAC-13 17-Aug-16 13.10 0.027 0.062 0.100 0.201HAC-13 23-Aug-16 6.26 0.016 0.031 0.050 0.099HAC-13 30-Aug-16 5.61 0.013 0.029 0.047 0.093HAC-13 6-Sep-16 5.59 0.010 0.036 0.057 0.114HAC-13 13-Sep-16 6.14 0.012 0.035 0.056 0.111HAC-13 19-Sep-16 11.30 0.031 0.063 0.102 0.204HAC-13 27-Sep-16 6.49 0.015 0.037 0.059 0.118HAC-13 2-Oct-16 5.56 0.009 0.028 0.044 0.089HAC-13 3-Oct-16 5.51 0.010 0.027 0.043 0.087HAC-13 18-Oct-16 7.77 0.016 0.039 0.063 0.127POF-1 15-Mar-16 6.89 0.059 0.038 0.061 0.122POF-1 20-Apr-16 8.63 0.038 0.066 0.106 0.212POF-1 12-May-16 8.25 0.025 0.048 0.078 0.156POF-1 12-Jul-16 8.59 0.029 0.065 0.105 0.210POF-1 30-Aug-16 11.60 0.033 0.065 0.105 0.209POF-1 6-Sep-16 11.40 0.029 0.066 0.107 0.214POF-1 3-Oct-16 9.95 0.039 0.071 0.114 0.227
POF-1A 13-Sep-16 11.50 0.044 0.074 0.119 0.239POF-1A 19-Sep-16 7.30 0.047 0.047 0.075 0.151POF-1A 27-Sep-16 9.40 0.035 0.067 0.108 0.217POF-1A 18-Oct-16 10.90 0.051 0.080 0.128 0.257POF-2 15-Mar-16 30.70 0.037 0.152 0.244 0.488POF-2 20-Apr-16 8.62 0.021 0.044 0.071 0.142POF-2 12-May-16 32.60 0.039 0.151 0.243 0.486POF-2 16-Jun-16 36.90 0.051 0.227 0.365 0.730POF-2 21-Sep-16 31.50 0.073 0.186 0.299 0.598POF-2 27-Sep-16 30.80 0.073 0.231 0.372 0.744POF-2 3-Oct-16 31.80 0.091 0.223 0.359 0.718POF-2 18-Oct-16 27.50 0.052 0.182 0.293 0.587POF-3 21-Sep-16 37.40 0.083 0.159 0.256 0.511POF-3 27-Sep-16 40.40 0.084 0.265 0.427 0.855POF-3 18-Oct-16 30.20 0.072 0.146 0.235 0.470
POF-ESS 20-Apr-16 8.23 0.033 0.041 0.066 0.131POF-ESS 12-May-16 12.90 0.030 0.053 0.085 0.170
Copper value exceeds the Hydroqual CCC value.Copper value exceeds the Hydroqual CCC and CMC values.
1 Criterion Continuous Concentration (HydroQual)2 Criteria Maximum Concentration (HydroQual)3 Final Acute Value (HydroQual)
Site Sample IDMeasured HydroQual
\\van-svr0\projects\01_SITES\Mt_Polley\1CI008.003_Privileged_and_Confidential\500_Reporting\6.PolleyFlats_GCM\memo\Attachments\AttD_BLMResults December 2016