Embed Size (px)
Citation preview

Memory landscapes of single-enzyme moleculesLars Edman and Rudolf Rigler*
Department of Medical Biophysics, Karolinska Institute, 171 77 Stockholm, Sweden
Edited by Harden M. McConnell, Stanford University, Stanford, CA, and approved April 19, 2000 (received for review January 3, 2000)
Immobilized single horseradish peroxidase enzymes were ob-served by confocal fluorescence spectroscopy during catalysis ofthe oxidation reaction of the nonfluorescent dihydrorhodamine 6Gsubstrate into the highly fluorescent product rhodamine 6G. Byextracting only the non-Markovian behavior of the spectroscopictwo-state process of enzyme-product complex formation and re-lease, memory landscapes were generated for single-enzyme mol-ecules. The memory landscapes can be used to discriminate be-tween different origins of stretched exponential kinetics that arefound in the first-order correlation analysis. Memory landscapes ofsingle-enzyme data shows oscillations that are expected in asingle-enzyme system that possesses a set of transient states.Alternative origins of the oscillations may not, however, be ruledout. The data and analysis indicate that substrate interaction withthe enzyme selects a set of conformational substates for which theenzyme is active.
Understanding the dynamics of complex biological moleculesdepends on continuously improved experiments, especially
those performed on the single molecule level. Data from dy-namic processes of individual biological molecules such asproteins or DNA are becoming assessable. Predictions (1–3)about possible origins and behavior of single molecules are nowjudged for processes like enzyme catalysis (4, 5), folding-unfolding (ref. 6 and references therein), and conformational orspectral f luctuations (7–10). Many more advances in the field ofexperimental single-molecule analysis in condensed matter en-vironments can be found in a recent review article by W. E.Morner and M. Orrit (11).
Non-ergodic properties of a process of a molecule (12, 13) aswell as non-exponential state transition probabilities for a singleprocess (5) are both indicators of a complex behavior. Enlargeddynamic models on the single molecule level are then requiredas compared with models derived from standard chemicalkinetics of an ensemble of molecules.
Catalysis of the oxidation of the dihydrorhodamine 6G intorhodamine 6G by the enzyme horseradish peroxidase on thesingle enzyme level has recently been observed at room tem-perature (5). Horseradish peroxidase is a 44-kDa heme protein(14, 15) and is an effective catalyst of the decomposition ofhydrogen peroxide (H2O2) in the presence of hydrogen donors(14, 15). The reaction is monitored by existing experimentalmethods (8) based on confocal f luorescence spectroscopy (16,17). We used the nonfluorescent substrate dihydrorhodamine6G, which after oxidation yields the highly fluorescing rhoda-mine 6G fluorophore. Hence, direct observation of successivesingle substrate turnovers into product is made possible by meansof fluorescence microscopy if a single enzyme molecule isobserved. The enzyme, the substrate, and the enzyme-substratecomplex are nonfluorescent. However, the enzyme-productcomplex (EP) (18) is f luorescent and is formed as the result ofthe substrate being oxidized while still bound to the enzyme; theenzyme-substrate complex transforms into a fluorescent EP. Foreach catalytic cycle, a new substrate is bound to the enzyme andis turned over into a product (EP), after which the productdissociates from the enzyme. Then, another substrate attaches tothe enzyme, is turned over into a product (EP), and so on. Theaverage binding time of the product (lifetime of EP) wasdetermined in ref. 5 to be approximately 50 ms. The observable
state from a spectroscopic viewpoint is the EP. All other statesof the enzyme are nonfluorescent. It is assumed that thespectroscopic properties of the EP are unaffected by the oxida-tion state of the enzyme (e.g., 41 or 51 oxidized state) becausewe directly monitor the product and not the enzyme (5). Hence,from a spectroscopic viewpoint, the observable is a reversibletwo-state process with one fluorescent state (EP) and onenonf luorescent state (representing all other states of theenzyme).
The notion of a memory in a dynamic system refers to thetemporal dependency of a future prediction on the history. TheMarkov assumption means that a process forgets its past and thatthe best possible future prediction is made only from the mostrecent information, regardless of information stemming fromearlier times. Deviations from Markovian behavior for a givenprocess can have many origins. Here, non-Markovian emissionfluctuations of a single enzyme performing catalysis are studiedwith aim to get more kinetic detail of the enzyme. In ref. 5, it wasconcluded that the emission fluctuations emerging from productformation and release on a single enzyme molecule was widelydistributed. The enzyme is fluctuating in its activity over timescales ranging from milliseconds to seconds. Other experimentson single protein dynamics report similar kinetic characteristicswith largely distributed kinetics. For example, the conforma-tional f luctuations of the GCN4 peptide (19) and of the staph-ylococcal nuclease (20) show a broad range of transition rates.Also, experiments done in the bulk on myoglobin association anddissociation to carbon monoxide (CO) show conformationalreconfigurations of myoglobin that obey a stretched exponentiallaw with b 5 0.1 at room temperature (21).
The observed distributed kinetics may have different origins(Fig. 1) that are not possible to resolve by the use of the kind ofone-time correlation analysis performed in (5). In this paper, wetherefore introduce higher order correlation analysis that givesinformation about the non-Markovian properties of the emissionfluctuations as a tool to differentiate between situations likethose in Fig. 1.
Materials and MethodsMeasurement of a Single Enzyme. For experimental detail, thereader is referred to ref. 5; however, for clarity, a brief overviewis given. The biotinylated enzyme is bound to a streptavidinizedglass coverslip surface. The substrate solution is applied as a‘‘hanging droplet.’’ To find a single-enzyme molecule, a scanningprocedure is conducted in which the open volume element fromwhere the fluorescence is detected is moved in a directionparallel to the coverslip surface until a single enzyme is detected(Fig. 2A). The signature of a single enzyme molecule is that offluctuations in the fluorescence intensity traces combined with
This paper was submitted directly (Track II) to the PNAS office.
Abbreviations: EP, enzyme-product complex; NMF, non-Markovian function; ML, memorylandscape; CS, conformational substates.
*To whom reprint requests should be addressed. E-mail: [email protected].
The publication costs of this article were defrayed in part by page charge payment. Thisarticle must therefore be hereby marked “advertisement” in accordance with 18 U.S.C.§1734 solely to indicate this fact.
Article published online before print: Proc. Natl. Acad. Sci. USA, 10.1073ypnas.130589397.Article and publication date are at www.pnas.orgycgiydoiy10.1073ypnas.130589397
8266–8271 u PNAS u July 18, 2000 u vol. 97 u no. 15

a clear signal in the autocorrelation function of the intensityf luctuations (Fig. 2 B and C). When no enzyme is present thefluorescence intensity trace show only background signal, andthe fluorescence intensity autocorrelation function is f lat (Fig. 2D and E). Another control experiment shows a blank in theabsence of H2O2, but with all other ingredients present (notshown). In ref. 5, we hence concluded: (i) The control experi-ments make it possible to conclude that the fluctuations in thepresence of enzyme must originate from the enzyme interactionwith the substrate; (ii) the finding that the average fluorescenceintensity is continuously increasing inside the sample solutionwhen enzyme is bound to the glass surface, but not otherwise(when no enzyme is present), indicates that the surface boundenzymes are active; (iii) additional control assays done in thebulk indicate that the average substrate turnover rate is 34 s21,which is roughly in line with the average of the observedsubstrate turnover rates, and product dissociation rates fromsingle enzyme molecules.
The above facts combined make us conclude that we observesingle enzymes catalyzing the substrate formation into product(5). In the present paper we take the analysis a step further,investigating the origin of the distributed kinetics. The experi-ments were carried out at substrate (dihydrorhodamine 6G)concentration of 130 nM, H2O2 concentration of 120 mM, in 100mM potassium phosphate buffer at pH 7.0.
Memory Landscapes. With aim to expand our knowledge about thekinetic detail of the enzyme, we present a data evaluationapproach based on the calculation of non-Markovian propertiesof the spectroscopic two-state process. An investigation regard-ing non-Markovian behavior has already been done by Lu et al.for the case of the cholesterol oxidase enzyme for consecutiveenzyme state transitions between its oxidized and reduced statesas a reflection of product formation (4). In the case of a singlecholesterol enzyme molecule, the enzyme itself emits f luores-cence with different magnitudes, depending on whether theenzyme is in its oxidized or reduced state. In the present paper,we monitor the catalytic cycle by direct observation of theenzyme-product complex. The observed signal is different be-tween the present case and the case of a single cholesterolenzyme molecule (4); however, they are both similar in that theyreport on the kinetics of the enzymatic cycle.
We assess the reaction dynamics by analyzing the time seriesof the recorded fluorescence from a single-enzyme molecule.Higher order statistics (22) such as higher order correlationfunctions (23) may be used to unveil the origin of non-Markovianbehavior. Single-molecule higher order statistical analysis isintroduced as a simple and useful expression sensitive to memorypatterns in the experimental data. It is based on divergence fromthe Markov assumption (24). The Markov assumption states thatoptimal prediction of the probability for a value of a process ata certain time is achieved by considering only the latest infor-mation available. This means that information from any timeearlier but the latest information time is superfluous. Define{Xt} as a stochastic process. {Xt} is binary in the sense that itsevent room W contains only two elements: W 5 {0,1}. {Xt} isstationary in the sense that its expectation value E{Xt} 5 m,where 0 , m , 1 is a constant (not time dependent). If dt isconsidered a very small time interval, the two possible events
Fig. 1. Descriptions of two possible origins of the stretched exponentialkinetics in the one-time autocorrelation of the fluorescence intensity asobserved in ref. 5. The schemes in A and B are two special cases of the Grandscheme in ref. 5. In A, there are a number of intermediate states (Ek, k 51,2,3,. . . ,n) that the enzyme may traverse before a new product is formed (EP).In B, transitions to the EP state are exponential for each substrate turnover;however, each turnover may occur via any of the n channels, each with adifferent state transition probability.
B
C
D
E
A
Fig. 2. (A) A surface scan provides a fluorescence image of single enzyme molecules. (B and C) The signature of a single enzyme performing catalysis is thatof fluctuations in the intensity trace (B) combined with a clear signal in the autocorrelation function (C). (D and E) A control experiment in which no enzymeis present (but with everything else held constant) shows only background signal in the intensity trace (D) and no autocorrelation signal (E).
Edman and Rigler PNAS u July 18, 2000 u vol. 97 u no. 15 u 8267
BIO
CHEM
ISTR
Y

‘‘Xt 5 0’’ and ‘‘Xt 5 1’’ represent the event that zero or onephoton was registered in the time interval [t,t 1dt], respectively.The Markov assumption can then formally be written
P~XtNuXtN21
; XtN22; . . . ; Xt0
!
5 P~XtNuXtN21
!, t0 , t1 , . . . , tN.
[1]
If Eq. 1 is valid, we also have the following weaker but still validstatement:
P~XtNuXtN21
; XtN22! 5 P~XtN
uXtN21!. [2]
However, if Eq. 2 is not valid for all values of tN22 , tN21 , tN,neither is Eq. 1. Hence, if Eq. 2 is not true, the Markovassumption Eq. 1 must also be violated.
The non-Markovian function (NMF) for the observed process{Xt} is given by
NMF~tN 2 tN21, tN21 2 tN22! 5 P~XtNuXtN21
; XtN22!
2 P~XtNuXtN21
!. [3]
Because {Xt} is a stationary process, NMF has only two argu-ments (instead of three in the more general case if {Xt} is notstationary) that equal the times differences between the threeobservation times.
Consider the normalized first and second order autocorrela-tion of {Xt}. Let E(.) denote the expectation value of a randomvariable. Set tN 2 tN21 5 t1 and tN22 2 tN21 5 t2. The time t2
is, hence, the time in addition to the time t1 from the referencetime tN, which we set arbitrarily to zero because the process isstationary. We get, by definition,
G~t! ;E~X0Xt!
E~X0!E~Xt!5
Oi50
1 Oi50
1
ijP~X0 5 i; Xt 5 j!
F Oi50
1
iP~X0 5 i!G 2
5
Oi50
1 Oj50
1
ijP~X0 5 iuXt 5 j!P~Xt 5 j!
F Oi50
1
iP~X0 5 j!G 2
5P~X0 5 1uXt 5 1!
P~X0 5 1![4]
and
G~t1, t2! ;E~X0Xt1
Xt11t2!
E~X0!E~Xt1!E~Xt11t2
!
5
Oi50
1 Oj50
1 Ok50
1
ijkP~X0 5 i; Xt15 j; Xt11t2
5 k!
F Oi50
1
iP~X0 5 i!G 3
5
Oi50
1 Oj50
1 Ok50
1
ijkP~X0 5 iuXt15 j; Xt11t2
5 k!P~Xt15 j; Xt11t2
5 k!
FOi50
1
iP~X0 5 i!G3
5
Oi50
1 Oj50
1 Ok50
1
ijkP~X0 5 iuXt15 j; Xt11t2
5 k!
P~Xt15 juXt11t2
5 k!P~Xt11t25 k!
F Oi50
1
iP~X0 5 i!G 3
5P~X0 5 1uXt1
5 1;Xt11t25 1!P~Xt1
5 1uXt11t25 1!
~P~X0 5 1!!2
[5]
By comparison of Eqs. 3, 4, and 5, we then obtain
NMF~t1, t2! 5 pfSG~t1, t2!
G~t2!2 G~t1!D , [6]
if we set pf 5 P(X0 5 1). Hence, the NMF can be related to thenormalized first and second order correlation functions that areused in fluorescence correlation spectroscopy (23, 25).
The assumption that the bin size is small enough so that onlyzero or one photon is registered per bin is not met in the presentexperiments. This restriction means that no two-state emissiondynamics can be monitored on faster time ranges than theinverse of the bin size (50 s21). However, for two-state dynamicsthat have larger characteristic times than the inverse of thebin-size, the NMF correctly displays deviations from Markoviandynamics.
The NMF measures a degree of divergence from the Markov-assumption, and we are therefore motivated to call the two-dimensional plot of NMF for some experimental data the‘‘memory landscape’’ (ML) of that particular process.
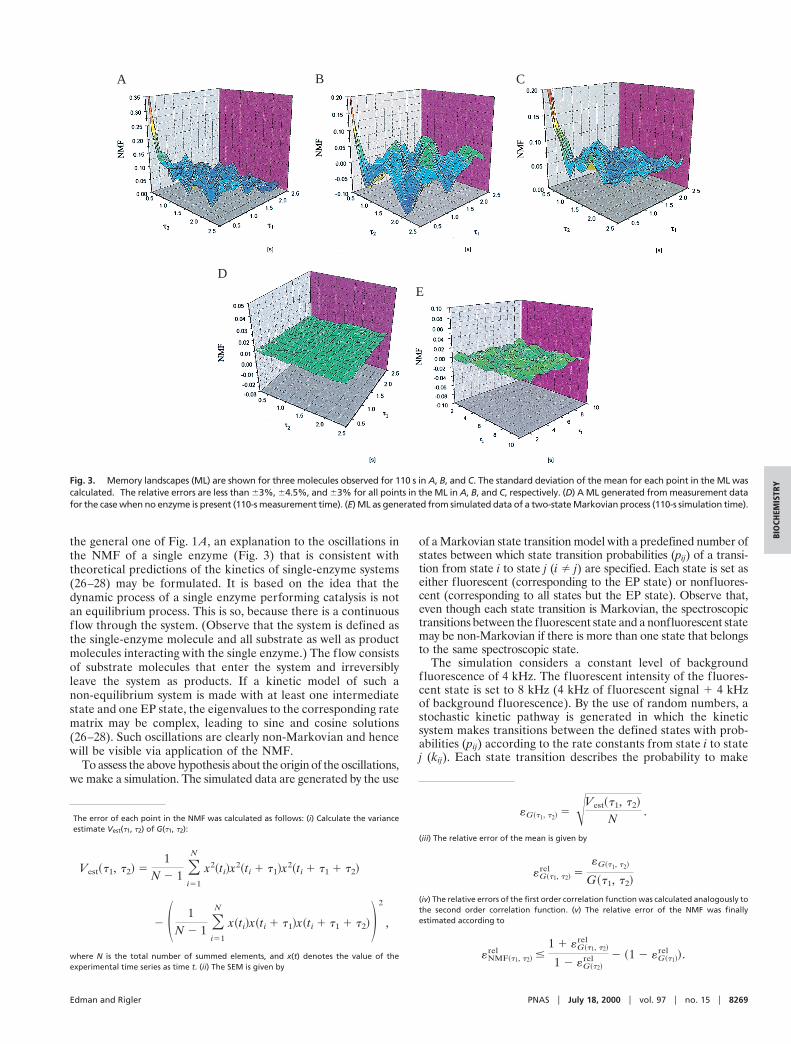
Results and DiscussionIn Fig. 3 A–C, the ML are shown for three horseradish perox-idase molecules observed for 110 s. Many molecules have beenobserved; Fig. 3 shows examples. Indeed, the ML show non-Markovian behavior on the 2.5-s time scale. Apart from a clearmemory at shorter times (,100 ms), there are structures in thememory landscape for all molecules in the range of seconds. Itis also evident that, even though the 110-s ML are not identical,they all have a characteristic pattern with elongated valleys andpeaks diagonally in the ML. A peak or a valley in which NMF Þ0 indicates that the knowledge of the spectroscopic state at theadditional historical time t2 influences the state probability attime 0.
In contrast to the ML generated from the data from the singleenzymes performing catalysis, ML from data taken in theabsence of enzyme (but everything else held constant) show aflat unstructured landscape with values close to zero (Fig. 3D).Also, data taken from a simulation of a Markovian two-stateprocess show a noisy landscape with all values close to zero (Fig.3E). These controls certify that the structures in the ML asobtained from the single enzyme data are caused by the prop-erties of the enzyme and not by artificial effects or backgroundeffects.
Among the two origins in Fig. 1, we conclude in favor of thatof Fig. 1 A for time scales larger than 20 ms (the bin size of theexperimental data’s time series). On a more detailed level than
8268 u www.pnas.org Edman and Rigler
the general one of Fig. 1 A, an explanation to the oscillations inthe NMF of a single enzyme (Fig. 3) that is consistent withtheoretical predictions of the kinetics of single-enzyme systems(26–28) may be formulated. It is based on the idea that thedynamic process of a single enzyme performing catalysis is notan equilibrium process. This is so, because there is a continuousflow through the system. (Observe that the system is defined asthe single-enzyme molecule and all substrate as well as productmolecules interacting with the single enzyme.) The flow consistsof substrate molecules that enter the system and irreversiblyleave the system as products. If a kinetic model of such anon-equilibrium system is made with at least one intermediatestate and one EP state, the eigenvalues to the corresponding ratematrix may be complex, leading to sine and cosine solutions(26–28). Such oscillations are clearly non-Markovian and hencewill be visible via application of the NMF.
To assess the above hypothesis about the origin of the oscillations,we make a simulation. The simulated data are generated by the use
of a Markovian state transition model with a predefined number ofstates between which state transition probabilities (pij) of a transi-tion from state i to state j (i Þ j) are specified. Each state is set aseither fluorescent (corresponding to the EP state) or nonfluores-cent (corresponding to all states but the EP state). Observe that,even though each state transition is Markovian, the spectroscopictransitions between the fluorescent state and a nonfluorescent statemay be non-Markovian if there is more than one state that belongsto the same spectroscopic state.
The simulation considers a constant level of backgroundfluorescence of 4 kHz. The fluorescent intensity of the fluores-cent state is set to 8 kHz (4 kHz of fluorescent signal 1 4 kHzof background fluorescence). By the use of random numbers, astochastic kinetic pathway is generated in which the kineticsystem makes transitions between the defined states with prob-abilities (pij) according to the rate constants from state i to statej (kij). Each state transition describes the probability to make
†The error of each point in the NMF was calculated as follows: (i) Calculate the varianceestimate Vest(t1, t2) of G(t1, t2):
Vest~t1, t2! 51
N 2 1 Oi51
N
x2~ti!x2~ti 1 t1!x2~ti 1 t1 1 t2!
2 S 1N 2 1 O
i51
N
x~ti!x~ti 1 t1!x~ti 1 t1 1 t2!D 2
,
where N is the total number of summed elements, and x(t) denotes the value of theexperimental time series as time t. (ii) The SEM is given by
«G~t1, t2! 5 ÎVest~t1, t2!
N.
(iii) The relative error of the mean is given by
«G~t1, t2!rel 5
«G~t1, t2!
G~t1, t2!
(iv) The relative errors of the first order correlation function was calculated analogously tothe second order correlation function. (v) The relative error of the NMF was finallyestimated according to
«NMF~t1, t2!rel #
1 1 «G~t1, t2!rel
1 2 «G~t2!rel 2 ~1 2 «G~t1!
rel !.
CBA
DE
Fig. 3. Memory landscapes (ML) are shown for three molecules observed for 110 s in A, B, and C. The standard deviation of the mean for each point in the ML wascalculated.† The relative errors are less than 63%, 64.5%, and 63% for all points in the ML in A, B, and C, respectively. (D) A ML generated from measurement datafor the case when no enzyme is present (110-s measurement time). (E) ML as generated from simulated data of a two-state Markovian process (110-s simulation time).
Edman and Rigler PNAS u July 18, 2000 u vol. 97 u no. 15 u 8269
BIO
CHEM
ISTR
Y

transitions within the time period of the bin size, b. The timeperiod consumed by an iteration of the simulation is accordinglydefined as b, then; we relate the rate constants in Scheme 1 withthe state transition probability via the expression
E0
b
kije2kijtdt 5 pij f kij 5 2ln~1 2 pij!
b. [7]
The simulation model in Scheme 1 takes into account the findingof activity fluctuations of the enzyme (5) as well as the abovediscussion of the origin to the NMF result. Scheme 1 considersactivity fluctuations (5) by defining one active state (E8) of theenzyme that correspond to those conformational substates (CS) (3)in which the enzyme can perform catalysis. We then define a set ofintermediate non-active states of the enzyme (E1, E2, E3, E4, E5, E6,E7) that interconnect in a serial fashion as demanded by thetheoretical framework of transient states in single-enzyme systems(26–28). In the model, we assume that the substrate is involved inboth the enzymatic cycle as well as a driver for the CS transitionsthrough the intermediate states.
In Fig. 4 A and B, ML are shown as observed by NMF analysisof simulated data using Scheme 1 for two different values of therate k. The ML show clear oscillations, similar to the MLobserved for single enzymes.
Obviously, there are a large number of possible schemes that maybe written and simulated by varying the number of transientstates, and also by changing the rate parameter values or byintroducing differences in the rate parameters, etc. We will notdo such a detailed investigation here; however, we point out thatfurther analysis using fluctuating rate constants (for example)may lead to a better description. Presently, we feel that priorityshould be given to the basic principles of the enzyme dynamicsbefore models that use, for example, f luctuating rate constantsare considered. Scheme 1 may not give the full kinetic picture ofthe enzyme but may provide a first approximation.
Studies of the energetic connectivity in proteins reveal unex-pected dependencies between distant parts (amino acid groups) ofthe molecule (29). It is likely that the fluctuations of many distantparts of the molecule affect its enzymatic activity; the binding siteof the molecule is not an autonomous part with regard to thecatalytic properties of the enzyme. The prediction that time cor-relation between variables specifying different sets of conforma-tions is revealing with regards to catalysis was postulated already in1974 (18). Hence, the introduction of many CS in which the presentenzyme may reside leads to a discussion about the connectionbetween different CS and the activity of the enzyme.
In refs. 30 and 31, the kinetics of peptide binding to class IIMHC proteins are investigated. It is shown that the peptidebinding makes the protein stabilized in its active state: directlyafter peptide dissociation, the protein’s conformation is suchthat it is active and may accept binding of a new peptide. Theactive form of the protein results from dissociation of previouslybound enzyme and is quickly inactivated in the absence of newpeptide. With the result of the present experiment and analysisin hand, an analogy to the results obtained in refs. 30 and 31 isstraightforward: When active, the enzyme is situated in a regionof CS in which it may continuously bind its substrates (dihydro-rhodamine 6G and H2O2) and transform them into products. Byuninterrupted catalytic cycles, the enzyme is stabilized in itsactive state. The enzyme may, however, make a transition out ofthe enzymatically active region of CS. The slow oscillations in theML would then originate from a set of transient CS that theenzyme traverses toward the active region of CS. The predictionwould be that, with increasing substrate concentration, thefraction of time the enzyme resides in its active state increases.Evaluation of single enzyme data using first-order correlationanalysis shows less distributed kinetics with increasing concen-tration (5), being in line with this prediction. Hence, substrateinteractions with the enzyme select the set of CS in which the
A B
Fig. 4. ML are shown for two cases of simulations using Scheme 1 in A and B (500,000 data points simulated equaling 11,000-s measuring time). The rate constantk is set to 10 s21 in A and 22 s21 in B. The rate constants k21 and k1 are always set to 20 and 1521, respectively. The bin size is set to 20 ms in accordance with theexperimental conditions.
8270 u www.pnas.org Edman and Rigler

enzyme is active. Although our data are based on a single typeof protein molecule, we suggest that a similar behavior may befound in other types of proteins, such as ion-channels andligand-specific receptors.
We thank Clas Blomberg, Hermann Haken, Peter Schuster, and PeterWolynes for discussions. We acknowledge grants from the SwedishNatural Science Research council (NFR) and the Swedish TechnicalScience Research Council (TFR).
1. Bryngelson, J. D. & Wolynes, P. G. (1989) J. Phys. Chem. 93, 6902–6915.2. Wang, J. & Wolynes, P. G. (1995) Phys. Rev. Lett. 74, 4317–4320.3. Frauenfelder, H., Sligar, S. G. & Wolynes, P. G. (1991) Science 254, 1598–1603.4. Lu, H. P., Xun, L. & Xie, X. S. (1998) Science 282, 1877–1882.5. Edman, L., Foldes-Papp, Z., Wennmalm, S. & Rigler, R. (1999) Chem. Phys. 247,11–22.6. Mehta, A. D., Rief, M., Spudich, J. A., Smith, D. A. & Simmons, R. M. (1999)
Science 283, 1689–1694.7. Edman, L., Mets, U. & Rigler, R. (1996) Proc. Natl. Acad. Sci. USA 93,
6710–6715.8. Wennmalm, S., Edman, L. & Rigler, R. (1997) Proc. Natl. Acad. Sci. USA 94,
10641–10646.9. Lu, H. P. & Xie, X. S. (1998) Nature (London) 385, 143–145.
10. Smith, D. E., Babcock, H. P. & Chu, S. (1999) Science 283, 1724–1727.11. Morner, W. E. & Orrit, M. (1999) Science 283, 1670–1676.12. Edman, L., Wennmalm, S., Tamsen, F. & Rigler, R. (1998) Chem. Phys. Lett.
292, 15–21.13. Wennmalm, S., Edman, L. & Rigler, R. (1999) Chem. Phys. 247, 61–67.14. Willsatter, R. & Pollinger, A. (1923) A. Liebigs Ann. 430, 269–319.15. Theorell, H. & Åkesson, A. (1943) Ark. Kemi Mineral. Geol. 16A, 1–11.16. Rigler, R. & Mets, U. (1992) SPIE Laser Spectrosc. Biomol. 1921, 239–248.17. Mets, U. & Rigler, R. (1994) J. Fluoresc. 4, 259–264.18. Careri, C. (1974) in Quantum Statistical Mechanics in the Natural Sciences, eds.
Korsunoglu, B., Mintz, S. L. & Windmayer, S. M. (Plenum, New York), pp. 15–33.
19. Jia, Y., Talaga, D. S., Lau, W. L., Lu, H. S. M., DeGrado, W. F. & Hochstrasser,R. M. (1999) Chem. Phys. 247, 69–83.
20. Ha, T., Ting, A. Y., Liang, J., Deniz, A. A., Chemla, D. S., Shultz, P. G. & Weiss,S. (1999) Chem. Phys. 247, 107–118.
21. Frauenfelder, H. (1997) in Structure and Dynamics of Glass and Glass Formers,eds. Angell, C. A., Ngai, K. L., Kieffer, J., Egami, T. & Nienhaus, G. U. (Mater.Res. Soc., Pittsburgh), pp. 343–347.
22. Zeldovich, Y. B., Ruzmaikin, A. A. & Sokoloff, D. D. (1990) The AlmightyChance (World Scientific, Singapore).
23. Qian, H. (1990) Biophys. Chem. 38, 49–57.24. Kallenberg, O. (1997) Foundations of Modern Probability (Springer, New
York).25. Elson, E., Magde, D. (1974) Biopolymers 13, 1–27.26. Ryde-Pettersson, U. (1989) Eur. J. Biochem. 186, 145–148.27. Hirsch, M. W., Smale, S. (1974) Differential Equations, Dynamics Systems, and
Linear Algebra (Academic, New York).28. Jackson, E. A. (1989) Perspectives of Nonlinear Dynamics (Cambridge Univ.
Press, Cambridge, U.K.), Vol. 1.29. Lockless, S. W. & Ranganathan, R. (1999) Science 286, 295–299.30. Rabinowitz, J. D., Vrljic, M., Kasson, P. M., Liang, M. N., Busch, R., Boniface,
J. J., Davis, M. M. & McConnel, H. M. (1998) Immunity 9, 699–709.31. Kasson, P. M., Rabinowitz, J. D., Schmitt, L., Davis, M. M. & McConnel, H. M.
(2000) Biochemistry 39, 1048–1058.
Edman and Rigler PNAS u July 18, 2000 u vol. 97 u no. 15 u 8271
BIO
CHEM
ISTR
Y