Embed Size (px)
Citation preview
1
Mental Accounting in Portfolio Choice:
Evidence from a Flypaper Effect
James J. Choi
Yale University and NBER
David Laibson
Harvard University and NBER
Brigitte C. Madrian
Harvard University and NBER
September 19, 2008
We thank Hewitt Associates for providing the data analyzed in this paper. We are particularly
grateful to Lori Lucas, Pam Hess, Yan Xu, and Greg Tabickman, some of our many current and
former contacts at Hewitt. We thank Wayne Ferson, Scott Weisbenner, and seminar audiences at
Brigham Young University, Brown, HKUST, National University of Singapore, Netspar,
Northwestern, Singapore Management University, the Texas Finance Festival, UCLA, Wharton,
and Yale for helpful comments. We appreciate the research assistance of David Borden, Ananya
Chakravarti, Chris Nosko, and Neel Rao. Choi acknowledges financial support from the Mustard
Seed Foundation. Choi, Laibson, and Madrian acknowledge individual and collective financial
support from the National Institute on Aging (grants R01-AG-021650, P30-AG012810, and T32-
AG00186).
2
Mental Accounting in Portfolio Choice:
Evidence from a Flypaper Effect
Abstract: Consistent with mental accounting, we document that investors sometimes choose the
asset allocation for one account without considering the asset allocation of their other accounts.
The setting is a firm that changed its 401(k) matching rules. Initially, 401(k) enrollees chose the
allocation of their own contributions, but the firm chose the match allocation. These enrollees
ignored the match allocation when choosing their own-contribution allocation. In the second
regime, enrollees simultaneously selected both accounts’ allocations, leading them to mentally
integrate the two. Own-contribution allocations before the rule change equal the combined own-
and match-contribution allocations afterwards, whereas combined allocations differ sharply
across regimes.
James J. Choi David Laibson
Yale School of Management Department of Economics
135 Prospect Street Harvard University
P.O. Box 208200 Littauer Center
New Haven, CT 06520-8200 Cambridge, MA 02138
[email protected] [email protected]
Brigitte C. Madrian
Kennedy School of Government
Harvard University
79 JFK Street
Cambridge, MA 02138
3
This paper documents a lack of coordination between the asset allocations of different
financial accounts in a household portfolio. Our findings are predicted by the theory of mental
accounting (Richard H. Thaler 1985, 1990, 1999): agents sometimes make decisions about
individual accounts in their portfolio without considering their other accounts.
The setting for our analysis is a large U.S. firm. When an employee at this firm makes a
401(k) contribution, the company makes a matching contribution proportional to the employee’s
contribution (up to a match threshold). In March 2003, the firm changed its 401(k) matching
rules, creating a natural experiment. Both before and after the rule change, the initial allocation
of participants’ own-contribution flows was determined by the participants.1 The change in
March 2003 was to the policy determining the initial asset allocation of the employer match
contributions.
In the first regime (before March 2003), the firm directed matching contribution flows
entirely into employer stock. This was not a binding restriction, as participants could freely
reallocate their match balances after matching contributions were made (although in practice
participants rarely did so). In March 2003, the company changed its match policy, requiring new
enrollees to actively choose the asset allocation for both their own- and match-contribution
flows.
The change between these regimes was economically neutral; any allocation of balances
in one regime could be replicated in the other. Nevertheless, allocations to employer stock
differed vastly across the two regimes. Employees who enrolled in February 2003—just before
the regime change—allocated 23% of their own-contribution flows to employer stock. Since all
of their match contributions were directed into employer stock, this resulted in a 56% total
1 We draw a distinction between the asset allocation for contribution flows and the asset allocation for balances. The
former is the mix of assets in which incremental 401(k) contributions are initially invested. The latter is the mix of
all accumulated assets currently held in the portfolio.
4
401(k) allocation to employer stock (combining the own-contribution and match-contribution
accounts). Few of these February enrollees made subsequent trades to reduce their employer
stock balances in either account. Employees who enrolled in March 2003—right after the
change—allocated 23% of their total (own- plus match-contribution) flows to employer stock.
Notice that own-contribution allocations to employer stock in the first regime precisely match
the combined allocation of own- and match-contributions in the second regime (23% in both
cases), even though combined allocations differ greatly across the regimes.
These results imply that each dollar of employer stock contributed to enrollees through
the match in the first regime increased the employees’ total holdings of employer stock by a full
dollar, rather than being offset by reduced employer stock holdings elsewhere or being sold off
directly. In other words, “money sticks where it hits” (a phrase attributed to Arthur Okun),
generating an asset allocation flypaper effect that is akin to the flypaper effects of public finance,
corporate finance, and intra-household consumption.2
After considering several explanations for the asset allocation flypaper effect, we
conclude that it is due in part to mental accounting. Our results can be explained by the following
simple model. In the first regime, new enrollees actively allocated only their own-contribution
flows, effectively ignoring the fact that their matching contributions were entirely directed into
employer stock. In the second regime, the match allocation became salient because new enrollees
were required to choose both their match and own-contribution allocations during the enrollment
process. This caused enrollees to consider their entire 401(k) portfolio instead of just their own-
contribution accounts. As a result, the fraction of total contributions allocated to employer stock
under the second regime equaled the fraction of own-contribution flows allocated to employer
2 See James R. Hines and Thaler (1995) for a review of the flypaper literature, and Esther Duflo and Christopher
Udry (2004) for evidence on the flypaper effect in intra-household consumption.
5
stock under the first regime; the average participant allocated roughly one-quarter of assets to
employer stock in whatever accounts were salient, whether the set of salient accounts was
narrow (regime one) or broad (regime two). The dependence of portfolio outcomes on account
salience is inconsistent with investors having a clear target asset allocation for their entire
portfolio which they efficiently implement through their investment choices.
In accordance with much prior research, we also find that investors are quite passive,
rarely reallocating their portfolios.3 However, our central finding concerns asset allocation
decisions made at enrollment—a point when people have overcome their passivity and are taking
action. Investor passivity thus cannot account for the unresponsiveness of own-contribution
allocations to the match allocation at enrollment under the first regime, although passivity helps
explain why these initial decisions are rarely reversed subsequently.
I. 401(k) Savings Plan Features at a Large U.S. Corporation
The company whose employees we study is a large publicly traded firm in the retail
sector. Employees must actively opt into 401(k) savings plan participation. The company offers
an employer match of 150% on the first 1% of pay contributed and 50% on the next 4% of pay
contributed. At year-end 2005, 59% of eligible employees participated in the company 401(k).
Other features of the 401(k) plan are listed in Web Appendix Table C1.
Before March 2003, all 401(k) matching contributions were directed by the firm into
employer stock, although after the match was received, participants could trade out of employer
stock and into any of the other available investment options. At the beginning of March 2003, the
company implemented the policy change studied in this paper: it ceased requiring that 401(k)
3 See, for example, William Samuelson and Richard Zeckhauser (1988), Brigitte C. Madrian and Dennis F. Shea
(2001), James J. Choi, David Laibson, Brigitte C. Madrian, and Andrew Metrick (2002, 2004a), Julie Agnew,
Pierluigi Balduzzi, and Annika Sundén (2003), John Ameriks and Stephen P. Zeldes (2004), Choi, Laibson, and
Madrian (2005a,b), and Olivia S. Mitchell, Gary R. Mottola, Steven P. Utkus, and Takeshi Yamaguchi (2006).
6
participants accept matching contributions entirely in employer stock. Going forward, new
participants were required upon enrollment to actively choose an asset allocation for their
matching contribution flows, just as they did for their own-contribution flows. Employees who
had enrolled prior to March 2003 were not required after this plan change to actively specify an
asset allocation for future matching contribution flows, although they had the option to do so. If
they did not make an active election, the company continued to direct these participants’
matching contributions entirely into employer stock. Note that this plan change was neutral. Any
allocation of balances—the allocation that determines investment returns—that was feasible in
the new regime could have been implemented under the old regime.
II. Data
Our data are a series of year-end cross-sections from 2002 to 2004 of all employees
eligible to participate in the 401(k) plan at the study company. These data contain demographic
information such as birth date, hire date, gender, and compensation. They also contain
information on each individual’s 401(k) account, including date of first participation, monthly
contribution rates, annual contributions to each investment option, and year-end balances for
each investment option. The contribution flow and balance allocation information is reported
separately for the own-contribution and the match accounts. We also make limited use of cross-
sectional data from year-end 1998.4
We impose three restrictions to obtain the participant sample used in our analysis. First,
we consider only employees who enrolled in the plan between November 1998 and December
2004; we exclude participants who enrolled before November 1998 because the plan match was
significantly changed at that time. Second, we drop 401(k) participants who are ineligible for
4 The 1998 data are only available for a random sub-sample of employees who were at the firm at year-end 1998.
7
matching contributions—those who do not yet have 12 months of tenure at the company and
1,000 hours of service.5 Finally, we purge the data of participants who are likely to have joined
the company as a result of acquisitions made by the firm because these individuals may not be
comparable to employees who joined the company organically.6 Our results are qualitatively
similar, however, even if we include participants who were potentially acquired.
III. Empirical Results
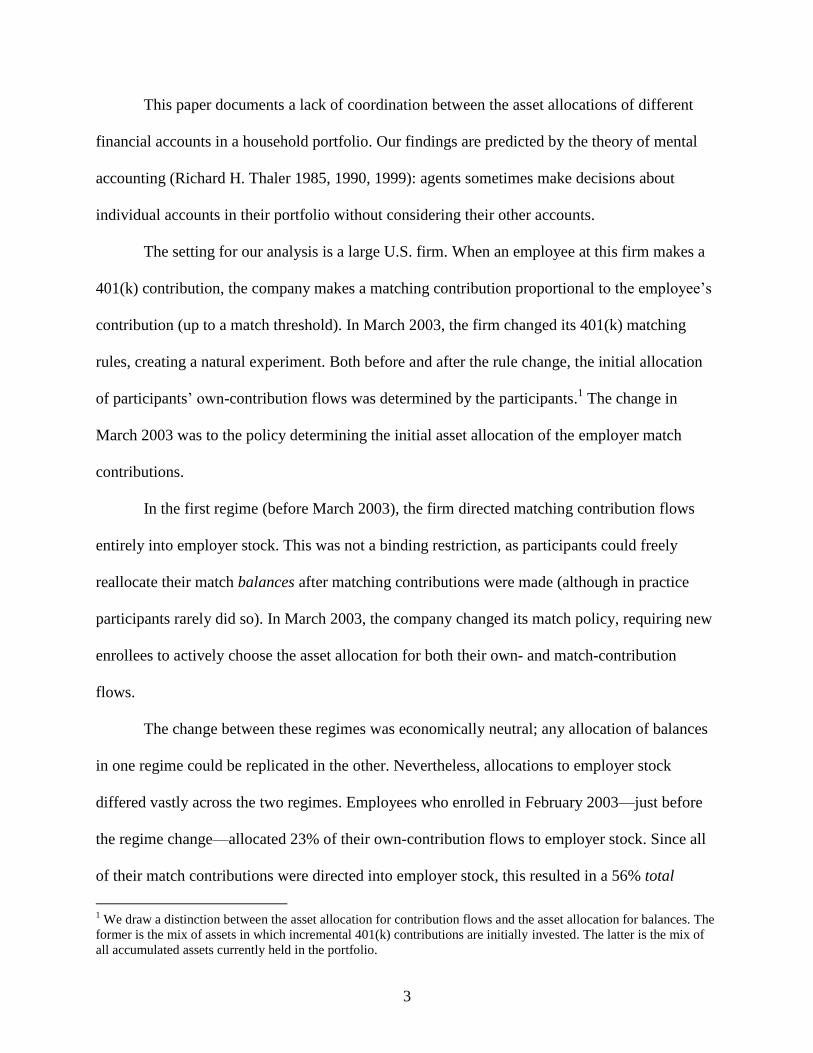
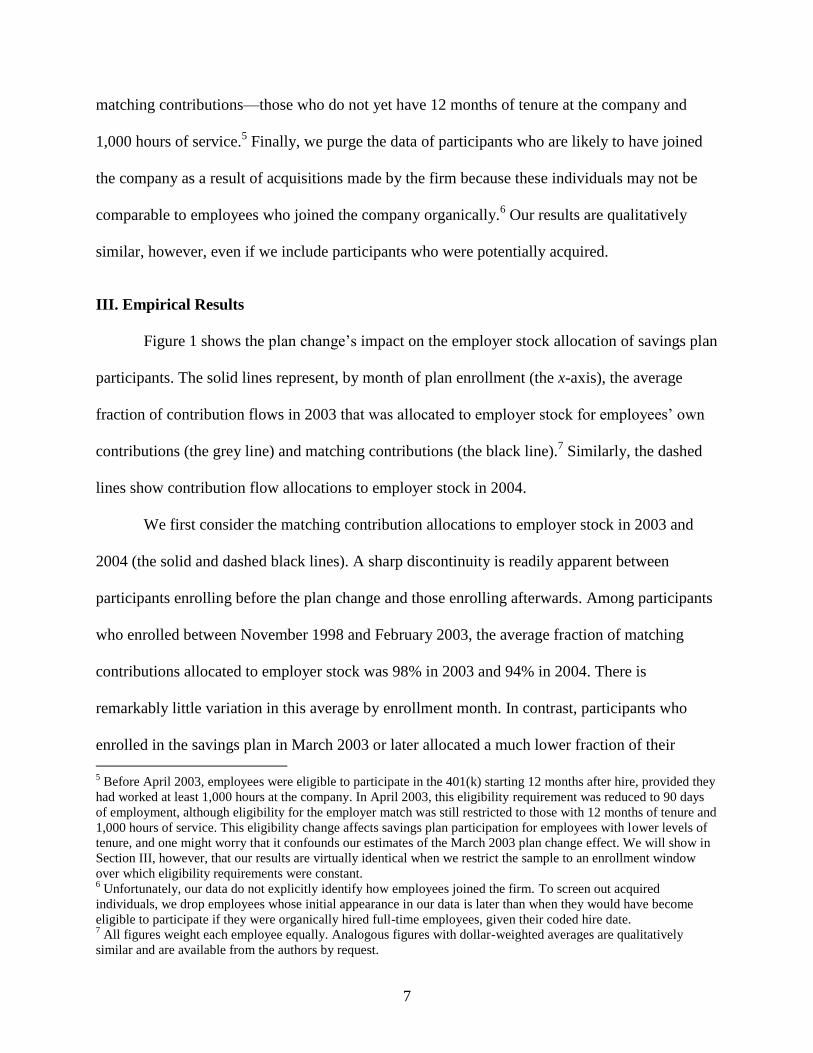
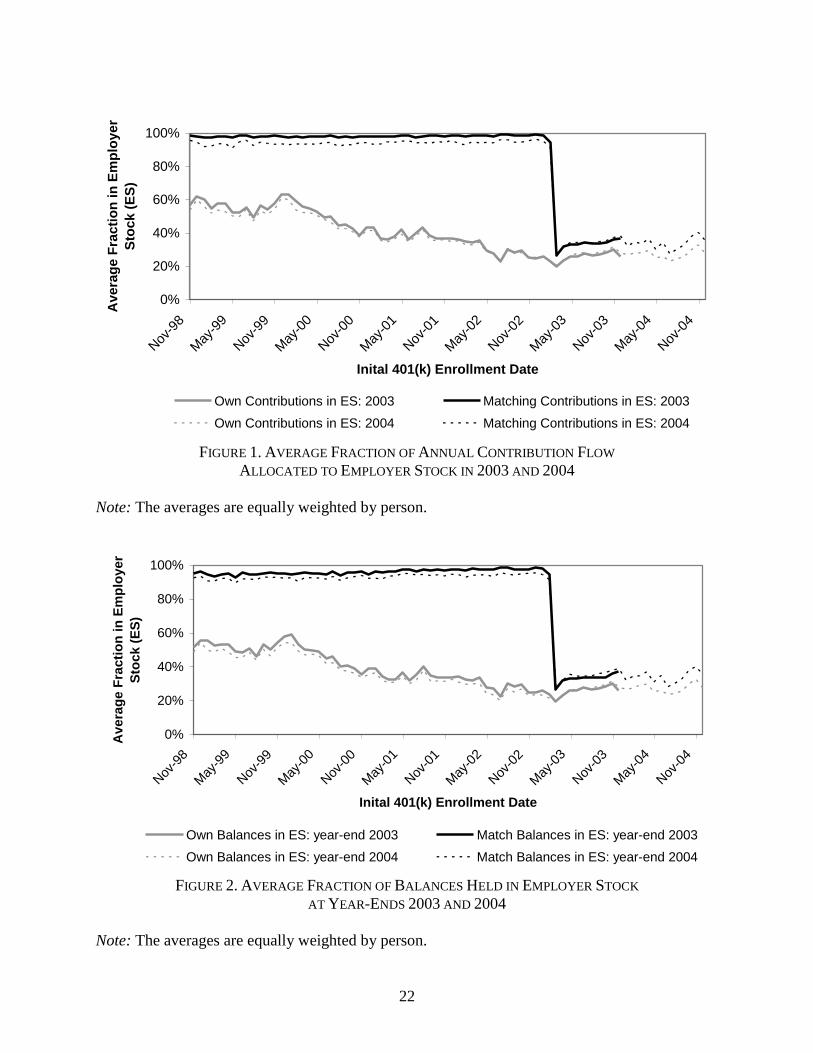
Figure 1 shows the plan change’s impact on the employer stock allocation of savings plan
participants. The solid lines represent, by month of plan enrollment (the x-axis), the average
fraction of contribution flows in 2003 that was allocated to employer stock for employees’ own
contributions (the grey line) and matching contributions (the black line).7 Similarly, the dashed
lines show contribution flow allocations to employer stock in 2004.
We first consider the matching contribution allocations to employer stock in 2003 and
2004 (the solid and dashed black lines). A sharp discontinuity is readily apparent between
participants enrolling before the plan change and those enrolling afterwards. Among participants
who enrolled between November 1998 and February 2003, the average fraction of matching
contributions allocated to employer stock was 98% in 2003 and 94% in 2004. There is
remarkably little variation in this average by enrollment month. In contrast, participants who
enrolled in the savings plan in March 2003 or later allocated a much lower fraction of their
5 Before April 2003, employees were eligible to participate in the 401(k) starting 12 months after hire, provided they
had worked at least 1,000 hours at the company. In April 2003, this eligibility requirement was reduced to 90 days
of employment, although eligibility for the employer match was still restricted to those with 12 months of tenure and
1,000 hours of service. This eligibility change affects savings plan participation for employees with lower levels of
tenure, and one might worry that it confounds our estimates of the March 2003 plan change effect. We will show in
Section III, however, that our results are virtually identical when we restrict the sample to an enrollment window
over which eligibility requirements were constant. 6 Unfortunately, our data do not explicitly identify how employees joined the firm. To screen out acquired
individuals, we drop employees whose initial appearance in our data is later than when they would have become
eligible to participate if they were organically hired full-time employees, given their coded hire date. 7 All figures weight each employee equally. Analogous figures with dollar-weighted averages are qualitatively
similar and are available from the authors by request.
8
matching contribution flow to employer stock: 34% on average in 2003 and 35% in 2004. The
high match allocation to employer stock among pre-March 2003 enrollees is due to the fact that
at enrollment, these participants were required to receive their match entirely in employer stock.
Even after this restriction was lifted, few elected to change their match allocation—only 9% of
pre-March 2003 enrollees as of year-end 2004, 22 months after the plan change. Post-March
2003 enrollees, in contrast, faced no restriction against choosing a match flow allocation at the
time of enrollment.
Turning to employees’ own contribution flows, we find that the average fraction allocated
to employer stock across all enrollment cohorts was 37% in 2003 (the grey solid line) and 34%
in 2004 (the grey dashed line). As with the match account, most of the variation in own-
contribution flow allocations across enrollment cohorts reflects variation in allocation decisions
made at the time of enrollment, since few participants change their allocation afterwards.
Between 2003 and 2004, 87% of participants observed in both years kept the same own-
contribution allocation to employer stock. Even among November to December 1998 enrollees
who remained at the firm five years later, 76% had the same own-contribution allocation to
employer stock in both 1998 and 2003. Consistent with the findings of Shlomo Benartzi (2001)
and Choi, Laibson, Madrian, and Metrick (2004b), the own-contribution flow allocation to
employer stock is higher for participants who enrolled when the company’s stock had performed
well in the recent past. (To maintain the anonymity of the study company, stock market
performance is not shown.)
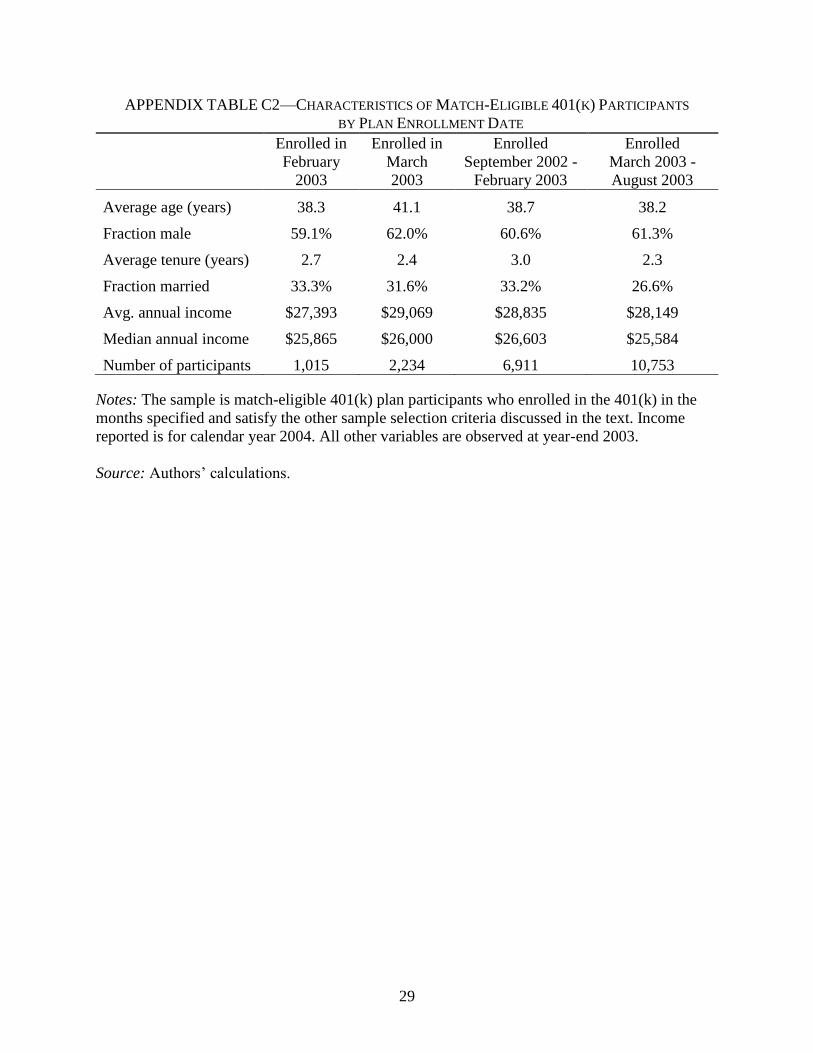
There is no reason to believe that individuals enrolling immediately before the plan
change had systematically different investment preferences than those enrolling immediately
afterwards. Web Appendix Table C2 shows that the demographic characteristics of employees
9
enrolling before and after the plan change are quite similar.8 If the presumption of comparable
investment preferences is correct, then both groups should have roughly the same target for their
total employer stock portfolio share, and the higher match allocation to employer stock for the
pre-change enrollees should have been offset by a decrease in their own-contribution allocation
to employer stock. This is not what we observe. Own-contribution allocations to employer stock
are unresponsive to the high employer stock match allocations induced by the first regime’s
matching rule. The result is a flypaper effect: each dollar of employer stock received in the
match account under the first regime raised total employer stock contributions by a full dollar,
rather than crowding out employer stock contributions in other accounts.
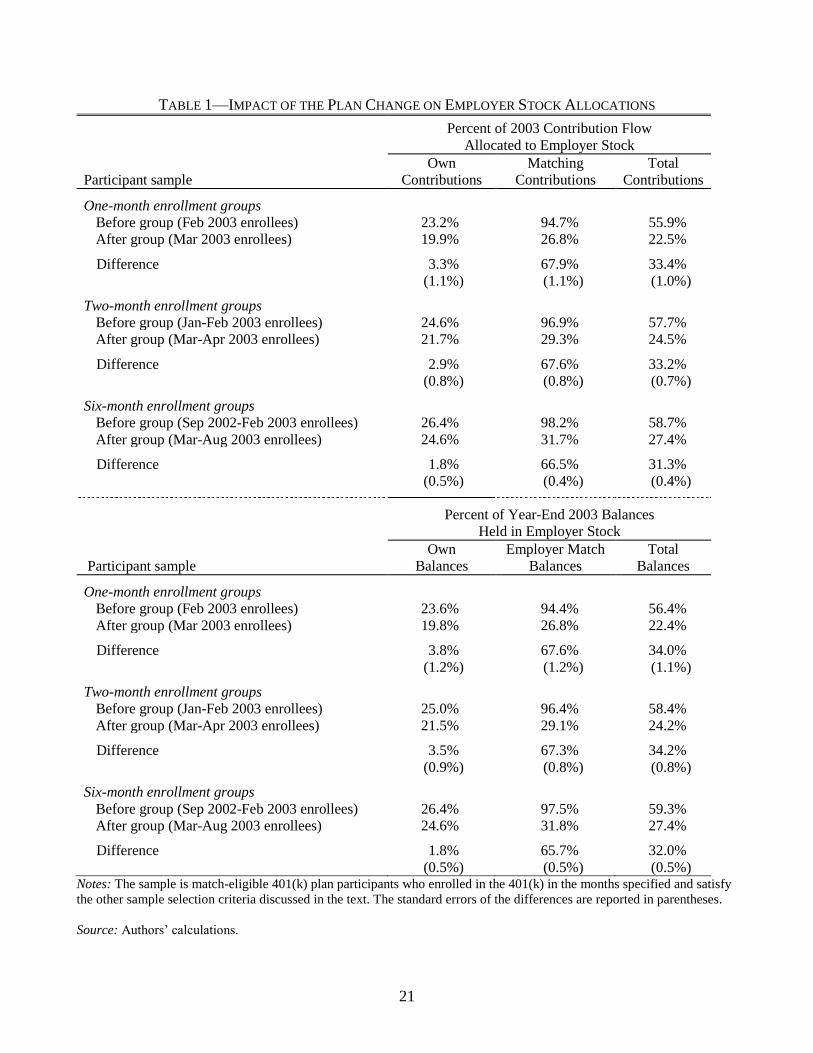
The top panel of Table 1 shows the magnitude of the effect that the plan change had on
contribution flows allocated to employer stock. If we measure the effect of the plan change by
comparing employees who enrolled one month before the plan change (February 2003 enrollees)
to those who enrolled in the first month after the plan change (March 2003 enrollees), we obtain
a 67.9 percentage point decline in the fraction of matching contribution flows allocated to
employer stock. Broadening the before and after groups to include employees who enrolled in
the two months before and the two months after the plan change, or the six months before and
the six months after the plan change, yields very similar estimates of 67.6 and 66.5 percentage
points respectively. Instead of offsetting the high match flows to employer stock under the first
regime, own-contribution flows to employer stock are actually a bit higher before than after the
change (1.8 to 3.3 percentage points, depending on the comparison groups). The result is that the
8 The number of post-March 2003 enrollees exceeds pre-March 2003 enrollees due to seasonal enrollment patterns
coupled with the company’s growing size over the sample period. Enrollees’ average asset allocations do not follow
a seasonal pattern when there are no plan changes, indicating that seasonality does not confound our plan change
effect estimates.
10
combined own- and match contribution flow allocations to employer stock differ by 33.4, 33.2,
and 31.3 percentage points using the one-, two-, and six-month comparison groups.
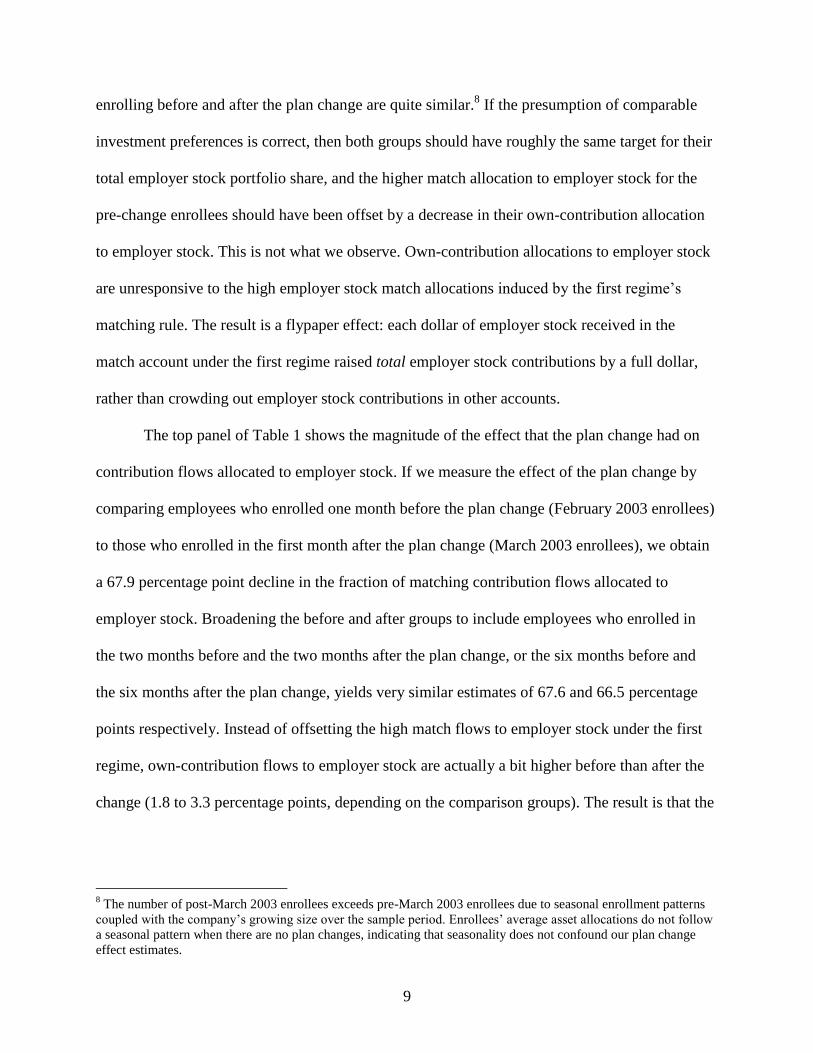
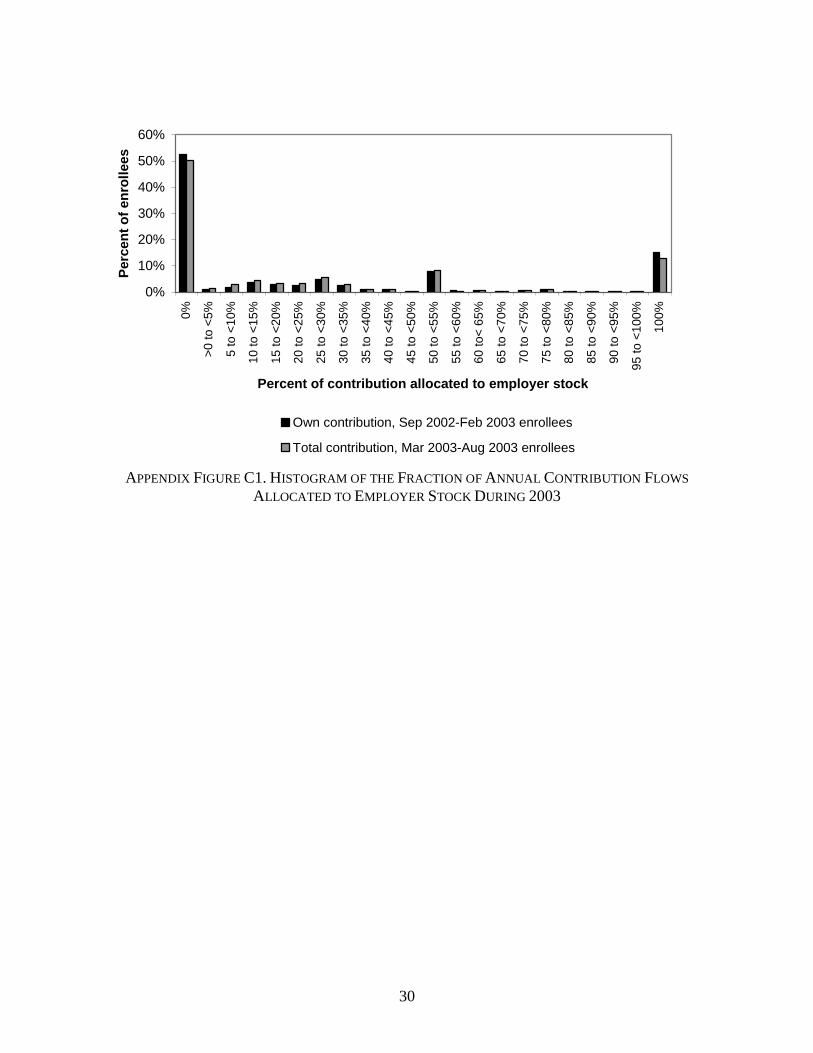
Interestingly, pre-March 2003 enrollees’ average own-contribution allocation to employer
stock and post-March 2003 enrollees’ average total contribution allocation to employer stock are
nearly identical; the two numbers are no more than a percentage point apart, regardless of the
comparison groups used. Web Appendix Figure C1 shows that not only the means, but also the
distributions are virtually identical when comparing pre-March 2003 enrollees’ own-contribution
employer stock allocations and post-March 2003 enrollees’ total contribution allocations.
Even though contribution flow allocations differ dramatically between those enrolling
after the plan change and those enrolling before, the allocation of balances, not flows, ultimately
determines portfolio returns. It is possible that employees were reallocating their 401(k) assets
after contributions were made in order to undo the discrepancies in flow allocations. Recall that
even prior to March 2003, employees could freely transfer their accumulated match balances out
of employer stock.
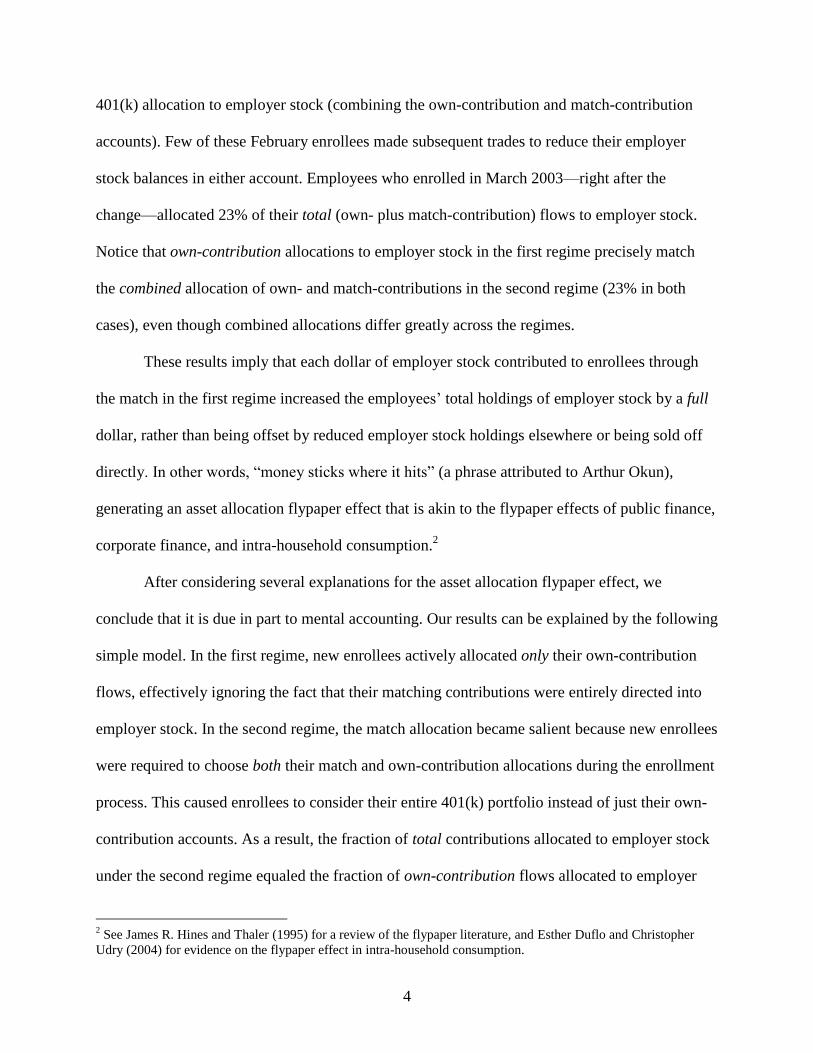
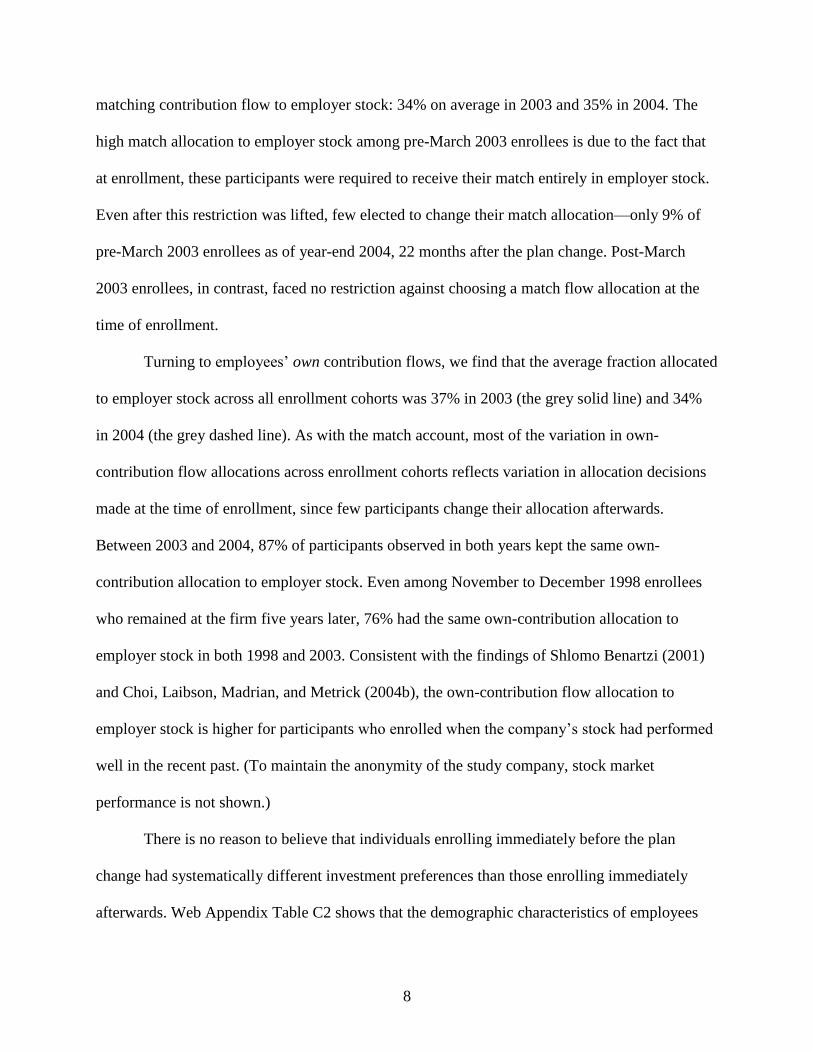
Figure 2 shows that such ex post rebalancing was not an important factor. The fraction of
total balances held in employer stock at year-ends 2003 and 2004 looks remarkably similar to the
contribution flow allocations in Figure 1. For employees who enrolled prior to March 2003, the
vast majority of match balances are invested in employer stock even at year-end 2004, 22 months
after the plan change. This finding is consistent with the results of Choi, Laibson, and Madrian
(2005b) who document that when employees are given the ability to diversify match balances out
of employer stock, few actually do. The fact that balance allocations closely track flow
allocations even for those who enrolled early in the sample period (e.g. 1998) demonstrates that
11
flow allocation decisions are not much more likely to be reversed as 401(k) balances grow larger
and the absolute dollar consequences of the 401(k) asset allocation increase.
The bottom panel of Table 1 shows the estimated impact of the 2003 plan change on the
balances held in employer stock. As suggested by Figure 2, the balance results are nearly
identical to the contribution flow results. The fraction of match balances held in employer stock
falls by between 65.7 and 67.6 percentage points—an effect only slightly smaller than that
measured for contribution flow allocations—whereas the fraction of own-contribution balances
held in employer stock falls by 1.8 to 3.8 percentage points. Integrating the own-contribution and
match accounts, the impact on total 401(k) balances is a 32.0 to 34.2 percentage point reduction
in employer stock holdings.
We have estimated the regression-adjusted impact of the plan change for each of the
comparison groups and accounts listed in Table 1, controlling for demographic characteristics.9
These unreported results differ little from the raw effects. We also find that the magnitude of the
flypaper effect is similar across different demographic subgroups. Of particular note, even
higher-income participants—who are likely to be more financially literate—exhibit a flypaper
effect comparable to the company-wide average flypaper effect. Finally, the magnitude of the
flypaper effect is similar if we restrict the sample to participants whose matching contributions
are fully vested upon enrollment, suggesting that the effect does not arise simply because
unvested participants do not value the employer match and thus pay little attention to it.10
9 The regression-adjusted results control for gender, marital status, age, tenure, income, and plan balances. These
results are available from the authors upon request. 10
Participants are 100% vested in their employer matching contributions once they attain 3 years of service.
12
IV. Discussion
What drives the asset allocation flypaper effect? We consider several potential
explanations and conclude that it is not possible to explain the effects without mental accounting.
Prior to the plan change, enrollees made an asset allocation decision for only their own-
contribution flows. Therefore, it was psychologically natural to put own-contributions into a
segregated mental account and to make flow allocation decisions for these contributions while
ignoring the match flow allocation. After the plan change, enrollees were forced to choose
allocations for both accounts, which made both accounts salient and encouraged their integration
into a unified mental account.
Consistent with this story, participants who enrolled in the 401(k) just before March 2003
allocated about 23% of their own-contribution flows to employer stock, whereas those enrolling
just after allocated about 23% of their combined contribution flows to employer stock. This
suggests that the average participant desires to allocate one quarter of his 401(k) assets to
employer stock in whatever portfolios are salient, whether the set of salient portfolios is narrow
or broad. This domain-invariance applies not only to the mean, but also to the across-employee
distribution of allocations to employer stock.
In line with past research, we document extensive passivity among investors. Asset
allocation decisions made at enrollment are only infrequently altered afterwards. However,
passivity cannot account for choices made at enrollment. An employee in the process of
enrolling in her 401(k) plan has momentarily overcome passivity. The cost of explicitly stating
an asset allocation preference is already sunk, so there is no reason not to choose an allocation
that is closest to what the employee thinks optimal. An enrollee before March 2003 could have
reduced the fraction of her own contributions allocated to employer stock upon enrollment to
13
compensate for the fact that all of her matching contributions would be made in employer stock.
Instead, we see that own-contribution allocations to employer stock among pre-March 2003
enrollees are similar to own-contribution allocations among post-March 2003 enrollees, even
though post-March 2003 enrollees allocate less than a third of their matching contributions to
employer stock. Passivity does, however, help explain why the influence of salience at the point
of enrollment is so persistent afterwards.
There are three other potential explanations for the flypaper effect, none of which can
completely explain the magnitude of the results documented above. The first is the short-sales
constraint imposed by the 401(k). Suppose pre-March 2003 enrollees wanted to reduce their
own-contribution flow allocation to employer stock in order to offset the direction of the match
into employer stock. In a 401(k) plan, however, participants cannot allocate less than zero to
employer stock in their own-contribution flows; they cannot sell short. If they are unaware that
they can trade out of the employer stock in their match account or unwilling to do so, they are
“constrained” to hold a large fraction of their portfolio in employer stock.
Once employees were allowed to specify the asset allocation for their matching
contribution flows, this short-sales constraint was effectively relaxed and participants could hold
less employer stock. Web Appendix A calculates how much employer stock allocations would be
expected to drop after the plan change if only a short-sales constraint were responsible for the
flypaper effect. We find that such a constraint cannot quantitatively generate the drop we
actually observe. Furthermore, this short-sales constraint explanation predicts that the prevalence
of 0% own-contribution employer stock allocations among the pre-March 2003 cohort would be
considerably higher than the prevalence of 0% total employer stock allocations among the post-
March 2003 cohort, since pre-March enrollees who desire a 0% total allocation are a strict subset
14
of constrained pre-March employees. In fact, the frequency of 0% own-contribution allocations
before March is nearly identical to the frequency of 0% total allocations afterwards, consistent
with a mental accounting story but not with a short-sales constraint story.
A second potential explanation is that enrollees before the plan change ignored the match
allocation because they were unaware of the match’s existence or its asset allocation. Of course,
without direct measurement of participant knowledge about the match, mental accounting in the
first regime is observationally equivalent to participant ignorance about the match. In Web
Appendix B, we calculate that in order for ignorance alone to generate a flypaper effect large
enough to match the data, at least 92% of enrollees under the first regime must have been
ignorant. Although some ignorance is likely, 92% seems an implausibly large fraction of
participants who are unaware of a major, frequently advertised feature of their 401(k) plan.
A final potential explanation for the flypaper effect is that employees perceived the plan
change as removing the company’s implicit endorsement of its stock as an attractive investment.
The perception of such an endorsement could explain why so few participants diversified out of
employer stock in their match account before the plan change. And the removal of the
endorsement could have generated the large drop in employer stock allocations after the change.
Past research has documented the existence of such endorsement effects (Benartzi 2001;
Madrian and Shea 2001; Jeffrey R. Brown, Nellie Liang, and Scott Weisbenner 2007; John
Beshears et al. 2008). It is plausible that our participants preferred a higher contribution
allocation to employer stock before the plan change than after. However, the endorsement effect
magnitudes found in other studies are much smaller than the 33 percentage point effect that
resulted from the regime change studied in the current paper. It would also be a remarkable
coincidence if the plan change generated an endorsement effect at our company that by itself
15
caused total employer stock allocations among post-March 2003 enrollees to almost exactly
equal the own-contribution employer stock allocations among pre-March 2003 enrollees.
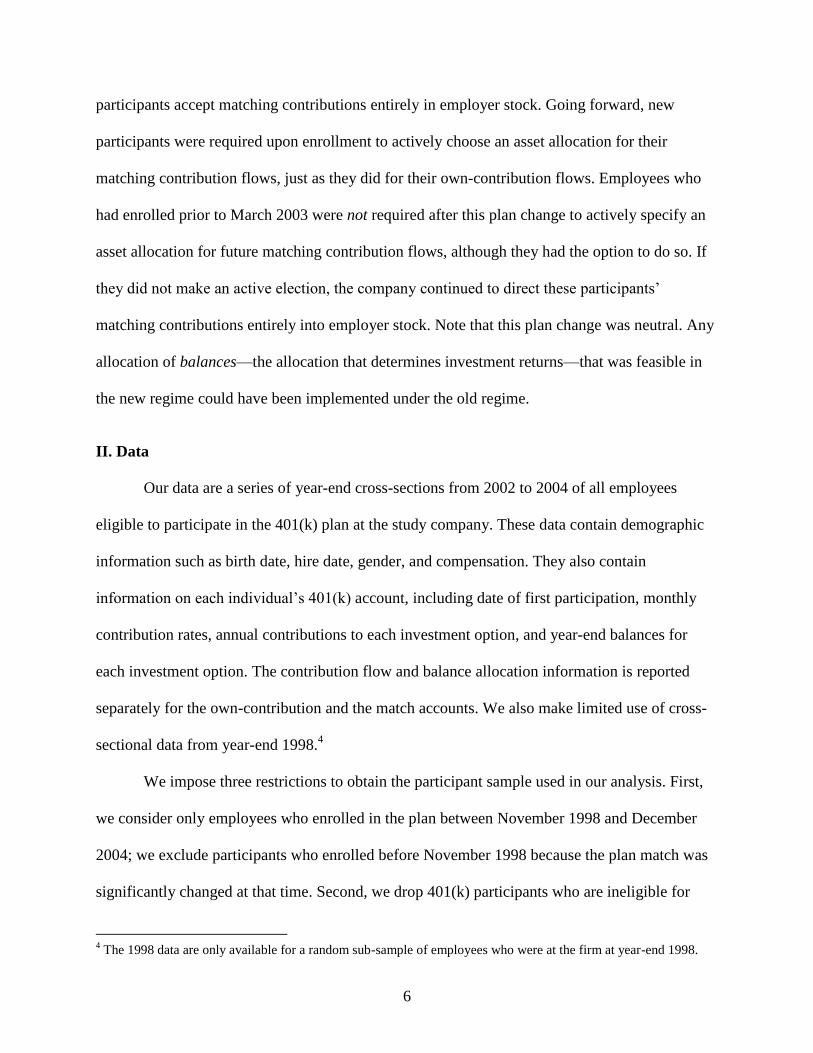
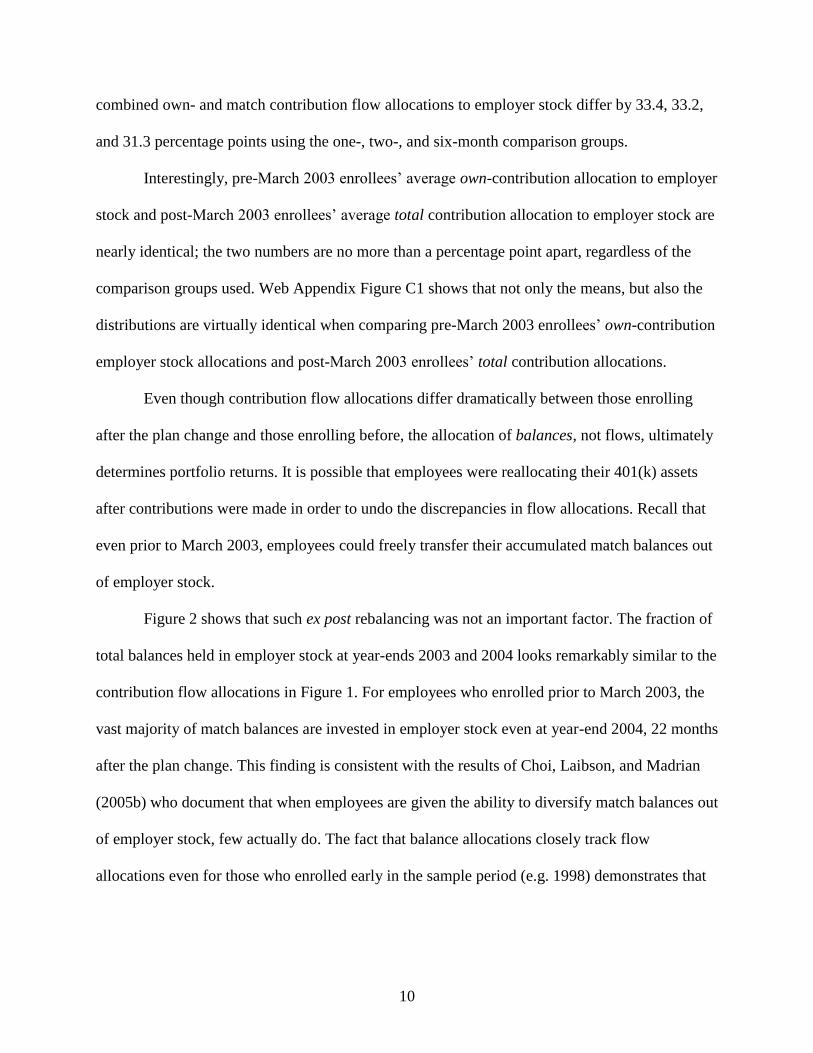
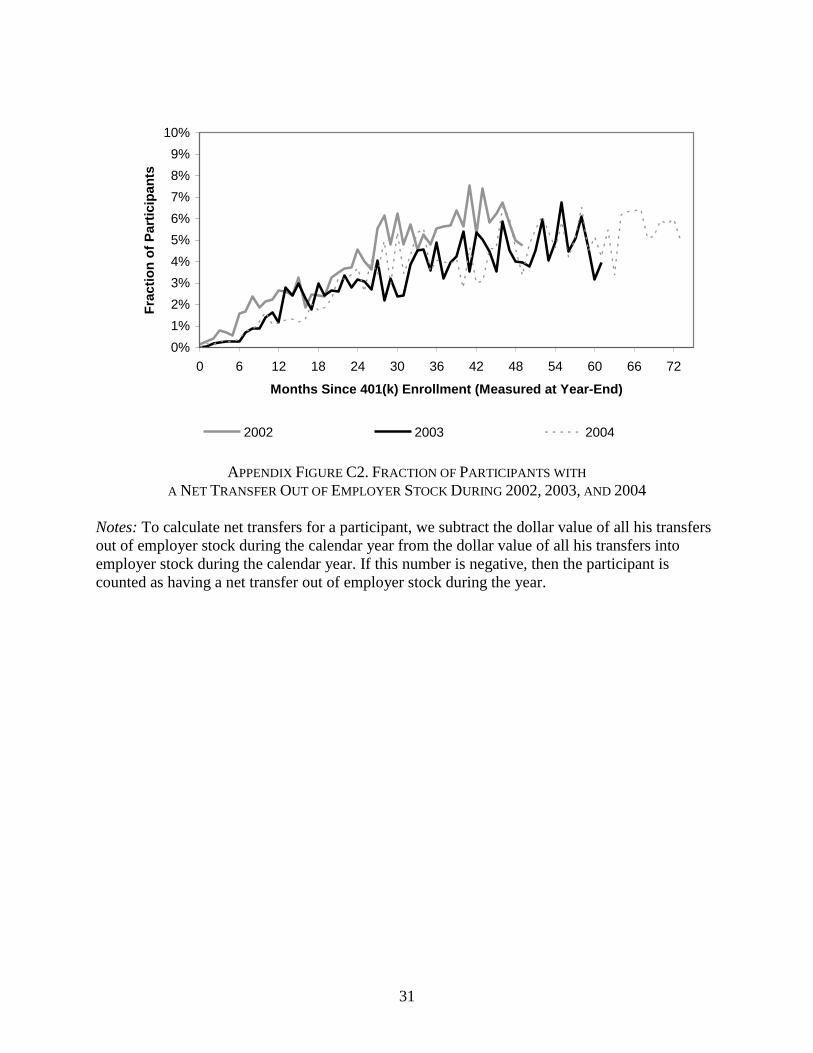
Moreover, participant behavior after the plan change is inconsistent with an endorsement
effect of such a large magnitude. If employer stock was perceived to be much less attractive
starting in March 2003, there should have been a corresponding change in the asset allocation of
pre-March 2003 enrollees. Despite high levels of passivity, some participants do make changes,
and Gabriel D. Carroll et al. (2008) find that 401(k) participants opt out of the status quo more
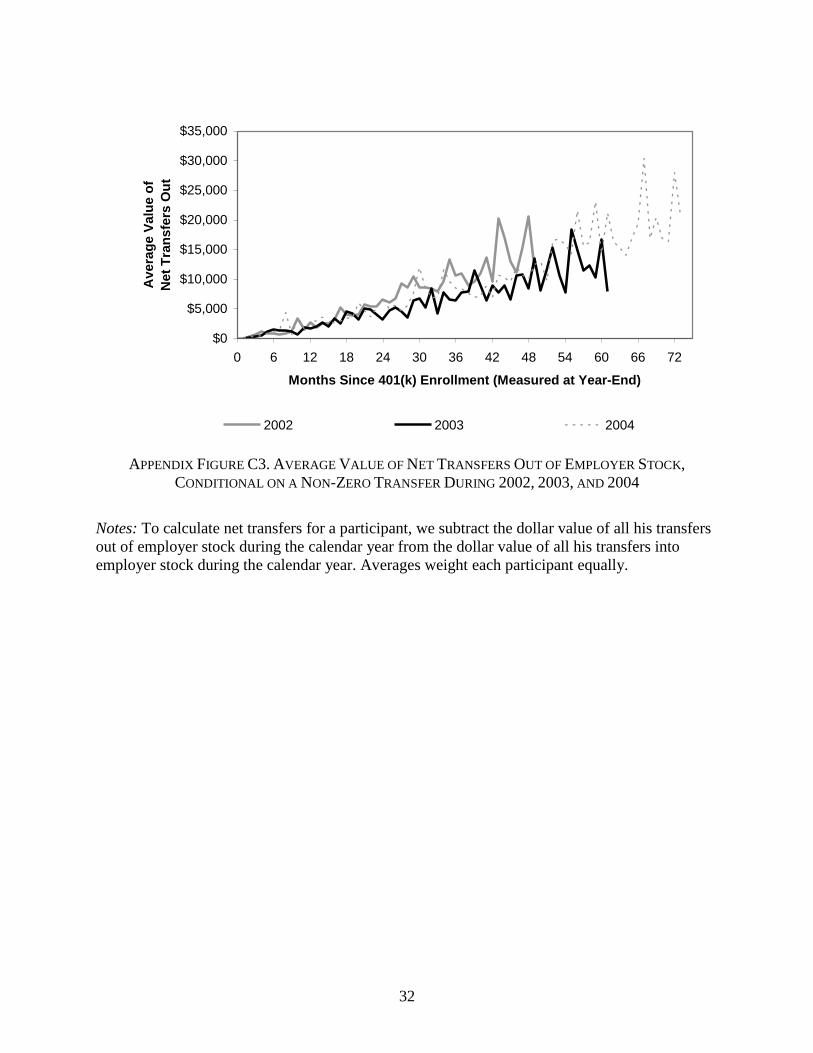
often when the status quo becomes less attractive to them. But we find no evidence that trading
out of employer stock increased following the plan change. Likewise, among those who did trade
out of employer stock, we find no evidence that the size of the net transfers out increased. (See
Web Appendix Figures C2 and C3.) It therefore seems unlikely that an endorsement effect
accounts for a large portion of the plan change effect.
Note that the latter two explanations work against each other. A large endorsement effect
implies that most participants know what their match asset allocation is, ruling out extreme
ignorance. If ignorance and endorsement effects coexist, then each limits the size of the other.
Our mental accounting evidence has implications for the interpretation of a growing body
of empirical research that examines asset allocations in only one set of financial accounts, such
as 401(k) or retail brokerage accounts.11
One concern is that choices in these accounts that
appear irrational in isolation may be justified by offsetting effects in the rest of the individual’s
portfolio. Although we do not observe the entire portfolio of individuals in this paper, we do
observe two separate accounts and document a lack of coordination between those accounts’
11
Examples include Terrance Odean (1998), Brad Barber and Odean (2000), Madrian and Shea (2001), Choi,
Laibson, Madrian, and Metrick (2002, 2004a), Agnew, Balduzzi, and Sundén (2003), Choi, Laibson, and Madrian
(2005a,b), Mitchell, Mottola, Utkus, and Yamaguchi (2006), Brown, Liang, and Weisbenner (2007), and William
Goetzmann and Alok Kumar (forthcoming).
16
outcomes when investors are not forced to simultaneously make active decisions for both. The
failure of integration in this context is particularly striking given how closely related the own-
and matching contribution 401(k) accounts are. Integrating across other types of financial
accounts is likely to be a more cognitively complicated and time-consuming task, suggesting that
a similar lack of integration may apply across other financial accounts as well.
This paper’s results also have implications for public policy. The risks of having a
portfolio with significant exposure to employer stock have been well-documented (Michael
Brennan and Walter N. Torous 1999; James M. Poterba 2004; Lisa Meulbroek 2005). After
bankruptcies in 2001 and 2002 wiped out the 401(k) assets of employees at companies like
Enron, many employers relaxed rules that restricted the ability of 401(k) participants to diversify
out of employer stock. The 2006 Pension Protection Act further requires that employee
contributions to employer stock be immediately diversifiable, and that employer contributions be
diversifiable after three years. The Pension Protection Act does not cap overall exposure to
employer stock in the 401(k), and it does not preclude employers from directing their matching
contributions into employer stock.
The evidence presented in this paper, along with that in Choi, Laibson, and Madrian
(2005b), suggests that these provisions of the Pension Protection Act and similar company-
sponsored initiatives will have only a small impact on 401(k) employer stock holdings. When
companies direct contributions to into employer stock—as is the case for 44% of matching
contributions in the U.S. (Fidelity Investments 2002)—total employer stock holdings by
participants increase by the entire amount of those contributions. Allowing employees to
diversify their contributions after they are received does little to reduce employer stock holdings.
17
Many companies, while cognizant of the diversification problems that employer stock
creates for their 401(k) participants, are reluctant to outright eliminate employer stock in their
plan out of concern that such a measure will lower their stock price. The policies implemented
by the company studied in this paper reduce employer stock exposure without generating selling
pressure. The 2003 plan change reduced the employer stock share of contributions going forward
for new enrollees, while leaving existing employees (and their balances) untouched.
In 2005, the company went further, but again adopted a regime change that only affected
contributions going forward. The firm automatically made the matching-contribution flow
allocation equal to the own-contribution flow allocation for participants who met two criteria: (1)
they had enrolled before March 2003 and (2) they had never actively chosen a matching-
contribution flow allocation afterwards. The vast majority of participants who enrolled before
March 2003 met both criteria, and most also remained passive in response to this second plan
change. As a result, matching contribution flows to employer stock plummeted overnight for
these individuals to the much lower level that they had selected for their own contributions, with
no offsetting adjustment to own-contribution flow allocations. If the firm were to make no more
changes, the fraction of total balances held in employer stock would fall over time, converging
towards the employer stock allocation of ongoing contribution flows.
Of course, there are approaches to reducing employer stock holdings other than the one
implemented by this company. These include the wholesale elimination of employer stock from
the investment menu, capping the fraction of balances that can be held in employer stock (at, for
example, 20%), automatically (with an opt-out) rebalancing employees who have an employer
stock allocation that exceeds some threshold (such as 20%), or allowing employees to opt into a
gradual and automatic reduction of their employer stock holdings (Benartzi and Thaler, 2003).
18
References
Ameriks, John, and Stephen P. Zeldes. 2004. “How Do Household Portfolio Shares Vary With
Age?” http://www0.gsb.columbia.edu/whoswho/getpub.cfm?pub=16.
Agnew, Julie, Pierluigi Balduzzi, and Annika Sundén. 2003. “Portfolio Choice and Trading in
a Large 401(k) Plan.” American Economic Review, 93(1): 193-215.
Barber, Brad, and Terrance Odean. 2000. “Trading is Hazardous to Your Wealth: The
Common Stock Investment Performance of Individual Investors.” Journal of Finance,
55(2): 773-806.
Benartzi, Shlomo. 2001. “Excessive Extrapolation and the Allocation of 401(k) Accounts to
Company Stock.” Journal of Finance, 56(5): 1747-1764.
Benartzi, Shlomo, and Richard Thaler. 2002. "Sell More Tomorrow: Using Behavioral
Economics to Increase Employee Diversification,”
http://www.anderson.ucla.edu/faculty/shlomo.benartzi/sellmoretomorrow1_05.pdf.
Beshears, John, James J. Choi, David Laibson, and Brigitte C. Madrian. 2008. “The
Importance of Default Options for Retirement Saving Outcomes: Evidence from the
United States.” In Lessons from Pension Reform in the Americas, eds. Stephen J. Kay and
Tapen Sinha, 59-87. Oxford: Oxford University Press.
Brennan, Michael, and Walter N. Torous. 1999. “Individual Decision Making and Investor
Welfare.” Economic Notes, 28(2): 119-143.
Brown, Jeffery R., Nellie Liang and Scott Weisbenner. 2007. “Individual Account Investment
Options and Portfolio Choice: Behavioral Lessons from 401(k) Plans.” Journal of Public
Economics. 91(10): 1992-2013.
Carroll, Gabriel D., Choi, James J., David Laibson, Brigitte C. Madrian, and Andrew
Metrick. 2008. “Optimal Defaults and Active Decisions.” NBER Working Paper No.
11554.
Choi, James J., David Laibson, and Brigitte C. Madrian. 2005a. “$100 Bills on the Sidewalk:
Suboptimal Saving in 401(k) Savings Plans.” NBER Working Paper No. 11554.
Choi, James J., David Laibson, and Brigitte C. Madrian. 2005b. “Are Empowerment and
Education Enough? Underdiversification in 401(k) Plans.” Brookings Papers on
Economic Activity, 2005(2): 151-198.
Choi, James J., David Laibson, Brigitte C. Madrian, and Andrew Metrick. 2002. “Defined
Contribution Pensions: Plan Rules, Participant Choices, and the Path of Least
Resistance.” In Tax Policy and the Economy 16, ed. James Poterba, 67-114. Cambridge,
MA: MIT Press.
19
Choi, James, David Laibson, Brigitte C. Madrian, and Andrew Metrick. 2004a. “For Better
or For Worse: Default Effects and 401(k) Savings Behavior.” In Perspectives in the
Economics of Aging, ed. David A. Wise, 81-121. Chicago: University of Chicago Press.
Choi, James, David Laibson, Brigitte C. Madrian, and Andrew Metrick. 2004b.
“Employees’ Investment Decisions About Company Stock.” In Pension Design and
Structure: New Lessons from Behavioral Finance, eds. Olivia Mitchell and Stephen
Utkus, 121-137. Oxford: Oxford University Press.
Duflo, Esther and Christopher Udry. 2004. “Intrahousehold Resource Allocation in Cote
d’Ivoire: Social Norms, Separate Accounts and Consumption Choices.” NBER Working
Paper No. 10498.
Fidelity Investments. 2002. “Fidelity® Publishes Special Report on Company Stock and 401(k)
Plans.” http://content.members.fidelity.com/ Inside_Fidelity/fullStory/1,,1263,00.html
(accessed August 20, 2005).
Goetzmann, William, and Alok Kumar. Forthcoming. “Equity Portfolio Diversification.”
Review of Finance.
Hines, James R. and Richard H. Thaler. 1995. “The Flypaper Effect.” Journal of Economic
Perspectives, 9(4): 217-226.
Madrian, Brigitte C. and Dennis F. Shea. 2001. “The Power of Suggestion: Inertia in 401(k)
Participation and Savings Behavior.” Quarterly Journal of Economics, 116(4): 1149-
1525.
Mitchell, Olivia S., Gary R. Mottola, Steven P. Utkus and Takeshi Yamaguchi. 2006. “The
Inattentive Participant: Portfolio Trading Behavior in 401(k) Plans.” Michigan
Retirement Research Center Research Paper No. WP 2006-115.
Meulbroek, Lisa. 2005. “Company Stock in Pension Plans: How Costly Is It?” Journal of Law
and Economics, 48(2): 443-474.
Odean, Terrance. 1998. “Are Investors Reluctant to Realize Their Losses?” Journal of Finance
53(5): 1775-98.
Poterba, James M. 2004. “Employer Stock and 401(k) Plans.” American Economic Review
93(2): 398-404.
Samuelson, William, and Richard Zeckhauser. 1988. “Status Quo Bias in Decision Making.”
Journal of Risk and Uncertainty, 1(1): 7-59.
Thaler, Richard H. 1985. “Mental Accounting and Consumer Choice.” Marketing Science,
4(3): 199-214.

20
Thaler, Richard H. 1990. “Saving, Fungibility and Mental Accounts.” Journal of Economic
Perspectives, 4(1): 193-205.
Thaler, Richard H. 1999. “Mental Accounting Matters.” Journal of Behavioral Decision
Making, 12(3): 183-206.
21
TABLE 1—IMPACT OF THE PLAN CHANGE ON EMPLOYER STOCK ALLOCATIONS
Percent of 2003 Contribution Flow
Allocated to Employer Stock
Participant sample
Own
Contributions
Matching
Contributions
Total
Contributions
One-month enrollment groups
Before group (Feb 2003 enrollees) 23.2% 94.7% 55.9%
After group (Mar 2003 enrollees) 19.9% 26.8% 22.5%
Difference 3.3%
(1.1%)
67.9%
(1.1%)
33.4%
(1.0%)
Two-month enrollment groups
Before group (Jan-Feb 2003 enrollees) 24.6% 96.9% 57.7%
After group (Mar-Apr 2003 enrollees) 21.7% 29.3% 24.5%
Difference 2.9%
(0.8%)
67.6%
(0.8%)
33.2%
(0.7%)
Six-month enrollment groups
Before group (Sep 2002-Feb 2003 enrollees) 26.4% 98.2% 58.7%
After group (Mar-Aug 2003 enrollees) 24.6% 31.7% 27.4%
Difference 1.8%
(0.5%)
66.5%
(0.4%)
31.3%
(0.4%)
Percent of Year-End 2003 Balances
Held in Employer Stock
Participant sample
Own
Balances
Employer Match
Balances
Total
Balances
One-month enrollment groups
Before group (Feb 2003 enrollees) 23.6% 94.4% 56.4%
After group (Mar 2003 enrollees) 19.8% 26.8% 22.4%
Difference 3.8%
(1.2%)
67.6%
(1.2%)
34.0%
(1.1%)
Two-month enrollment groups
Before group (Jan-Feb 2003 enrollees) 25.0% 96.4% 58.4%
After group (Mar-Apr 2003 enrollees) 21.5% 29.1% 24.2%
Difference 3.5%
(0.9%)
67.3%
(0.8%)
34.2%
(0.8%)
Six-month enrollment groups
Before group (Sep 2002-Feb 2003 enrollees) 26.4% 97.5% 59.3%
After group (Mar-Aug 2003 enrollees) 24.6% 31.8% 27.4%
Difference 1.8%
(0.5%)
65.7%
(0.5%)
32.0%
(0.5%) Notes: The sample is match-eligible 401(k) plan participants who enrolled in the 401(k) in the months specified and satisfy
the other sample selection criteria discussed in the text. The standard errors of the differences are reported in parentheses.
Source: Authors’ calculations.
22
0%
20%
40%
60%
80%
100%
Nov
-98
May
-99
Nov
-99
May
-00
Nov
-00
May
-01
Nov
-01
May
-02
Nov
-02
May
-03
Nov
-03
May
-04
Nov
-04
Inital 401(k) Enrollment Date
Avera
ge F
racti
on
in
Em
plo
yer
Sto
ck (
ES
)
Own Contributions in ES: 2003 Matching Contributions in ES: 2003
Own Contributions in ES: 2004 Matching Contributions in ES: 2004
FIGURE 1. AVERAGE FRACTION OF ANNUAL CONTRIBUTION FLOW
ALLOCATED TO EMPLOYER STOCK IN 2003 AND 2004
Note: The averages are equally weighted by person.
0%
20%
40%
60%
80%
100%
Nov
-98
May
-99
Nov
-99
May
-00
Nov
-00
May
-01
Nov
-01
May
-02
Nov
-02
May
-03
Nov
-03
May
-04
Nov
-04
Inital 401(k) Enrollment Date
Av
era
ge
Fra
cti
on
in
Em
plo
ye
r
Sto
ck (
ES
)
Own Balances in ES: year-end 2003 Match Balances in ES: year-end 2003
Own Balances in ES: year-end 2004 Match Balances in ES: year-end 2004
FIGURE 2. AVERAGE FRACTION OF BALANCES HELD IN EMPLOYER STOCK
AT YEAR-ENDS 2003 AND 2004
Note: The averages are equally weighted by person.
23
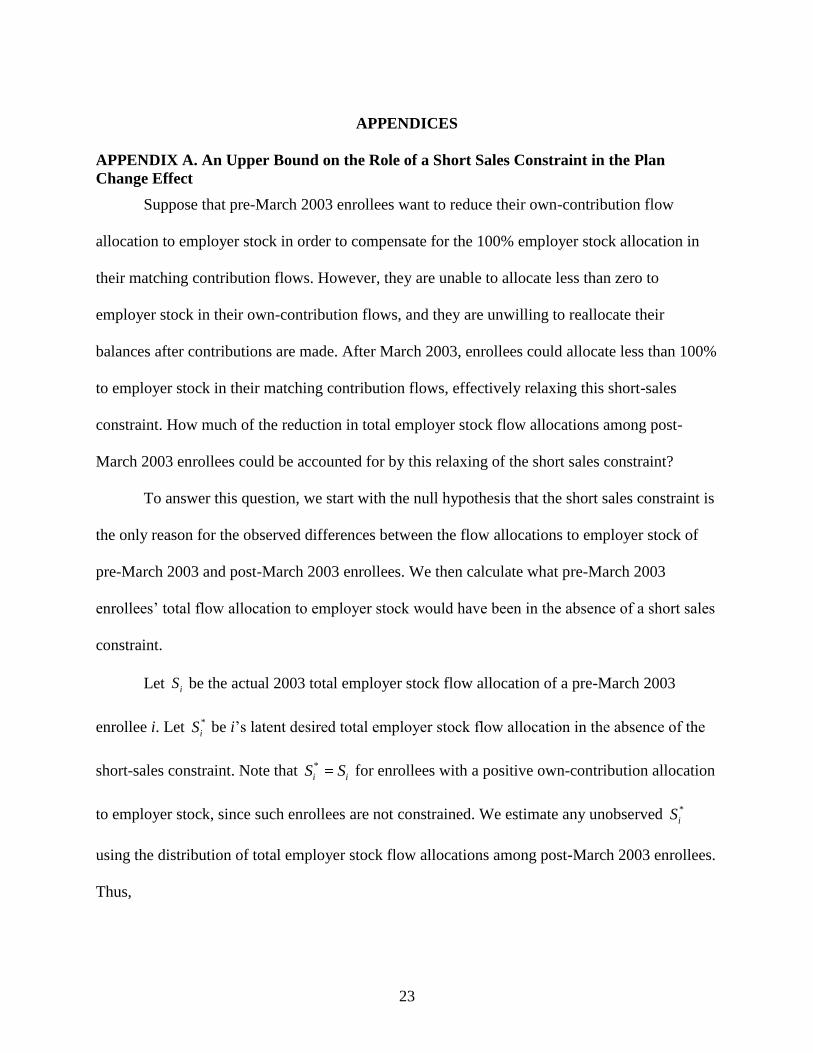
APPENDICES
APPENDIX A. An Upper Bound on the Role of a Short Sales Constraint in the Plan
Change Effect
Suppose that pre-March 2003 enrollees want to reduce their own-contribution flow
allocation to employer stock in order to compensate for the 100% employer stock allocation in
their matching contribution flows. However, they are unable to allocate less than zero to
employer stock in their own-contribution flows, and they are unwilling to reallocate their
balances after contributions are made. After March 2003, enrollees could allocate less than 100%
to employer stock in their matching contribution flows, effectively relaxing this short-sales
constraint. How much of the reduction in total employer stock flow allocations among post-
March 2003 enrollees could be accounted for by this relaxing of the short sales constraint?
To answer this question, we start with the null hypothesis that the short sales constraint is
the only reason for the observed differences between the flow allocations to employer stock of
pre-March 2003 and post-March 2003 enrollees. We then calculate what pre-March 2003
enrollees’ total flow allocation to employer stock would have been in the absence of a short sales
constraint.
Let iS be the actual 2003 total employer stock flow allocation of a pre-March 2003
enrollee i. Let *
iS be i’s latent desired total employer stock flow allocation in the absence of the
short-sales constraint. Note that *
i iS S for enrollees with a positive own-contribution allocation
to employer stock, since such enrollees are not constrained. We estimate any unobserved *
iS
using the distribution of total employer stock flow allocations among post-March 2003 enrollees.
Thus,
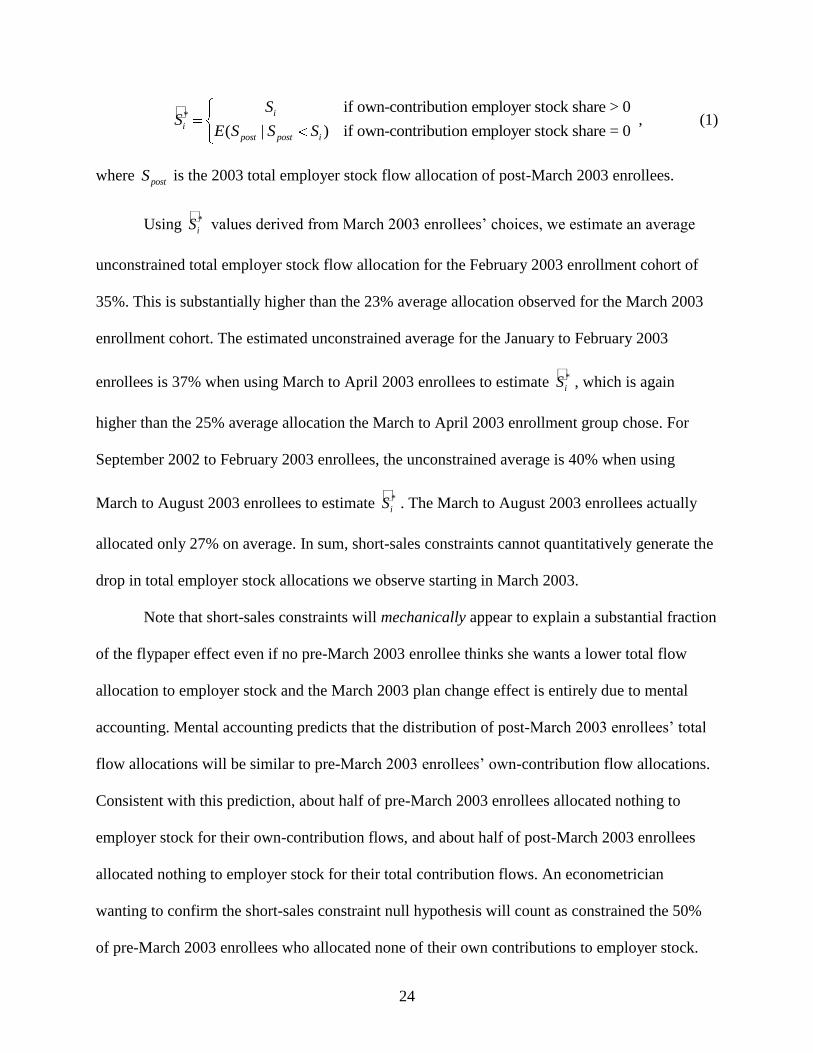
24
*
if own-contribution employer stock share > 0
( | ) if own-contribution employer stock share = 0
i
i
post post i
SS
E S S S, (1)
where postS is the 2003 total employer stock flow allocation of post-March 2003 enrollees.
Using *
iS values derived from March 2003 enrollees’ choices, we estimate an average
unconstrained total employer stock flow allocation for the February 2003 enrollment cohort of
35%. This is substantially higher than the 23% average allocation observed for the March 2003
enrollment cohort. The estimated unconstrained average for the January to February 2003
enrollees is 37% when using March to April 2003 enrollees to estimate *
iS , which is again
higher than the 25% average allocation the March to April 2003 enrollment group chose. For
September 2002 to February 2003 enrollees, the unconstrained average is 40% when using
March to August 2003 enrollees to estimate *
iS . The March to August 2003 enrollees actually
allocated only 27% on average. In sum, short-sales constraints cannot quantitatively generate the
drop in total employer stock allocations we observe starting in March 2003.
Note that short-sales constraints will mechanically appear to explain a substantial fraction
of the flypaper effect even if no pre-March 2003 enrollee thinks she wants a lower total flow
allocation to employer stock and the March 2003 plan change effect is entirely due to mental
accounting. Mental accounting predicts that the distribution of post-March 2003 enrollees’ total
flow allocations will be similar to pre-March 2003 enrollees’ own-contribution flow allocations.
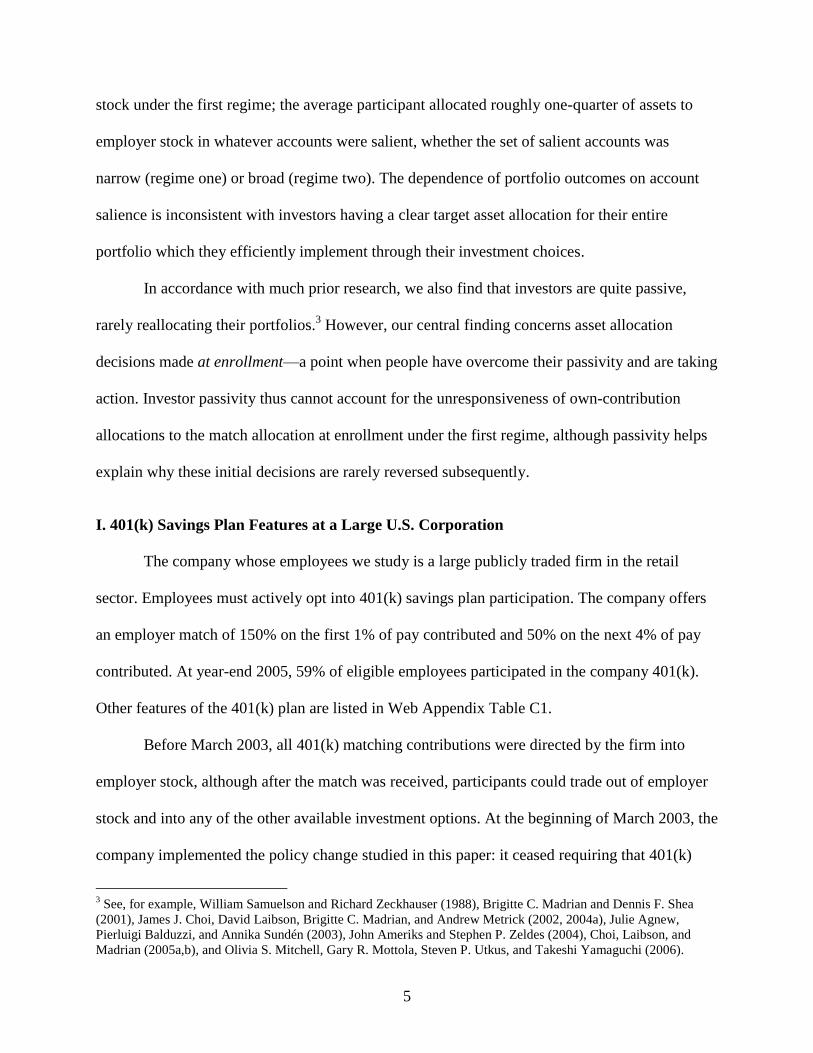
Consistent with this prediction, about half of pre-March 2003 enrollees allocated nothing to
employer stock for their own-contribution flows, and about half of post-March 2003 enrollees
allocated nothing to employer stock for their total contribution flows. An econometrician
wanting to confirm the short-sales constraint null hypothesis will count as constrained the 50%
of pre-March 2003 enrollees who allocated none of their own contributions to employer stock.
25
The econometrician would then impute *
iS for these ostensibly constrained investors as being
close to 0, since so many of the post-March 2003 enrollee total allocations are close to 0.
Therefore, the pre-March 2003 enrollees’ estimated unconstrained allocations will be
considerably lower than their actual allocations even if none of the pre-March 2003 enrollees
were actually thinking that they wanted a lower total employer stock allocation.
APPENDIX B. A Lower Bound on the Prevalence of Ignorant Employees Needed to
Generate the Plan Change Effect
This appendix calculates a lower bound on the proportion of pre-March 2003 enrollees
who need to be ignorant of the match’s existence in order to quantitatively generate the portfolio
effect of the 2003 plan change.
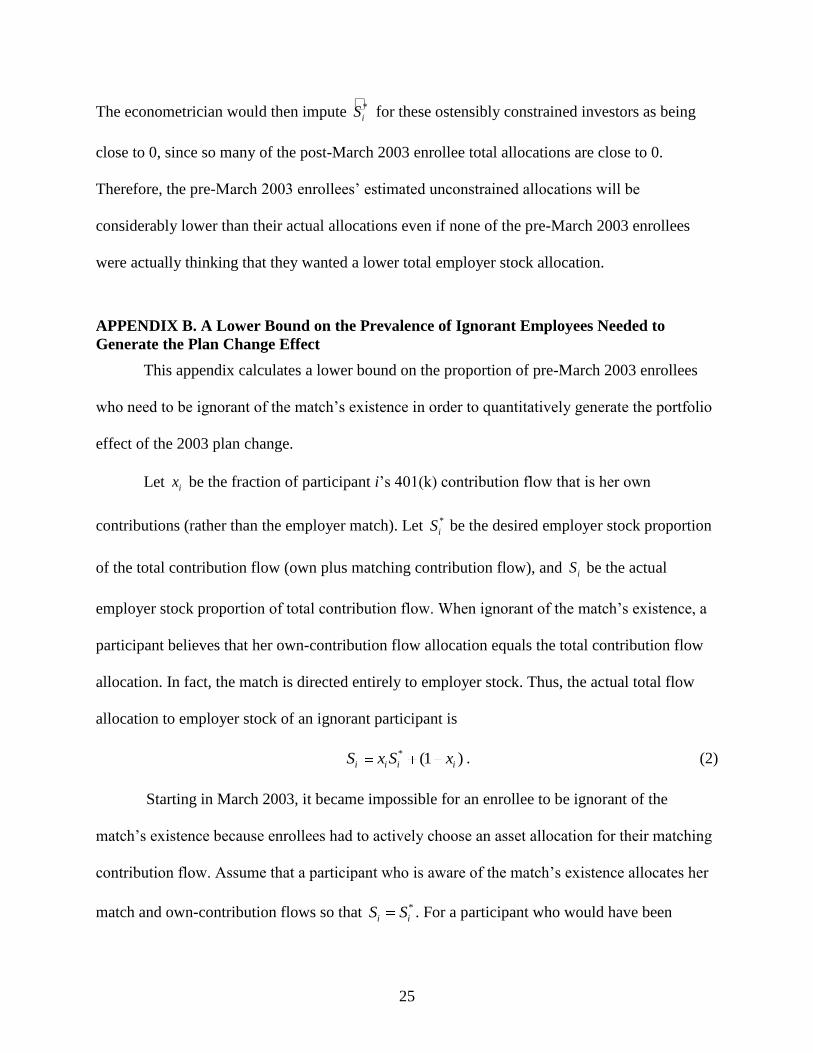
Let ix be the fraction of participant i’s 401(k) contribution flow that is her own
contributions (rather than the employer match). Let *
iS be the desired employer stock proportion
of the total contribution flow (own plus matching contribution flow), and iS be the actual
employer stock proportion of total contribution flow. When ignorant of the match’s existence, a
participant believes that her own-contribution flow allocation equals the total contribution flow
allocation. In fact, the match is directed entirely to employer stock. Thus, the actual total flow
allocation to employer stock of an ignorant participant is
* (1 )i i i iS x S x . (2)
Starting in March 2003, it became impossible for an enrollee to be ignorant of the
match’s existence because enrollees had to actively choose an asset allocation for their matching
contribution flow. Assume that a participant who is aware of the match’s existence allocates her
match and own-contribution flows so that *
i iS S . For a participant who would have been
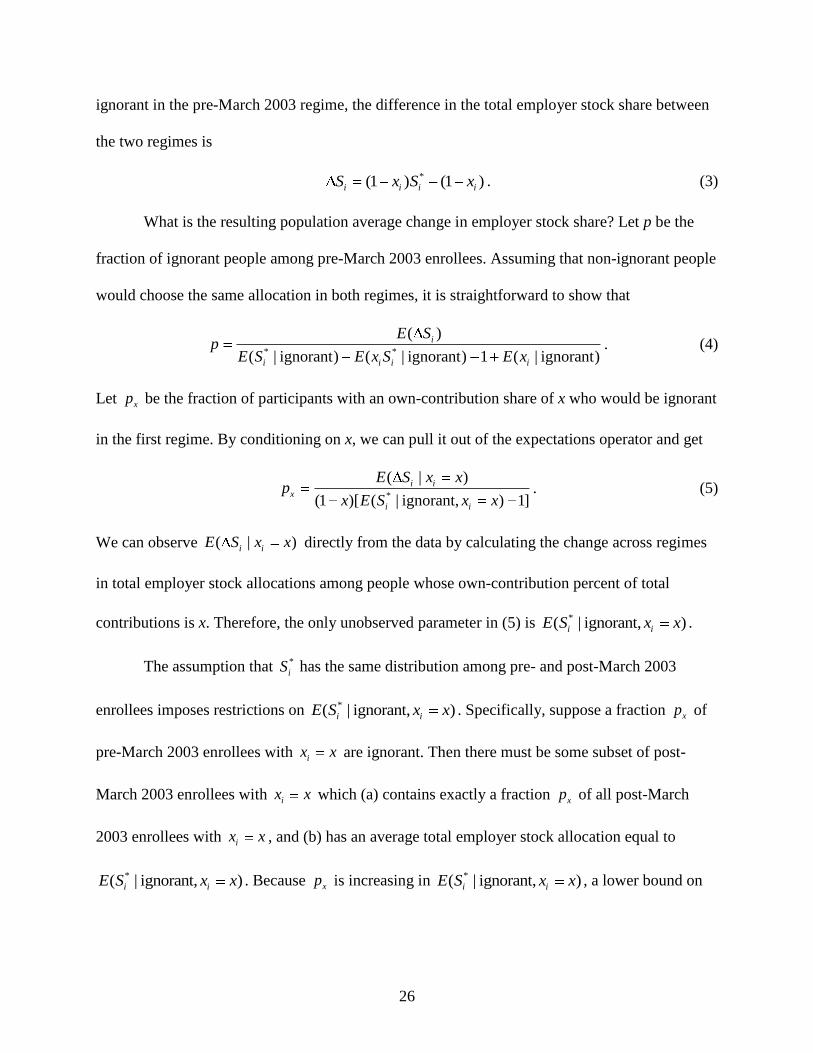
26
ignorant in the pre-March 2003 regime, the difference in the total employer stock share between
the two regimes is
*(1 ) (1 )i i i iS x S x . (3)
What is the resulting population average change in employer stock share? Let p be the
fraction of ignorant people among pre-March 2003 enrollees. Assuming that non-ignorant people
would choose the same allocation in both regimes, it is straightforward to show that
* *
( )
( | ignorant) ( | ignorant) 1 ( | ignorant)
i
i i i i
E Sp
E S E x S E x. (4)
Let xp be the fraction of participants with an own-contribution share of x who would be ignorant
in the first regime. By conditioning on x, we can pull it out of the expectations operator and get
*
( | )
(1 )[ ( | ignorant, ) 1]
i i
x
i i
E S x xp
x E S x x. (5)
We can observe ( | )i iE S x x directly from the data by calculating the change across regimes
in total employer stock allocations among people whose own-contribution percent of total
contributions is x. Therefore, the only unobserved parameter in (5) is *( | ignorant, )i iE S x x .
The assumption that *
iS has the same distribution among pre- and post-March 2003
enrollees imposes restrictions on *( | ignorant, )i iE S x x . Specifically, suppose a fraction xp of
pre-March 2003 enrollees with ix x are ignorant. Then there must be some subset of post-
March 2003 enrollees with ix x which (a) contains exactly a fraction xp of all post-March
2003 enrollees with ix x , and (b) has an average total employer stock allocation equal to
*( | ignorant, )i iE S x x . Because xp is increasing in *( | ignorant, )i iE S x x , a lower bound on
27
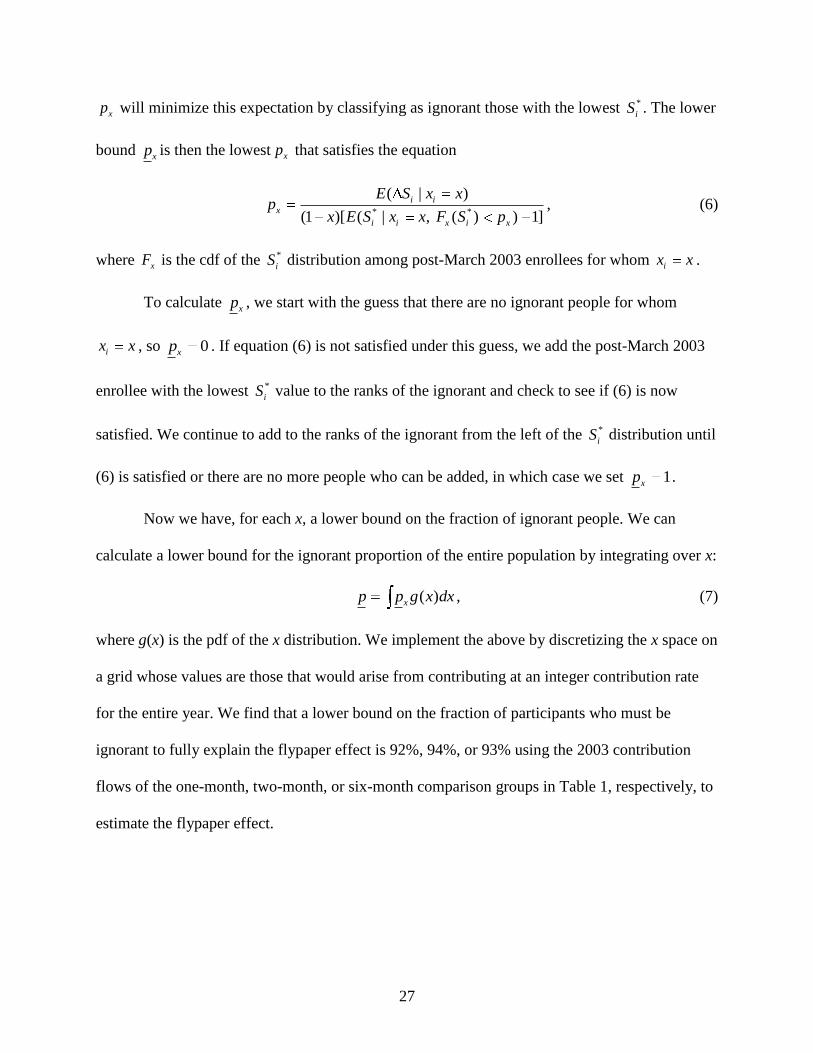
xp will minimize this expectation by classifying as ignorant those with the lowest *
iS . The lower
bound xp is then the lowest xp that satisfies the equation
* *
( | )
(1 )[ ( | , ( ) ) 1]
i i
x
i i x i x
E S x xp
x E S x x F S p, (6)
where xF is the cdf of the *
iS distribution among post-March 2003 enrollees for whom ix x .
To calculate xp , we start with the guess that there are no ignorant people for whom
ix x , so 0xp . If equation (6) is not satisfied under this guess, we add the post-March 2003
enrollee with the lowest *
iS value to the ranks of the ignorant and check to see if (6) is now
satisfied. We continue to add to the ranks of the ignorant from the left of the *
iS distribution until
(6) is satisfied or there are no more people who can be added, in which case we set 1xp .
Now we have, for each x, a lower bound on the fraction of ignorant people. We can
calculate a lower bound for the ignorant proportion of the entire population by integrating over x:
( )xp p g x dx , (7)
where g(x) is the pdf of the x distribution. We implement the above by discretizing the x space on
a grid whose values are those that would arise from contributing at an integer contribution rate
for the entire year. We find that a lower bound on the fraction of participants who must be
ignorant to fully explain the flypaper effect is 92%, 94%, or 93% using the 2003 contribution
flows of the one-month, two-month, or six-month comparison groups in Table 1, respectively, to
estimate the flypaper effect.

28
APPENDIX C. Additional Tables and Figures
APPENDIX TABLE C1—401(K) PLAN FEATURES
Eligibility
Eligible employees U.S. employees
First eligible to enroll in plan Before April 2003: 12 months after hire, minimum
1,000 hours of work at company
Starting in April 2003: 90 days after hire
First eligible to receive matching
contributions
12 months after hire, minimum 1,000 hours of work
at company
Enrollment default Not enrolled unless employee opts into plan
Contributions
Maximum employee contribution Before January 2002: 15% of salary
Starting January 2002: 50% of salary
Employer match 150% match on first 1% of pay contributed, plus
50% match on next 4% of pay contributed
Vesting
Employee contributions Immediate
Employer matching contributions 100% vested upon 3 years of service, 0% before
Other
Loans Available
Hardship withdrawals Available
Investment options Before January 2002: 6 options, including
employer stock
Starting January 2002: 8 options, including
employer stock
Source: Summary Plan Description and personal communication with plan administrator.
29
APPENDIX TABLE C2—CHARACTERISTICS OF MATCH-ELIGIBLE 401(K) PARTICIPANTS
BY PLAN ENROLLMENT DATE
Enrolled in
February
2003
Enrolled in
March
2003
Enrolled
September 2002 -
February 2003
Enrolled
March 2003 -
August 2003
Average age (years) 38.3 41.1 38.7 38.2
Fraction male 59.1% 62.0% 60.6% 61.3%
Average tenure (years) 2.7 2.4 3.0 2.3
Fraction married 33.3% 31.6% 33.2% 26.6%
Avg. annual income $27,393 $29,069 $28,835 $28,149
Median annual income $25,865 $26,000 $26,603 $25,584
Number of participants 1,015 2,234 6,911 10,753
Notes: The sample is match-eligible 401(k) plan participants who enrolled in the 401(k) in the
months specified and satisfy the other sample selection criteria discussed in the text. Income
reported is for calendar year 2004. All other variables are observed at year-end 2003.
Source: Authors’ calculations.
30
0%
10%
20%
30%
40%
50%
60%
0%
>0
to
<5
%
5 to
<1
0%
10
to
<1
5%
15
to
<2
0%
20
to
<2
5%
25
to
<3
0%
30
to
<3
5%
35
to
<4
0%
40
to
<4
5%
45
to
<5
0%
50
to
<5
5%
55
to
<6
0%
60
to
< 6
5%
65
to
<7
0%
70
to
<7
5%
75
to
<8
0%
80
to
<8
5%
85
to
<9
0%
90
to
<9
5%
95
to
<1
00
%
10
0%
Percent of contribution allocated to employer stock
Perc
en
t o
f en
roll
ees
Own contribution, Sep 2002-Feb 2003 enrollees
Total contribution, Mar 2003-Aug 2003 enrollees
APPENDIX FIGURE C1. HISTOGRAM OF THE FRACTION OF ANNUAL CONTRIBUTION FLOWS
ALLOCATED TO EMPLOYER STOCK DURING 2003
31
0%
1%
2%
3%
4%
5%
6%
7%
8%
9%
10%
0 6 12 18 24 30 36 42 48 54 60 66 72
Months Since 401(k) Enrollment (Measured at Year-End)
Fra
cti
on
of
Pa
rtic
ipa
nts
2002 2003 2004
APPENDIX FIGURE C2. FRACTION OF PARTICIPANTS WITH
A NET TRANSFER OUT OF EMPLOYER STOCK DURING 2002, 2003, AND 2004
Notes: To calculate net transfers for a participant, we subtract the dollar value of all his transfers
out of employer stock during the calendar year from the dollar value of all his transfers into
employer stock during the calendar year. If this number is negative, then the participant is
counted as having a net transfer out of employer stock during the year.
32
$0
$5,000
$10,000
$15,000
$20,000
$25,000
$30,000
$35,000
0 6 12 18 24 30 36 42 48 54 60 66 72
Months Since 401(k) Enrollment (Measured at Year-End)
Avera
ge V
alu
e o
f
Net
Tra
nsfe
rs O
ut
2002 2003 2004
APPENDIX FIGURE C3. AVERAGE VALUE OF NET TRANSFERS OUT OF EMPLOYER STOCK,
CONDITIONAL ON A NON-ZERO TRANSFER DURING 2002, 2003, AND 2004
Notes: To calculate net transfers for a participant, we subtract the dollar value of all his transfers
out of employer stock during the calendar year from the dollar value of all his transfers into
employer stock during the calendar year. Averages weight each participant equally.