Embed Size (px)
Citation preview

MENTORING IN THE PUBLIC AND NONPROFIT SECTORS
by
MARY KATHLEEN FEENEY
(Under the Direction of Barry Bozeman)
ABSTRACT
Despite the largess of mentoring literature, there is little research investigating mentoring
in the public and nonprofit sectors and even less research comparing mentoring in the two
sectors. Mentoring programs have become increasingly popular in both sectors, making it more
important to understand how mentoring affects career outcomes in each sector. This dissertation
investigates two research questions related to mentoring outcomes in the public and nonprofit
sectors. (1) Does mentoring affect protégé time spent at work and organizational involvement?
(2) How do protégé time spent at work and organizational involvement vary by sector? By
investigating these two research questions and focusing on protégé career outcomes and variation
in mentoring outcomes, by sector, this research addresses two significant limitations of the
current mentoring literature. First, this dissertation compares work behavior outcomes for
mentored and nonmentored individuals. Second, it tests for sectoral differences in mentoring
outcomes by first comparing a split sample of public and nonprofit sector employees and second,
using multilevel modeling to isolate the relationships between individual-level and group-level
factors that affect the career outcomes of mentoring.
The results indicate that having had a mentor has a significant affect on the amount of
time a protégé spends at work and the protégé’s organizational involvement. Second, the affect

of mentoring on time spent at work and organizational involvement significantly varies by
sector, producing larger effects for protégés in the nonprofit sector compared to public sector.
Third, the results of the multilevel models indicate that, for mentored respondents, a larger
proportion of the variance in time spent at work and organizational involvement is explained by
the group level factors of organization age, size, and sector than the individual level factors of
work motivation, job history, current job characteristics, mentorship type, and demographic
characteristics.
INDEX WORDS: Mentor, Mentoring, Public Sector, Nonprofit sector, Organizational Involvement,
Time at work

MENTORING IN THE PUBLIC AND NONPROFIT SECTORS
by
MARY KATHLEEN FEENEY
B.S., University of Wyoming, 2000
M.P.P., Rutgers University, 2004
A Dissertation Submitted to the Graduate Faculty of The University of Georgia in Partial
Fulfillment of the Requirements for the Degree
DOCTOR OF PHILOSOPHY
ATHENS, GEORGIA
2007

© 2007
Mary Kathleen Feeney
All Rights Reserved

MENTORING IN THE PUBLIC AND NONPROFIT SECTORS
by
MARY KATHLEEN FEENEY
Major Professor: Barry Bozeman
Committee: Keely Jones Hal G. Rainey Vicky Wilkins
Electronic Version Approved: Maureen Grasso Dean of the Graduate School The University of Georgia December 2007

iv
DEDICATION
To my mom

v
ACKNOWLEDGEMENTS
This dissertation would not have been possible without the generosity of Hal Rainey, Gordon Kingsley, Julia Melkers, and Barry Bozeman who provided financial support for NASP-III. Thanks to Branco Ponomariov who helped to design the NASP-III database, even when his own dissertation was calling. I am grateful to the faculty and staff at the UGA Department of Public Administration and Policy who welcomed me into their program and helped to ease my transition into Bulldog country. I am grateful to two colleagues at Georgia State University. Thanks to Kevin Fortner, master of MDM file creation and a top notch teacher and friend, and to Cathy Slade for her continual support and advice. I am also grateful to Cathy and Paul Hirsch, a Georgia Tech colleague, for their thoughtful input at my dissertation retreat. I would like to thank Monica Gaughan who taught a fabulous HLM course in the summer of 2006 at Georgia Tech. Monica also provided me with software, friendship, and, more importantly, clean sheets. And finally, I am forever indebted to my own mentor, Barry Bozeman, who has inspired me to spend more time at work and remain committed to academic research.

vi
TABLE OF CONTENTS
Page
ACKNOWLEDGEMENTS........................................................................................................ v
LIST OF TABLES .................................................................................................................. viii
LIST OF FIGURES.................................................................................................................... x
CHAPTER
1 INTRODUCTION .................................................................................................... 1
Public and Nonprofit Mentoring Research ............................................................ 4
Research Questions and Data................................................................................ 5
2 MENTORING OUTCOMES: GENERIC MODEL................................................... 9
Research and Theory on Mentoring Outcomes...................................................... 9
Hypotheses and Literature: Generic Mentoring ....................................................10
Data and Methods: Generic Mentoring ................................................................19
Findings: Generic Mentoring ...............................................................................35
3 MENTORING OUTCOMES, BY SECTOR ............................................................42
Sector Distinctions...............................................................................................45
Hypotheses and Literature: Sector Specific Mentoring.........................................52
Data and Models: Sector Specific Mentoring .......................................................60
Findings: Public and Nonprofit Sector Mentoring ................................................68
4 VARIATION IN MENTORING OUTCOMES, MULTILEVEL MODELS.............80
Multilevel Modeling: Sector Specific Mentoring..................................................80
vii
Data Description and Model Format ....................................................................84
5 RESULTS AND DISCUSSION.............................................................................101
Summary of Findings.........................................................................................101
Mentorship Outcomes........................................................................................105
Summary ...........................................................................................................107
REFERENCES........................................................................................................................110
APPENDICES ........................................................................................................................131
A Traditional Scales for Organizational Commitment and Job Involvement...............131
B Comparing Respondents Who Have Had a Mentor and Currently Mentored
Respondents ......................................................................................................133
C Endogeneity Tests for Having Had a Mentor..........................................................134
D Missing Variables Analysis....................................................................................136
E NASP-III Study Approach .....................................................................................137

viii
LIST OF TABLES
Page
Table 2.1: Correlations of Primary Independent and Dependent Variables.................................27
Table 2.2: Factor Analysis for Security and Career Advancement Motivation Items in
Generic Mentoring Model .........................................................................................29
Table 2.3: Comparison of Job Position, by Sector......................................................................31
Table 2.4: Variables in Generic Models.....................................................................................35
Table 2.5: Model Predicting Time Spent at Work among all Respondents ...............................36
Table 2.6: Model Predicting Organizational Involvement among all Respondents ...................39
Table 3.1: “Mentor(ing)” Term Search Results and Journal Impact Factors .......................................43
Table 3.2: Comparison of Mentorship Type, by Sector ..............................................................63
Table 3.3: Comparing Female Mentors, by Sector and Protégé Gender......................................65
Table 3.4: Correlation: Mentorship Controls and Dependent Variables......................................65
Table 3.5: Factor Analysis for Security and Career Advancement Motivation Items in
Nonprofit Sector Sample ...........................................................................................66
Table 3.6: Factor Analysis for Security and Career Advancement Motivation Items in
Public Sector Sample.................................................................................................66
Table 3.7: Variables in Mentoring Models.................................................................................68
Table 3.8: Time Spent at Work for all Mentored Respondents ...................................................69
Table 3.9: Comparing Results for Protégé Time Spent at Work, by Sector.................................71
Table 3.10: Security Motivation Items, by Sector ......................................................................73

ix
Table 3.11: Comparing Results for Organizational Involvement, by Sector ...............................76
Table 4.1: Time Spent at Work Null Model ...............................................................................89
Table 4.2: Final Estimation of Fixed Effects Time Spent at Work Full Model ...........................90
Table 4.3: Significant Predictors of Time Spent at Work OLS Compared to HLM.....................92
Table 4.4: Organizational Involvement Null Model ...................................................................94
Table 4.5: Final Estimation of Fixed Effects Organizational Involvement Full Model................95
Table 4.6: Significant Predictors of Organizational Involvement: OLS and HLM......................97
Table 4.7: Summary: HLM Results Predicting Work Behavior Mentoring Outcomes ..............100

x
LIST OF FIGURES
Page
Figure 1: Generic Concept of Mentoring Outcomes...................................................................19
Figure 2: Sector Specific Concept of Mentoring Outcomes........................................................60
Figure 3: Multilevel Mentoring Concept of Mentoring Outcomes..............................................83

1
CHAPTER 1
INTRODUCTION
Mentoring is a relationship where a more experienced, skilled, or knowledgeable
person (the mentor) provides a junior person (the protégé) with intense support including
career and personal advice, modeling about career development behaviors, and personal
psychosocial support such as friendship and emotional support in order to improve work
skills, enhance understanding of the organization, expand networks, and provide support
and advice to get ahead in the job or profession (Clawson & Kram 1984; Eby 1997; Eby
et al. 2004; Hunt & Michael 1983; Kram 1980; 1983; 1985; Ragins 1997). In a
mentorship, both the protégé and the mentor can contribute to and benefit from the
relationship. Mentoring has long been of interest to scholars and considered an important
human resource tool in organizations. Having a mentor has been associated with
increased salary, promotion, and performance of protégés, accelerated learning, an
expansion of skills and knowledge, strengthened social and professional networks and
collaborations, and increased organizational flexibility, transfer of knowledge, and
organizational loyalty and commitment. In response to these findings, many
organizations of all types have sought to promote mentoring among employees. Indeed,
mentoring programs abound.
Government agencies, at all levels, and many nonprofit organizations have
adopted mentoring programs. These programs range from encouraging mentorships to
intentionally matching protégés and mentors based on similar interests and professional
goals. For example, since 2002, the Academy for Education Development, a large
nonprofit dedicated to social change, has been implementing a mentoring program based

2
on formal mentor and protégé matching (Williams 2005). The Coro Fellows Program in
Public Affairs and the Frances Hesselbein Community Innovation Fellows Program,
include formal mentorships as a component of their nonprofit leadership development
programs. In 1990, the U.S. Coast Guard established a mentoring program which
promotes diversity by using a computer program to assign mentors and protégés who
differ from one another by race and ethnic origin among other factors. The National
Institutes of Health (NIH) promote mentoring of junior employees through four programs
and contracted the consulting firm Total Learning Solutions to design a formal mentoring
program to help employees in positions below GS-8 advance in government, not
necessarily the NIH (Garnett 2003). Meanwhile, the federal Departments of
Transportation and Energy publish mentoring guides. These are just a few examples that
mentoring is a ubiquitous concern which can be found in many public and nonprofit
organizations.
Mentoring has become an increasingly important tool to attract a new generation
of talent and mid-career experienced personnel to the government workforce (Partnership
2005a) and the nonprofit sector workforce (Halpern 2006). Nonprofit organizations have
encouraged mentoring programs to increase the retention of talent (Stannard-Friel 2007)
and develop new leaders within the sector and encourage individuals to transition into
executive leadership positions (Halpern 2006, 5). Government mentoring programs are
credited with attracting new talent to the public sector, enabling agencies to identify
talented potential hires, reducing job turnover, increasing productivity and satisfaction,
and furthering professional development and knowledge transfer (NIST 2002; GAO
2005b). Mentoring is also believed to increase morale among mentors and protégés (DOT

3
2006); further agency missions, values, programs, and goals (NIST 2002; DHHS 2005;
DOT 2006); enhance protégé exposure to organizational culture and acculturation into
public service; and develop protégé understanding of public sector career opportunities
(DHHS 2005). Government agencies use mentoring as a means of promoting diversity
(GAO 2005a, 21). For example, the Oklahoma Office of Personnel Management offers a
mentoring program to develop the skills of women, racial minorities, and individuals with
disabilities, while the Department of Energy reports that about 60% of the participants in
its mentoring program are women (OPM 1998, 15).
Despite increasing research on the possible dark sides of mentoring and
dysfunctional mentorships (Eby & Allen 2002; Eby et al. 2000; Feldman 1999; Scandura
1998; Simon & Eby 2003), many organizations pursue mentoring as a fully positive
human resource tool. Government agencies have adopted mentoring as a method for
training and retaining talent and increasing representative bureaucracy (GAO 2005b;
OPM 1998; Partnership 2005a). Nonprofit organizations have adopted mentoring
programs to develop volunteers and managers (Hartenian 2007); transfer knowledge from
founder-executives to the next generation of managers; retain diverse and creative talent
dedicated to nonprofit missions; and further staff development to expand organizational
capacity (Williams 2005, 3). Unfortunately, nonprofit and government organizations have
developed mentoring programs and encouraged mentoring among their employees with
little to no understanding of how mentorships may be distinct in government and
nonprofit organizations. This research seeks to expand our understanding of mentoring in
the public and nonprofit sectors.

4
Public and Nonprofit Mentoring Research
Although there are over 30 years of mentoring research, including dissertations,
research articles, books, training manuals, and normative accounts about mentoring, there
is little academic research focusing on mentoring in the public and nonprofit sectors. For
example, a search of the terms “mentor” and “mentoring” in major public administration,
public management, and nonprofit management journals between 1995 and 2005 turned
up a paltry number of mentoring research articles compared to the number of mentoring
research articles in generic management, business, and human resources journals.
For example, I searched for mentoring studies in major nonprofit journals. I
focused this search on the three most prominent general purpose journals in the field of
nonprofit sector studies: Nonprofit and Voluntary Sector Quarterly, Nonprofit
Management and Leadership, and Voluntas – International Journal of Voluntary and
Nonprofit Organizations (Brudney & Herman 2004). A search for the terms “mentor” and
“mentoring” in these journals resulted in two mentoring research articles. The terms
mentor and mentoring do not appear in any articles in Nonprofit and Voluntary Sector
Quarterly nor in Voluntas. The terms appear in two articles in Nonprofit Management
and Leadership. The first article finds that alumni donors are more likely to have had a
mentor in college, compared to alumni who do not donate (Clotfelter 2001). The second
article finds that role playing and mentoring is an effective human resource strategy for
training direct (point-of-service) volunteers (Hartenian 2007).
I then searched for mentoring research articles in four top public administration
journals: Journal of Public Administration Research & Theory, Public Administration
Review (PAR), Public Administration, and American Review of Public Administration,

5
which were selected due to their 2005 journal impact factors1 (Thomson Scientific 2005).
Between 1995 and 2005, there were a total of six articles in these public administration
journals which have the terms mentor or mentoring in the text. However, two of those
articles (Slack et al. 1996 and Schroeder et al. 2004) which appear in PAR were
concerned with mentoring public administration scholars and not mentoring government
employees or managers in the public sector, leaving a total of four mentoring research
articles published between 1995 and 2005 which investigate mentoring in the public
sector (Crewson & Fisher 1997; Kelly 1998; Fox & Schuhmann 2001; Hale 1995). The
limited amount of mentoring research focusing on the public and nonprofit sectors is
striking compared to the number of research articles in generic business, management,
and human resources journals.
Research Questions and Data
Mentor programs in the public and nonprofit sectors abound, while the academic
research on mentoring in these two sectors, does not. In addition to contributing to the
mentoring research focusing on the public and nonprofit sectors, this research
investigates how mentoring is related to work behavior. In general, empirical mentoring
research focuses on (1) career outcomes such as increases in salary (Scandura 1992; Ng
et al. 2005), job mobility (Scandura 1992), turnover (Scandura & Viator 1994), and
promotion and career progress (Bozionelos 2004; Fagenson 1989; Allen et al. 2004); (2)
perceptual outcomes such as satisfaction with the mentorship (Eby et al. 2000; Ragins et
1 According to Thomson Scientific the journals had the following journal impact scores in 2005: Journal of Public Administration Research & Theory (Impact Factor 1.451, 2005 Total Cites 416; 2005 Articles 28); Public Administration Review (PAR) (Impact Factor 1.099, 2005 Total Cites 1197; 2005 Articles 56); Public Administration (Impact Factor 0.924, 2005 Total Cites 580; 2005 Articles 43);, and American Review of Public Administration (Impact Factor 0.615, 2005 Total Cites 120; 2005 Articles 23).

6
al. 2000), and career satisfaction (Aryee & Chay 1994; Chao 1997; Heimann & Pittenger
1996) and the expansion of professional networks (Friedkin 1978); and (3) the
composition and characteristics of mentorships, including investigations of the gender or
racial match in mentorships (Baugh et al. 1996; Burke et al. 1990; Clawson & Kram
1984; Kelly et al. 1991; Thomas 1990), the formal or informal matching of mentors and
protégés (Chao et al. 1992; ), and whether or not the mentor is the protégé’s supervisor
(Burke et al. 1991; Scandura & Schriescheim 1994; Tepper 1995). To a lesser extent,
mentoring research investigates how engaging in mentoring relationships alters work
behavior. For example, Aryee and Chay (1994) researched how mentoring affects work
commitment and Tepper (1995) investigated how having a mentor serves as a
socialization tool to enhance a protégé’s ability to communicate with superiors.
This study is concerned with increasing our understanding of the affects of
mentoring on work behavior, while accounting for career and perceptual factors and
controlling for mentorship characteristics. I utilize two dependent variables to measure
work behavior: time spent at work and organizational involvement. These work behavior
outcome measures are important because they indicate a change in behavior which is
important to both public and nonprofit organizations. An individual’s organizational
involvement can have long term affects on the organization and sector through
participation, socialization, and possible relationships to job turnover and tenure.
Likewise, time spent at work, whether interpreted as a positive or negative work behavior
the individual, greatly affects the ability of organization’s to achieve their missions and
helps to define the expectations of colleagues, subordinates, and superiors and work life
in the sector. Finally, these two outcomes measures are important because they are not
7
typical reasons for why a person would enter into a mentorship. Most protégés and
mentors would not engage in mentorships in order to affect time spent at work or
organizational involvement, but these two outcomes could provide significant affects on
an organization’s daily operations, quality of work life, and ability to attract and retain
employees. Because public and nonprofit organizations have adopted mentoring
programs with the intention of increasing attraction and retention to their respective
organizations and sectors, it is important to empirically measure if having a mentor
affects organizational involvement and time spent at work and how these relationships
may or may not vary by sector.
This research seeks to investigate whether or not mentoring affects protégé time
spent at work and organizational involvement and how those affects vary by sector, using
traditional ordinary least squares (OLS) regression to compare mentored individuals to
nonmentored individuals and then to compare mentored individuals in the public sector
with those in the nonprofit sector. This research also uses multilevel modeling techniques
to investigate the variance in mentoring outcomes, by sector. The multilevel models
illustrate sector distinctions in mentoring by allocating variance in time spent at work and
organizational involvement to individual and group level factors. By investigating these
two research questions with OLS and multilevel models this research will expand our
understanding of tangible work behavior outcomes of mentoring and more important, this
research will demonstrate how work behavior outcomes vary due to individual and sector
factors. This research brings together the mentoring and sector distinction literatures to
better understand how mentoring, an important human resource tool, shapes work

8
behavior which may be an antecedent to retention for both public and nonprofit
organizations and sector.
The hypotheses are tested with variables developed from the NASP-III
questionnaire which investigates work perceptions, job history, and mentoring among
public and nonprofit managers in Georgia and Illinois. The NASP-III survey was
administered to a sample of public and nonprofit managers in Georgia and Illinois from
multiple agency and department functions. The NASP-III survey was closed in January
2006 with 1220 responses and a response rate of 39% percent. More than half of the
respondents report having had a mentor.
This study addresses the primary research questions (1) how does mentoring
affect protégé time spent at work and organizational involvement and (2) how does time
spent at work and organizational involvement vary by sector, in the following format. In
Chapter Two, I present a set of generic hypotheses and a model about the role of
mentoring in shaping protégé outcomes. I then present the public management and
nonprofit management literatures which lead me to expect that mentoring outcomes will
vary by sector. In Chapter Three, I present a set of sector specific mentoring hypotheses
and a sector specific model of mentoring within the context of the relevant literature.
Chapter Four presents the sector specific models using multilevel modeling techniques in
order to determine what proportion of the relationships between mentoring and mentoring
outcomes are related to individual and group (sector) factors. I conclude with a summary
of findings and a discussion of future sector based mentoring research in Chapter Five.

9
CHAPTER 2
MENTORING OUTCOMES: GENERIC MODEL
Research and Theory on Mentoring Outcomes
Although researchers have long been interested in mentoring (Cameron 1978;
Collins 1978; Levinson et al. 1978; Clawson 1979; Roche 1979), the popularity of
modern mentoring research can be attributed to Kathy Kram (1980; 1985). Kram defined
mentoring as an intense relationship whereby a senior or more experienced person (the
mentor) provides two functions for a junior person (the protégé), one function being
advice or modeling about career development behaviors and the second function being
personal psychosocial support such as friendship and emotional support.
Researchers have continued to work with and extend Kram’s definition. Eby
(1997: 126) defined mentoring as “an intense developmental relationship whereby
advice, counseling, and developmental opportunities are provided to a protégé by a
mentor, which, in turn, shapes the protégé’s career experiences.” Many researchers (Chao
1997; Ragins 1997b) use close variants of this definition or have distinguished among
types of mentoring such as “primary mentoring” and “secondary mentoring” (i.e. less
intense and shorter duration) (Whitely, Dougherty, & Dreher 1991). Other researchers
have proposed alternative forms of mentoring such as peer and group mentoring
(Bozionelos 2004; Eby 1997; Dansky 1996), lateral mentoring among individuals who
are at comparable organizational levels in regard to pay, status, and authority (Eby 1997),
and diversified mentoring, relationships where individuals of different racial, ethnic, or
gender groups engage in mentoring (Ragins, 1997a, 1997b). The wide array of mentoring
definitions and type found in the literature requires the specification of this important

10
term. Drawing from previous mentoring research, for the purposes of this study, I use the
following definition:
Mentoring is a developmental relationship between two colleagues where one person has more experience or authority than the other. Mentoring may include helping another person with improving work skills, understanding the organization, providing information about “getting ahead” in the job or profession, and giving personal or emotional support.
Using the above definition, in the next section with the support of the relevant
academic literature on career outcomes and mentoring, I propose hypotheses related to
mentoring and the following protégé career outcomes: time spent working and
organizational involvement.2
Hypotheses and Literature: Generic Mentoring
Time Spent at Work
There are various factors, both positive and negative, which may drive an
individual to work longer or shorter hours. First, an employee may feel pressure from
colleagues to work after 5 pm or she may believe that her ability to get a promotion rests
on the perception that she is dedicated to her work and willing to put in extra time in the
office. Second, an individual may work long hours over the weekend because he is
overloaded with tasks which must be completed before a particular date. A third
employee may work extended hours because it takes him a longer number of hours to
complete tasks that others do in a shorter time period. Likewise, there are numerous
reasons why an individual may spend less time at work. An employee may leave work
2 This definition implies that the mentorship is an inherently positive experience. While there is research investigating the negative outcomes of mentoring, this definition asks individuals if they have had mentorships which result in “improving work skills, understanding the organization, providing information about “getting ahead” in the job or profession, and giving personal or emotional support.” This definition

11
early each day to fulfill family commitments. A second employee may be an efficient
worker who is able to complete tasks ahead of schedule and rewards herself by leaving
work early. It is intuitive that the decision to work extended hours or less than average
hours is related to personality, individual commitments, career expectations, and personal
choice.
Just as there are many reasons why an individual may spend more or less time at
work, there are a variety of outcomes which can emerge from the number of hours an
individual works. These outcomes could be positive or negative for the individual, the
organization, or both. Spending less time at work may be an indication of healthy life-
work balance. It is possible that individuals who spend an excessive amount of time at
work do so at the expense of leisure and family, thus penalizing their loved ones in favor
of the workplace. On the other hand, working longer hours could be an indication of
strong commitment to the organization, its mission, and one’s colleagues.
The literature investigating the number of hours individuals dedicate to work
identifies both positive and negative outcomes from working longer than average hours.
Researchers typically investigate the number of hours worked through the lens of
workaholism or overworking. Workaholics, a term first coined by Oates (1971), are
defined as individuals who are driven by an inner motivation, or over-commitment, to
work (Seybold & Salomon 1994; Spence & Robbins 1992). Researchers (Machlowitz
1980; Snir & Zohar 2002) describe workaholism as an approach or attitude to work,
characterized by the steady allocation of time and thoughts to work-related activity,
rather than hours worked alone. Although Oates characterized workaholism as a negative
precludes negative mentoring, since a relationship which results in negative outcomes and career sabotage would not qualify as a mentorship.

12
behavior which could be detrimental to an individual’s health, relationships, and
happiness, more recent research (Machlowitz 1980; Scott et al. 1997) argues that
overworking, defined as extra hours on the job, can be related to both positive and
negative outcomes such as increased performance, job satisfaction, turnover, and
personal satisfaction.
Overworking generally includes working more than 40 hours a week, sometimes
in order to do the work of others. However, Mosier (1983) defined overworking as
working more than 50 hour a week, while Grosch and colleagues (2006) developed
categories of over-working ranging from lower overtime (41-48 hours) to higher
overtime (70+ hr/week). Overtime work is related to increased job stress and increased
participation in work-related decision making (Grosch et al. 2006). The research on
overworking (Fassel 1990; Garfield 1987; Kiechel 1989a; Killinger 1991; Klaft &
Leriner 1988; Machlowitz 1980; Spruel 1987; Weddell 1993) has found that the number
of hours worked affects health (Grosch et al. 2006), occupational health (Jeffrey &
Lipscomb 2006), leisure time, daily moods, alcohol consumption (Jones et al. 2006), and
family relationships (Robinson 2001). Research also shows that overworking is related to
individual demographics, personal beliefs and fears, work situation characteristics, and
perceptions of organizational support of work-personal life imbalance (Burke 2001). For
example, overtime workers compared to full-time workers are more likely to be white,
male, and middle-aged, with higher levels of education (Grosch et al. 2006).
Even though research indicates that increases in hours worked results in lower
time and energy given to families (Blair-Loy & Jacobs 2003) and affects men and women
in different ways (Harpaz & Snir 2003), work hours alone do not necessarily indicate

13
negative or positive outcomes for workers (Bonebright et al. 2000). Excessive work
behavior can result in positive outcomes such as personal happiness (Machlowitz 1978;
1980, Peiperl & Jones 2001). Furthermore overtime work is associated with increased
levels of participation in decision making and opportunities to develop special abilities in
the work place (Friedman & Lobel 2003). In addition, individuals who happily overwork
can serve as role models for balancing work and personal life and help to develop
committed people in the organization and encourage employees to realize the company’s
goals (Friedman & Lobel 2003).
This research is concerned with investigating the time spent at work as a
behavioral outcome of mentoring relationships, regardless of whether or not working
longer hours is a positive or negative outcome for the individual, the organization, or
both. As an analogy, consider a research project which investigates how organization size
and structure affect profits, management techniques, processing systems, and other
outcomes. One can accept that organization size and structure have important effects
without necessarily encouraging organizations to be larger or to be more or less
hierarchical. To develop those types of recommendations, one would require a
contingency theory of organization size and structure. Returning to the importance of
understanding the relationship between mentoring and time spent at work, before
developing a contingency theory of time spent at work, it is critical to first understand
aspects, causalities, and various factors related to time spent at work – such as mentoring.
To date there is no mentoring research investigating the relationship between
having had a mentor and time spent at work. Previous mentoring research has focused on
outcomes such as managerial career aspirations and expectations (Baugh et al. 1996;

14
Godshalk & Sosik 2003; Scandura 1997); job and career satisfaction (Baugh et al. 1996;
Chao 1997; Chao et al. 1992; Eby et al. 2000; Eby & Allen 2002; Scandura 1997;
Scandura & Viator 1994; Whitely & Coetsier 1993); advancement and performance (Eby
et al. 2000; Scandura & Viator 1994); organizational socialization and commitment
(Baugh et al. 1996; Chao 1997; Chao et al. 1992; Scandura, 1997); salary (Chao 1997;
Chao et al. 1992; Scandura & Viator 1994); and workplace stress and depressed moods
(Eby & Allen 2002; Eby et al. 2000). Mentoring studies (Eby & Allen 2002; Scandura
1998) have also found that having a mentor is associated with reduced absenteeism and
turnover.
Since mentoring is related to increased organizational commitment and reduced
absenteeism, it follows that having a mentor may be related to the amount of time the
protégé spends at work each week. The reasoning here is that having a mentor results in
increased organizational commitment for the protégé which in turn enhances the
protégé’s desire to work hard to achieve the organization’s goals. Moreover, the personal
relationship between the mentor and protégé may increase the protégé’s desire to meet
the expectations of the mentor, which most likely include working hard and when
necessary, working longer hours. In essence, mentors act as a personal reason to spend
time at work, as a protégé does not want to let down the mentor. I predict that
respondents who have had a mentor will report spending more time at work, compared to
those without a mentor.
H1: Having had a mentor will positively affect the amount of time an individual spends at work.

15
Organizational Involvement
Mentoring research has identified numerous ways in which organizations benefit
from successful mentoring. Research also indicates that mentoring can benefit
organizations by developing managerial skills among junior members (Ragins &
Scandura 1994) including increasing interpersonal skills, productivity, and networks
among employees (Willbur 1987). Mentoring can include the transmission of tacit
knowledge and encourages the growth of social and emotional support in the workplace
by furthering a sense of community and shared experience among mentors and protégés
(Busch 1985; Olian et al. 1993; Ragins & Scandura 1994; 1999) and creating an
organization-wide mentoring culture (Bozionelos 2004; Ragins & Scandura 1999).
Mentoring can serve as a support network within organizations by furthering a sense of
community and shared experience among mentors and protégés. Managers who are both
mentors and protégés report that mentoring is an investment in the development of future
managers within the organization and a useful tool for transferring knowledge and
networking within the organization (Singh et al. 2002). In summary, effective mentoring
can simultaneously produce positive outcomes for individuals and organizations.
Involvement in the organization is an important measure of work effort and
dedication and commitment to the organization. For example, an employee that puts forth
her best effort to get the job done, regardless of the difficulties, and another employee
that does extra work for his job that is not really expected of him, both contribute to the
organization through not only their work, but through their dedication and commitment.
Because a great deal of mentoring research focuses on self-reported satisfaction with the
mentorship, there remains a need for research on non-perceptual mentoring outcomes, in

16
particular outcomes for the organization such as research investigating the impact of
mentoring on career advancement and organizational citizenship (Green & Bauer 1995;
Russell & Adams 1997). The research proposed here begins to fill this gap in the
mentoring literature by investigating organizational involvement as an outcome of
mentoring relationships.
Previous public administration research investigating organizational commitment
and involvement has produced mixed and inconclusive results (Balfour & Wechsler
1990; 1991; 1996; Hoy & Sousa 1984; Kline & Peters 1991; White 1995). These mixed
results are most likely related to the a variety of definitions of the terms “public” and
“private” and variations in scales used to operationalize organizational commitment and
involvement. While organizational commitment and involvement have been measured in
a great many ways (Balfour & Wechsler 1990; 1996; Mowday et al. 1979; Steinhaus &
Perry 1996; White 1995) and often with overlapping meanings, my own measure of
organizational involvement draws items from the scales developed by Lodahl & Kejnar
(1965), Mowday and colleagues (1979), and Balfour and Wechsler (1996).
The measure of organizational involvement used here is built from fewer items
than traditional measures of job involvement (Lodahl & Kejnar 1965; Brown 1969;
Brown 1996; Blau & Boal 1987; 1989) and organizational commitment (Blau & Boal
1987; 1989; Penley & Gould 1988; Thornton 1970; Romzek & Hendricks 1982). Job
involvement is typically measured by asking respondents various items about the
importance of work as a source of personal satisfaction, the level of personal involvement
at work, and the importance of work in the individual’s life. For example, Lodahl and
Kejnar (1965) use 20 items to develop their scale of job involvement (See Appendix A).

17
Organizational commitment, on the other hand, has both instrumental and affective
elements and is typically measured by asking respondents about the individual’s
dedication to the organization and feelings of personal responsibility for the
organization’s success. Organizational commitment scales typically contain multiple
items, for example both Penley & Gould (1988) and Mowday and colleagues (1979)
developed 15 item scales. Meanwhile, Balfour and Wechsler (1996) developed a
typology of organizational commitment and found that government employees exhibit
different types of organizational commitment, including (1) exchange commitment; (2)
affiliation commitment; (3) identification commitment; (4) direct service to the
public/customer; (5) political interference; and (6) participation in decision-making.
Given this variation in organizational commitment and job involvement scales, this
research draws from a few select items to capture organizational involvement.
The NASP-III questionnaire asked respondents to respond to a series of items
similar, but not identical to Lodahl and Kejnar’s job involvement scale and Mowday and
colleagues’ and Balfour and Wechsler’s organizational commitment scale. The
organizational involvement scale used in this research is built from a series of items
related to the individual’s involvement at work and views of the organization, thus
capturing both job and organizational involvement. Organizational involvement is
distinct because it accounts for commitment to and pride in the organization and its
mission. Research (Brown 1969) indicates that an individual identifies with an
organization when she perceives that the organization provides opportunities for personal
achievement and when individual workers have power within the organization. In this
research, organizational involvement, aims to capture this mixture of personal

18
achievement and job involvement and a desire to advance the organization, which is most
likely tied to the types of personal relationships within the organization that typically
develop through mentoring.
Understanding the relationship between mentoring and organizational
involvement is important because organizational involvement can affect turnover and
absenteeism in organizations (Blau & Boal 1987; 1989; Huselid & Day 1991). If
mentoring plays a role in increasing individual protégés’ organizational involvement, it
follows that mentoring can result in positive outcomes for organizations such as reduced
absenteeism and turnover. Furthermore, organizational involvement can also affect
organizational performance since increased strategic involvement among middle
managers is positively associated with organizational performance (Wooldridge & Floyd
1990). Given previous findings from mentoring research linking mentoring to
organizational commitment (Chao 1997; Chao et al. 1992; Scandura 1997), I predict that
respondents who have had a mentor will report higher organizational involvement than
nonmentored respondents.
H2: Having had a mentor will positively affect individual organizational involvement.
Figure 1 illustrates the investigation of mentoring outcomes among all NASP-III
respondents, showing that those who have had a mentor will report increased outcomes
compared to those without a mentor.

19
Figure 1: Generic Concept of Mentoring Outcomes
The individual employees, at the left side of the diagram, and the individuals’
demographic characteristics such as race, gender, and age influence the outcomes of time
spent at work and organizational involvement. Mentoring theory and research lead me to
expect that outcomes will vary for those employees who have had a mentor. More
specifically, the diagram illustrates the hypotheses that having had a mentor, compared to
not having had a mentor, will result in increased organizational involvement and time
spent at work.
Data and Methods: Generic Mentoring
The generic mentoring hypotheses (H1 and H2) are operationalized with variables
developed from the NASP-III questionnaire, a survey of 1849 public managers and 1307
nonprofit managers in Georgia and Illinois from organizations of numerous functions.
The predecessors to NASP-III focused on work perceptions and sector differences
between state managers and between public and private managers. In 1992, NASP-I
compared state managers in New York, Colorado, and Florida. In 2003, NASP-II
expanded to include managers in 50 states but focused on state health policy and was
Time Spent
at Work
Organizational Involvement
Employee
Mentored Employee
controls
+
+
controls

20
limited to managers in state departments of health and human services. This newest
version, NASP-III, closed in January 2006, continues to expand our empirical knowledge
of public management.
The NASP-III survey was administered to a sample of public and nonprofit
managers in Georgia and Illinois from multiple agency and department functions. These
two states were selected because both Georgia and Illinois are strong representatives of
the U.S. at large. According to the Associated Press, which ranked Census data from each
state and the District of Columbia on how closely it matched the national averages on 21
factors such as age, race, education, income, industrial mix, immigration, and proportion
of people living in urban and rural areas, Illinois ranked first as the most representative of
the nation and Georgia ranked sixth. Illinois and Georgia are similar in industrial mix,
education levels, and migration (National Public Radio 2007) and both states are
generally representative of the U.S. population. However, although Georgia and Illinois
both have large urban and rural communities and are similar in geographic area (Illinois
is 55,583 square miles and Georgia is 57,906 square miles), they have strikingly different
cultural, political, and bureaucratic environments. Nationwide, Georgia is one of the
leading states for government human resources reform including the dissolution of civil
service and the expansion of at-will-employment, while Illinois has a history of strong
unions and centralized human resource management.
Georgia and Illinois, though largely representative of the nation on demographic
characteristics, are distinct in their representation of nonprofit organizations. According
to the Urban Institute’s National Center for Charitable Statistics (2007) summary of
nonprofit organizations in the states, Illinois is a popular location for nonprofit

21
organizations. For example, in 2006, there were 59,807 nonprofit organizations in
Illinois, compared to only 33,017 in Georgia. In a ranking of the number of nonprofits, by
state, Illinois ranks sixth in the nation and Georgia number fourteen. Nonprofits in
Illinois report a total revenue of about 71 billion, a little more than twice as high as
Georgia. Illinois ranks third in total nonprofit assets compared to Georgia which ranks
seventeenth out of all 50 states and the District of Columbia. Compared to the overall
distribution of nonprofit organizations in the U.S., Illinois is home to 4.4% and Georgia is
home to 2.4% of all nonprofit organizations in the U.S. (National Center for Charitable
Statistics 2007).
Although Illinois is the home to more nonprofit organizations than Georgia, the
distribution of nonprofit organizational types in Georgia is more representative of the
national numbers on nonprofit organizations. For example, nationwide 23.5% of public
charities registered with the Internal Revenue Service (IRS) are reporting public charities,
20% are operating public charities, and 3.5% are supporting public charities, compared to
23.4%, 20.2%, and 3.2% in Georgia, respectively. Looking at other 501(c) nonprofit
organizations nationwide, the most common type is civic leagues (7.9%) followed by
fraternal beneficiary societies; business leagues; labor, agricultural, and horticultural
organizations; social and recreational clubs; post or organization of war veterans; and
other nonprofits. The order of 501(c) nonprofit organization types in Georgia is the same
as the national rankings, however, in Illinois the most common nonprofit type is fraternal
beneficiary societies (9.9%) followed by business leagues (7.1%) and civic leagues and
social welfare organizations (6.6%). The distribution of public charities, private
foundations, and other nonprofits in Georgia and Illinois are also distinct from one

22
another. A lower percent of nonprofits in Illinois are public charities (53.9%) compared
to the percent of public charities in Georgia (66.7%) and the US (61.2%). Meanwhile
8.3% of Illinois nonprofit organizations are private foundations, compared to 7.1% in
Georgia and 7.4% in the US (National Center for Charitable Statistics 2007). Although
Georgia and Illinois are closely matched to the national averages on 21 demographic
factors (National Public Radio 2007) they remain distinct in the concentration and type of
nonprofit organizations within their borders. The similarities of these two states and their
relative representativeness of the US population in conjunction with their distinctiveness
in state government and nonprofit organizations make them useful cases for comparing
public sector and nonprofit sector managers.
The NASP-III survey of 1849 public managers and 1307 nonprofit managers in
Georgia and Illinois was closed in January 2006 with 1220 respondents (790 public
sector; 430 nonprofit sector). The overall response rate was 39% percent (43% response
rate for the public sector sample and 33% from the nonprofit sector sample). Six hundred
and eighty-one of the respondents work in Illinois and 790, or 65%, of the respondents
work in the public sector. Fifty-five percent of the public sector respondents and one
quarter of the respondents from the nonprofit sector work in Georgia. Details about the
study approach and relevant procedures can be found in Appendix E.
Dependent Variables: Generic Mentoring
The first dependent variable, Time at Work, is the self-reported number of hours
worked during a typical work week (including work done away from the office but as
part of the job). This variable ranges from 20 to 90 for all respondents, with a mean of 47

23
and a mode of 50 hours.3 Although it is possible that respondents exaggerate the number
of hours spent at work each week, this is a common self-reported measure in social
science research (Peiperl & Jones 2001). Numerous studies assess self-reported work
hours instructing respondents to report the number of hours worked each week (Burke
1999a; 1999b; Bonebright et al. 2000), the number of hours normally worked in a week
including overtime and excluding travel time (van Echtelt et al. 2006, 498), or the
number of hours worked in the previous week. For example, Grosh and colleagues (2006)
asked respondents to indicate ‘‘How many hours did you work last week, at all jobs?’’
(944). Furthermore, national and international studies of time spent at work regularly rely
on self-reported data. For example, the Organisation for Economic Co-operation and
Development (OECD) relies on self-reported data to measure changes in per capita work
hours across nations (OECD 1998; 2004), the Australian Survey of Social Attitudes 2003
provides self-reported data on respondents’ usual number of hours worked (van Echtelt et
al. 2006), and the U.S. Census Bureau collects self-reported data on time spent at work.
Although it remains possible that there are reporting biases associated with these self-
reported data, it is unlikely that individuals will be highly motivated to misrepresent
hours worked on a confidential survey for which the individual data results will not be
available to the employing organization. Furthermore, any tendency to over or under
report working hours should be random and just as likely to occur among employees in
both sectors.
3 In addition to testing the continuous variable, I will test hours worked per week as a categorical variable with the following five categories: part-time (1-34 hr/week), full-time (35-40 hr/week), lower overtime (41-48 hr/week), medium overtime (49-69 hr/week), and higher overtime (70+ hr/week) (Grosch et al. 2006).

24
The second dependent variable is Organizational Involvement. This variable is
constructed from the following five questionnaire items:4
1. Time seems to drag while I am on the job (reverse) 2. It has been hard for me to get very involved in my current job (reverse) 3. All in all, I am satisfied with my job 4. I would rate the overall quality of work being done in my organization as very
good 5. I feel a sense of pride working for this organization
The correlations between the items range from .286 to .605. Organizational
Involvement is the sum of responses to the five questionnaire items and ranges from five
(low organizational involvement) to 20 (high organizational involvement), with a mean
of 17 and a median of 18. A test of the scale’s reliability resulted in a Cronbach’s Alpha
of .802 (See Appendix E for scale statistics and correlations).
Scale Statistics for Organizational Involvement
Reliability Statistics Scale Statistics
Cronbach's Alpha
Cronbach's Alpha Based on Standardized Items Mean Variance
Std. Deviation
N of Items
N of Cases
.802 .802 17.08 7.916 2.814 5 1220 Independent Variables: Generic Mentoring
The primary independent variables of interest are the dummy variables, Mentor
and Nonprofit, which are coded one if the respondent has ever had a mentor and one if
the respondent works in the nonprofit sector, respectively.
The variable, Mentor, indicates response to the questionnaire item “Have you
ever had a mentor?” Six hundred and twenty-five respondents report having had a
mentor. A little more than half of the public sector respondents (52%) and of the
nonprofit sector respondents (57%) report having had a mentor. The average duration of
4 Response categories are four point likert scales of agreement.

25
reported mentorships is 48 months, ranging from one month to 412 months (34 years and
4 months) with a standard deviation of 72 months. The most commonly reported
mentorship duration is one year, reported by 36 individuals. There is a slight, significant
correlation between having had a mentor and the two dependent variables: Time Spent at
Work (0.136) and Organizational Involvement (0.089).
Two statistical concerns emerge with regards to the variable Mentor, which asks
respondents if they have ever had a mentor. First, it is possible that having had a mentor
in the past is qualitatively different from currently having a mentor. Second, it is possible
that a certain type of employee seeks out mentorships and that the characteristics driving
this self-selection are also related to the outcomes of time spent at work and
organizational involvement. I conducted a comparison of previously and currently
mentored individuals to address the first concern and analyses to test for the second
endogeneity concern.
Among those who report having had a mentor, 150 are still engaged in those
mentoring relationships. Among the 219 individuals in the nonprofit sample 63 (29%)
report that they are still engaged in the mentorship and 22% of the mentored public sector
respondents report that their mentorships have not ended. It is possible that those who
currently have a mentor significantly differ in outcomes from those who report having
had a mentor. In order to determine whether having had a mentor is significantly different
from currently having a mentor, I tested for significant differences between currently and
previous mentored respondents and relationships between currently having a mentor and
the dependent variable. First, a correlation analysis indicated that currently having a
mentor is not significantly correlated with time spent at work or organizational
26
involvement (Pearson correlation 0.052; Sig. (2-tailed) .193) though having had a mentor
(current or not) is significantly correlated with the dependent variables. Second, an
ANOVA test indicates that currently mentored individuals do not significantly vary from
currently mentored individuals in time spent at work and organizational involvement (see
Appendix B for full results).5
To test the direction of the causal relationship between having had a mentor and
the outcome variables I ran a logistic regression model using time spent at work and
organizational involvement to predict having had a mentor. The model indicated that time
spent at work (Beta 0.35; significance .003) and organizational involvement (Beta .062;
significance .049) are both significant predictors of having had a mentor (See Appendix
C for endogeneity tests). Although there appears to be an endogenous relationship
between having had a mentor and the outcome variables, there are statistical and logical
arguments which lead me to conclude that this is not a major concern and that having had
a mentor is indeed a predictor of the outcome variables and not vise versa. First, because
the measure for having had a mentor includes mentorships which may have occurred
prior to the current position or earlier in the respondent’s career, it is not likely nor
logical that current levels of time spent at work and organizational involvement are
predictors of having had a mentor in the past. Second, including a measure for whether or
not the mentorship formed organically or was formally arranged by the employing
organization eliminates the significant affect of time spent at work and organizational
involvement on having had a mentor (See Appendix C). The measure for organic versus
formal mentorships controls for self-selection into mentorships and includes randomly
5 I also ran all of the models in this study with a control variable for “Currently mentored” individuals. The variable, currently mentored, is not significant in any of the models predicting time spent at work and
27
assigned mentors and protégés, thus reducing the threat of high achieving protégés
selecting into mentorships or mentors selecting high achieving protégés. Given the results
of the backward model, predicting having had a mentor, and the effect of including a
variable controlling for organic and formally assigned mentors, there is little statistical
and even less logical reason to believe that the direction of the causal model predicting
time spent at work and organizational involvement has been misspecified.
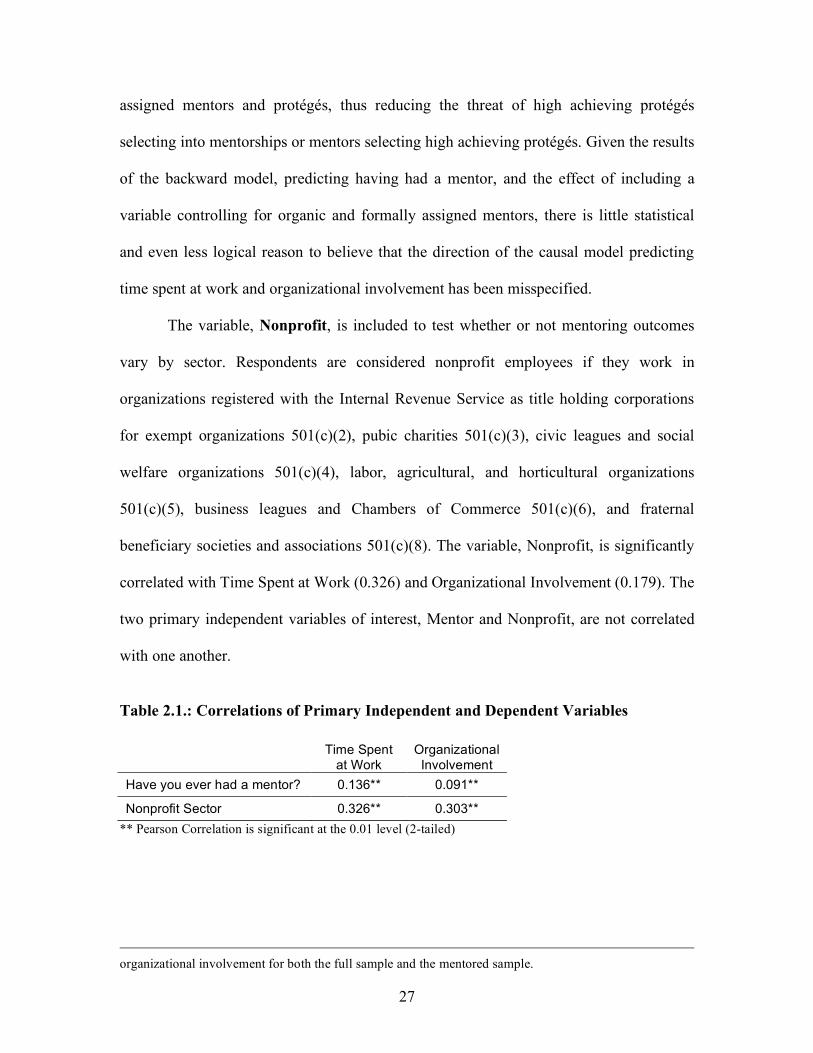
The variable, Nonprofit, is included to test whether or not mentoring outcomes
vary by sector. Respondents are considered nonprofit employees if they work in
organizations registered with the Internal Revenue Service as title holding corporations
for exempt organizations 501(c)(2), pubic charities 501(c)(3), civic leagues and social
welfare organizations 501(c)(4), labor, agricultural, and horticultural organizations
501(c)(5), business leagues and Chambers of Commerce 501(c)(6), and fraternal
beneficiary societies and associations 501(c)(8). The variable, Nonprofit, is significantly
correlated with Time Spent at Work (0.326) and Organizational Involvement (0.179). The
two primary independent variables of interest, Mentor and Nonprofit, are not correlated
with one another.
Table 2.1.: Correlations of Primary Independent and Dependent Variables
Time Spent
at Work Organizational Involvement
Have you ever had a mentor? 0.136** 0.091**
Nonprofit Sector 0.326** 0.303** ** Pearson Correlation is significant at the 0.01 level (2-tailed)
organizational involvement for both the full sample and the mentored sample.

28
Control Variables
Motivation Control Variables. This research includes four controls variables
related to protégé work motivation: Career Advancement Motivation, Financial
Motivation, Job Security Motivation, and Public Service Motivation. NASP-III asks
respondents to respond to the following directive, “We are interested in the factors that
motivated you to accept a job at your current organization. Please indicate the extent to
which the factors below (some personal, some family, and some professional) were
important in making your decision to take a job at your current organization.” Response
options were a four point likert scale: very important, somewhat important, somewhat
unimportant, and not at all important. The variables Financial Motivation and Public
Service Motivation6 are responses to the questionnaire items Salary and Ability to serve
the public and the public interest, respectively. Security Motivation and Advancement
Motivation7 are scales from a factor analysis of the following items:
Opportunity for advancement within the organization’s hierarchy
The organization’s pension or retirement plan
Desire for increased responsibility
Benefits (medical, insurance)
Few, if any, alternative job offers
The factor analysis using an orthogonal solution and Varimax rotation of the five
items above resulted in an optimized distribution of variance along two dimensions:
security and advancement. The security and advancement dimensions represent 63% of
6 I also tested PSM (Ability to serve the public and the public interest) as a dichotomous variable (0=not important, 1=important). The four category PSM variable, compared to the dichotomous version, is more strongly correlated with the dependent variables and offers a more detailed understanding of PSM, so I retained the four point scale. 7 These scales have been used in several other papers including Bozeman & Feeney (R&R); Bozeman & Murdock (in press); Bozeman & Ponomariov (under review).

29
the common variance in the initial correlation matrix. The saved factor scores make up
the independent variables, Security Motivation and Advancement Motivation. The factor
loadings matrix is presented in Table 2.2. The motivation measures help to capture the
relationship between personality and work behavior, which is relevant to this study since
previous research (Scott et al. 1997) indicates that work behavior is related to personality
types such as being compulsive-dependent, achievement oriented, and a perfectionist.
Table 2.2: Factor Analysis for Security and Career Advancement Motivation Items in Generic Mentoring Model Security Advancement Opportunity for advancement within the organization’s hierarchy .462 .600 The organization’s pension or retirement plan .871 .048 Desire for increased responsibility .004 .837 Benefits (medical, insurance) .879 .046 Few, if any, alternative job offers .408 -.437 Extraction Method: Principal Component Analysis. Rotation Method: Varimax with Kaiser Normalization. Rotation converged in 3 iterations. Dimensions represent 63.351% of the common variance in the initial correlation matrix
Work-Related Control Variables. The models include a series of variables related
to the respondent’s previous and current work experience. Since research indicates that
the nonprofit sector is closely tied to the private sector as a source for management
personnel (Odendahl et al. 1985) and that nonprofit and public sector managers are
increasingly moving between the sectors (Ott 2001, 241; Ott & Dicke 2006), I include a
binary variable Private which indicates if the respondent’s previous job was in the

30
private sector.8 This variable serves as a control for work behavior which may be related
to previous work experience and habits shaped by working in the private sector.
Because research indicates that workplace experiences and job tenure shape
commitment and attitudes, in particular women’s organizational commitment (Dodd-
McCue and Wright 1996) and early career commitment (Buchanan 1974), I include the
following variables which are related to the respondent’s current position: Current Job
Tenure, Job Position: Manager, Number of Employees supervised, Promotion, and
Manager*Tenure. Current Job Tenure is a continuous variable measuring the number
of years the respondent has worked in her current position.9 I expect that longer job
tenure will be associated with working longer hours and reporting higher organizational
involvement since a longer job tenure implies satisfaction with the job and organization.
The dummy variable, Job Position: Manager, is coded one if the respondent is a
manager. Although the NASP-III study targeted managers and high ranking employees, it
is possible that some of these individuals do not identify themselves as managers, but
instead as professionals (e.g. accountants or lawyers) or technicians (e.g. engineers).
Seventy percent of the respondents indicated that their primary responsibility is
managerial, followed by 19% who report working as professionals, and 6% as technicians
(See table 2.3). Because research indicates that professionals and managers are more
likely than non-managers to work long hours (Harpaz and Snir 2003), I expect that being
a manager variable will be positively related to the dependent variables.
8 I will also test variables which indicate if the respondent’s previous job was in private, nonprofit, and public sectors, tenure in the private sector, nonprofit, and public sectors, and if the current job was a sector switch. 9 I will also test a variable for tenure at the current organization (including previous jobs at the current organization).

31
Table 2.3: Comparison of Job Position, by Sector
NonProfit
Sector Public Sector Total
Main Responsibility: Manager 507 331 838 Main Responsibility: Professional 188 42 230 Main Responsibility: Technical 64 3 67 Main Responsibility: Other 25 7 32 Total 794 396 1190
Since the NASP-III dataset does not have individual salary information, I use the
variables Job Position: Manager and Current Job Tenure and the interaction variable
Manager*Tenure as proxies for salary and seniority. According to Bridges & Villamez
(1994), authority and wage levels in the public-sector reflect the interaction between
position and time spent in the personnel system. I also control for individual performance
with the variable Promotion, which is a dummy variable indicating if the respondent’s
current job was a promotion.10 To control for rank, I include an ordinal variable, Number
Employees Supervised, for the number of employees the protégé currently supervises.11
I expect that these variables indicating seniority will be associated with increased time
spent at work each week, because seniority implies extended work responsibilities.
I also control for the protégé’s social capital activities outside of the workplace by
including a measure for the protégé’s civic activity. The variable Total Civic is an
additive index of responses to a series of dummy variables listing organizations or groups
to which the respondent might belong. Total Civic is the sum of all memberships and is a
rough indication of the respondent’s external social capital and involvement in non-work
10 Current job is a promotion (=1); Current job was not a promotion (=0). It is possible that in some cases the current job was a demotion. Because demotions are uncommon in the public sector, we did not ask for this information. Furthermore, we felt any small amount of additional information gain would be at too great a price in terms of diminishing rapport with the respondent.

32
organizations.12 This variable captures the protégé’s tendency to engage in extracurricular
activities and seek out commitments outside the workplace. These activities indicate
informal and formal social connections and networks. I expect that an individual who is
engaged in numerous social and civic activities will be more likely to be engaged and
involved at the work place.
Demographic Control Variables. I include a set of demographic variables to
control for variation such as family structure, gender, race, and age. I expect that family
structure will play an important role in protégé career outcomes since extreme work
involvement and long work hours are strongly related to nonwork support and family
commitments (Machlowitz 1980). For example, Johnson (2004) finds that increased work
hours significantly increase the probability of divorce for both men and women. Research
(Harpaz & Snir 2003) also indicates that married women work fewer hours per week than
unmarried women, married men work more hours per week than unmarried men, and that
among married individuals women with children work less per week than childless
married women, while men with children work more hours per week than childless men
(Kaufman & Uhlenberg 2000). These findings point to significant interactions between
marital status, gender, and work hours, and among married individuals, having children
and work hours. I have also included the following two controls for family
characteristics: a dummy variable for marriage, Married, and a continuous variable,
Children, which indicates the number of dependent children in the respondent’s
11 Responses to the number of employees supervised were skewed, ranging from zero to 1200, with the highest quintiles starting at less than 100. I created an ordinal variable with the following categories: zero employees supervised, 1-5, 6-10, 11-20, and more than 21 employees supervised. 12 Group membership response categories included: Church, synagogue, mosque, or religious organization; Political club or political party committees; Professional societies, trade or business association, or labor union; service organizations such as Rotary or Lions; Youth support groups such as the Girl’s and Boy’s

33
household. Given previous research, I expect married men to spend more time at work
each week and report higher organizational involvement than married women and
unmarried men. I also expect that women who have dependent children, due to extra
family commitments, will report spending less time at work than women without
children.
I include the dummy variable, Female, since research has found that women
report higher levels of job stress and other factors associated with lower levels of job
satisfaction (Burke 1999) and, typically, work shorter hours than men (Harpaz & Snir
2003). Furthermore, current mentoring research indicates that women, like men, benefit
from mentoring relationships and that women with mentors report greater job success and
satisfaction (Riley & Wrench 1985) and increased self-confidence and use of skills
(Reich 1986) compared to women without mentors.
I also include a continuous variable for age, and dummy variables for state and
race: Georgia and nonwhite. The variable, age, controls for differences in work hours
and organizational involvement due to generational values (Jurkiewickz et al. 1998) and
job experience and tenure. The variable, Georgia, controls for variation by state which
may occur due to variation in state government personnel restrictions. For example,
according to Hays and Sowa’s (2006) analysis of human resource reforms in the states,
about 72% of Georgia state government employees are at-will-employees and Georgia
offers a restricted number of issues open to grievances. Illinois’ public sector has not
expanded its at-will-employment beyond its standards 20% and continues to offer a wide
range of issues open to grievances. Hays and Sowa (2006) report a decline in job security
Club, Little League Parents Association; Neighborhood or homeowners’ associations; PTA, PTO, or school support groups; Groups sports team or club (e.g. softball team, bowling league); Other.

34
in both Georgia and Illinois. The state control will also be important for identifying and
variation in nonprofit organizations by state because the regulation of nonprofit
organizations in states can vary due to state laws, tax codes, tort law, and regulations for
nonprofit organizations (Harvard Law Review 1992, 1636). Since the regulation of
nonprofit organizations in Georgia and Illinois may play a role in shaping employees’
behavior and perceptions it is important to include this control.13
Institutional Control Variables. In addition to controlling for individual
motivation and work characteristics, I include controls for organizational characteristics,
because, first, there is disagreement about whether work behavior is related to personality
(Scott et al. 1997) or situation dependent (Machlowitz 1980) and, second, mentoring
studies regularly include organizational control variables (Chao et al. 1992). Org Size, is
a continuous variable indicating the number of full time employees in each respondent’s
organization and Org Age indicates the year the organization was established. I predict
that respondents working in larger organizations will work fewer hours and report lower
organizational involvement than those in smaller organizations because these larger
organizations will provide less personal environments while smaller organizations will
include more personal relationships and heightened commitment among employees.
The OLS regression models testing for mentoring affects among all respondents
are operationalized as follows:
Time spent at work = B0 + B1(mentor) + B2(sector) + B3(M1) + B4(M2) + B5(M3) + B6(M4) + B7(SAC) + B8(WRC) + B9(DC) + E.
Organizational Involvement = B0 + B1(mentor) + B2(sector) + B3(M1) + B4(M2) +
B5(M3) + B6(M4) + B7(SAC) + B8(WRC) + B9(DC) + E. 13 I tested a control variable for education. However, because 86.5% of the respondents have a college degree there is a lack of variance in this measure.

35
Where mentor and sector are the primary independent variables of interest; M1 through
M4 are the work motivation items; SAC is the social activities control; WRC are the
work-related controls; and DC are the demographic controls. Table 2.4 lists all controls in
the models of generic mentoring.
Table 2.4: Variables in Generic Models
Dependent Variables Work-Related Controls (1) Time Spent at Work 1. Current Job: Tenure (2) Organizational Involvement 2. Current Job: Manager 3. Previous Job: Private
Mentor Characteristics 4. Current Job: Promotion 5. Current Job: # Employees supervised (1) Internal / External Mentor 6. Manager*Job Tenure (2) Organic / Formal Mentor (3) Female Mentor (4) Duration of Mentorship Organizational Controls (5) End-Year of Mentorship 1. Org Size
Work Motivation Controls 2. Org Age (1) Security Motivation Demographic Controls (2) Public Service Motivation (3) Financial Motivation 1. Age (4) Career Advancement Motivation 2. Female
3. Georgia Social Activity Control 4. Nonwhite
5. Number Children Total Civic Activities 6. Married
Findings: Generic Mentoring
Time Spent at Work The results for the model predicting time spent at work for all NASP-III
respondents are found in Table 2.5. The model indicates that individual demographic
characteristics, work motivation, and job characteristics play a significant role in
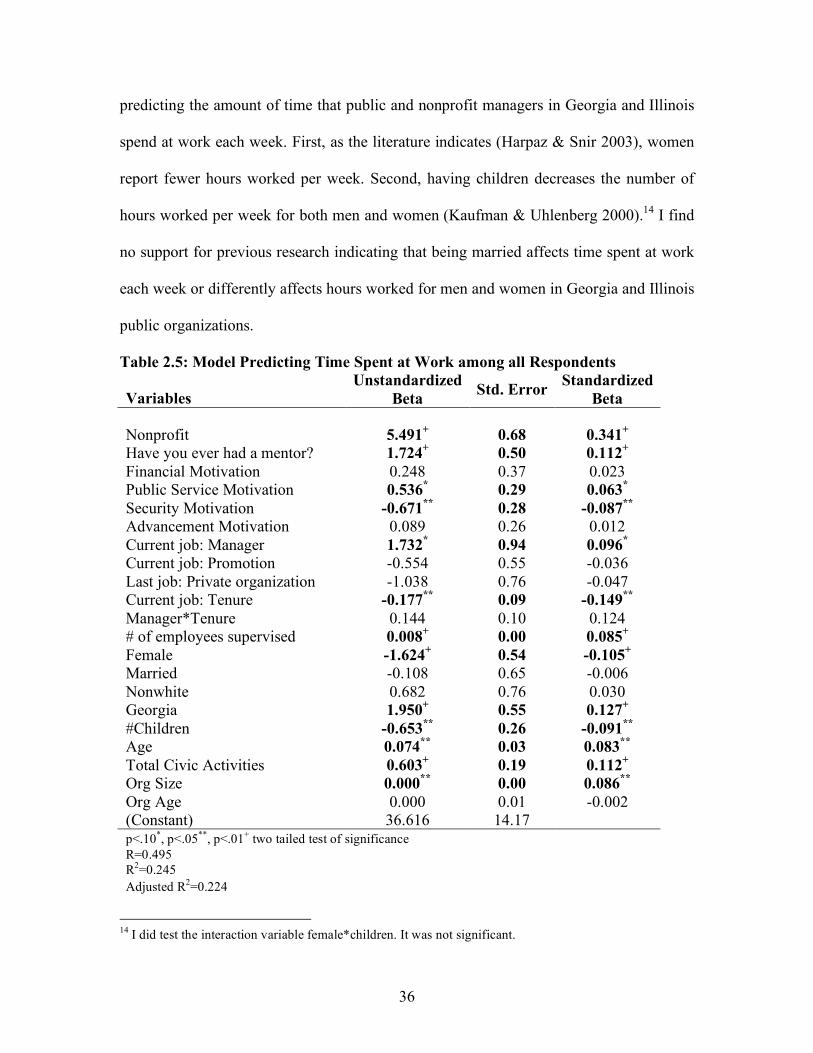
36
predicting the amount of time that public and nonprofit managers in Georgia and Illinois
spend at work each week. First, as the literature indicates (Harpaz & Snir 2003), women
report fewer hours worked per week. Second, having children decreases the number of
hours worked per week for both men and women (Kaufman & Uhlenberg 2000).14 I find
no support for previous research indicating that being married affects time spent at work
each week or differently affects hours worked for men and women in Georgia and Illinois
public organizations.
Table 2.5: Model Predicting Time Spent at Work among all Respondents
Variables Unstandardized
Beta Std. Error Standardized Beta
Nonprofit 5.491+ 0.68 0.341+ Have you ever had a mentor? 1.724+ 0.50 0.112+ Financial Motivation 0.248 0.37 0.023 Public Service Motivation 0.536* 0.29 0.063* Security Motivation -0.671** 0.28 -0.087** Advancement Motivation 0.089 0.26 0.012 Current job: Manager 1.732* 0.94 0.096* Current job: Promotion -0.554 0.55 -0.036 Last job: Private organization -1.038 0.76 -0.047 Current job: Tenure -0.177** 0.09 -0.149** Manager*Tenure 0.144 0.10 0.124 # of employees supervised 0.008+ 0.00 0.085+ Female -1.624+ 0.54 -0.105+ Married -0.108 0.65 -0.006 Nonwhite 0.682 0.76 0.030 Georgia 1.950+ 0.55 0.127+ #Children -0.653** 0.26 -0.091** Age 0.074** 0.03 0.083** Total Civic Activities 0.603+ 0.19 0.112+ Org Size 0.000** 0.00 0.086** Org Age 0.000 0.01 -0.002 (Constant) 36.616 14.17 p<.10*, p<.05**, p<.01+ two tailed test of significance R=0.495 R2=0.245 Adjusted R2=0.224
14 I did test the interaction variable female*children. It was not significant.

37
Individual work motivation is a significant predictor of the amount of time spent
at work. Respondents who chose their current job in order to serve the public interest
report working more hours per week than those who did not indicate that public service
motivation was an important reason for choosing the current position. This finding
supports the literature indicating that public service motivation can lead to significant
work outcomes (Crewson 1997; Perry & Wise 1990; Naff & Crum 1999). In contrast,
reporting a high desire for job security is negatively associated with time spent at work.
This may be explained by the predominant desire for job security among public sector
employees, who, according to this model work spend less time at work each week than
nonprofit workers. It may also simply be that the desire for job security is a poor
motivator for working extra hours.
I find that previous work experience is not related to time spent at work,15 nor is
being a manager or reporting that the current job was a promotion. Although being a
manager is not significantly related to increased time spent at work, supervising more
employees is significantly related to reporting an increase in the number of hours worked
each week. If the number of employees supervised is an indication of rank and increased
responsibility in the workplace, the model indicates that that individuals with supervisory
responsibilities in the public and nonprofit sectors work more hours per week, on
average, than those who do not supervise others or supervise fewer employees.
Although current job tenure is a negative predictor of hours worked, this should
not be interpreted as an indication of an aging work force, since age is a positive
15 I also tested sector switching, time in each sector, and number of jobs in each sector. None of these were significant.

38
predictor of hours worked. Older respondents spend more time at work each week, on
average, but increased job tenure reduces time spent at work.
I also find that respondents who work in Georgia report working, on average,
1.950 more hours per week than those in Illinois. It is possible that the significant
difference in time spent at work, by state, is related to personnel constraints and state
laws in the public sector. Recent reforms in human resource practices in Georgia,
including the expansion of at-will-employment may result in more time spent at work
among public sector employees in Georgia compared to Illinois. It may also be the case
that employees in the nonprofit sector in Georgia spend more time at work than those in
Illinois. However, because sector is an independent variable in the model, it is impossible
to attribute the difference in work hours to public sector work norms, since this model
combines public and nonprofit respondents. The sector specific models in Chapter Three
will enable me determine if these differences in work hours rest with social and cultural
norms in Georgia and Illinois, or state personnel laws.
Respondents who work in the nonprofit sector spend more time at work per week
than public sector employees. In fact, workers in the nonprofit sector, holding all else
constant, work about five hours more per week than those in the public sector. Most
important, having a mentor is significantly related to spending more time at work. Having
a mentor, increases hours worked by approximately 1.5 hours per week, holding all else
constant. This finding supports the first hypothesis (H1). I find that having or having had
a mentor affects protégé work hours and that those who have had a mentor report
spending more time at work each week than those without a mentor.

39
Organizational Involvement The results for the general model predicting organizational involvement as an
outcome of mentoring are presented in Table 2.6. The results indicate that organizational
involvement is significantly related to work motivation, current job characteristics, and
demographic characteristics. The model for organizational involvement indicates that
those who report taking their current job with a desire to serve the public interest or for
career advancement reasons report higher organizational involvement than those who
reported lower public service motivation and career advancement motivation. Increased
security motivation is a negative predictor of organizational involvement. Women,
compared to men report higher organizational involvement. In addition, respondents who
work in Georgia report significantly higher organizational involvement than those in
Illinois. Organizational involvement increases with age and being married.
Turning to the primary independent variables of interest, the model indicates that
having had a mentor is a significant positive predictor of organizational involvement
among all respondents. These findings support the second hypothesis that having had a
mentor affects protégé organizational involvement. Individuals who have had a mentor
report higher organizational involvement that those without a mentor. Finally, compared
to public sector respondents, nonprofit workers report higher organizational involvement.
The models presented in Chapter Three will further investigate how mentoring outcomes
vary by sector.

40
Table 2.6: Model Predicting Organizational Involvement among all Respondents Variables Unstandardized
Beta Std. Error
Standardized Beta
Nonprofit 1.664+ 0.24 0.288+ Mentor 0.433+ 0.18 0.079+ Financial Motivation -0.162 0.13 -0.043 Public Service Motivation 0.223** 0.10 0.073** Security Motivation -0.190* 0.10 -0.070* Career Advancement Motivation 0.437 0.09 0.162+ Current job: Manager 0.825** 0.33 0.128** Current job: Promotion 0.466** 0.20 0.085** Last job: Private organization 0.074 0.27 0.009 Current job: Tenure 0.034 0.03 0.080 Manager*Tenure -0.057* 0.03 -0.137* Current job: # of employees supervised 0.004+ 0.00 0.102+
Female 0.520 0.19 0.094+ Married 0.501** 0.23 0.075** Nonwhite 0.365 0.27 0.044 Georgia 0.856+ 0.19 0.156+ #Children 0.151 0.09 0.058 Age 0.056+ 0.01 0.178+ Total Civic Activities 0.063 0.07 0.033 Org Size 0.000 0.00 -0.059 Org Age -0.004 0.00 -0.055 (Constant) 18.866 4.98 p<.10*, p<.05**, p<.01+ two tailed test of significance R=0.506 R2=0.256 Adjusted R2=0.235
The generic models of mentoring indicate that having a mentor is significantly
related to the amount of time spent at work and organizational commitment. Among all
respondents, having had a mentor significantly increases the number of hours spent at
work each week and organizational involvement. Furthermore, respondents that work in
the nonprofit sector report spending more time at work and higher organizational
involvement compared to public sector respondents. These models provide support for
the first set of hypotheses:

41
H1: Having had a mentor significantly positively affects the amount of time an individual spends at work.
H2: Having had a mentor significantly positively affects individual organizational involvement.

42
CHAPTER 3
MENTORING OUTCOMES, BY SECTOR
Research overwhelmingly finds that mentoring is a critical component in the
development of individual careers. Unfortunately, mentoring research is generic in nature
and typically focuses on mentoring in the private sector. Research investigating
mentoring outcomes for protégés, mentors, and organizations is predominately found in
disciplines such as business, vocational training, management, and education studies,
which helps to explain its generic focus. By one count, more than 500 articles on
mentoring were published in management and education literatures during the ten years
leading up to 1997 (Allen & Johnston 1997). My own scan of four major journals in
public administration and public management found only four mentoring research articles
published between 1995 and 2005 (See table 3.1).16 In addition, though nonprofit
organizations are increasingly concerned with using mentoring as a tool to increase
retention and promotion (Williams 2005) and develop volunteerism (Hartenian 2007), a
search of the three leading nonprofit sector studies general purpose journals turned up
two mentoring research articles which investigate university alumni giving as an outcome
of student mentoring (Clotfelter 2001) and mentoring as a tool for training direct (point-
of-service) volunteers (Hartenian 2007).
16 I searched for the keywords “mentor” and “mentoring” in the following journals: Public Administration Review (4 articles; 2 focus on mentoring PA scholars and 2 mentoring in the public sector), American Review of Public Administration (2 articles), Journal of Public Administration Research and Theory (0), Public Administration (0). I searched the following databases: Social Science Citation Index, JSTOR, EbscoHost, ProQuest, and GaleGroup Business and Company Resource.
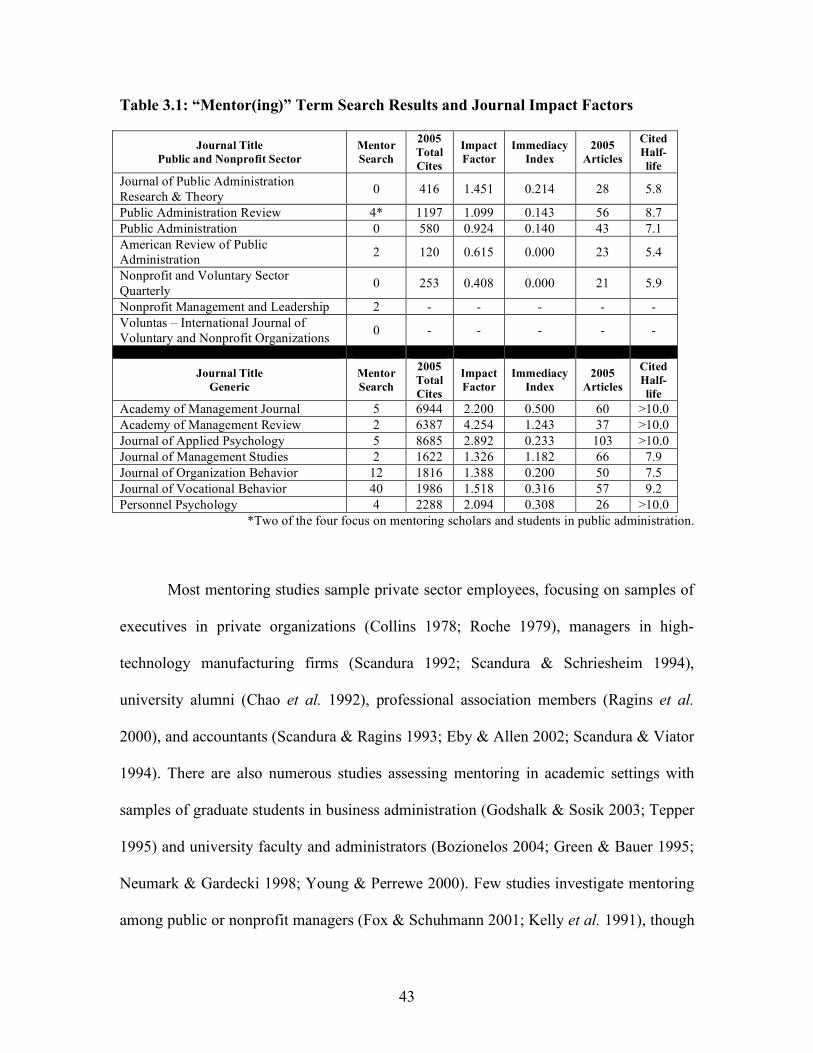
43
Table 3.1: “Mentor(ing)” Term Search Results and Journal Impact Factors
Journal Title Public and Nonprofit Sector
Mentor Search
2005 Total Cites
Impact Factor
Immediacy Index
2005 Articles
Cited Half-life
Journal of Public Administration Research & Theory 0 416 1.451 0.214 28 5.8
Public Administration Review 4* 1197 1.099 0.143 56 8.7 Public Administration 0 580 0.924 0.140 43 7.1 American Review of Public Administration 2 120 0.615 0.000 23 5.4
Nonprofit and Voluntary Sector Quarterly 0 253 0.408 0.000 21 5.9
Nonprofit Management and Leadership 2 - - - - - Voluntas – International Journal of Voluntary and Nonprofit Organizations 0 - - - - -
Journal Title Generic
Mentor Search
2005 Total Cites
Impact Factor
Immediacy Index
2005 Articles
Cited Half-life
Academy of Management Journal 5 6944 2.200 0.500 60 >10.0 Academy of Management Review 2 6387 4.254 1.243 37 >10.0 Journal of Applied Psychology 5 8685 2.892 0.233 103 >10.0 Journal of Management Studies 2 1622 1.326 1.182 66 7.9 Journal of Organization Behavior 12 1816 1.388 0.200 50 7.5 Journal of Vocational Behavior 40 1986 1.518 0.316 57 9.2 Personnel Psychology 4 2288 2.094 0.308 26 >10.0
*Two of the four focus on mentoring scholars and students in public administration.
Most mentoring studies sample private sector employees, focusing on samples of
executives in private organizations (Collins 1978; Roche 1979), managers in high-
technology manufacturing firms (Scandura 1992; Scandura & Schriesheim 1994),
university alumni (Chao et al. 1992), professional association members (Ragins et al.
2000), and accountants (Scandura & Ragins 1993; Eby & Allen 2002; Scandura & Viator
1994). There are also numerous studies assessing mentoring in academic settings with
samples of graduate students in business administration (Godshalk & Sosik 2003; Tepper
1995) and university faculty and administrators (Bozionelos 2004; Green & Bauer 1995;
Neumark & Gardecki 1998; Young & Perrewe 2000). Few studies investigate mentoring
among public or nonprofit managers (Fox & Schuhmann 2001; Kelly et al. 1991), though

44
a more recent study (Smith et al. 2005) uses a sample of military armed forces and
military academic organizations to investigate mentoring characteristics in government
and non-governmental organizations. In summary, although mentoring research has made
a great deal of progress in a relatively short period of time, samples tend to come almost
exclusively from business employees and in many instances business students, leaving
large segments of the workforce, especially the public and nonprofit sector workforce,
unexamined.
Although no broad-based aggregate empirical study comparing mentoring of
public and nonprofit managers has heretofore been conducted, a great deal of research
has been dedicated to identifying how workers, work life, and organizations in the
nonprofit and public sectors are distinct. Public organizations are operated by the state on
behalf of the public in order to provide public goods and services, monitor and regulate
industrial activities, and protect the public interest. Public organizations can operate for
profit, not for profit, or somewhere in between. The nonprofit sector, a term first coined
in the 1970s (Filer Commission Report 1977; Himmelstein 1993), refers to organizations
which are not operated by the state that provide goods and services without making a
profit and qualify for tax-exempt status under the Internal Revenue Code because they
are organized for the specific purposes stated in the IRS Code. Although there can be
great variation among nonprofit organizations, including different reporting requirements,
all are exempt from paying federal income taxes. In the case of mentoring, the
distinctiveness of nonprofit and public organizations is important because mentorships
can play a critical role in ensuring that protégés have the necessary skills to navigate
organizational and sector norms conditioned by relationships to organizational mission,

45
the state and various government agencies, charitable funders, volunteers, and various
regulatory structures (e.g. tax exemption).
Sector Distinctions
I now briefly review the literature on sector distinctions in order to demonstrate
why I expect that mentoring will vary by sector. Early theories of public organizations
support Wallace Sayre’s argument that public organizations are distinct from private
organizations in all important aspects (Allison 1992) including leadership and
management practices, scope, influence, and impact (Appleby 1945), authority (Allison
1992; Rainey 2003), public accountability (Appleby 1945), and external scrutiny (Allison
1992; Rainey 2003). Research supports the distinctions between public and private
organizations regarding decision-making processes (Coursey & Bozeman 1990; Nutt
2006), risk-taking (Bellante & Link 1981; Bozeman & Kingsley 1998), work-related
behavior (Rainey 1989; Rainey et al. 1976), civil service and personnel constraints
(Allison 1992; Rainey 2003), red tape (Bozeman 1993; Buchanan 1975; Bozeman et al.
1992; Rainey et al. 1995), and environmental factors (Rainey 2003). The distinction of
government agencies as public bodies can provide increased influence and legitimacy for
government organizations compared to the nonprofit sector (Marwell & McInerney
2005). This legitimacy distinction can result in widespread influence and access to
extensive public resources. However, research also finds that government organizations
are more vulnerable to institutional pressure and less likely to suffer from changes in
funding than private organizations (Frumkin & Golaskiewitcz 2004). In sum, research
supports the general distinction between public and private organizations (for reviews see
Perry & Rainey 1988; Rainey 1989; and Rainey & Bozeman 2000).

46
Public administration researchers note that the differences between public and
private organizations can be illustrated in various ways. A typical method is to
distinguish between the two sectors by whether they benefit the general public or private
owners, respectively (Blau & Scott 1962). However, this straightforward distinction
leaves many difficulties in identifying benefits and recipients of those benefits. Others
propose that organizations can be organized (1) along a continuum from those which use
economic markets to determine the pricing of products and services sold (enterprises) to
organizations which have public goals set by legislatures (agencies) (Dahl & Lindblom
1953); (2) in discrete groups categorized by ownership and funding (Wamsley & Zald
1973) or ownership, funding, and mode of social control (Perry & Rainey 1988); or (3)
along two continuums indicating the extent of an organization’s political authority and
economic authority (Bozeman 1987). Despite the inability of public administration
scholars to agree on one method for differentiating between government and private
organizations there remains widespread support for the separate treatment of these
sectors.
Public organizations function under multiple layers of accountability and
authority which can include: the executive, legislatures, courts, clientele, voters and
constituents, media, and the general public interest. In general, public organizations
exhibit a high level of control by external authorities (Pugh et al. 1969). Of course, not all
public organizations are the same. Factors such as organization size, function, task,
leadership, and technology can play a significant role in organization differences
regardless of sector and the differences between sectors can be blurred by functional
analogies and complex interrelations between organizations. Notwithstanding the

47
blurring of sectors and the difficulty in distinguishing between hybrid organizations, in
general, public organizations are distinct in many aspects and generic organization and
management theory does not provide a complete analysis of the internal and external
environments of public organizations (Perry & Kraemer 1983; Pitt & Smith 1981).
Similar to the public and private sectors, the nonprofit sector, also known as the
independent, voluntary, or third sector, consists of various types of organizations which
fulfill numerous functions including healthcare, education, research, civic action, fine
arts, and social services (Salamon 1998; Steinberg 1987, 120). For the purpose of this
research, nonprofit organizations are defined as structured, formal organizations and
institutions which serve a public purpose and are nongovernmental, nonprofit
distributing, and self-governing (Salamon 1998; Hall 1992).17 Nonprofit organizations
can operate alone or work in partnerships to supplement and support government and
private organizations (Shaw 2003). Because nonprofit organizations are tax-exempt and
not-for-profit, they often depend on donations and charitable grants from individuals,
corporations, and governments to fund their operations, however, they are not owned by
and do not create wealth for their investors or members and their missions are not served
by meeting the consumption needs of consumers (Dees & Anderson 2003; Frumkin &
Golaskiewitcz 2004; Weisbord 1997).
17 In addition, nonprofit organizations can be categorized as being member-serving (e.g. labor organizations or social clubs) or public-serving (grant-making foundations or charitable organizations). Though both member- and public-serving nonprofits are tax exempt, public-serving nonprofits, classified under Section 501(c)(3) of the U.S. tax code, are exempt from tax-deductible gifts. For this research, I include organizations that qualify for tax-exemptions under Internal Revenue Service tax code sections 501(c)2,3,4,5,6, and 8 for nonprofit organizations, which includes: 501(c)(2) Title Holding Corporation for Exempt Organization; 501(c)(3) Public Charity: Religious, Educational, Charitable, Scientific, Literary, Testing for Public Safety, Organizations to Prevent Cruelty to Children or Animals; 501(c)(4) Civic Leagues and Social Welfare Organizations, and Local Associations; 501(c)(5) Labor, Agricultural, and Horticultural Organizations, 501(c)(6) Business Leagues, Chambers of Commerce, Real Estate Boards; and 501(c)(8) Fraternal Beneficiary Societies and Associations.

48
Even though some researchers (Hall 1992, 244; Karl 1987) argue that using the
term “nonprofit” obscures the private interests affiliated with philanthropic organizations,
it is useful for combining philanthropies, religious-based, voluntary, and charitable
organizations into a single sector which serves public missions and represents civil
society, apart from the control of the market and the state (Anheier & Seibel 1990;
Sievers 2006). Nonprofits play an important role in American society by organizing
individuals through service and volunteerism to meet public needs and provide public
goods such as health care, education, disaster relief, and arts and entertainment. The
nonprofit sector is continually growing, largely due to the increase in partnerships
between the government and nonprofit sectors (Salamon 1998). Today, nonprofit
foundations make up nearly 10% of the U.S. gross domestic product, worth more than
one trillion dollars (Ryssdal 2007). In addition, recent studies report that public-spirited
young Americans and people who want to serve the public interest and their communities
are more likely to be attracted to the nonprofit sector than government jobs (PPS 2005;
Light 2002).
Similar to the public administration literature, nonprofit theory and research
investigates the distinctions between the sectors. Nonprofit theory and research outlines
the distinctions between the nonprofit sector and the for-profit sector, and to a lesser
extent the distinction between nonprofit and public organizations. Nonprofit researchers
define the distinctions between sectors along continuums of interests, mission, and
ownership, and relationships to economic markets and the state (Salamon 1977; Marwell
& McInerney 2005). Although nonprofits share some similarities with public agencies,
such as dependence on external sponsors (Corder 2001), level of managerial
49
professionalism (Berman 1999), and a workforce that is made up of public service-
minded workers (Rotolo & Wilson 2006), Salamon (1977) notes that the nonprofit sector
faces fiscal, economic, management, and legitimacy challenges which make it distinct
from the government and for-profit sectors. For example, although many nonprofits rely
on the government for grants and financial support, they are not solely dependent on
legislatures for funding or “their legal existence” (Gates & Hill 1995, 137).
Theories such as contract failure theory, public goods theory, and voluntary
theory explain the origins of the nonprofit sector and distinguish between the sectors
(Marwell & McInerney 2005). According to contract failure theory (Arrow 1963;
Hansmann 1980; Nelson & Krashinsky 1973) nonprofits exist to reduce information
asymmetry and supplement relationships between consumers and producers. Public
goods theory (Weisbrod 1977; 1988) argues that nonprofits exist to provide public goods
when demand is heterogeneous – when groups have preferences that differ from the
preferences of the median voter. According to public goods theory, when the government
provides public goods to meet the demands of the median voter it leaves gaps for the
provision of public goods to meet alternative voter desires and needs. Voluntary failure
theory (Salamon 1987; 1995) argues that nonprofits provide public goods whenever
possible, while governments supply public goods when they are beyond the scope of the
private and nonprofit sectors, for example national defense. Though these theories aim to
explain the origins of the nonprofit sector, they do not explain why nonprofit
organizations often exist along side public and private markets such as in the case of
hospitals and universities.

50
Nonprofit organizations face many challenges which are distinct from public and
private organizations. These distinctions include balancing the desires of leadership,
external sponsors, and boards of directors (Corder 2001; Hall 1992; Hansmann 1996;
Odendahl 1990; Weisbrod 1998); managing a complex labor force of paid and volunteer
staff (Brudney 1998a, 1998b; Carver 1990; Dayton 1987; McCurley 1994; Panus 1992;
Watson & Abzug 1994; Weisbord 1997; Wuthnow 1991); pursuing a public mission
while relying on a combination of external funding, donations, and earned income
(Drucker 1990; Frumkin & Andre-Clark 2000; Grønbjerg et al. 2000; Hall 1992; Hills-
Bush 1992; Kahn 1992; Kanter & Summers 1987; O’Connell 1988); managing complex
rules and external constraints (Weisbord 1997); and establishing accountability and
legitimacy with the public, investors, and clients (Chaskin 2003; Frumkin &
Golaswkiewicz 2004; Gates & Hill 1995; Irvin 2005; Kearns 1994). Research also
indicates that workers in the nonprofit sector compared to public sector workers report
stronger values for work that contributes to society and less value for opportunities for
advancement and challenging work (Lyons et al. 2006). For example, a recent survey
found that twice as many college students perceive working in the nonprofit sector as “a
form of public service” compared to working for the government (Partnership 2005).
Research also finds that nonprofit workers gain more satisfaction from their jobs and trust
their management more than public and business sector employees (Mirvis 1992). In
summary, there is a great deal of literature pointing to the distinctiveness of the nonprofit
sector.
Despite the distinctions between the public and nonprofit sectors, some
researchers note that sectoral differences are narrowing as nonprofit and public

51
organizations become more dependent on revenue generation to meet operational and
administrative costs (Salamon 2002) and become increasingly visible, commercial, and
businesslike (Cooper 2003; Dees & Anderson 2003; Frumkin & Andre-Clark 2000;
Haque 2001; Kearns 1994; Kettl 1993; Weisbrod 1998). Public organizations are facing
pressure to do more with less by drawing upon market resources and relationships with
the private sector through privatization and outsourcing, which has resulting in some
blurring between the private and public sectors (Kettl 1993; Osborne & Gaebler 1993;
Cooper 2002; Hood & Peters 2004; Savas 2000). Ott (2001, 216-217) notes that the
distinction between nonprofit organizations and private companies is also narrowing as
(1) for profit businesses become more involved with nonprofit-type work, (2) nonprofit
managers adopt more professional training and practices (Hall 1992, 209), (3) more
business executives serve on nonprofit boards of directors, and (4) nonprofits become
more involved in ventures and partnerships with for-profit organizations (Ryan 1999;
Stone 1996). Likewise, nonprofit organizations are becoming increasingly intertwined
with public organizations as they take on government contracts and the public and
nonprofit sectors increase their collaborative efforts and interdependence upon one
another (Ott & Dicke 2006).
Although some scholars (DiMaggio & Powell 1983) argue that the
homogenization of organizations and sectors is inevitable, I am in agreement with those
(Schneider 1987; Schneider et al. 1995) who argue that different types of organizations
attract, select, and retain different types of people, and that these differences can also be
found between sectors, thus warranting a separate consideration of these populations
(Bozeman & Bretschneider 1994; Hall 1992; Harpaz & Snir 2003; Lyons et al. 2006).

52
Next, with the support of the relevant literature, I present sector specific hypotheses for
mentoring work behavior outcomes.
Hypotheses and Literature: Sector Specific Mentoring
Time Spent at Work
There is a great deal of research focusing on hours worked, workaholism,
overworking, and absenteeism. Unfortunately, most of this research uses generic theories
and approaches to understand how much time individuals spend at work. There remains
little sector specific research focusing on the amount of time public and nonprofit sector
employees spend working each week.
Public administration research focusing on hours worked, workaholism, and
overworking is limited. This is most likely explained by the structure of work in the
public sector, including civil service restrictions, position classification, pay grade or pay
bands, and the role of unions in some state agencies (see Klingner & Nalbandian 1998;
Shafritz et al. 1992). Typically, public sector managers are salaried employees who work
35 to 40 hours per week. However, this is changing; especially as states decentralize
human resources and expand the number of at-will employees (Hays & Sowa 2006). For
example, in Georgia, approximately 72% of state employees are at-will hires. As the
number of at-will employees in a state expands, it follows that restrictions on the amount
of time an employee will spend at work each week can be weakened, thus encouraging
workers to spend more time at work, or enabling them to collect increased compensation
for overtime work.
Due to the complex personnel restrictions in the public sector, government
employees typically do not receive overtime pay or increased extrinsic rewards for

53
working overtime. For example, agencies in Illinois may limit the amount of overtime
employees work since the Illinois personnel code requires that state employees within the
jurisdiction of the Department of Central Management Services (CMS) receive
“compensatory time off for overtime or pay for overtime” (Personnel Code, Ch. 127, par.
63b108c). However, for Illinois state employees to regularly spend more time at work
than specified by the position the position must be “approved by the [CMS] Director and
designated on lists maintained by the Director” (2006, 81). The Personnel Rules go on to
specify that “Overtime work shall be distributed as equitably as possible among qualified
employees competent to perform the services required, when overtime is required” (2006,
81). Given the specifications required by the Illinois CMS for an employee to be
authorized to work and be compensated for extra time, it follows that there are
disincentives for state employees to spend extraordinary time at work.
Although research indicates that public sector workers value opportunities for
advancement and intellectually stimulating and challenging work more than nonprofit
workers (Crewson 1995, 94; Lyons et al. 2006) there is no evidence that public sector
workers are more likely to work overtime or stay late. In fact, research (Harpaz & Snir
2003) indicates that public sector employees, compared with private sector employees,
are less likely to be workaholics or to report working extended hours.
The lack of over time work in the public sector could be explained by the lack of
incentives and rewards for working late, or simply an organizational and cultural norm of
not working overtime. For example, Izraeli (1990) argues that individuals can be attracted
to the public sector because of a high need to control the time they spend at work, since
the public sector is known as a place where people can work towards public goals in a
54
work environment where hours are stable. Second, Buchanan (1974; 1975) notes that
people enter management positions in the public sector with specific motives (i.e. public
service motivation), but encounter frustrations that reduce their organizational
commitment, job involvement, and service ethic. It is possible that public sector workers,
despite their desire for challenging and intellectually stimulating work, adopt the work
habits of their peers and the organization, which can include not working overtime or
outside of the typical work day. Finally, the sectoral norms to not work overtime may be
reinforced by stereotypes about public sector workers and the actual hours that many
public offices are open. Public perceptions of government workers, or bureaucrats, as
“lazy, incompetent, devious, and even dangerous” (Goodsell 2004, 3) coupled with office
hours that rarely extend beyond 5pm and sometimes close earlier than that, there is little
reason to expect that state government employees will stay late or work extra hours for
which there is little to no reward.
Like the public sector, the nonprofit sector is not known for paying workers to
stay late. Although unpaid overtime is common in the nonprofit sector, research indicates
that a large number of nonprofit managers continue to choose to work overtime
(McMullen & Schellingburg 2003). In defiance of the dearth of financial rewards for
working overtime, I suspect that workers in nonprofit organizations will be more likely to
spend more time at work because of sectoral norms and expectations.
First, nonprofit organizations, in particular those with more than 20 full-time
employees, are more likely to offer flexible work hours to both men and women
(McMullen & Schellingburg 2003). Working flexible hours serves to expand the typical
work day beyond office hours and the physical walls of the organizations. Though an

55
organization may be open from 8am to 5pm, employees who work flexible hours become
more accustomed to working nontraditional hours, working from home, and working on
the road, which reduces the stigma of working overtime or spending more time working
each week.
Second, I assume that spending more time at work, beyond the typical 40 hour
work week, will be more common in the nonprofit sector where there are no civil service
restrictions, smaller organizations, and more prevalent role conflict and ambiguous job
duties (Mirvis & Hackett 1983). A lack of strict job descriptions and position
classification frees nonprofit workers to take on tasks beyond their job descriptions and
pay level. Furthermore, working in an environment with high role conflict and ambiguous
job duties it is more likely that there will be higher expectations for workers to take on
tasks, regardless of role and job duty, so that the organization can achieve its goals.
Finally, working in smaller organizations necessitates that workers take on more than
their share of work, and helps to ensure that coworkers are keenly aware of the amount of
work each individual is completing which adds pressure on employees to work extra
hours. Furthermore, given the reliance on volunteer labor in the nonprofit sector,
compared to the level of staff available in many public agencies, I assume that salaried
nonprofit managers will take on additional duties which require attention beyond the
typical day’s work hours. I expect that the combination of typically small organizations
and role conflict and ambiguous job duties will help to make nonprofit managers more
likely to work extra hours to complete tasks that further the organization’s mission.
I assume that working in the public sector is associated with stronger social and
sectoral norms and expectations to work no more than 40 hours a week. Assuming that

56
there is a general public sector culture which discourages working excessive hours, either
due to civil service restrictions or cultural norms, it follows that having a mentor will
ensure the transfer of this sectoral norm to public sector protégés. In addition, for the
nonprofit sector - where organizations tend to have fewer full-time, paid workers - there
will be a stronger norm for working longer hours per week which will be passed from
mentor to protégé. Despite the lack of research investigating time spent at work in the
public and nonprofit sectors, given the previous discussion of sectoral differences, the
assumptions outlined here, and previous mentoring research which indicates that
mentoring can affect absenteeism, socialization, and dedication, I predict that the amount
of time protégés spend at work will vary by sector.
H3: Protégé time spent at work will vary by sector. H4: Nonprofit managers who report having had a mentor will report spending more time at work compared to mentored respondents who work in the public sector.
Organizational Involvement
Research indicates that there are significant differences in wages, working
conditions, jobs, and work roles for employees in the private, nonprofit, and public
sectors (Mirvis & Hackett 1983). In addition, there is an abundance of public and
nonprofit sector research investigating worker motivation, incentives, and values
(Crewson 1997; Jurkiewickz et al. 1998; Lyons et al. 2006; Mirvis & Hackett 1983;
Schepers et al. 2005) though these studies tend to vary widely in method, sample design,
questionnaire content, and conclusions (Rainey 2003, 237-247).
Overall, nonprofit and public sector employees report higher intrinsic rewards
than those in for-profit organizations and a lower likelihood of receiving extrinsic
57
rewards such as increased pay or promotion (Mirvis & Hackett 1983; Wittmer 1991).
Public and nonprofit sector workers report similar levels of intrinsic gratification at work,
however public sector workers report significantly less autonomy and influence in the
work place and lower job commitment than nonprofit workers (Mirvis & Hackett 1983).
Research (Ruhm & Borkoski 2003) also indicates that nonprofit workers receive similar
pay as for-profit workers and that workers in the nonprofit sector, compared to the for
profit sector are more people oriented (Rawls & Nelson 1975; Rawls et al. 1975) and care
more about serving the public interest (Wittmer 1991) and advancing the organization’s
public service mission (Handy & Katz 1998).
Although there is a great deal of research investigating work life and motivation
among public, nonprofit, and for-profit private sector workers, and comparing work life
in the public sector with work life in the private sector (for examples see Balfour &
Wechsler 1990; 1991; Steinhaus & Perry 1996; White 1995) there is less research
comparing organizational involvement between public and nonprofit sector workers. In a
meta-analysis of research investigating job involvement by sector, Brown (1996) reports
that studies comparing public and private organizations find slightly significant
differences in job involvement between public and private sector workers, but, as of
1996, there was no research available comparing job involvement among nonprofit and
public sector employees. Brown (1996) concludes that, in general research shows that job
involvement is related to personality and situational variables, such as job and work
attitudes, but not related to demographic variables, behavioral work outcomes, or role
perceptions. In an earlier study of 270 business and government managers, Buchanan
(1974) reported that organizational experiences have an impact on managers'

58
organizational commitment attitudes and that these experiences vary with organizational
tenure, particularly at early career stages. Romzek and Hendricks (1982) concluded that
organizational involvement and individual employees’ allegiance to the government
agency is related to representative bureaucracy, concluding that self-reported levels of
organizational involvement depend on whether or not the agency has a substantive
representation mandate. In addition, Romzek (1989) found that, among public sector
workers, employee commitment can result in positive nonwork and career satisfactions,
which supports the idea that psychological attachment to the employing organization and
high levels of job commitment, or overworking, can result in personal gain.
There is a limited amount of research investigating job involvement and
organizational commitment in nonprofit organizations, though there is evidence that
nonprofit workers report more job commitment compared to public sector employees
(Mirvis & Hackett 1983; Borzaga & Tortia 2006). Notwithstanding the dearth of
organizational involvement research among nonprofit workers, there is widespread
evidence that the nonprofit sector attracts individuals who have a desire to serve the
public interest (Partnership 2005b; Goulet & Frank 2002). For example, individual
commitment to an organization or its mission helps nonprofit organizations to recruit and
retain volunteer workers, board members, and individual donations (Williams 2005).
Research indicates that personality, situational variables, and job and work
attitudes affect job involvement (Brown 1996) and that organizational commitment is
positively related to the desire to stay in an organization (Balfour & Wechsler 1991).
Given these findings, it follows that sectoral distinctions will attract individuals with
values and attitudes that align with a particular sector (Schneider 1987; Schneider et al.

59
1995) and that the convergence of individual characteristics and sectoral values will
affect organizational involvement, thus leading me to expect that:
H5: The relationship between mentoring and organizational involvement will vary by sector.
There are a number of reasons why employees may be attracted to state
government work, including public service motivation, a desire for job security, the
opportunity to work in a sector known for its equal opportunity hiring, and the need to
control the amount of time spent at work (Izraeli 1990). In comparison, workers are
typically attracted to the nonprofit sector in order to further the mission of a particular
organization, and these organizations are, on average, smaller in size, which requires
individual workers to demonstrate commitment by taking on extra work and possibly
spending more time at work and working extended hours. Assuming that requirements
for organizational involvement are higher in nonprofit organizations than in public
organizations, I expect that the relationship between mentoring and organizational
involvement will vary by sector. Furthermore, since nonprofit organizations depend on
volunteers and paid workers who are motivated by the organizations’ mission, I expect
that mentoring will play an important role in helping nonprofit organizations to nurture
involvement among workers which leads me to predict that mentored nonprofit managers
will report higher levels of organizational involvement than mentored public managers.
H6: Mentoring will play a larger role in increasing organizational involvement in the nonprofit sector than in the public sector.

60
Figure 2: Sector Specific Concept of Mentoring Outcomes
Figure 2 illustrates the investigation of mentoring outcomes with a sector specific
model. This figure, compared to Figure 1 has three distinct features. First, this illustration
applies to mentored respondents only. Second, the illustration splits the nonprofit and
public sector samples, thus eliminating threats of self-selection into sector. Third, the
models test for variations in type of mentoring (i.e. formal/informal and gender
composition of the dyad). Figure 2 illustrates that having a mentor is expected to
differently affect outcomes for public and nonprofit managers. For example, having a
mentor is expected to increase time spent at work and organizational involvement, but
more so for employees in the nonprofit sector than in the public sector.
Data and Models: Sector Specific Mentoring
The models investigating mentoring outcomes by sector are limited to the portion
of respondents from the NASP-III study who report having had a mentor (406 public
Time Spent
at Work
Organizational Involvement
Mentored Public Sector Employees
Mentored Nonprofit Sector
Employees
controls
+
+
controls Mentor controls
Mentor controls

61
sector respondents; 241 nonprofit sector respondents). A little more than half of all
respondents report having had a mentor (52% of public sector respondents; 57% of
nonprofit respondents). The sector specific models will use the same dependent variables
as the generic mentoring models: time spent at work and organizational involvement.
However, in addition to the independent variables discussed in the generic mentoring
section, the sector specific models will include variables specific to the mentorship which
enable the investigation of how mentorship characteristics relate to mentoring outcomes.
Rather than control for sector with a single independent variable, I present
separate models on the subpopulations of nonprofit and public sector managers. By
splitting the sample, I test whether or not the relationships between the each independent
variable and the outcomes vary by sector. A model using a single control for sector would
capture all the variance in the intercept. In comparison, the separate models on the
nonprofit and public sector subpopulations can provide significantly different beta
estimates on the independent variables, giving a more detailed understanding of how the
relationships between all of the variables differ by sector. In addition to the subpopulation
models, I ran Chow tests to determine if it would be appropriate to rule a pooled
regression, combining the public sector and nonprofit sector respondents. The Chow test
for the pooled regression on time spent at work was significant at the 0.05 level,
suggesting that the pooled model can be used (F (24,319): 1.7863: Prob.=0.05). However,
the Chow test for the pooled regression on organizational involvement is not significant,
suggesting that a pooled model of all observations disregarding possible differences in
variance between the two sectors is not appropriate, because the slope coefficients and
intercept of the subpopulation regression are significantly different (F (24,321): 0.8409).

62
(See Gujarati 2003 or Wooldridge 2003 for additional explanation of Chow tests). A
second advantage to running the split sample models is that this eliminates the need to
address the threat of self-selection into sector. By splitting the sample into one model for
nonprofit respondents and a second model for public sector respondents there is no threat
of the variable, sector, acting as a treatment effect.
Mentorship Related Control Variables
Because research indicates that mentoring outcomes vary based on the structure
and type of mentoring, I include a series of variables about the mentorship in order to get
a more detailed understanding of mentoring outcomes by sector. The mentorship related
control variables include: Organic, Internal, Duration, EndYear, and Female Mentor.
Formal mentoring programs, where organizations assign mentors and protégés
either randomly or by intentional matching, may not achieve the same outcomes that
emerge when mentors and protégés develop organic mentoring relationships. Research
indicates that organic mentorships produce more positive outcomes compared to both
formally mentored and nonmentored individuals (Chao et al. 1992; Eby & Allen 2002;
Fagenson-Eland et al. 1996; Heimann & Pittenger 1996; Ragins et al. 2000; Singh et al.
2002). I include the dummy variable, Organic, which is coded one if the relationship was
initiated by either the mentor or the protégé and zero if the mentorship was the result of a
formal organizational mentoring program.18 The majority of mentorships in this sample
are organic (see table 3.2). Among public sector respondents, 73% report engaging in
organic mentorships and 55% of those organic mentorships were initiated by the mentor.
18 The variable, organic, is developed from responses to the questionnaire item asking respondents to “Please indicate how your relationship with your mentor began.” Organic is coded zero if the mentor was assigned through a formal program and one if the relationship was organic – an informal mentorship initiated by either the mentor or the protégé.

63
One hundred and seventy one (84%) of the nonprofit respondents report having had an
organic mentorship, of which two thirds report that the mentor initiated the relationship.
Having an organic mentorship, compared to a formal mentorship is significantly
correlated to the amount of time a protégé spends at work (.125 at the 0.01 level).
Table 3.2: Comparison of Mentorship Type, by Sector Sector Mentorship Type Public Nonprofit Total Formal Mentorship 104 32 136
Organic Mentorship 285 171 456 The mentor was more active than I was in initiating an
informal mentoring relationship 158 109 267
I was more active than the mentor in initiating an informal mentoring relationship 127 62 189
Was/Is your mentor a member of your current organization? 272 85 357
I also include a dummy variable, Internal, which is coded one if the mentor
currently works in the same organization as the protégé. Though there is little research
investigating the variance in mentoring outcomes related to internal mentoring (Eby
1997), since I am interested in how mentoring is related to protégé time spent at work and
involvement in the current organization it makes sense that having an mentor in the same
organization will affect outcomes for the protégé, compared to having a mentor who
works in a different organization. More than half of the mentored respondents (57%)
report that the mentor is a member of the organization where the protégé is currently
employed (Table 3.2).
Another obvious point about mentorship characteristics is that time and duration
of the mentoring relationship will be related to outcomes for protégés. In general, most
empirical mentoring research controls for duration of mentoring (Godshalk & Sosik
64
2003; Ragins & McFarlin 1990) and finds mixed relationships between mentorship
duration and outcomes. Given the mixed results related to mentorship duration, I include
the variable, Duration, which indicates the duration of the mentorship using self-reported
responses for the year and month the mentorship began and ended. The average duration
of mentorships in the NASP-III sample is 71 months, nearly 6 years, and the mode
duration is one year. Duration is significantly correlated with the dependent variable, time
spent at work (.093), at the 0.05 level and with organizational involvement (.121) at the
0.01 level. In addition, I include the variable, EndYear,19 which indicates the month and
year the mentorship ended.20
Researchers have proposed that female-female mentoring relationships are more
efficient than cross gender mentorships for advancing women’s careers (Scandura &
Viator 1994; Ragins 1997a; 1997b) and that women are more likely to have male mentors
(Ragins 1989; Ragins & McFarlin 1990; Thomas 1990; Thomas & Alderfer 1989).
However, there is little evidence that outcomes for female protégés are related to having a
female mentor (Neumark & Gardecki 1998). Given the mixed research about cross-
gender mentorships (Clawson & Kram 1984; Noe 1988; Ragins 1989), I include a
dummy variable, Female Mentor, coded one if the mentor is female and zero it the
mentor is male.21 One third of the mentored respondents reported having a female
19 For the 155 respondents who indicated that the mentorship had not yet ended, I entered an end date of December 2005, the close of the survey. 20 It is possible that the variable EndYear indicates something about the time away from the mentorship and may give some indication about the decay of mentoring outcomes. I examined EndYear in connection with both of the dependent variables. EndYear is not significantly correlated with the amount of time a protégé spends at work (.004, sig. .926). EndYear is significant at the .05 level with organizational involvement (-.087, p. <.034). Once age is introduced in a partial correlation, (which is related to how both the duration of mentorships and how recently the relationship may have ended) the correlation between EndYear and organizational involvement vanishes (i.e. not significant). 21 In previous work I have tested models using the dummy variable, Gender Mix, which indicated if the gender of the mentor and protégé were not the same. This variable did not improve the models or relate to

65
mentor. One third of the mentored public sector respondents reported having had a
female mentor, compared to 28% of mentored nonprofit sector respondents. Among the
205 individuals who reported having a female mentor, 74% were female (see table 3.3).
Table 3.4 shows that having a female mentor is significantly negatively correlated with
the dependent variable, organizational involvement (-.126 at the 0.01 level).
Table 3.3: Comparing Female Mentors, by Sector and Protégé Gender
Public Sector
Nonprofit Sector Total
Protégé Male
Protégé Female Total
Female Mentor 139 62 201 54 151 205 Total 404 215 619 326 306 632
Table 3.4: Correlation: Mentorship Controls and Dependent Variables
Internal Mentor
Duration of mentorship
Organic Mentorship
Female Mentor
Time Spent at Work -.072 .093* .125** -.029
Org Involvement .009 .121** .035 -.126** ** Pearson Correlation is significant at the 0.01 level (2-tailed). * Pearson Correlation is significant at the 0.05 level (2-tailed). Control Variables
Similar to the Generic Mentoring Model, I include the four variables related to
protégé work motivation: Advancement Motivation, Job Security Motivation,
Financial Motivation, and Public Service Motivation. Security Motivation and
Advancement Motivation are scales from the factor analysis of the same questionnaire
items. Since I run separate models for the nonprofit and public sector samples, the saved
outcomes. I will not treat gender in mentorships as a factorial (e.g. male/female, m/m, f/m, f/f) because of the low percentage of female mentors matched with male protégés

66
factor scores used for Advancement Motivation and Job Security Motivation are drawn
from separate factor analyses for each sample. For example, the saved factor scores for
Advancement Motivation in the nonprofit sector are derived from a factor analysis of
work motivation among nonprofit respondents. The results for the factor analyses of the
questionnaire items for the subpopulations of nonprofit and public sector respondents are
presented in table 3.5 and table 3.6, respectively.22
Table 3.5: Factor Analysis for Security and Career Advancement Motivation Items in Nonprofit Sector Sample Security Advancement Opportunity for advancement within the organization’s hierarchy .442 .537 The organization’s pension or retirement plan .876 -.001 Desire for increased responsibility .097 .764 Benefits (medical, insurance) .889 -.016 Few, if any, alternative job offers .270 -.560 Extraction Method: Principal Component Analysis. Rotation Method: Varimax with Kaiser Normalization. Rotation converged in 3 iterations. Dimensions represent 60.427% of the common variance in the initial correlation matrix
Table 3.6: Factor Analysis for Security and Career Advancement Motivation Items in Public Sector Sample Security Advancement Opportunity for advancement within the organization’s hierarchy .218 .778 The organization’s pension or retirement plan .849 .199 Desire for increased responsibility -.023 .844 Benefits (medical, insurance) .879 .172 Few, if any, alternative job offers .421 -.290 Extraction Method: Principal Component Analysis. Rotation Method: Varimax with Kaiser Normalization. Rotation converged in 3 iterations. Dimensions represent 63.816% of the common variance in the initial correlation matrix
22 For the sector specific mentoring models I include the variables Advancement Motivation and Job Security Motivation which are scales from the factor analysis of the same questionnaire items as the full model. Since I ran separate models for the nonprofit and public sector samples, I saved factors scores from separate factor analyses using an orthogonal solution and Varimax rotation for each sample. See table 3.5
67
The sector specific models include the same control variables as the generic
mentoring model. I expect that the control for state will be particularly important since
government workers in Illinois have the option of belonging to unions while in Georgia
there are no unions, employees do not have collective bargaining rights,23 and
government employees hired after 1996 do not have civil service protections (Kellough &
Nigro 2002; Walters 2002). Furthermore, since direct regulation of nonprofit
organizations is primarily the responsibility of state government and state law, I expect
that nonprofit organizations will vary by state (Harvard Law Review 1992, 1636).
The models predicting time spent at work and organizational involvement for the
mentored respondents include the following variables:
Time spent at work = B0 + B1(mentor) + B2(MC1) + B3(MC2) + B4(MC3) + B5(MC4) + B6(MC5) + B7(M1) + B8(M2) + B9(M3) + B10(M4) + B11(SAC) + B12(WRC) + B 13 (DC) + E.
Organizational Involvement = B0 + B1(mentor) + B2(MC1) + B3(MC2) +
B4(MC3) + B5(MC4) + B6(MC5) + B7(M1) + B8(M2) + B9(M3) + B10(M4) + B11(SAC) + B12(WRC) + B 13 (DC) + E.
Nonprofit remains a primary independent variable of interest along with the
variables testing for the effects of various mentorship characteristics (MC1-MC5). M1
through M4 are the work motivation items; SAC is the social activities control; WRC are
the work-related controls; and DC are the demographic controls (see table 3.7).
and table 3.6 for the results from the factor analyses for the public sector sample and nonprofit sample, respectively. 23 Out of Georgia’s 248,900 public sectors employees, 3,000 are eligible for union membership. Metropolitan Rapid Transit Authority (MARTA) employees are the only state workers granted bargaining rights. MARTA employees are not included in the NASP-III sample.

68
Table 3.7: Variables in Mentoring Models
Dependent Variables Work-Related Controls (1) Time Spent at Work Current Job: Tenure (2) Organizational Involvement Current Job: Manager Previous Job: Private
Mentor Characteristics Current Job: Promotion Current Job: # Employees supervised
Internal / External Mentor Manager*Job Tenure Organic / Formal Mentor Female Mentor Duration of Mentorship Organizational Controls End-Year of Mentorship
Organization Size Work Motivation Controls Organization Age
Security Motivation Demographic Controls Public Service Motivation Financial Motivation Age Career Advancement Motivation Female
Georgia Social Activity Control Nonwhite
Number Children Total Civic Activities Married
Findings: Public and Nonprofit Sector Mentoring Time Spent at Work
After confirming the first set of hypotheses that mentoring positively affects
protégé time spent at work, I ran models predicting time spent at work among mentored
respondents, alone. In addition to controlling for protégé demographics, work
experiences, and motivations, I control for mentoring type. First I ran the full model of
mentored respondents with a single control for sector (see table 3.8). A Chow test
indicates that, in this case, a pooled model can be used since the F-statistic (1.7863) is
significant at the 0.05 level. The full model indicates that among mentored respondents,

69
nonprofit sector protégés spend, on average, nearly six more hours at work per week
compared to public sector protégés. In addition, protégés with increased public service
motivation report spending more time at work than those with low public service
motivation. Although current job tenure is negatively related to time spent at work, the
interaction variable of job tenure and being a manager is positively related to the amount
of time spent at work. Increases in age and civic activities also result in increased time
spent at work.
Table 3.8: Time Spent at Work for all Mentored Respondents
Beta Std. Error Nonprofit Sector 5.766+ 1.051 Internal Mentor 1.081 0.870 Organic Mentorship 0.748 0.923 Female Mentor -0.256 0.889 Mentor Duration -0.004 0.006 End Year 0.000 0.000 Financial Motivation 0.310 0.567 Public Service Motivation 0.797* 0.435 Security Motivation -0.596 0.419 Advancement Motivation 0.127 0.378 Current job: Manager 0.258 1.384 Current job: Promotion -0.407 0.870 Last job: Private organization -1.900 1.192 Current job: Tenure -0.338** 0.142 Manager*Tenure 0.253* 0.152 # of employees supervised 0.003 0.004 Female -0.723 0.841 Married -0.653 0.993 Nonwhite 0.125 1.074 Georgia 0.633 0.844 #Children -0.388 0.400 Age 0.099** 0.053 Total Civic Activities 0.641** 0.263 Org Size 0.000** 0.000 Org Age -0.017 0.011 (Constant) -27.381 101.923 P<.10=* , p<.05=** , p<.01+ two tailed test of significance R: 0.455; R2: 0.207; Adjusted R2: 0.149; Std. Error of the Estimate: 6.792
70
Because the full model results in all the sector variance falling into a single
independent variable and the intercept, I ran separate models on the subpopulations of
nonprofit and public sector respondents. By splitting the sample into two subpopulations,
I am able to test whether or not the relationships between each of the independent
variables and time spent at work, vary by sector. The separate nonprofit and public sector
models provide significantly different beta estimates on the independent variables, giving
a more detailed understanding of how the relationships between the variables differ by
sector. Furthermore, the split sample models eliminate the threat of biases caused by self-
selection into the public and nonprofit sectors.
Table 3.9 presents the results for the separate regressions predicting protégé time
spent at work for the public and nonprofit sector subpopulations. For public sector
protégés, an increase in the amount of time spent at work each week is significantly
related to job security motivation, having children, civic activities, and the employing
organization’s size and age. Specifically, public employees who report that job security
was an important motivation for taking their current job report working fewer hours per
week compared to those who were not motivated by job security. State government
employees with dependent children report spending significantly less time at work each
week compared to state employees with fewer or no children. The relationship between
increased children and time spent at work is not related to respondent gender. The
number of full time employees and the age of the employing organization are
significantly related to the amount of time state employees spend at work each week.
However, the affect of those significant relationships are minimal. Finally, an increase in

71
civic activities among state employees is significantly related to an increase in the
amount of time spent at work.
Table 3.9: Comparing Results for Protégé Time Spent at Work, by Sector
Nonprofit Sector Public Sector
Beta Std.
Error Beta Std.
Error Internal Mentor 1.898 1.669 1.535 1.014 Organic Mentorship 0.871 2.110 0.725 0.991 Female Mentor -1.922 1.762 -0.023 1.013 Mentor Duration -0.018 0.011 0.000 0.007 End Year 0.002+ 0.001 0.000 0.001 Financial Motivation 1.166 1.136 -0.183 0.638 Public Service Motivation 0.122 0.741 1.112 0.580 Security Motivation -0.954 0.824 -0.575+ 0.445 Advancement Motivation -0.120 0.678 0.436 0.458 Current job: Manager -4.524 3.380 1.117 1.494 Current job: Promotion -1.040 1.708 -0.883 1.012 Last job: Private organization -3.062 1.948 -1.796 1.646 Current job: Tenure -1.122** 0.502 -0.216 0.140 Manager*Tenure 0.952+ 0.504 0.178 0.152 # employees supervised -0.011 0.036 0.004 0.004 Female -4.133** 1.745 0.994 0.943 Married 1.320 2.107 -0.860 1.110 Nonwhite -0.291 3.457 -0.619 1.054 Georgia -4.503** 2.032 2.554 0.937 #Children -0.636 0.844 -0.442* 0.443 Age 0.102 0.113 0.098 0.059 Total Civic Activities 0.261 0.563 0.816+ 0.284 Org Size 0.000 0.001 0.000* 0.000 Org Age -0.011 0.022 -0.009+ 0.014 (Constant) -296.445 207.604 91.895 117.641 P<.10=* , p<.05=** , p<.01+ two tailed test of significance Public Model: R2: 0.240; Adjusted R2: 0.153; Std. Error of the Estimate: 6.014 Nonprofit Model: R2: 0.221; Adjusted R2: 0.046; Std. Error of the Estimate: 7.707
For mentored individuals working in nonprofit organizations, none of the work
motivation control variables are significantly related to the amount of time spent at work.
The duration of the current position, measured in years, is negatively associated with the
72
amount of time that a protégé in the nonprofit sector spends at work. However, the
interaction variable between job tenure and manager is positively related to time spent at
work. For protégés in the nonprofit sector, women report spending significantly less time
at work each week than men. Also, nonprofit respondents in Georgia report spending
significantly less time at work each week than in Illinois.24 Nonprofit sector protégés in
Georgia, on average, work four and a half fewer hours per week than those in Illinois,
holding all else constant.
For mentored public sector respondents, job security motivation is a negative
predictor of hours worked per week. Security motivation is not significantly related to
time nonprofit managers spend at work. For public sector respondents, security
motivation results in an average decrease of only 0.575 hours per week. This finding
indicates that job security motivation has significant outcomes for public sector workers,
but not for nonprofit workers. However, this finding may also be a result of more
widespread security motivation among public sector employees. For example, more than
half of the public sector respondents indicate that job security, the organization’s pension
or retirement plan, and benefits were very important motivations for taking the current
position, compared to 38%, 19%, and 35% of nonprofit respondents, respectively (See
table 3.10).
24 It is possible that this state difference in nonprofit respondents is driven by the type of nonprofits based in Georgia and Illinois. However, a correlation analysis found no significant relationships between type of nonprofit and state (-.050) and an Anova test found no significant relationship between type of nonprofit (e.g. 501(c)3) and state.

73
Table 3.10: Security Motivation Items, by Sector
Job security Public Nonprofit Total not important 28 33 61
somewhat unimportant 51 44 95 somewhat important 217 165 382
very important 491 149 640 Total 787 391 1178
Pearson Chi-Square 64.983 Asymp. Sig. (2-sided) .000
The organization’s pension or retirement plan Public Nonprofit Total
not important 41 69 110 somewhat unimportant 74 70 144
somewhat important 271 176 447 very important 402 75 477
Total 788 390 1178 Pearson Chi-Square 132.223
Asymp. Sig. (2-sided) .000 Benefits (medical, insurance) Public Nonprofit Total
not important 37 40 77 somewhat unimportant 57 47 104
somewhat important 245 165 410 very important 449 136 585
Total 788 388 1176 Pearson Chi-Square 54.395 Asymp. Sig. (2-sided) .000
Among public sector protégés, an increase in civic activities is significantly
related to an increase in the amount of time spent at work each week. Although previous
research indicates that nonprofit employees report more volunteerism than public sector
workers (Rotolo & Wilson 2006). In the case of protégés in the nonprofit sector, the
amount of civic activity is not significantly related to time spent at work. It is possible
that engaging in social and civic activities helps to empower public sector employees to
work longer hours, or is an indication of the type of person who is involved in social and
work life.

74
Gender is a significant negative predictor of time spent at work among protégés in
the nonprofit sector but not for public sector protégés. For the nonprofit protégés, women
spend an average four hours less per week at work than men, holding all else constant.
Previous research indicates that women are less likely than men to work long hours
(Harpaz & Snir 2003), but says nothing about how work hours may be related to sector or
mentoring. The difference in the relationship between gender and work hours by sector
found here could be explained by either over working among male protégés compared to
female protégés in the nonprofit sector or the tendency of male protégés in the public
sector not to work overtime or to spend the same amount of time at work as female
protégés in the public sector. If men in the public sector are not spending more hours at
work each week than women, there would be no significant relationship between gender
and work hours for public sector respondents.
Since overworking is not common among the public sector workers in this sample
and the public sector has a reputation for promoting family-friendly policies (Ban 2006;
Riccucci 2006; Shafritz et al. 1992), the gender difference in the nonprofit model is most
likely driven by male protégés in the nonprofit sector spending more time at work than
their female counterparts. The nonprofit sector has become a popular workplace for
women (Hall 1992) and is expected to have more family-friendly policies given societal
expectations for fairness in the nonprofit sector (see Gonyea 1999 for a review of
literature on family friendly policies in the nonprofit sector). Future research should
investigate this relationship to determine how time spent at work is related to positive or
negative outcomes for female protégés working in the nonprofit sector.

75
These models are also important for what is not significant. Mentorship type does
not significantly affect the outcomes of hours worked per week. I conclude that having a
mentor significantly increases the amount of time spent at work each week, in both the
nonprofit and public sectors, but that whether or not the respondent has a formal or
organic mentorship or whether or not the mentor works in the same organization as the
protégé or not, is not a significant factor in predicting time spent at work. This finding
indicates the importance of organizational support for mentoring, regardless of
mentorship type.
The models investigating time spent at work among protégés in the public and
nonprofit sectors support the third hypothesis that protégé time spent at work varies by
sector. Having had a mentor in the nonprofit sector, compared to the public sector, also
has a significant positive affect on time spent at work. The pooled regression and the
separate nonprofit and public sector models indicate support for the fourth hypothesis that
nonprofit managers who report having had a mentor report spending more time at work
compared to protégés in the public sector.
Organizational Involvement
After confirming the second hypothesis that having had a mentor positively
affects organizational involvement, I ran models predicting organizational involvement
among mentored respondents, alone, with the goal of investigating if mentoring varies by
sector and if so, how mentoring outcomes vary by sector. These models focus on NASP-
III respondents who report having had a mentor and controls for protégé demographics,

76
work experiences and motivations, and mentorship characteristics. Table 3.11 lists the
results from the nonprofit and public sectors models on organizational involvement.25
Table 3.11: Comparing Results for Organizational Involvement, by Sector Nonprofit Sector Public Sector Beta Std. Error Beta Std. Error Internal Mentor -0.095 0.398 0.034 0.380 Organic Mentorship -0.023 0.505 0.165 0.370 Female Mentor -0.188 0.421 -0.423 0.380 Mentor Duration 0.000 0.003 -0.002 0.002 End Year 0.000 0.000 0.000 0.000 Financial Motivation -0.134 0.275 -0.116 0.237 Public Service Motivation 0.081 0.178 0.249 0.217 Security Motivation 0.148 0.191 0.024 0.166 Advancement Motivation 0.350** 0.162 0.380** 0.170 Current job: Manager -0.435 0.808 1.139** 0.555 Current job: Promotion -0.001 0.408 -0.058 0.379 Last job: Private Org -0.391 0.469 -0.127 0.617 Current job: Tenure -0.062 0.120 0.071 0.052 Manager*Tenure 0.047 0.120 -0.085 0.057 # of employees supervised -0.002 0.009 0.004** 0.001 Female 0.266 0.416 0.050 0.352 Married 0.117 0.506 0.321 0.422 Nonwhite -2.013** 0.835 0.295 0.394 Georgia 0.098 0.476 1.218+ 0.352 #Children 0.243 0.208 -0.056 0.167 Age 0.104+ 0.026 0.069+ 0.022 Total Civic Activities 0.001 0.134 0.063 0.102 Org Size 0.000* 0.000 0.000 0.000 Org Age -0.002 0.005 -0.012** 0.005 (Constant) 37.243 48.607 39.600 43.452 P<.10=* , p<.05=** , p<.01+ two tailed test of significance Nonprofit Model: R: 0.558; R2: 0.311; Adjusted R2: 0.158; Std. Error of the Estimate: 1.847 Public Model: R: 0.499; R2: 0.249; Adjusted R2: 0.163; Std. Error of the Estimate: 2.254
25 Based on the computed F-value (0.8409) from the Chow test, I rejected the null hypothesis of parameter stability and concluded that the pooled regression is not appropriate for investigating the relationship of mentoring and organizational involvement, by sector. The intercept and coefficients of the public sector and nonprofit sector models are significantly different and cannot be pooled into a single regression.
77
Advancement motivation and age are both significant and positively related to
organizational involvement for protégés working in both the nonprofit and public sectors.
Besides the motivation for career advancement and protégé age, there are only a few
strong significant predictors of organizational involvement for protégés in the nonprofit
sector. For example, although the number of employees in the protégé’s organization is
significantly related to the protégé’s organizational involvement, that relationship is
negligible. For protégés in the nonprofit sector, being a minority is negatively related to
organizational involvement compared to being white.
For mentored individuals in the public sector, being a manager is significantly
related to an increase in organizational involvement. Furthermore, an increase in the
number of employees supervised by the protégé is also positively related to
organizational involvement. These findings point to a significant relationship between
protégé rank and higher organizational involvement. Unfortunately, these models do not
specify if higher rank, measured as being a manager and supervising more employees,
drives organizational involvement or if individuals with increased organizational
involvement are more likely to become managers. Finally, working in Georgia, compared
to Illinois, is positively related to organizational involvement for public sector protégés.
For both public and nonprofit sector protégés, the variables controlling for
mentorship type, duration, and gender composition are not significantly related to
organizational involvement. This finding indicates that although having had a mentor is
significantly and positively related to organizational involvement, the type of mentorship
is not.

78
Similar to the models predicting time spent at work, I investigated the possibility
of pooling the nonprofit and public sector regressions into a single model. After
conducting a Chow test on the subpopulation models predicting organizational
involvement for nonprofit and public sector protégés (F-value (0.8409)), I reject the null
hypothesis of parameter stability and concluded that the pooled regression is not
appropriate for investigating the relationship of mentoring and organizational
involvement, by sector. The intercept and coefficients of the public sector and nonprofit
sector models are significantly different and cannot be pooled into a single regression.
This test further supports the fifth hypothesis that the relationship between mentoring and
organizational involvement varies by sector. Unfortunately, because it is not appropriate
to run a pooled regression for organizational involvement, I cannot confirm the
hypothesis regarding the magnitude of the effect that mentoring has on increasing
organizational involvement in the nonprofit sector, compared to the public sector.
Therefore, I fail to reject or confirm the sixth hypothesis that mentoring plays a larger
role in increasing organizational involvement in the nonprofit sector than in the public
sector.
In summary, protégé work behavior, measured as time spent at work and
organizational involvement, significantly varies between the nonprofit and public sectors.
For nonprofit protégés, working in Georgia and being a woman significantly decreases
the amount of time spent at work and increased security motivation and age and being
white significantly increases organizational involvement. For public sector protégés, and
increase in the desire for job security and the number of children reduces the amount of
time spent at work each week, while an increase in civic activity increases time spent at

79
work. In addition, increased advancement motivation and rank and working in Georgia
are positively related to organizational involvement for public sector protégés.
Unfortunately, the OLS models presented in this chapter are limited in their
ability to compare and contrast the magnitude of effects for nonprofit and public sector
protégés. A multilevel model, compared to OLS or multilevel analysis of variance
(MANOVA) can be used when data are incomplete – as is often the case with survey data
– and does not assume that observations are independent. Unlike MANOVA, multilevel
modeling specifies direct effects of variables upon each other within one level and
between multiple levels. A multilevel model using random coefficient models is an
alternative method which enables the investigation of the proportion of variance that is
explained by individual and group level characteristics and gives a better picture of
variation in work behavior outcomes, by sector.

80
CHAPTER 4
VARIATION IN MENTORING OUTCOMES, MULTILEVEL MODELS
Multilevel Modeling: Sector Specific Mentoring
In addition to running the models on the nonprofit and public sector samples, I
use a multilevel modeling to investigate the proportion of variance in mentoring
outcomes that is explained by individual factors and sector. Hierarchical linear models
are most appropriate when data have a hierarchical structure and individual subjects
collect into groups which influence outcomes. Relying on methods, such as OLS
regression, which focus on individual outcomes as a unit of analysis and control for
group effects, can obscure the relationship between individual characteristics and group
and organizational effects. The multilevel model enables the investigation of individual
level and group level influences and the interactions between those levels by dropping the
OLS assumption of independence of observations (Bryk & Raudenbush 1992; Heinrich
& Lynn 1999) and allows for correlated error structures.
Hierarchical linear modeling (HLM) is becoming increasingly popular in
assessing individual and group level determinants of social outcomes. Multilevel
modeling is prominent in health (for example see Kindlon et al. 1996; Wyrwich &
Wolinsky 2000) and education studies (for example see Thomas et al. 1993; Gutman et
al. 2003; Lee & Loeb 2000; Coulton et al. 1999). More recently, public administration
scholars have called for an increase in the use of multilevel modeling (Heinrich & Lynn
1999). Buelens and Van den Broeck’s (2007) recent analysis of work motivation among
employees in public and private sector organizations is one example of how multilevel
modeling can be used in public administration research. Buelens and Van den Broeck’s

81
(2007) findings confirm previous research indicating that public sector employees are
less extrinsically motivated than private sector employees and conclude that hierarchical
level and differences in job content are more important in determining work motivation
than sectoral differences.
Of course, multivariate analysis of variance (MANOVA) can be used to assess
group level affects, however MANOVA investigates main and interaction effects of
categorical variables on multiple dependent interval variances using one or more
categorical variables as predictors. Multilevel modeling, on the other hand, is used for
analyzing data in a nested structure where lower-level units of analysis are nested within
higher-level units of analysis. HLM can be used to analyze categorical or continuous
dependent variables. HLM uses random coefficient models and can be used more easily
than MANOVA when the data are incomplete, which is often the case with survey data.
Most important, HLM does not assume independent observations and can be used when
intraclass correlation, a measure of the extent to which observations are not independent
of the second-level group variable, exists (Maas & Snijders 2003).
The multilevel modeling approach here enables the exploration of mentoring
outcomes given the disparate nature of the public and nonprofit sectors and investigates
the proportion of mentoring outcomes predicted by individual and group level
differences. The multilevel regression models include a within group model (Level 1) and
a between group model (Level 2). In this study, individual respondents and variables
related to individual job history, current job characteristics, mentorship characteristics,
and demographics constitute the first level of the analysis and the variable for sector

82
(nonprofit or public) and organizational controls (age and size) constitute the second
level.
Since I predict that mentoring results in increased time spent at work and
organizational involvement, which may or may not align with the interests of the
organization, it is important to understand how individual and group characteristics affect
outcomes. By using a multilevel model, I assess the proportion of mentoring outcomes
that relate to individual characteristics and experiences and group factors. It is possible
that public and nonprofit managers are similarly motivated but that their experiences
working in different sectors create different outcomes. For example, previous research
(Berman 1999) has found that though top managers in local government, social service
organizations, and museums demonstrate similar levels of professionalism the conditions
within public and nonprofit organizations differently affect employee levels of
professionalism over time. This multilevel model offers a useful tool for understanding
when and how distinctions between sectors affect mentoring outcomes.
Figure 3 illustrates how the hierarchical linear model operates. At the first level
the individual factors including mentorship characteristics, work motivation controls,
work-related controls, and demographics influence time spent at work and organizational
involvement. At the second level, group effects such as sector, organization age, and
organization size affect outcomes. The multilevel model not only separates individuals
and group factors, but calculates the proportion of variance at each level.

83
Figure 3: Multilevel Mentoring Concept of Mentoring Outcomes
Compared to Figure 2, the multilevel model predicts the mentoring outcomes for
all respondents and treats having a mentor as an equivalent treatment to all respondents.
The split sample model in Figure 2 predicts the outcomes for public sector employees
independent of the outcomes of nonprofit employees, and vice versa. Rather than separate
the public and nonprofit sector respondents into different models, as seen in Figure 2, the
multilevel model uses group and individual level factors to predict the outcomes of
mentoring for all respondents while, at the same time, allocating a proportion of the
causation to both levels. The reciprocal arrows between the level-1 variables and the
Time Spent
at Work
Organizational Involvement
Public Sector
Non-Profit
Sector
Individual Factors
Level 1 Demographic
Controls
+ +
Work Related Controls
Mentorship Characteristics
Work Motivation Controls
Group Factors
Level 2
Org Age
Org Size
84
level-2 variables illustrate the relationship between individuals and their group
environment (organization and sector). This research is particularly interested in how
sector and group factors differently affect outcomes for individuals compared to
individual factors.
Data Description and Model Format
I took the following steps to prepare the data to be imported into the newest
version of Raudenbush, Bryk, and Congdon’s HLM6 software. First, I removed all
respondents who did not report having had a mentor from the dataset, thus reducing the
analysis to the 625 individuals who reported having had a mentor. Second, I dealt with
the missing values in the dataset.
Although HLM6 has the capacity to run analyses with some missing data, there
are 22 variables which have missing cases. Thirteen of the variables have more than 10
missing cases and seven variables have more than 30 missing cases (See Appendix D).
HLM6 would not allow the creation of the Multivariate Data Matrix (MDM) file with
numerous missing cases. There are multiple options for dealing with these missing data.
The first two options require excluding missing data, either the cases or the variables.
First, I could delete all respondents with missing data. This option would have resulted in
the elimination of at least 89 respondents from the data. A second option would be to
delete the variables which have numerous missing data. For example, the following
variables were missing numerous responses: mentorship duration (53 missing) and
Organization Age (45 missing). Removing these variables, however, would make it
difficult to compare these models to the previous OLS regressions and would reduce the
number of variables at the second level causing the program to crash. Furthermore,

85
removing cases or variables increases the risk of reaching invalid and insignificant
results.
The third option is to develop a mechanism for filling in the missing data, such as
inputting the median or mode response. Instead of limiting the analysis to complete cases,
I chose to use all of the data by replacing missing values with estimates. Inputting
missing data increases the chance of reaching statistically significant results, retains a
larger sample size, and ensures that the hierarchical linear models have the same
variables as the previous regression models. Estimating missing values removes hidden
bias which may emerge if missing values were simply deleted and ensures that all groups,
even those with low responses, are represented in the analysis. Assigning values to the
missing data maintains a larger number of respondents and retains all variables from the
previous OLS regressions. After conducting a Missing Value Analysis and examining the
data from several angles, I inputted missing values through expectation maximization
(EM) algorithms (see Allison (2001) and Little & Rubin (1987) for more on missing data
analysis). Expectation maximization algorithms enable the diagnosis of serious missing
data imputation problems and the replacement of missing values with estimates.
Having used EM algorithms to input values for all missing data, I created the
Multivariate Data Matrix (MDM) file in the HLM6 program. The MDM level-1 file has
625 cases and 22 variables. The MDM level-2 file has 228 cases and 3 variables. In order
to match the level-1 and level-2 files, it was necessary to identify a variable to which all
individuals could be grouped at the second level.
Because there are only two sectors in this analysis, nonprofit and public, there are
not enough groups to categorize the individual protégés. The binary variable, Sector, is

86
not a sufficient variable for grouping individuals because it would put individuals into
two groups and HLM6 requires that there be multiple groups. I was not able to categorize
the groups by agency type (regulatory, distributive, and redistributive) since there is no
comparable grouping for nonprofit organizations. Likewise, the categories of nonprofit
type (e.g. 501(c)3 or 501(c)6) lack a comparable public sector grouping. As a
compromise, the second level of the analysis includes all group level variables above the
individual level, including organizational and sector groupings.
I developed an organizational identification variable for all mentored respondents.
The variable, Organizational ID, groups respondents by employer organizations.
Organizational ID has the advantage of providing multiple groups for the level-2 analysis
and ensuring that public and nonprofit respondents do not overlap in groupings. The 406
mentored public sector respondents are from 52 public agencies in Georgia and Illinois.
Because many of the nonprofit respondents were the single respondent for the
organization, there are a total of 172 nonprofit organizations for the 219 mentored
nonprofit respondents.
The analyses predicting time spent at work and organizational involvement use
the same predictor variables, independent variables, and controls. The within
organization model (level 1) estimates the influence of individual work, mentorship, and
demographic characteristics on time spent at work.
The individual Level 1 model is:
Y = B0 + B1*(Security Motivation) + B2*(Advancement Motivation) + B3*(Financial Motivation) + B4*(Public Service Motivation) + B5*(Total Civic Activities) + B6*(Internal) + B7*(Organic) + B8*(Mentor Female) + B9*(Mentor Duration) + B10*(EndYear) + B11*(Age) + B12*(Female) + B13*(Georgia) + B14*(Nonwhite) + B15*(#Children) + B16*(Married) + B17*(Current Job Tenure) + B18*(Manager) +

87
B19*(Previous Job Private) + B20*( Current Job Promotion) + B21*(#Employees Supervised) + B22*(manager_tenure) + R
The between organizations model (Level 2) estimates the influence of organization size, organization age, and sector on time spent at work and organizational involvement.
The Level-2 model is: B0 = G00 + G01*(Sector) + G02*(Org Age) + G03*(Org Size) + U0 B1 = G10 B2 = G20 B3 = G30 B4 = G40 B5 = G50 B6 = G60 B7 = G70 B8 = G80 B9 = G90 B = G100 B11 = G110 B12 = G120 B13 = G130 B14 = G140 B15 = G150 B16 = G160 B17 = G170 B18 =18 G180 B19 = G190 B20 = G200 B21 = G210 B22 = G220

88
Time Spent at Work
The analysis involved separate and then simultaneous models for the dependent
variable, time spent at work. The model includes a within group model (Level 1) and a
between group model (Level 2). The between group model captures sectoral differences.
Null Model. The preliminary analysis in HLM assesses the null form of the model
and examines the variance of the dependent variable across the individual and group
levels (see table 4.1 for null model results). The null or unconstrained model calculates
the intraclass correlation coefficient (ICC) and is the multilevel model without level-1
and level-2 predictors. In the time spent at work null model, the ICC is .333. This means
that groups (organization and sector) account for 33% of the variability in time spent at
work among protégés in this sample. The differences in time spent at work at the
individual and group levels are statistically significant (P-value: 0.000). The ICC
indicates that the observations are not independent and that a multilevel model
incorporating group and individuals characteristics is appropriate, thus providing
statistical support for the use of a multilevel model instead of multivariate analysis of
variance (MANOVA) or similar analyses. Protégés in nonprofit organizations are more
likely to be similar to each other than they are to protégés in public organizations. The
estimate for Intercept1, B0, Intercept2, G00 is 49 which is the average value of the
dependent variable across all subjects.

89
Table 4.1: Time Spent at Work Null Model
Level-1 Model: Y = B0 + R Level-2 Model: B0 = G00 + U0 Sigma squared = 44.13075 Tau: INTRCPT1, B0 22.04632 Tau (as correlations): INTRCPT1,B0 1.000 Reliability estimate: 0.431 The value of the likelihood function at iteration 12= -2.144095E+003
Final estimation of fixed effects Fixed Effect Coefficient S.E. T-ratio df P-value
For Intercept1, B0 Intercept2, G00 49.125 0.474 103.681 227 0.000
Final estimation of variance components Random Effect Std Deviation Variance df Chi2 P-value Intercept1 (U0) 4.695 22.046 227 489.549 0.000 level-1 (R) 6.643 44.131 ICC .333
Full Model. The next step in the HLM modeling is to analyze the improvement in
predictions with the full model as compared to the null model (see table 4.2 for full
model results). The ICC for the full model is 16% compared to 33% in the null model.
The multilevel model, controlling for sector and organization age and size explains
approximately half of the variability in protégé time spent at work.

90
Table 4.2: Final Estimation of Fixed Effects Time Spent at Work Full Model Coefficient Std Error T-Ratio P-value Level-1 – Organization (df=224) Intercept1, B0 Intercept2, G00 17.325848 80.232 0.216 0.829 Nonprofit 4.806+ 0.973 4.938 0.000 Org Age -0.016 0.011 -1.545 0.124 Org Size 0.000140 0.000113 1.245 0.215 Level – 2 Individual (df=599) Security Motivation -1.068+ 0.323 -3.310 0.001 Advancement Motivation 0.250 0.306 0.817 0.414 Financial Motivation 0.349 0.427 0.819 0.413 Public Service Motivation 0.870** 0.343 2.541 0.012 Total Civic Activities 0.763+ 0.200 3.818 0.000 Internal Mentor 0.372 0.642 0.579 0.562 Organic Mentor 1.190* 0.687 1.734 0.083 Female Mentor 0.177 0.674 0.262 0.793 Mentorship Duration -0.000232 0.005 -0.050 0.961 EndYear 0.000243 0.000385 0.631 0.528 Age 0.075* 0.041 1.850 0.064 Female -1.306** 0.620 -2.106 0.035 Georgia 1.551* 0.844 1.837 0.066 Nonwhite 0.455 0.818 0.556 0.578 #Children -0.389 0.281 -1.388 0.166 Married -0.660 0.720 -0.916 0.360 Job Tenure -0.184* 0.096 -1.927 0.054 Job Manager 1.200 1.002 1.198 0.232 Previous Job Private 6.055 2.523 2.400 0.017 Job: Promotion 0.921 0.634 1.453 0.147 #Employees supervised 0.008** 0.003 2.253 0.025 Manager*Tenure 0.167 0.105 1.588 0.113 p<.10=*, p<.05=**, p<.01+
Reliability estimate: 0.246 The value of the likelihood function at iteration 21 = -2.103575E+003
Final estimation of variance components Random Effect Std Deviation Variance df Chi2 P-value Intercept1 (U0) 2.791 7.787 224 334.179 0.000 level-1 (R) 6.445 41.540 ICC (.158)

91
The estimate for G00 in the full model is 17.326, which is the expected dependent
variable when all predictor values are zero. In general, the multilevel model finds that the
same significant relationships as the OLS regression models (See table 4.3). For example,
sector, total civic activities, public service motivation, security motivation, gender, state,
job tenure, and age are all significant in the HLM and OLS models. The estimated
coefficient of 4.806 for nonprofit protégés indicates the effect of being in a nonprofit
organization on time spent at work compared to being in a public organization. More
specifically, protégés in nonprofit organizations spend 4.8 more hours at work each week
than their counterparts in public organizations.
The proportion of variance assigned to level-1 and level-2 variables in the
multilevel model of time spent at work model is of particular interest to this study. The
reduction in the variance component from the null model level-1 (from 44.13 to 41.54)
and level-2 (from 22.05 to 7.79) indicates that some of the variance in time spent at work
is explained by the full model. The following formula is used to obtain the within- and
between-unit variance explained by the full model (unrestricted error – restricted error) /
unrestricted error) (Kreft & de Leeuw 1998; Singer 1998). The within-unit variance is
0.0587, indicating that the level-1 variables in the full model explain 6% of the
explainable within-unit variance in time spent at work. The between-unit variance is
0.647, showing that the level-2 variables in the full model explain 65% of the explainable
between-unit variance in time spent at work.

92
Table 4.3: Significant Predictors of Time Spent at Work OLS Compared to HLM
Variables OLS
pooled model
OLS Nonprofit
OLS Public HLM
Nonprofit 5.766+ - - 4.806+ Org Age -0.017 -0.011 -0.009+ -0.016 Org Size 0.000** 0.000 0.000* 0.0001 Security Motivation -0.596 -0.954 -0.575+ -1.068+ Advancement Motivation 0.127 -0.120 0.436 0.250 Financial Motivation 0.310 1.166 -0.183 0.349 Public Service Motivation 0.797* 0.122 1.112 0.870** Total Civic Activities 0.641** 0.261 0.816+ 0.763+ Internal Mentor 1.081 1.898 1.535 0.372 Organic Mentor 0.748 0.871 0.725 1.190* Female Mentor -0.256 -1.922 -0.023 0.177 Mentor Duration -0.004 -0.018 0.000 -0.0002 End Year 0.000 0.002+ 0.000 0.0002 Age 0.099** 0.102 0.098 0.075* Female -0.723 -4.133** 0.994 -1.306** Georgia 0.633 -4.503** 2.554 1.551* Nonwhite 0.125 -0.291 -0.619 0.455 #Children -0.388 -0.636 -0.442* -0.389 Married -0.653 1.320 -0.860 -0.660 Current Job: Tenure -0.338** -1.122** -0.216 -0.184* Current Job: Manager 0.258 -4.524 1.117 1.200 Previous Job Private -1.900 -3.062 -1.796 6.055 Current Job: Promotion -0.407 -1.040 -0.883 0.921 #Employees supervised 0.003 -0.011 0.004 0.008** Manager*Tenure 0.253* 0.952+ 0.178 0.167 P<.10=*, p<.05=**, p<.01+
OLS results found in Chapter Three
The multilevel model indicates that individual factors such as mentorship, work,
and demographic characteristics explain a smaller proportion of variance in time spent at
work compared to group level characteristics to organization age, size, and sector. This
hierarchical level model supports the hypothesis that sector plays a significant and strong
role in the amount of time that protégés spent at work.
H3: Protégé time spent at work will vary by sector.

93
Furthermore, the multilevel model confirms that:
H4: Nonprofit managers who report having had a mentor report spending more time at work compared to mentored respondents who work in the public sector.
In addition, the multilevel model indicates that sector explains a larger proportion of the
variance in the amount of time that protégés spend at work than all of the individual level
variables in this analysis combined.
Organizational Involvement
Null Model. In the null model for organizational involvement, the estimate for the
level-2 variance is 1.25 and for level-1 is 6.07 (see table 4.4 for null model). The null
model for organizational involvement has an intraclass correlation coefficient (ICC) of
.170, indicating that groups (organization and sector) account for 17% of the variability in
organizational involvement among protégés in this sample. The differences in
organizational involvement at the individual and group levels are statistically significant
(P-value: 0.000). The ICC indicates that the observations are not independent and that a
multilevel model is appropriate. The estimate for Intercept1, B0, Intercept2, G00 is 17.618
which is the average value of the dependent variable, organizational involvement, across
all subjects.
Full Model. The full model of organizational involvement explains .3% of the
within group variation and 5% of the variation at Level-1 of the null model. The ICC for
the full model is 5% compared to 17% in the null model (see table 4.5 for results). The
multilevel model, controlling for sector and organization age and size explains
approximately one third of the variability in organizational involvement.

94
Table 4.4: Organizational Involvement Null Model
Level-1 Model: Y = B0 + R Level-2 Model: B = G00 + U0 Sigma squared = 6.06898 Tau: INTRCPT1, B0 1.24529 Tau (as correlations): INTRCPT1,B0 1.000 Reliability estimate: 0.260 The value of the likelihood function at iteration 61= -1.490670E+003
Final estimation of fixed effects Fixed Effect Coefficient S.E. T-ratio df P-value
For Intercept1, B0 Intercept2, G00 17.618 0.145 121.59 227 0.000
Final estimation of variance components Random Effect Std Deviation Variance df Chi2 P-value Intercept1 (U0) 1.116 1.245 227 335.775 0.000 level-1 (R) 2.463 6.069 ICC (.170)
The estimate for Intercept1, B0, Intercept2, G00 in the full model is 34.888, which
is the expected value of organizational involvement when all the predictor values are
zero. The reduction in the variance component from the null model level-1 (from 6.07 to
5.23) and level-2 (from 1.25 to 0.29) indicates that some of the variance in organizational
involvement is explained by the multilevel models. Specifically, using the within- and
between-unit variance formula (Kreft & de Leeuw 1998; Singer 1998), the level-1
variables in the full model explain 16% of the within-unit variance and the level-2
variables explain 77% of the between-unit variance in organizational involvement.
However, the remaining variance components for level-1 (5.23) and level-2 (0.29) are
evidence that there are additional predicators of organizational involvement that are
absent from this model.

95
Table 4.5: Final Estimation of Fixed Effects Organizational Involvement Full Model Coefficien
t Std Error T-Ratio P-value
Level-1 (df=224) Intercept1, B0 Intercept2, G00 34.888 27.434 1.272 0.205 Nonprofit 1.690+ 0.290 5.821 0.000 Org Age -0.004 0.003 -1.330 0.185 Org Size 0.000 0.000 -0.514 0.607 Level-2 (df=599) Security Motivation -0.056 0.111 0.505 0.613 Advancement Motivation 0.477+ 0.105 4.529 0.000 Financial Motivation 0.189 0.147 1.278 0.202 Public Service Motivation 0.322+ 0.117 2.753 0.007 Total Civic Activities 0.066 0.069 0.949 0.343 Internal Mentor 0.465** 0.221 2.104 0.036 Organic Mentor -0.031 0.238 0.131 0.896 Female Mentor -0.533** 0.231 -2.305 0.022 Mentorship Duration 0.001 0.002 0.927 0.354 EndYear 0.000 0.000 -0.630 0.529 Age 0.063+ 0.014 4.501 0.000 Female 0.320 0.214 1.496 0.135 Georgia 0.951+ 0.249 3.820 0.000 Nonwhite 0.367 0.282 1.300 0.194 #Children 0.086 0.097 0.888 0.375 Married 0.407 0.248 1.637 0. 102 Job Tenure 0.021 0.033 0.634 0.526 Job Manager 0.680** 0.347 1.960 0.050 Previous Job Private -0.951 0.836 -1.137 0. 256 Job: Promotion -0.026 0.219 -0.119 0.906 #Employees supervised 0.004+ 0.001 3.000 0.003 Manager*Tenure -0.031 0.037 -0.856 0.393 p<.10=*, p<.05=**, p<.01+ Reliability estimate: 0.104 Value of the likelihood function at iteration 21 = -1.461581E+003
Final estimation of variance components Random Effect Std Deviation Variance df Chi2 P-value Intercept1 (U0) 0.536 0.287 224 217.97
4 >.500
level-1 (R) 2.288 5.234 ICC (.052)

96
Similar to the OLS models predicting organizational involvement, the HLM
results indicate that advancement motivation, protégé age, Georgia, current job: tenure,
and the number of employees supervised are significant predictors of organizational
involvement. Public service motivation (PSM) in the multilevel model is a significant
predictor of organizational involvement. This finding is interesting because it indicates
that PSM, as an individual level variable is related to organizational involvement. It is
possible that in the OLS models, the effects of PSM on organizational involvement were
captured by the error term or the group level variables. Furthermore, though none of the
mentorship characteristics were significant in the OLS regression models, the multilevel
model results indicate that having had a mentor in the same organization as the protégé is
positively associated with organizational involvement. Second, having had a female
mentor is significantly negatively related to organizational involvement.
The variable of primary interest to this research is the level-2 variable, nonprofit.
Working in a nonprofit organization, compared to a public organization, has the effect of
increasing organizational involvement by 1.69. This significant, positive relationship
supports the fifth hypothesis:
H5: The relationship between mentoring and organizational involvement varies by sector. In addition, the results of the HLM support hypothesis six. The multilevel analysis
enabled the comparison of the two groups (nonprofit and public sector protégés) which
was inappropriate using the OLS regression analysis.26 Even though the sub-sample
models in Chapter Three were inconclusive about whether or not mentoring plays a larger
26 Note: The Chow tests on the OLS regression in Chapter Three indicated that a pooled regression for nonprofit and public sector protégés was inappropriate.

97
role in increasing organizational involvement in the nonprofit sector than the public
sector, the HLM supports the hypothesis:
H6: Mentoring plays a larger role in increasing organizational involvement in the nonprofit sector than in the public sector.
Table 4.6: Significant Predictors of Organizational Involvement: OLS and HLM
Variables OLS Nonprofit
OLS Public HLM
Nonprofit - - 1.690+ Org Age -0.002 -0.012** -0.004 Org Size 0.000* 0.000 0.000 Security Motivation 0.148 0.024 -0.056 Advancement Motivation 0.350** 0.380** 0.477+ Financial Motivation -0.134 -0.116 0.189 Public Service Motivation 0.081 0.249 0.322+ Total Civic Activities 0.001 0.063 0.066 Internal Mentor -0.095 0.034 0.465** Organic Mentor -0.023 0.165 -0.031 Female Mentor -0.188 -0.423 -0.533** Mentor Duration 0.000 -0.002 0.001 End Year 0.000 0.000 0.000 Age 0.104+ 0.069+ 0.063+ Female 0.266 0.050 0.320 Georgia 0.098 1.218+ 0.951+ Nonwhite -2.013** 0.295 0.367 #Children 0.243 -0.056 0.086 Married 0.117 0.321 0.407 Current Job: Tenure -0.062 0.071 0.021 Current Job: Manager -0.435 1.139** 0.680** Previous Job Private -0.391 -0.127 -0.951 Current Job: Promotion -0.001 -0.058 -0.026 #Employees supervised -0.002 0.004** 0.004+ Manager*Tenure 0.047 -0.085 -0.031 P<.10=*, p<.05=**, p<.01+
In summary, the multilevel model indicates that the behavioral outcomes of
mentoring do, indeed, vary by sector (see table 4.7). First, having had a mentor
significantly increases the amount of time spent at work each week and organizational
involvement for all protégés, regardless of sector. Second, having had a mentor

98
significantly increases time spent at work and organizational involvement to a larger
extent for nonprofit protégés as compared to protégés working in the public sector. Third,
the multilevel models indicate that individual factors explain 6% and 16% of the within-
unit variance in organizational involvement and time spent at work, respectively. The
group level variables, largely driven by the dummy variable for nonprofit and public
sector, explain 65% of the between-unit variance in organizational involvement and 77%
of the between-unit variance in time spent at work.
Fourth, the multilevel models, unlike the OLS models, indicate that mentorship
characteristics are significantly related to within-unit variance in work behavior, though it
is important to remember that only a small portion of within-unit variance in the work
behavior measures is explained by the level-1 independent variables. It is possible that
the effects of mentorship characteristics fell into the error term in the OLS models, but
appear in the multilevel model because the individual and group level variables are
allowed to interact and the individual and group affects are no longer obscured. By
dropping the OLS assumption of the independence of observations, the multilevel model
allows for correlated error structures that can enable significant variables such as these
mentorship characteristics to emerge.
The multilevel models indicate that first, protégés who report having organic
mentorships spend, on average, 1.19 more hours at work per week than protégés who
report having mentors which were formally arranged by organizations or formal
programs. Second, having a female mentor significantly lowers organizational
involvement and having an internal mentor compared to a mentor in a different
organization is positively related to organizational involvement. These findings indicate

99
that though having a mentor, in general, increases protégé time spent at work and
organizational involvement, work behavior may also be influenced by the nature of the
mentorship and the role that organizations play in matching mentors and protégés.
Table 4.7: Summary: HLM Results Predicting Work Behavior Mentoring Outcomes Time Spent at Work Organizational Involvement
Level-1 – Organization Coeff. SE P-value Coeff. SE P-value INTRCPT1, B0 INTRCPT2, G00 17.326 80.232 0.829 34.888 27.434 0.205 Nonprofit 4.806 0.973 0.000+ 1.690 0.290 0.000+ Org Age -0.016 0.011 0.124 -0.004 0.003 0.185 Org Size 0.000140 0.000113 0.215 0.000 0.000 0.607 Level – 2 Individual Security Motivation -1.068 0.323 0.001+ -0.056 0.111 0.613 Advancement Motivation 0.250 0.306 0.414 0.477 0.105 0.000+ Financial Motivation 0.349 0.427 0.413 0.189 0.147 0.202 Public Service Motivation 0.870 0.343 0.012** 0.322 0.117 0.007+ Total Civic Activities 0.763 0.200 0.000+ 0.066 0.069 0.343 Internal Mentor 0.372 0.642 0.562 0.465 0.221 0.036** Organic Mentor 1.190 0.687 0.083* -0.031 0.238 0.896 Female Mentor 0.177 0.674 0.793 -0.533 0.231 0.022** Mentorship Duration -0.000232 0.005 0.961 0.001 0.002 0.354 EndYear 0.000243 0.000385 0.528 0.000 0.000 0.529 Age 0.075 0.041 0.064* 0.063 0.014 0.000+ Female -1.306 0.620 0.035** 0.320 0.214 0.135 Georgia 1.551 0.844 0.066* 0.951 0.249 0.000+ Nonwhite 0.455 0.818 0.578 0.367 0.282 0.194 #Children -0.389 0.281 0.166 0.086 0.097 0.375 Married -0.660 0.720 0.360 0.407 0.248 0. 102 Job Tenure -0.184 0.096 0.054* 0.021 0.033 0.526 Job Manager 1.200 1.002 0.232 0.680 0.347 0.050** Previous Job Private 6.055 2.523 0.017 -0.951 0.836 0. 256 Job: Promotion 0.921 0.634 0.147 -0.026 0.219 0.906 #Employees supervised 0.008 0.003 0.025** 0.004 0.001 0.003+ Manager*Tenure 0.167 0.105 0.113 -0.031 0.037 0.393 Components Null Full Null Full Within Groups (R level1) 44.13 41.54 6.07 5.23 Between Groups (U0 level2) 22.05 7.79 1.25 0.29 % of Variance Explained % of Variance Explained Within Groups (R level1) 6% 16%
Between Groups (U0 level2) 65% 77%
P<.10=*, p<.05=**, p<.01+
100
CHAPTER 5
RESULTS AND DISCUSSION
This research uses OLS regression and multilevel modeling to investigate the
following research questions: Does mentoring affect protégé time spent at work and
organizational involvement? And, how do protégé time spent at work and organizational
involvement vary by sector? To answer the first question, this study compares time spent
at work and organizational involvement between mentored and non-mentored individuals
in the NASP-III sample. The data indicate that having had a mentor is significantly
related to the amount of time a protégé spends at work each week and organizational
involvement among protégés.
To answer the second research question, this study investigates the differences in
mentoring outcomes between employees in nonprofit and public organizations. The data
indicate that the effects of having a mentor on time spent at work and organizational
involvement vary by sector and that having a mentor in the nonprofit sector, compared to
the public sector, has a larger affect on work behavior outcomes. Finally, the multilevel
model indicates the proportion of outcome variance attributed to individual and group
level factors.
Summary of Findings
Preliminary Analysis. The preliminary analysis in Chapter One investigates the
effects of mentoring among public and nonprofit managers; comparing mentored
individuals to nonmentored individuals the analysis indicates that having had a mentor is
significantly related to time spent at work and organizational involvement. First, the
preliminary analysis on the full NASP-III sample indicates support for the first
101
hypothesis that having had a mentor positively affects the amount of time an individual
spends at work. In fact, having had a mentor increases the amount of time spent at work
by an average of 1.7 hours per week, holding all else constant. Second, the preliminary
analysis indicates support for the second hypothesis that having had a mentor positively
affects individual organizational involvement. This research adds to the existing
mentoring literature by identifying two new behavioral outcomes of mentorships. Having
had a mentor significantly affects the amount of time a protégé spends at work and a
protégé’s level of organizational involvement. These are important outcomes because
they point to significant changes in protégé behavior. These behavioral outcomes are
further investigated in the analysis of mentored respondents which examines sectoral
distinctions in mentoring outcomes.
Analysis of Mentored Respondents. The results of the analysis of mentored
respondents, presented in Chapter Three, indicate that the mentoring outcomes of time
spent at work and organizational involvement significantly vary by sector. The models
predicting time spent at work support the third hypothesis that protégé time spent at work
varies by sector. The sector-based models and pooled regression predicting time spent at
work also support the fourth hypotheses that nonprofit managers who report having had a
mentor spend more time at work compared to mentored respondents in the public sector.
The results from the model predicting organizational involvement support the
fifth hypothesis that the relationships between mentoring and organizational involvement
vary by sector. Unfortunately, because it is not appropriate to pool the nonprofit and
public sector regressions on organizational involvement, it is difficult to test the sixth
hypothesis that having had a mentor plays a larger role in increasing organizational

102
involvement in the nonprofit sector than in the public sector. The preliminary analysis on
organizational involvement indicated that nonprofit respondents reported increased
organizational involvement, compared to public sector respondents and that having a
mentor is significantly related to increased organizational involvement. However, among
mentored respondents, the two samples cannot be combined into a pooled regression to
test the magnitude of variance in the mentoring outcomes of organizational involvement
for mentored respondents. The final analysis using multilevel methods elucidates this
relationship between sector variance and organizational involvement.
Multilevel Analysis of Mentored Respondents. The multilevel analysis, presented
in Chapter Four, supports the OLS findings that having had a mentor is significantly
related to the outcomes of time spent at work and organizational involvement and that
these relationships vary between the public and nonprofit sectors. The multilevel model
has the advantage of indicating how much of the variance in outcomes is due to
individual factors, such as work motivation, job history, current job characteristics,
mentorship characteristics, and demographic characteristics and how much of the
variance can be attributed to group level factors including organization age, organization
size, and sector.
The multilevel model predicting time spent at work indicates that group factors
account for some of the variation in time spent at work. Six percent of the explainable
within-unit variance in time spent at work is explained by the level-1 variables, or
individual factors in the model. The level-2 variables, in comparison, explain 65% of the
explainable between-unit variance in time spent at work. The multilevel model of time
spent at work supports the third hypothesis that sector plays a significant and strong role

103
in the amount of time that protégés spent at work. It also supports the fourth hypothesis
that nonprofit managers who have had a mentor spend significantly more time at work
each week than mentored public sector respondents. In fact, the model indicates that the
group level variables, in particular the variable nonprofit sector, explain a much larger
proportion of the variance in time spent at work than the individuals factors.
The multilevel model for organizational involvement also produced significant
results for the two levels of analysis. The results indicate that the level-1 variables in the
full model explain 16% of the within-unit variance and the level-2 variables explain 77%
of the between-unit variance in organizational involvement. The model also indicates that
the primary variable of interest, the level-2 variable, nonprofit, is a significant predictor
of organizational involvement. Working in a nonprofit organization, compared to a public
organization, has the effect of increasing organizational involvement by 1.69. This
significant, positive relationship supports the fifth hypothesis that the relationship
between mentoring and organizational involvement varies by sector. Furthermore, this
result indicates that mentoring in the nonprofit sector has a stronger affect on increasing
organizational involvement than among public sector protégés.
The preliminary analyses and analyses on mentored individuals confirm that
having had a mentor significantly affects work behavior and that having had a mentor
differently affects protégés in the nonprofit and public sectors. In fact, 65% of the
variance in time spent at work and 77% of variance in organizational involvement is
explained by the level-2 variable, nonprofit sector. This study draws attention to the need
for additional sector based research on mentoring and multilevel analyses which can

104
unpack how mentor work behavior outcomes are driven by individual and group level
factors.
Mentorship Outcomes
Time Spent at Work
This study finds that having had a mentor significantly affects the amount of time
individuals spend at work each week. The model comparing mentoring and nonmentored
individuals finds that respondents who have had a mentor work an average 1.7 more
hours per week, holding all else constant.
When comparing mentored individuals, by sector, this research finds that among
public sector respondents, the amount of time spent at work each week is significantly
negatively related to a desire for job security and having children and positively related to
engaging in civic activities. This may be an indication of work-leisure balance. For state
government employees who have had a mentor, an increase in the number of children at
home decreases the time spent at work. Furthermore, a public sectgor protégé who is
highly engaged in civic activities spends more time at work each week than those who do
not report civic activities. This is most likely an indication of being a highly involved
individual.
For nonprofit respondents the amount of time spent at work is significantly related
to job duration, being a manager, gender, and state of employment. An increase in job
duration among protégés in the nonprofit sector is negatively related to time spent at
work. However, when job duration is interacted with being a manager (a proxy for rank
(Bridges & Villamez 1994)) there is an increase in time spent at work. It is possible that
new hires spend less time at work, because they are less senior or less socialized, while

105
managers who have longer duration in the organization spent more time at work each
week. This finding follows Schneider’s (1987) Attraction-Selection-Attrition framework,
which argues that people who do not fit an organization leave while those who fit stay
and become more involved in the organization. Public managers with longer tenure in the
organization will be more similar to other public managers and be more likely to share
similar work practices, such as not working more than 40 hours a week, while nonprofit
protégés who are managers with increased job tenure will develop work patterns similar
to their mentors, including an increase in the amount of time spent at work. Finally,
female protégés in the nonprofit sector spend less time at work each week than male
protégés, thus supporting previous research on female work patterns.
In summary, this research finds that having had a mentor is significantly related to
the amount of time a protégé spends at work. Of course, time spent at work could be a
positive or negative phenomenon. Time spent at work is not necessarily a measure of
productivity or effective use of work time since an increase in time spent at work can be
related to wasting time or inefficient activities such as internet surfing, socializing with
coworkers, or conducting personal business. However, time spent at work is a measure of
work behavior. Increased time spent at work could be a proxy for dedication to the
organization and mission. On the other hand, an increase in time spent at work could also
be an indication of unhealthy work-life balance or an inability to complete tasks within a
reasonable amount of time. Future research should investigate how mentoring affects
work-life balance for both mentors and protégés, and if these affects differ by sector.

106
Organizational Involvement
This research finds that having had a mentor is significantly related to an increase
in organizational involvement and that protégés in the nonprofit sector report higher
organizational involvement than public sector protégés. Organizational involvement is a
mentoring outcome that will be of interest to individuals and organizations. An increase
in organizational involvement as an outcome of mentoring not only shapes the work
behavior of mentors and protégés, but may help organizations to retain talented
employees. Since attracting and retaining talent is becoming a higher priority for public
(Partnership 2005a; 2005b) and nonprofit organizations (Stannard-Friel 2007; Halpern
2006), developing mentorships which increase organizational involvement may help to
train future leadership. For example, because nonprofit organizations often lack
structured career paths, the development of organizational involvement through
mentoring may help to groom junior employees so that they stay in the sector and are
prepared to take on leadership positions (Stannard-Friel 2007). This research presents
empirical evidence to support Halpern’s (2006) argument that “research should examine
the use of mentoring as a strategy to prepare organizations for succession and transition”
(8). Future research should aim to understand how increased organizational involvement
can translate to benefits for both individuals, organizations, and the public and nonprofit
sectors.
Summary
Mentoring has become an increasingly popular tool in organizations of all types.
In the last 20 years, public organizations have adopted mentoring as a tool for recruiting,
retaining, and promoting employees. More recently, nonprofit organizations have begun

107
to develop mentoring programs of their own, or mentoring networks with other nonprofit
organizations in order to attract volunteers and groom future leaders. A great deal of
academic research has investigated the positive outcomes of mentoring and to a lesser
extent the negative outcomes of mentoring. Unfortunately, there is little research
investigating mentoring in the public and nonprofit sectors and even less research
comparing the outcomes of mentoring, by sector.
This research takes a step towards understanding if and how mentoring differently
affects work behavior in the public and nonprofit sectors. This study finds that having a
mentor is significantly related to work behavior outcomes and that the outcomes of time
spent at work and organizational involvement vary for protégés in the public and
nonprofit sectors. The affect of having had a mentor on time spent at work is larger for
protégés in the nonprofit sector than for protégés in the public sector. It is possible that
mentoring, a tool used for career, social, and emotional develop has a larger influence on
nonprofit workers because the cultural norms in the nonprofit sector are less rigid than in
the public sector. In the public sector, there is more likely to be a strong norm for
working a typical 40-hour week. This norm is reinforced by individual behavior and civil
service rules and restrictions. Meanwhile, in smaller, more fluid nonprofit organizations
there may be more variation in the amount of time spent at work.
Although having had a mentor has a slight affect on time spent at work, an
increase of an average 1.7 hours per week in the generic model comparing mentored and
nonmentored respondents in both sectors, this can translate into a large outcome for
organizations. The average 1.7 hours per week is an average 88.4 hours per year. In an
organization of 100 workers, this translates to an increase in 8,840 work hours, which

108
should result in significant changes in an organization. This simple calculation
demonstrates how an outcome, time spent at work, not typically sought after by mentors
and protégés (compared to other expected outcomes of the mentorship such as friendship
and increased networks) can result in significant outcomes for organizations.
Similarly, this research finds that the effect of mentoring on organizational
involvement is stronger in the nonprofit sector than in the public sector. This is an
important finding for nonprofit organizations which face the challenge of attracting and
retaining talented workers who can move into executive leadership positions (Halpern
2006, 5). It will become increasingly important for nonprofit organizations to understand
how mentoring can help to supplement other efforts to develop and retain talent.
Of course, this research is limited by its inability to address the normative value
of increasing time spent at work and organizational involvement. However, this research
does bring together the mentoring and sector distinction literatures to better understand
how mentoring shapes work behaviors which may be antecedents to the attraction,
retention, and promotion of talent to public and nonprofit organizations. Before
dedicating organizational resources to mentoring programs, public and nonprofit
organizations should investigate how mentoring can be tailored to sector needs such as
promoting work-life balance and commitment to the sector, and develop best practices
from a sector-based perspective.

109
REFERENCES
Allen, T. D., Eby, L., Poteet, M., Lentz, E., & Lima, L. (2004). Career benefits associated with mentoring for protégés: A meta-analysis. Journal of Applied Psychology 89(1):127-136.
Allison, G. T. (1992). Public and private management: Are they fundamentally alike in all unimportant respects? In R. J. Stillman (Ed.), Public administration: Concepts and cases (Fifth ed., pp. 282-288). Boston: Houghton Mifflin Company.
Allison, P. D. (2001). Missing data. Thousand Oaks, CA: Sage Publications.
Anheier, H. K., & Seibel, W. (Eds.). (1990). The third sector: Comparative studies of nonprofit organizations. New York: de Gruyter.
Appleby, P. H. (1945). Big democracy. New York: Alfred A. Knopf.
Arrow, K. (1963). Uncertainty and the welfare economics of medical care. American Economic Review 53: 941-973.
Arthur, M. B., Inkson, K., & Pringle, J. (1999). The new careers. London: Sage.
Aryee, S., & Chay, Y. (1994). An examination of the impact of career-oriented mentoring on work commitment attitudes and career satisfaction among professional and managerial employees. British Journal of Management 5: 241-249.
Bailey, D., & Grochau, K. E. (1993). Aligning leadership needs to the organizational stage of development - applying management theory to nonprofit organizations. Administration in Social Work 17(1):23-45.
Balfour, D. L., & Wechsler, B. (1990). Organizational commitment: A reconceptualization and empirical test of public-private differences. Review of Public Personnel Administration 10(3):23-40.
Balfour, D. L., & Wechsler, B. (1991). Commitment, performance, and productivity in public organizations. Public Productivity & Management Review 14(4):355-367.
Balfour, D. L., & Wechsler, B. (1996). Organizational commitment: Antecedents and outcomes in public organizations. Public Productivity & Management Review 19(3):256-277.
Ban, C. (2006). Hiring in the federal government: Political and technological sources of reform. In N. M. Riccucci (Ed.), Public personnel management: Current challenges, future challenges (4th ed.). New York: Longman.

110
Baruch, Y., & Ramalho, N. (2006). Communalities and distinctions in the measurement of organizational performance and effectiveness across for-profit and nonprofit sectors. Nonprofit and Voluntary Sector Quarterly 35(1):39-65.
Baugh, S. G., Lankau, M. J., & Scandura, T. A. (1996). An investigation of the effects of protégé gender on responses to mentoring. Journal of Vocational Behavior 49(3):309-323.
Bellante, N., & Link, A. (1981). Are public sector workers more risk averse than private sector workers? Industrial and Labour Relations Review 34: 408-412.
Berman, E. M. (1999). Professionalism among public and nonprofit managers: A comparison. The American Review of Public Administration 29(2):149-166.
Blau, G., & Boal, K. (1989). Using job involvement and organizational commitment interactively to predict turnover. Journal of Management 15(1): 115.
Blau, G. J., & Boal, K. B. (1987). Conceptualizing how job involvement and organizational commitment affect turnover and absenteeism. The Academy of Management Review 12(2):288-300.
Blau, P., & Scott, R. (1962). Formal organizations: A comparative approach. San Francisco: Chandler.
Bonebright, C. A., Clay, D. L., & Ankenmann, R. D. (2000). The relationship of workaholism with work-life conflict, life satisfaction, and purpose in life. Journal of Counseling Psychology 47(4):469-477.
Bozeman, B. (1987). All organizations are public: Bridging public and private organizational theories. San Francisco: Jossey-Bass.
Bozeman, B. (1993). A theory of government “red tape.” Journal of Public Administration Research and Theory 3: 273-303.
Bozeman, B., & Feeney, M. K. (Under Review). Public managers’ mentoring: What affects outcomes?
Bozeman, B., & Kingsley, G. (1998). Risk culture in public and private organizations. Public Administration Review 58: 109-122.
Bozeman, B., & Murdock, A. (in press). Public managers' religiosity: Impacts on work attitudes and perceptions of co-workers. International Journal of Public Management.
Bozeman, B., & Ponomariov, B. L. (under review). Sector switching from a business to a government job: Fast track careers or fast track to nowhere?

111
Bozeman, B., Reed, P., & Scott, P. G. (1992). Red tape and task delays in public and private organizations. Administration & Society 24(3):290-322.
Bozionelos, N. (2004). Mentoring provided: Relation to mentor's career success, personality, and mentoring received. Journal of Vocational Behavior 64(1): 24.
Bridges, W., & Villamez, W. (1994). The employment relationship: Causes, and consequences of modern personnel administration. New York: Plenum Studies.
Brooke, P. P., Russell, D. W., & Price, J. L. (1988). Discriminant validation of measures of job satisfaction, job involvement, and organizational commitment. Journal of Applied Psychology 73(2):139-145.
Brown, M. E. (1969). Identification and some conditions of organizational involvement. Administrative Science Quarterly 14(3):346-355.
Brown, S. P. (1996). A meta-analysis and review of organizational research on job involvement. Psychological Bulletin 102(2):235-255.
Brudney, J. L. (1998a). Voluntarism. In J. M. Shafritz (Ed.), International encyclopedia of public policy and administration (pp. 2343-2349). Boulder, CO: Westview Press.
Brudney, J. L. (1998b). Volunteer administration. In J. M. Shafritz (Ed.), International encyclopedia of public policy and administration (pp. 2365-2372). Boulder, CO: Westview Press.
Brudney, J. L., & Herman, R. D. (2004). Readers’ perceptions of philanthropy and nonprofit management journals. American Review of Public Administration 34(3):293-301.
Bryk, A. S., & Raudenbush, S. W. (1992). Hierarchical linear models. Newbury Park, CA: Sage.
Buchanan, B. (1975). Red tape and the service ethic: Some unexpected differences between public and private managers. Administration & Society 6(4):423-444.
Buchanan II, B. (1974). Building organizational commitment: The socialization of managers in work organizations. Administrative Science Quarterly 19(4):533-546.
Burke, R. J. (1999a). Workaholism in organizations: Gender differences. Sex Roles 41(5/6):333–345.
Burke, R. J. (1999b). Workaholism in organizations: Measurement validation and replication. International Journal of Stress Management 6(1):45–55.
Burke, R. J. (2001). Workaholism components, job satisfaction, and career progress. Journal of Applied Social Psychology 31(11):2339-2356.

112
Burke, R. J., & McKeen, C. A. (1989). Developing formal mentoring programs in organizations. Business Quarterly 53: 76–79.
Burke, R. J., & McKeen, C. A. (1997). Benefits of mentoring relationships among managerial and professional women: A cautionary tale. Journal of Vocational Behavior 51(1):43-57.
Busch, J. W. (1985). Mentoring in graduate schools of education - mentors perceptions. American Educational Research Journal 22(2):257-265.
Carver, J. (1990). Boards that make a difference. San Francisco: Jossey-Bass.
Chao, G. T. (1997). Mentoring phases and outcomes. Journal of Vocational Behavior 51(1):15-28.
Chao, G. T., Walz, P. M., & Gardner, P. D. (1992). Formal and informal mentorships: A comparison on mentoring functions and contrast with non-mentored counterparts. Personnel Psychology 45(3):619-637.
Chaskin, R. J. (2003). Fostering neighborhood democracy: Legitimacy and accountability within loosely coupled systems. Nonprofit and Voluntary Sector Quarterly 32(2):161-189.
Clotfelter, C. T. (2001). Who are the alumni donors? Giving by two generations of alumni from selective colleges. Nonprofit Management and Leadership 12(2):119-138.
Cooper, P. (2002). Governing by contract: Challenges and opportunities for public managers. Washington DC: CQPress.
Corder, K. (2001). Acquiring new technology comparing nonprofit and public sector agencies. Administration & Society 33(2):194-219.
Coulton, C., Korbin, J., & Su, M. (1999). Neighborhoods and child maltreatment: A multi-level study. Child Abuse & Neglect 23(11):1019-1040.
Coursey, D., & Bozeman, B. (1990). Decision-making in public and private organizations. Public Administration Review 50: 525-535.
Crew, R. E., & Lamothe, S. (2003). Evaluating the efficiency of private sector organizations in helping welfare beneficiaries find employment. Evaluation Review 27(2):151-164.
Crewson, P. E. (1995). The public service ethic. American University, Washington, D.C.
Crewson, P. E. (1997). Public-service motivation: Building empirical evidence of incidence and effect. Journal of Public Administration Research and Theory 7(4):499.

113
Crewson, P. E., & Fisher, B. S. (1997). Growing older and wiser: The changing skill requirements of city administrators. Public Administration Review 57(5):380-386.
Dahl, & Lindblom. (1953). Politics, economics, and welfare. New York: HarperCollins.
Dansky, K. H. (1996). The effect of group mentoring on career outcomes. Group and Organization Management 21: 5–21.
Dees, J. G., & Anderson, B. B. (2003). Sector-bending: Blurring lines between nonprofit and for-profit. Society 40(4):16-27.
Department of Energy. (2001). Featured human capital management initiative: Management initiative. Human Capital Management Bulletin, 11 December 1. http://humancapital.doe.gov/pol/Bulletins/Hcmbul3.pdf.
Department of Health and Human Services. (2005). Career mentoring program edited by Department of Health and Human Services. http://dcp.psc.gov/ccbulletin/articles/CareerMentoring.htm.
Department of Transportation. Mentoring program. Human Resource Programs downloaded January 2006 http://dothr.Ost.Dot.Gov/hr_programs/dotmen_1/dotmen_1.Htm#program%20description.
Developments in the law: Nonprofit corporations. (1992). Harvard Law Review 105(7):1578-1699.
DiMaggio, P. J., & Powell, W. W. (1983). The iron cage revisited: Conformity and diversity in organizational fields. American Sociological Review 48: 147-160.
Dodd-McCue, D., & Wright, G. (1996). Men, women, and attitudinal commitment: The effects of workplace experiences and socialization. Human Relations 49(8):1065-1091.
Drucker, P. F. (1990). Judge nonprofits by their performance, not only by their good intentions. Chronicle of Philanthropy 2: 32.
Ebrahim, A. (2002). Information struggles: The role of information in the reproduction of NGO-funder relationships. Nonprofit and Voluntary Sector Quarterly 31(1):84-114.
Eby, L. T. (1997). Alternative forms of mentoring in changing organizational environments: A conceptual extension of the mentoring literature. Journal of Vocational Behavior 51(1):125-144.
Eby, L. T., & Allen, T. D. (2002). Further investigation of protégés’ negative mentoring experiences patterns and outcomes. Group & Organization Management 27(4):456-479.

114
Eby, L. T., McManus, S., Simon, S. A., & Russell, J. (2000). The protégé’s perspective regarding negative mentoring experiences: The development of a taxonomy. Journal of Vocational Behavior 57: 1-21.
Fagenson-Eland, E. A., Marks, M. K., & Amendola, K. L. (1997). Perceptions of mentoring relationships. Journal of Vocational Behavior 51(1):29-42.
Fagenson, E. A. (1989). The mentor advantage: Perceived career/job experiences of protégés versus non-protégés. Journal of Organizational Behavior 10: 309-320.
Fassel, D. (1990). Working ourselves to death: The high costs of workaholism, the rewards of recovery. San Francisco: Harper Collins.
Feldman, D. C. (1999). Toxic mentors or toxic protégés? A critical re-examination of dysfunctional mentoring. Human Resource Management Review 9(3):247-278.
Ferris, J. M. (1998). The role of the nonprofit sector in a self-governing society: A view from the United States. International Journal of Voluntary and Nonprofit Organizations 9(2):137-151.
Fox, R. L., & Schuhmann, R. A. (2001). Mentoring experiences of women city managers - are women disadvantaged? American Review of Public Administration 31(4):381-392.
Francois, P. (2001). Employee care and the role of nonprofit organizations. Journal of Institutional and Theoretical Economics-Zeitschrift Fur Die Gesamte Staatswissenschaft 157(3):443-464.
Fredericksen, P. J. (2003). Understanding nonprofit organizations. Public Administration Review 63(1):112-115.
Friedkin, N. E. (1978). University social-structure and social networks among scientists. American Journal of Sociology 83(6):1444-1465.
Frumkin, P., & Andre-Clark, A. (2000). When missions, markets, and politics collide: Values and strategy in the nonprofit human services. Nonprofit and Voluntary Sector Quarterly 29(1):141-163.
Frumkin, P., & Galaskiewicz, J. (2004). Institutional isomorphism and public sector organizations. Journal of Public Administration Research and Theory 14(3):283-307.
Gajewski, M. (2005). Strategic diversity to increase human capital in public and nonprofit organizations (www.npgoodpractice.org/PDF/Article94.PDF). Allendale, MI: Grand Valley State University.
Garfield, C. A. (1987). Peak performers: The new heroes of American business. New York: William Morrow.

115
Garnett, C. (2003). 'Not a spectator sport' OD launches formal year-long mentoring program. Downloaded January 26, 2006 http://www.Strategicfutures.Com/dod-coaching.Htm.
Gates, S., & Hill, J. (1995). Democratic accountability and governmental innovation in the use of nonprofit organizations. Review of Policy Research 14(1-2):137-148.
Gilsinan, J. F., & Tomey, E. A. (1981). Comparison of public and private sector worksites--an interim report (Research Report). Washington, DC.
Godshalk, V. M., & Sosik, J. J. (2003). Aiming for career success: The role of learning goal orientation in mentoring relationships. Journal of Vocational Behavior 63(3):417.
Gonyea, J. G. (1999). The nonprofit sector's responsiveness to work-family issues. Annals of the American Academy of Political And Social Science 562: 127-142.
Goodsell, C. T. (2004). The case for bureaucracy: A public administration polemic (Fourth ed.). Washington DC: CQ Press.
Goulet, L. R., & Frank, M. L. (2002). Organizational commitment across three sectors: Public, non-profit, and for-profit. Public Personnel Management.
Government Accountability Office. (2005a). Diversity management: Expert-identified leading practices and agency examples (Vol. GAO-05-90): Report to the Ranking Minority Member, Committee on Homeland Security and Governmental Affairs, U.S. Senate.
Government Accountability Office. (2005b). National nuclear security administration: Contractors' strategies to recruit and retain a critically skilled workforce are generally effective, edited by Government Accountability Office. Released February 2, Vol. GAO-05-164.
Green, S. G., & Bauer, T. N. (1995). Supervisory mentoring by advisers - relationships with doctoral-student potential, productivity, and commitment. Personnel Psychology 48(3):537-561.
Grønbjerg, K. A. (1989). Understanding nonprofit funding. San Francisco, CA: Jossey-Bass.
Grønbjerg, K. A., Martell, L., & Paarlberg, L. (2000). Solving ambiguity through the two-stage competitive process. Nonprofit and Voluntary Sector Quarterly 29(2):9-40.
Grosch, J. W., Caruso, C. C., Rosa, R. R., & Sauter, S. L. (2006). Long hours of work in the us: Associations with demographic and organizational characteristics, psychosocial working conditions, and health. American Journal of Industrial Medicine 49(11):943-952.
116
Gujarati, D. N. (2003). Basic econometrics (4th ed.). Boston: McGraw Hill.
Gutman, L., Sameroff, A., & Cole, R. (2003). Academic growth curve trajectories from 1st grade to 12th grade: Effects of multiple social risk factors and preschool child factors. Developmental Psychology 39(4):777-790.
Hager, M. A., Wilson, S., Pollak, T. H., & Rooney, P. M. (2003). Response rates for mail surveys of nonprofit organizations: A review and empirical test. Nonprofit and Voluntary Sector Quarterly 32(2):252-267.
Hale, M. M. (1995). Mentoring women in organizations: Practice in search of theory. American Review of Public Administration 25(4):327-339.
Hall, D. T., & Associates. (1996). The career is dead: Long live the career. San Francisco: Jossey-Bass.
Hall, P. D. (1992). Inventing the nonprofit sector and other essays on philanthropy, voluntarism, and nonprofit organizations. Johns Hopkins University Press, Baltimore.
Hall, P. D. (Ed.). (1987). A historical overview of the private nonprofit sector. New Haven: Yale University Press.
Hamermesh, D. S., & Gabarino, J. W. (1976). Labor in the public and nonprofit sectors. The Journal of Business 49(4):571-572.
Halpern, R. P. (2006). Workforce issues in the nonprofit sector: Generational leadership change and diversity. February. Kansas City, MO: American Humanics.
Handy, F., & Katz, E. (1998). The wage differential between nonprofit institutions and corporation: Getting more by paying less? Journal of Comparative Economics 26(2):246.
Hansmann, H. (1980). The role of nonprofit enterprise. Yale Law Journal 89: 835-901.
Haque, M. S. (2001). The diminishing publicness of public service under the current mode of governance. Public Administration Review 61: 65-82.
Harpaz, I., & Snir, I. (2003). Workaholism: Its definition and nature. Human Relations 56(3):291-319.
Hartenian, L. S. (2007). Nonprofit agency dependence on direct service and indirect support volunteers: An empirical investigation. Nonprofit Management & Leadership 17(3):319-334.
Hays, S. W., & Sowa, J. E. (2006). A broader look at the ‘accountability’ movement: Some grim realities in state civil service systems. Review of Public Personnel Administration 26(2):102-117.

117
Heimann, B., & Pittenger, K. (1996). The impact of formal mentorship on socialization and commitment of newcomers. Journal of Managerial Issues 8(1):1-15.
Heinrich, C., & Lynn, L. E. (1999). Means and ends: A comparative study of empirical methods for investigating governance and performance: Joint Center for Poverty Research Northwestern University/University of Chicago.
Hills-Bush, B. (1990). Regulators seek greater 'control' of fundraising practices. Nonprofit Times January, 5.
Himmelstein, J. L. (1993). The place and meaning of the nonprofit sector. Qualitative Sociology 16(3):319-329.
Hood, C., & Peters, G. (2004). The middle aging of new public management: Into the age of paradox? Journal of Public Administration Research and Theory 14(3):267-282.
Hoy, W. K., & Sousa, D. A. (1984). Delegation: The neglected aspect of participation in decision making. Alberta Journal of Educational Research 30(4):320-331.
Horwitz, J. R. (2005). Making profits and providing care: Comparing nonprofit, for-profit, and government hospitals. Health Affairs 24(3):790-801.
Huselid, M. A., & Day, N. E. (1991). Organizational commitment, job involvement, and turnover: A substantive and methodological analysis. Journal of Applied Psychology 76(3):380-391.
Illinois Department of Central Management Services. Personnel code. Executive Branch (20 ILCS 415) available at http://www.Ilga.Gov/legislation/ilcs.
Illinois Department of Central Management Services. (2006). Personnel rules. 80 Illinois Administrative Code 301: Paul Campbell, Director of Central Management Services, December 2006. Rod R. Blagojevich, Governor. State of Illinois. p.81.
Irvin, R. A. (2005). State regulation of nonprofit organizations: Accountability regardless of outcome. Nonprofit and Voluntary Sector Quarterly 34(2):161-178.
Izraeli, D. (1990). Human resources and labor relations in Israel. New horizons. In A. Globerson, A. Galin & E. Rozenshtein (Eds.), Human resources and labor relations in Israel (pp. 327–343). Tel Aviv, Israel: Ramot.
Johnson, J. H. (2004). Do long work hours contribute to divorce? NERA -Topics in Economic Analysis & Policy 4(1):1-40.
Jurkiewicz, C. L., Massey Jr., T. K., & Brown, R. G. (1998). Motivation in public and private organizations: A comparative study. Public Productivity & Management Review 21(3):230-250.

118
Kahn, R. (1992). How much is too much in nonprofit compensation? Nonprofit Times April, 18.
Kalleberg, A. L., Marsden, P. V., Reynolds, J., & Knoke, D. (2006). Beyond profit? Sectoral differences in high-performance work practices. Work and Occupations 33(3): 271-302.
Kanter, R. M., & Summers, D. (1987). Doing well while doing good: Dilemmas of performance management in nonprofit organizations and the need for multiple-constituency approach. In W. W. Powell (Ed.), The nonprofit sector: A research handbook (Vol. 154-166). New Haven: Yale University Press.
Karl, B. (1987). Philanthropic institutions, review of the nonprofit sector, edited by William W. Powell. Science 236(4804):984-985.
Kaufman, G., & Uhlenberg, P. (2000). The influence of parenthood on the work effort of married men and women. Social Forces 78(3):931–947.
Kearns, K. P. (1994). The strategic management of accountability in nonprofit organizations - an analytical framework. Public Administration Review 54(2):185-192.
Kelley, M. S., Lune, H., & Murphy, S. (2005). Doing syringe exchange: Organizational transformation and volunteer commitment. Nonprofit and Voluntary Sector Quarterly 34(3):362-386.
Kellough, J. E., & Nigro, L. G. (2002). Pay for performance in Georgia state government: Employee perspectives on GeorgiaGain after 5 years. Review of Public Personnel Administration 22(2):146-166.
Kelly, K. S. (1993). Public-relations and fund-raising encroachment - losing control in the nonprofit sector. Public Relations Review 19(4):349-365.
Kelly, R. M. (1998). An inclusive democratic polity, representative bureaucracies, and the new public management. Public Administration Review 58(3):201-208.
Kelly, R. M., Guy, M. E., Bayes, J., Duerst-Lahti, J., Duke, L. L., Hale, M. M., et al. (1991). Public managers in the states: A comparison of career advancement by sex. Public Administration Review 51(5):402-412.
Kettl, D. F. (1993). Sharing power: Public governance and private markets. Washington, D.C: Brookings Institution.
Kiechel, W. (1989, April 10). The workaholic generation. Fortune 50–62.
Killinger, B. (1991). Workaholics: The respectable addicts. New York: Simon & Schuster.

119
Kindlon, D., Wright, B., Raudenbush, S., & Earls, F. (1996). The measurement of children's exposure to violence: A Rasch analysis. International Journal of Methods in Psychiatric Research 6(4):187-194.
Klaft, R. P., & Kleiner, B. H. (1988). Understanding workaholics. Business 33: 37–40.
Kleiman, C. (1994). Power elides women in non-profit sector. Chicago Tribune, p. 3.
Kline, C. J., & Peters, L. H. (1991). Behavioral commitment and tenure of new employees: A replication and extension. Academy of Management Journal 34(1): 194-204.
Klingner, D. E., & Nalbandian, J. (Eds.). (1998). Public personnel management: Context and strategies (Fourth ed.). London: Prentice Hall.
Kram, K. E. (1980). Mentoring processes at work: Developmental relationships in managerial careers. Unpublished Dissertation, Yale University, Cambridge, MA.
Kram, K. E. (1983). Phases of the mentor relationship. Academy of Management Journal 26(4):608-625.
Kram, K. E. (1985). Mentoring at work: Developmental relationships in organizational life. Glenview, IL: Scott Foresman.
Kreft, I., & De Leeuw, J. (1998). Introducing multilevel modeling. London: Sage Publications.
Lee, V., & Loeb, S. (2000). School size in Chicago elementary schools: Effects on teachers' attitudes and students' achievement. American Educational Research Journal 37(1):3-31.
Leete, L. (2000). Wage equity and employee motivation in nonprofit and for-profit organizations. Journal of Economic Behavior & Organization 43(4):423-446.
Leete, L. (2001). Whither the nonprofit wage differential? Estimates from the 1990 census. Journal of Labor Economics 19(1):136-170.
Levinson, D., Darrow, C., Klein, E., Levinson, M., & McKee, B. (1978). The seasons of a man’s life. New York: Alfred A. Knopf.
Lewis, G. B., & Frank, S. A. (2002). Who wants to work for the government? Public Administration Review 62(4):395.
Little, R. J. A., & Rubin, D. B. (1987). Statistical analysis with missing data. New York: Wiley.
Lodahl, T. M., & Kejnar, M. (1965). The definition and measurement of job involvement. Journal of Applied Psychology 49(1):24-33.

120
Luke, D. A. (2004). Multilevel modeling. Thousand Oaks, CA: Sage.
Lyons, S. T., Duxbury, L. E., & Higgins, C. A. (2006). A comparison of the values and commitment of private sector, public sector, and parapublic sector employees. Public Administration Review 66(4):605-618.
Maas, Cora J. M., & Snijders, Tom A. B. (2003). The multilevel approach to repeated measures for complete and incomplete data. Quality & Quantity 37:71–89.
Machlowitz, M. (1980). Workaholics: Living with them, working with them. Reading, MA: Addison-Wesley.
Marwell, N. P., & McInerney, P. B. (2005). The nonprofit/for-profit continuum: Theorizing the dynamics of mixed-form markets. Nonprofit and Voluntary Sector Quarterly 34(1):7-28.
McCurley, S. (1994). Keeping the community involved: Recruiting and retaining volunteers. In R. D. Herman (Ed.), The Jossey-Bass handbook of nonprofit leadership and management (pp. 587-622). San Francisco: Jossey-Bass.
Mcmullen, K., & Schellingburg, G. (2003). Job quality in non-profit organizations (Vol. No 2). Ottawa: Canadian Policy Research Networks.
Mileesen, J. (2004). Sherpa? Shepherd? Conductor? Circus master? Board chair. The Nonprofit Quarterly 11(4):3842.
Mirvis, P. H. (1992). The quality of employment in the nonprofit sector: An update on employee attitudes in nonprofits versus business and government. Nonprofit Management & Leadership 3: 23-41.
Mirvis, P. H., & Hackett, E. J. (1983). Work and work force characteristics in the nonprofit sector. Monthly Labor Review 106(4).
Mosier, S. K. (1983). Workaholics: An analysis of their stress, success and priorities. University of Texas at Austin, Austin, TX.
Mowday, R., Steers, R., & Porter, L. (1979). The measurement of organizational commitment. Journal of Vocational Behavior 14(2):223-247.
National Center for Charitable Statistics. (2007). Urban Institute. Center on Nonprofits and Philanthropy. Accessed on May 30, 2007 at nccsdataweb.urban.org
National Institute of Standards and Technology. (2002). NIST pilot mentoring program. Http://www.Nist.Gov/admin/diversity/handbook02.Htm.
National Institutes of Health. (2005). News and notes. Career mentoring program. Foster mentoring! Mentoring really does make a difference! Office of Equal Opportunity
121
and Diversity Management. Http://oeo.Od.Nih.Gov/about/news_notes72005.Html.
National Public Radio. (2007). All Things Considered. New norms found in study of American states. Interviews. Source: AP analysis based on Census Bureau data. Broadcast on May 17, 2007. Accessed on May, 17 2007 at http://www.Npr.Org/templates/story/story.Php?Storyid=10239470.
Nelson, R., & Krashinsky, M. (1973). Two major issues of public policy: Public policy and organization of supply. In D. Young (Ed.), Public subsidy for day care of young children. Lexington, MA: D. C. Heath & Co.
Neumark, D., & Gardecki, R. (1998). Women helping women? Role model and mentoring effects on female PhD students in economics. Journal of Human Resources 33(1):220-246.
Ng, T. W. H., Eby, L. T., Sorensen, K. L., & Feldman, D. C. (2005). Predictors of objective and subjective career success: A meta-analysis. Personnel Psychology 58(2):367-408.
Noe, R. A. (1988a). An investigation of the determinants of successful assigned mentoring relationships. Personnel Psychology 41(3):457-479.
Noe, R. A. (1988b). Women and mentoring: A review and research agenda. Academy of Management Review 13: 65-78.
Nutt, P. C. (2006). Comparing public and private sector decision-making practices. Journal of Public Administration Research and Theory 16(2):289-318.
O'Connell, B. (1988). Evaluating results. Washington DC: Independent Sector, Nonprofit Management Series No. 9.
Oates, W. E. (1971). Confessions of a workaholic. New York: Abingdon.
Odendahl, T. (1990). Charity begins at home: Generosity and self-interest among philanthropic elite.
Odendahl, T., Boris, E., & Daniels, A. (1985). Working in foundations: The career patterns of men and women.
Office of Personnel Management. (1998). Guide to recruiting and retaining women in federal government. June. Http://www.Opm.Gov/employ/women/career.htm.
Olian, J. D., Carroll, S. J., & Giannantonio, C. M. (1993). Mentor reactions to protégés - an experiment with managers. Journal of Vocational Behavior 43(3):266-278.
Organisation for Economic Co-operation and Development. (1998). Employment outlook. Paris: OECD.

122
Organisation for Economic Co-operation and Development. (2004). Employment outlook. Paris: OECD.
Osborne, D., & Gaebler, T. (1993). Reinventing government: How the entrepreneurial spirit is transforming the public sector. New York: Plume/Penguin.
Ott, J. S. (2001). Understanding nonprofit organizations: Governance, leadership, and management. Boulder, CO: Westview Press.
Ott, J. S., & Dicke, L. A. (2006). Accountability challenges facing public sector HRM in an era of downsizing, devolution, diffusion, and empowerment. In A. Farazmand (Ed.), Strategic public personnel administration/HRM: Building human capital for the 21st century. Westport, CT: Praeger Publishers.
Panus, J. (1992). Boardroom verities. Chicago: Presept Press, Inc.
Partnership for Public Service. (2005a). Federal brain drain, November 21, 2005.
Partnership for Public Service. (2005b). Public opinion on public service. Washington DC: Partnership for Public Service.
Peiperl, M., & Jones, B. (2001). Workaholics and overworkers. Group & Organization Management 26(3):369-393.
Peiperl, M. A., & Arthur, M. B. (2000). Topics for conversation: Career themes old and new. In M. Peiperl, M. Arthur, R. Goffee & T. Morris (Eds.), Career frontiers: New conceptions of working lives (pp. 1-19). New York: Oxford University Press.
Peiperl, M. A., & Baruch, Y. (1997). Back to square zero: The post-corporate career. Organizational Dynamics 25(4):7-22.
Penley, L. E., & Gould, S. (1988). Etzioni's model of organizational involvement: A perspective for understanding commitment to organizations. Journal of Organizational Behavior 9(1):43-59.
Perry, J., & Rainey, H. (1988). The public-private distinction in organization theory: Critique and research strategy. Academy of Management Review 13: 182-201.
Perry, J. L., & Kraemer, K. L. (1983). Public management. Mountain View, CA: Mayfield.
Pitt, D. C., & Smith, B. C. (1981). Government departments: An organizational perspective. London: Routledge.
Pittman, J. F., & Orthner, D. K. (1988). Gender differences in the prediction of job commitment. Journal of Social Behavior and Personality 3: 227–248.

123
Provan, K. G., & Milward, H. B. (1991). Institutional-level norms and organizational involvement in a service-implementation network. Journal of Public Administration Research and Theory 1(4):391-417.
Pugh, H., & Hinings. (1969). An empirical taxonomy of work organizations. Administrative Science Quarterly 14: 115-126.
Ragins, B. R. (1997a). Antecedents of diversified mentoring relationships. Journal of Vocational Behavior 51(1):90-109.
Ragins, B. R. (1997b). Diversified mentoring relationships in organizations: A power perspective. Academy of Management Review 22(2):482-521.
Ragins, B. R., Cotton, J. L., & Miller, J. S. (2000). Marginal mentoring: The effects of type of mentor, quality of relationship, and program design on work and career attitudes. Academy of Management Journal 43(6):1177-1194.
Ragins, B. R., & McFarlin, D. (1990). Perception of mentor roles in cross-gender mentoring relationships. Journal of Vocational Behavior 37: 321–339.
Rainey, H., & Bozeman, B. (2000). Comparing public and private organizations: Empirical research and the power of the a priori. Journal of Public Administration Research and Theory 19(2):447-470.
Rainey, H. G. (1989). Public management: Recent research on the political context and managerial roles, structures, and behaviors. Journal of Management 15(2):229-250.
Rainey, H. G. (2003). Understanding and managing public organizations (Third ed.). San Francisco: Jossey-Bass.
Rainey, H. G., Pandey, S. K., & Bozeman, B. (1995). Research note - public and private managers' perceptions of red tape. Public Administration Review 55(6):567-574.
Raudenbush, S. W., & Bryk, A. S. (2002). Hierarchical linear models: Applications and data analysis methods. Thousand Oaks, CA: Sage.
Raudenbush, S. W., Bryk, A. S., Cheong, Y. F., & Congdon, R. (2004). HLM 6: Hierarchical linear & nonlinear modeling. Lincolnwood, IL: Scientific Software International Inc.
Rawls, J. R., & Nelson, O. T. (1975). Characteristics associated with preferences for certain managerial positions. Psychological Reports 36: 911–918.
Rawls, J. R., Ullrich, R. A., & Nelson, O. T. (1975). A comparison of managers entering or reentering the profit and nonprofit sectors. Academy of Management Journal 18(3):616-623.

124
Riccucci, N. M. (Ed.). (2006). Public personnel management: Current concerns, future challenges (Fourth ed.). New York: Pearson Education.
Romzek, B. S. (1989). Personal consequences of employee commitment. The Academy of Management Journal 32(3):649-661.
Romzek, B. S., & Hendricks, J. S. (1982). Organizational involvement and representative bureaucracy: Can we have it both ways? The American Political Science Review 76(1):75-82.
Rotolo, T., & Wilson, J. (2006). Employment sector and volunteering: The contribution of nonprofit and public sector workers to the volunteer labor force. Sociological Quarterly 47(1):21-40.
Ruhm, C. J., & Borkoski, C. (2003). Compensation in the nonprofit sector. Journal of Human Resources 38(4):992-1021.
Russell, J. E. A., & Adams, D. M. (1997). The changing nature of mentoring in organizations: An introduction to the special issue on mentoring in organizations. Journal of Vocational Behavior 51(1):1.
Ryan, W. P. (1999). The new landscape for nonprofits. Harvard Business Review, January/February 127-136.
Ryssdal, K. (Writer) (2007). Cracks in foundations [Radio], Marketplace: Review. Interview with Joel Fleishman, author of The Foundation: Inside the Hidden World of America's Non-Profit Giants. Marketplace. Broadcast on January 22. American Public Media: National Public Radio. Available at http://marketplace.publicradio.org/shows/2007/01/22/PM200701227.html
Salamon, L. M. (1987). Partners in public service: The scope and theory of government-nonprofit relations. In W. W. Powell (Ed.), The nonprofit sector: A research handbook (pp. 99-117). New Haven, CT: Yale University Press.
Salamon, L. M. (1995). Partners in public service: Government-nonprofit relations in the modern welfare state. Baltimore: Johns Hopkins University Press.
Salamon, L. M. (1998). Nonprofit organizations; America’s invisible sector. Issues of Democracy 3(1).
Salamon, L. M. (2002). The resilient sector: The state of nonprofit America. In L. M. Salamon (Ed.), The state of nonprofit America (pp. 3-61). Washington, DC: Brookings Institution.
Salamon, L. M., & Abramson, A. J. (1982). The federal budget and the nonprofit sector. Washington DC: The Urban Institute Press.

125
Salamon, L. M., & Anheier, H. K. (1992). In search of the nonprofit sector. The question of definitions. Voluntas: International Journal of Voluntary and Nonprofit Organizations 3(2):125–151.
Salamon, L. M., & Dewees, S. (2002). In search of the nonprofit sector - improving the state of the art. American Behavioral Scientist 45(11):1716-1740.
Savas, E. S. (2000). Privatization and public-private partnerships. New York: Marcel Dekker.
Scandura, T. A. (1992). Mentorship and career mobility: An empirical investigation. Journal of Organizational Behavior 13: 169-174.
Scandura, T. A. (1998). Dysfunctional mentoring relationships and outcomes. Journal of Management 24(3):449.
Scandura, Terri, A., & Schriesheim, C. A. (1994). Leader-member exchange and supervisor career mentoring as complementary constructs in leadership research. Academy of Management Journal 37: 1588-1602.
Scandura Terri, A., Tejeda, M., Wether, W., & Lankau, M. J. (1996). Perspectives on mentoring. Leadership and Organization Development Journal 17(3):50-57.
Schepers, C., De Gieter, S., Pepermans, R., Du Bois, C., Caers, R., & Jegers, M. (2005). How are employees of the nonprofit sector motivated? Nonprofit Management & Leadership 16(2):191-208.
Schneider, B. (1987). The people make the place. Personnel Psychology 40: 437–453.
Schneider, B., Goldstein, H. W., & Smith, D. B. (1995). The ASA framework: An update. Personnel Psychology 48: 747–773.
Schor, J. (1992). The overworked American: The unexpected decline of leisure. New York: Basic Books.
Schroeder, L., O'Leary, R., Jones, D., & Poocharoen, O. (2004). Routes to scholarly success in public administration: Is there a right path? Public Administration Review 64(1):92-105.
Scott, K. S., Moore, K. S., & Miceli, M. P. (1997). An exploration of the meaning and consequences of workaholism. Human Relations 50(3):287-314.
Scott, P. G., & Pandey, S. K. (2000). The influence of red tape on bureaucratic behavior: An experimental simulation. Journal of Policy Analysis and Management 19(4):615-633.

126
Seybold, K. C., & Salomone, P. R. (1994). Understanding workaholism: A review of causes and counseling approaches. Journal of Counseling and Development 73: 4–10.
Shafritz, J. M., Riccucci, N. M., Rosenbloom, D. H., & Hyde, A. C. (1992). Personnel management in government: Politics and process (4th Edition ed.). New York: Marcel Dekker, Inc.
Shaw, M. M. (2003). Successful collaboration between the nonprofit and public sectors. Nonprofit Management & Leadership 14(1):107-120.
Sievers, B. (2006). A tale of three cities (Newsletter). New York: Rockefeller Philanthropy Advisors.
Simon, S. A., & Eby, L. T. (2003). A typology of negative mentoring experiences: A multidimensional scaling study. Human Relations 56(9):1083-1106.
Singer, J. (1998). Using SAS proc mixed to fit multilevel models, hierarchical models, and individual growth models. Journal of Education and Behavioral Statistics 24(4):323-355.
Singh, V., Bains, D., & Vinnicombe, S. (2002). Informal mentoring as an organisational resource. Long Range Planning 35(4): 389.
Slack, J. D., Myers, N., Nelson, L., & Sirk, K. (1996). Women, research, and mentorship in public administration. Public Administration Review 56(5):453-458.
Smith, W. J., Howard, J. T., & Harrington, K. V. (2005). Essential formal mentor characteristics and functions in governmental and non-governmental organizations from the program administrator's and the mentor's perspective. Public Personnel Management 34(1):31-58.
Snir, R., & Zohar, D. (2000). Workaholism: Work-addiction or workphilia? International Conference on Psychology - Psychology after the year 2000. University of Haifa, Israel.
Spence, J. T., & Robbins, A. S. (1992). Workaholism: Definition, measurement, and preliminary results. Journal of Personality Assessment 58: 160–178.
Spruel, G. (1987). Work fever. Training and Development Journal 41: 41–45.
Stannard-Friel, J. (2007). What’s driving young professionals from the nonprofit sector? On Philanthropy, April 26. New York: Changing Our World, Inc. Downloaded May 15 2007, from http://www.onphilanthropy.com/site/News2?page=NewsArticle&id=7073.

127
Steinberg, R. (1987). Nonprofit organizations and the market. In W. W. Powell (Ed.), The nonprofit sector: A research handbook (pp. 118-138). New Haven, CT: Yale University Press.
Steinhaus, C. S., & Perry, J. L. (1996). Organizational commitment: Does sector matter? Public Productivity & Management Review 19(3):278-288.
Stone, M. M. (1996). Competing contexts: The evolution of a nonprofit organization's governance system in multiple environments. Administration & Society 28(1):61-89.
Tepper, B. J. (1995). Upward maintenance tactics in supervisory mentoring and nonmentoring relationships. Academy of Management Journal 38(4):1191-1205.
Thomas, D. A. (1990). The impact of race on managers’ experiences of developmental relationships (mentoring and sponsorship): An intra-organizational study. Journal of Organizational Behavior 11: 479–492.
Thomas, D. A., & Alderfer, C. P. (1989). The influence of race on career dynamics: Theory and research on minority career experiences. In M. B. Arthur, D. T. Hall & B. S. Lawrence (Eds.), Handbook of career theory (pp. 133–158). Cambridge, MA: Cambridge University Press.
Thomas, J., BOL, L., Warkentin, R., Wilson, M., Strage, A., & Rohwer, W. (1993). Interrelationships among students study activities, self-concept of academic ability, and achievement as a function of characteristics of high-school biology courses. Applied Cognitive Psychology 7(6):499-532.
Thornton, R. (1970). Organizational involvement and commitment to organization and profession. Administrative Science Quarterly 15(4):417-426.
Thomson Scientific. (2005). Journal Citation Reports: Social Sciences Edition. Web of Knowledge. Accessed May 10, 2007 at www.scientific.thomson.com
U.S. Department of the Treasury Filer Commission. (1977). Research papers sponsored by the commissions on private philanthropy and public needs. In Department of the Treasury (Ed.): Washington D.C.
van Echtelt, P. E., Glebbeek, A. C., & Lindenberg, S. M. (2006). The new lumpiness of work: Explaining the mismatch between actual and preferred working hours. Work Employment and Society 20(3):493-512.
Walters, J. (2002). Life after civil service reform: The Texas, Georgia, and Florida experiences. Governing Magazine.
Wamsley, G. L., & Zald, M. N. (1973). The political economy of public organizations. Lexington, MA: D.C. Health.

128
Watson, M. R., & Abzug, R. (Eds.). (1994). Finding the ones you want, keeping the ones you find. San Francisco: Jossey-Bass.
Webber, C., & Wildavsky, A. (1986). Taxation and expenditures in the western world. New York: Simon and Schuster.
Weisbrod, B. A. (1977). The voluntary nonprofit sector. Lexington, MA: D. C. Heath & Co.
Weisbrod, B. A. (1988). The nonprofit economy. Cambridge, MA: Harvard University Press.
Weisbrod, B. A. (1997). The future of the nonprofit sector: It’s entwining with private enterprise and government. Journal of Policy Analysis and Management 16(4):541-555.
White, J. L. (1995). A public-private comparison of organizational commitment. Unpublished Dissertation, Tennessee State University.
Whitely, W., Dougherty, T. W., & Dreher, G. F. (1991). Relationship of career mentoring and socioeconomic origin to managers and professionals early career progress. Academy of Management Journal 34(2):331-351.
Willbur, J. (1987). Does mentoring breed success. Training and Development Journal 41(11):38-41.
Williams, K. (2005). Mentoring the next generation of nonprofit leaders: A practical guide for managers. Washington, DC: AED Center for Leadership Development, Academy for Educational Development. Retrieved October 28, 2006, from http://newvoices.Aed.Org/mentoringnextgeneration.Pdf.
Wilson, J., & Musick, M. A. (1997). Work and volunteering: The long arm of the job. Social Forces 76(1):251-272.
Wittmer, D. (1991). Serving the people or serving for pay: Reward preferences among government, hybrid sector and business managers. Public Productivity and Management Review 14(4):369.
Wooldridge, B., & Floyd, S. W. (1990). The strategy process, middle management involvement, and organizational performance. Strategic Management Journal 11(3):231-241.
Wooldridge, J. M. (2003). Introductory econometrics (2nd ed.). Mason, Ohio: Thomson Learning.
Wuthrow, R. (Ed.). (1991). Between states and markets: The voluntary sector in comparative perspective. Princeton, NJ: Princeton University Press.

129
Wyrwich, K., & Wolinsky, F. (2000). Identifying meaningful intra-individual change standards for health-related quality of life measures. Journal of Evaluation in Clinical Practice 6(1):39-49.

130
Appendix A: Traditional Scales for Organizational Commitment and Job Involvement
Organizational Commitment Scale (Balfour & Wechsler 1990) Exchange commitment, (Coefficient alpha value .83)
1. This organization appreciates my accomplishments on the job. 2. This organization does all that it can to recognize employees for good performance. 3. My efforts on the job are largely ignored or overlooked by this organization. (R)
Affiliation commitment, (Coefficient alpha value .81)
1. I feel a strong sense of belonging to this organization. 2. I feel like “part of the family” at this organization. 3. The people I work for do not care about what happens to me. (R)
Identification commitment, (Coefficient alpha value .72)
1. I am quite proud to be able to tell people who it is that I work for. 2. What this organization stands for is important to me. 3. I work for an organization that is incompetent and unable to accomplish its mission. (R)
Organizational Commitment Scale (Mowday, Steers, & Porter 1979) 1. I am willing to put in a great deal of effort beyond that normally expected in order to help
this organizations be successful. 2. I talk up this organization to my friends as a great organization to work for. 3. I feel very little loyalty to this organization. (R) 4. I would accept almost any type of job assignment in order to keep working for this
organization. 5. I find that my values and the organization’s values are very similar. 6. I am proud to tell others that I am part of this organization. 7. I could just as well be working for a different organization as long as the type of work was
similar. (R) 8. This organization really inspires the very best in me in the way of job performance. 9. It would take very little change in my present circumstances to cause me to leave this
organization. (R) 10. I am extremely glad that I chose this organization to work for over others I was
considering at the time I joined. 11. There’s not too much to be gained by sticking with this organization indefinitely. (R) 12. Often, I find it difficult to agree with this organization’s policies on important matters
relating to its employees. (R)

131
Appendix A Continued
Job Involvement Scale (Lodahl & Kejner 1965) 1. I’ll stay overtime to finish job, even if I’m not paid for it. 2. You can measure a person pretty well by how good a job he does. 3. The major satisfaction in my life comes from my job. 4. For me, morning at work really fly by. 5. I usually show up for work a little early, to get things ready. 6. The most important things that happen to me involve my work 7. Sometimes I lie awake at night thinking about next day’s work. 8. I am really a perfectionist about my work. 9. I feel depressed when I fail at something connected with my job. 10. I have other activities more important than my work. 11. I live, eat, and breathe my job. 12. I would probably keep working even if didn’t need the money. 13. Quite often I feel like staying home from work instead of coming in. 14. To me, my work is only a small part of who I am. 15. I am very must involved personally at my work. 16. I avoid taking on extra duties and responsibilities in my work. 17. I used to be more ambitious my work than I am now. 18. Most things in life are more important than work. 19. I used to care more about work, but now other things are more important to me. Sometimes I’d like to kick myself for mistakes I make in my work.
Organizational Commitment Scale (OCS) (Penley and Gould 1988) Moral Commitment Items:
1. I am dedicated to this organization. 2. I feel it is my duty to support this organization. 3. Whenever I am in public, I think of myself as an employee of this organization. 4. It is my personal responsibility to help this organization achieve success. 5. I get upset when people say bad things about this organization.
Calculative Commitment Items
1. I will give my best effort when I know it will be seen by the ‘right’ people in this organization.
2. I get most involved in my work when I know I’ll receive recognition for it. 3. I am motivated by thoughts of getting greater personal rewards from this organization. 4. I put effort into this company to the extent I get something in return for it. 5. I support this organization to the extent that it supports me
Alienative Commitment Items
1. Sometimes I would like to walk out of this organization and never come back. 2. I often feel like I want to ‘get even’ with this company. 3. I get angry when I think about this organization. 4. I feel trapped here. 5. No matter what I do around here, this organization remains unchanged.

132
Appendix B: Comparing Respondents Who Have Had a Mentor and Currently Mentored Respondents Descriptive Statistics for having had a mentor and currently mentored respondents
Frequency Valid % Total Have you ever had a mentor? 647 54% 1204 Full Sample Currently has a mentor 155 24% 645 Have you ever had a mentor? 406 52% 779 Public Sector Currently has a mentor 87 22% 403 Have you ever had a mentor? 219 55% 396 Nonprofit Sector Currently has a mentor 63 29% 220
ANOVA - Comparing Currently and Previously Mentored Respondents
Test of Homogeneity of Variances Levene Statistic df1 df2 Sig. Time Spent at Work 0.357 1 627 0.551 Organizational Involvement 0.379 1 633 0.538
ANOVA Sum of Squares df
Mean Square F Sig.
Between Groups 116.95 1 116.95 1.869 0.172 Within Groups 39233.80 627 62.57 Time Spent at Work Total 39350.75 628 Between Groups 12.44 1 12.44 1.726 0.189 Within Groups 4562.57 633 7.21 Organizational
Involvement Total 4575.01 634
Robust Tests of Equality of Means Statistic(a) df1 df2 Sig.
Welch 1.81 1 253 0.179 Time Spent at Work Brown-Forsythe 1.81 1 253 0.179 Welch 1.75 1 264 0.187 Organizational
Involvement Brown-Forsythe 1.75 1 264 0.187 Asymptotically F distributed
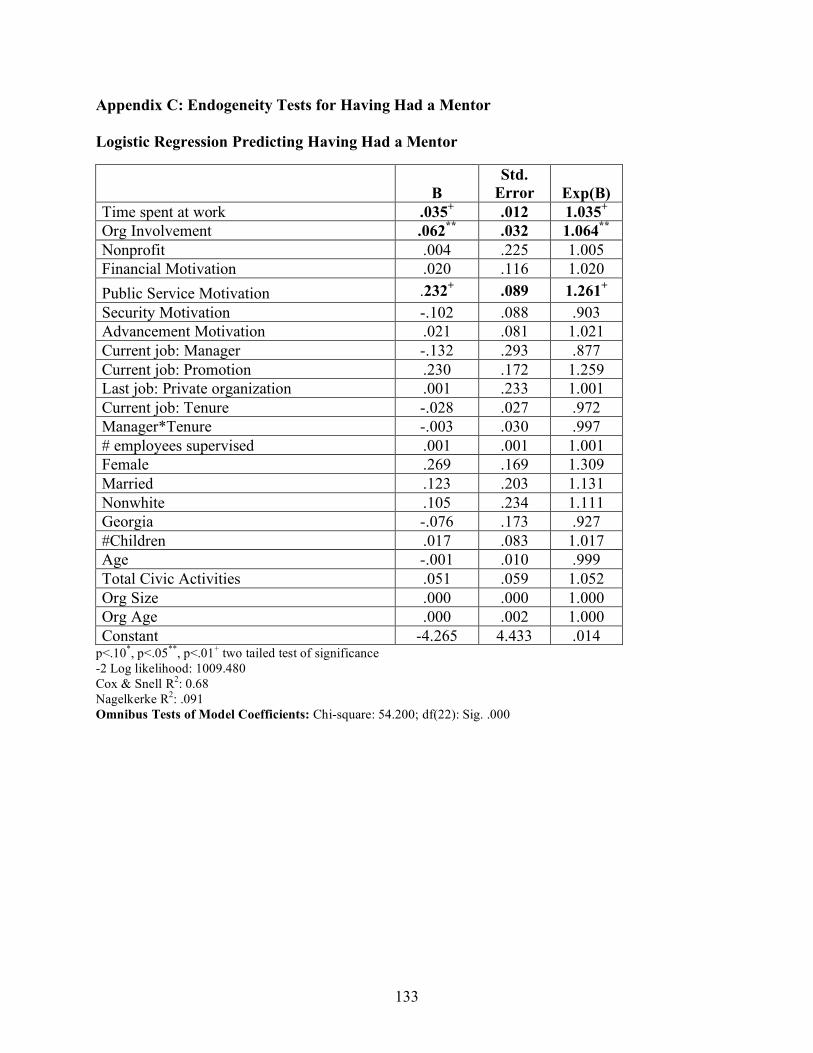
133
Appendix C: Endogeneity Tests for Having Had a Mentor Logistic Regression Predicting Having Had a Mentor
B Std.
Error Exp(B) Time spent at work .035+ .012 1.035+ Org Involvement .062** .032 1.064** Nonprofit .004 .225 1.005 Financial Motivation .020 .116 1.020 Public Service Motivation .232+ .089 1.261+ Security Motivation -.102 .088 .903 Advancement Motivation .021 .081 1.021 Current job: Manager -.132 .293 .877 Current job: Promotion .230 .172 1.259 Last job: Private organization .001 .233 1.001 Current job: Tenure -.028 .027 .972 Manager*Tenure -.003 .030 .997 # employees supervised .001 .001 1.001 Female .269 .169 1.309 Married .123 .203 1.131 Nonwhite .105 .234 1.111 Georgia -.076 .173 .927 #Children .017 .083 1.017 Age -.001 .010 .999 Total Civic Activities .051 .059 1.052 Org Size .000 .000 1.000 Org Age .000 .002 1.000 Constant -4.265 4.433 .014
p<.10*, p<.05**, p<.01+ two tailed test of significance -2 Log likelihood: 1009.480 Cox & Snell R2: 0.68 Nagelkerke R2: .091 Omnibus Tests of Model Coefficients: Chi-square: 54.200; df(22): Sig. .000
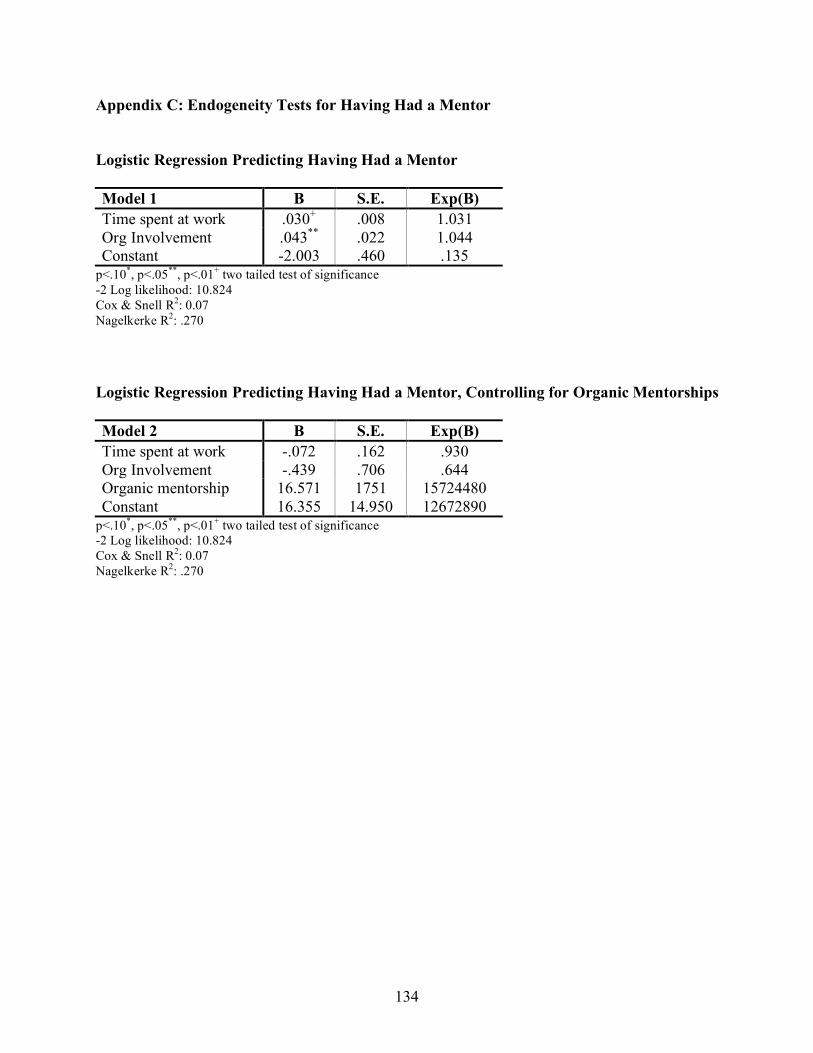
134
Appendix C: Endogeneity Tests for Having Had a Mentor Logistic Regression Predicting Having Had a Mentor Model 1 B S.E. Exp(B) Time spent at work .030+ .008 1.031 Org Involvement .043** .022 1.044 Constant -2.003 .460 .135
p<.10*, p<.05**, p<.01+ two tailed test of significance -2 Log likelihood: 10.824 Cox & Snell R2: 0.07 Nagelkerke R2: .270 Logistic Regression Predicting Having Had a Mentor, Controlling for Organic Mentorships Model 2 B S.E. Exp(B) Time spent at work -.072 .162 .930 Org Involvement -.439 .706 .644 Organic mentorship 16.571 1751 15724480 Constant 16.355 14.950 12672890
p<.10*, p<.05**, p<.01+ two tailed test of significance -2 Log likelihood: 10.824 Cox & Snell R2: 0.07 Nagelkerke R2: .270

135
Appendix D: Missing Variables Analysis
Missing # of extremes N Mean Std. Dev. Count Percent Low High Nonprofit 625 0.35 0.477 0 0 0 0 Org Age 580 1946 39 45 7.2 3 0 Org Size 587 3786 5988 38 6.1 0 101 Security Motivation 605 -.041 1 20 3.2 19 0 Advancement Motivation 605 0.054 0.99 20 3.2 14 0 Financial Motivation 621 3.28 0.721 4 0.6 17 0 Public Service Motivation 618 3.28 0.865 7 1.1 39 0 Total Civic Activities 625 2.78 1.485 0 0 0 9 Internal Mentor 619 0.58 0.494 6 1 0 0 Organic Mentor 592 0.77 0.421 33 5.3 . . Female Mentor 619 0.32 0.469 6 1 0 0 Mentorship Duration 572 70.47 71.53 53 8.5 0 32 EndYear 587 199616 934 38 6.1 1 0 Age 615 49.3 8.75 10 1.6 1 0 Female 617 0.49 0.5 8 1.3 0 0 Georgia 625 0.45 0.498 0 0 0 0 Nonwhite 598 0.15 0.258 27 4.3 . . #Children 608 0.94 1.117 17 2.7 0 5 Married 618 0.78 0.411 7 1.1 . . Job Tenure 588 7.06 6.184 37 5.9 0 30 Job Manager 624 0.71 0.456 1 0.2 0 0 Previous Job Private 624 0.01 0.119 1 0.2 . . Job: Promotion 624 0.48 0.5 1 0.2 0 0 #Employees supervised 536 25.33 86.96 89 14.2 0 65 Manager*Tenure 612 4.93 6.17 13 2.1 0 29

136
Appendix E: NASP-III Study Approach The National Administration Studies Project (NASP) aims to increase our empirical knowledge of public and nonprofit management and administration. NASP-III is an attempt to blend the goals of NASP-I and II while addressing a few new themes of its own. NASP-III collected data from a random sample of public and nonprofit managers in Georgia and Illinois. Unlike NASP-II, which focused on a single functional agency (health and human services), the NASP-III sample includes managers from agencies and organizations of numerous functions. The population of public managers in Georgia was drawn from the Georgia Department of Audits (DoA) comprehensive list of state employees who were on state agency payrolls during the 2003/2004 fiscal year. We removed employees at technical colleges, commissions, authorities, the office of the governor, and institutions from the judicial or legislative branch. In addition we removed employees at institutions with less than 20 employees. The population included any job titles coded as "director" "coordinator" “officials or manager” and “professionals” under the pay grade of 017 and all individuals with a pay grade of 017 or higher. The resulting population included 6,164 Georgia managers. The population of managers in Illinois was developed through a Freedom of Information Act request for a list of all state employees designated as either "senior public service administrators" or "public service administrators." This list included information on 5,461 state employees, including name, agency, and county. The population of nonprofit managers was purchased from Infocus Marketing, Inc. The list includes members of the American Society of Association Executives (ASAE) with the following job titles:
Administration/Operations Manager Marketing, Personnel Executive Director/VP Public Relations/Public Affairs Company President/Owner Sales/Marketing Development Manager/Director Financial/bookkeeping Education Manager/Director Information systems Communications/Editors/Publications Legal Counsel-internal Government/Government Relations Chief executive officer
Infocus Marketing provided us with a list of managers from nonprofit organizations, 280 from Georgia and 1048 from Illinois. The Infocus Marketing list is updated monthly. We recognize that by purchasing the list from ASAE, we are receiving a population of self-selected individuals. However, this is currently the best method for obtaining contact information for a large number of nonprofit managers. Survey Administration: The survey administration included a pre-contact letter, Wave I survey with letter, follow-up postcard mailing, Wave II mailing, follow-up contacts by phone call and email, and a final Wave III mailing. The survey was closed January 1, 2006. We received 549 responses in Wave I, 135 in Wave II, and 111 in Wave III from the public sector respondents. From the nonprofit respondents we received 545 responses from Wave I, 132 in Wave II, and 113 in Wave III. There are no significant differences between response waves. Response Rates: Though we began with a sample of 2000 public sector respondents our sample was reduced to 1849 (912 Georgia, 937 Illinois) because of respondents who had retired (16 cases) or were no longer working for the state (135 cases). The survey was closed with 432 responses from Georgia and 358 from Illinois public managers. From the list of 1328 individuals in nonprofit organizations, we eliminated two individuals who had retired and 19 who were no longer working at the address provided by ASAE. The final nonprofit population was 1307. Respondents and non-respondents do not significantly vary by state, gender, job rank, salary (for Georgia), or agency of employment. The nonprofit survey was closed with 430 responses from the following types of nonprofit organizations: Title holding corporations for exempt organizations, public charities, civic leagues and social welfare organizations, and labor, agricultural, and horticultural organizations.

137
Description Frequency % Tax Status
Contributions Allowable
Title Holding Corporations for Exempt Organizations 1 .3 501(c)(2) No
Public Charity: Religious, Educational, Charitable, Scientific, Literary, Testing for Public Safety, Organizations to Prevent Cruelty to Children or Animals
133 38.6 501(c)(3)
Yes, generally
Civic Leagues and Social Welfare Organizations, and Local Associations 4 1.2 501(c)(4) No, generally
Labor, Agricultural, and Horticultural Organizations 10 2.9 501(c)(5) No Business Leagues, Chambers of Commerce, Real Estate Boards etc. 196 56.8 501(c)(6) No
Fraternal Beneficiary Societies and Associations 1 .3 501(c)(8) Yes, for some 501(c)(3) purposes
Total 345 100.0 Correlations of nonprofit type and dependent variables
Time Spent
at Work Org
Involvement Type of nonprofit organization -.001 .040 Public Charity -.017 -.063 Business Leagues -.005 .034
** Pearson Correlation is significant at the 0.01 level (2-tailed). * Pearson Correlation is significant at the 0.05 level (2-tailed).
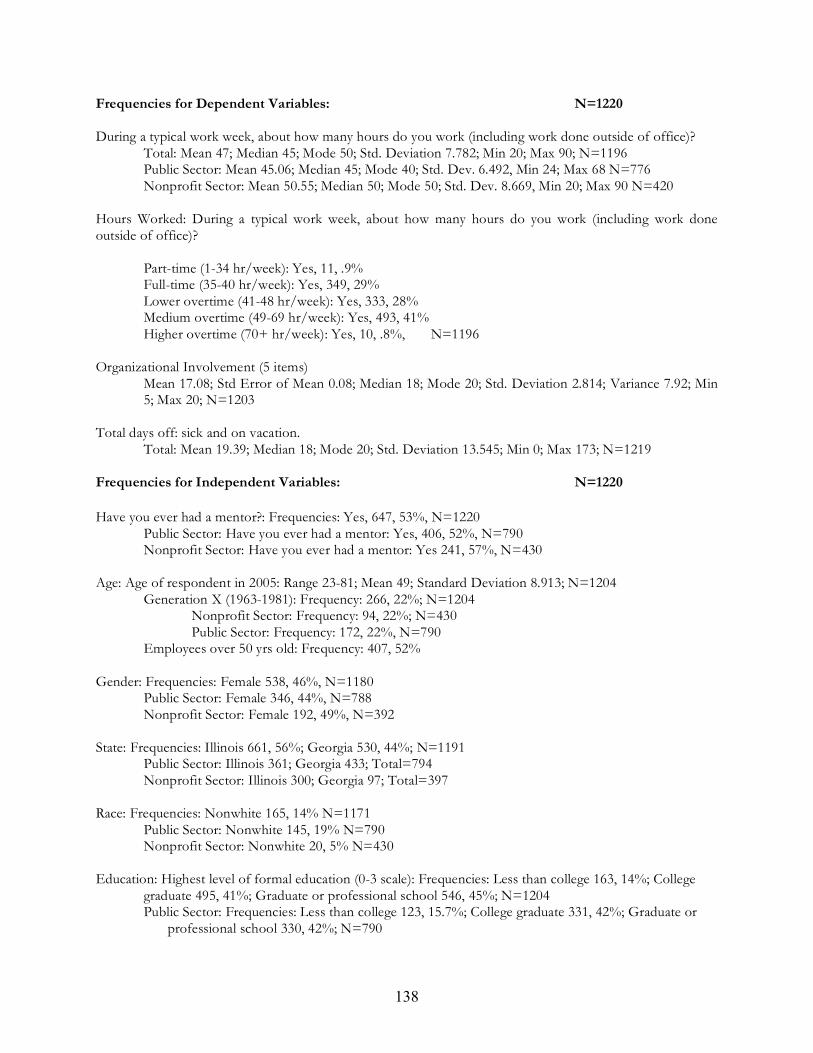
138
Frequencies for Dependent Variables: N=1220 During a typical work week, about how many hours do you work (including work done outside of office)?
Total: Mean 47; Median 45; Mode 50; Std. Deviation 7.782; Min 20; Max 90; N=1196 Public Sector: Mean 45.06; Median 45; Mode 40; Std. Dev. 6.492, Min 24; Max 68 N=776 Nonprofit Sector: Mean 50.55; Median 50; Mode 50; Std. Dev. 8.669, Min 20; Max 90 N=420
Hours Worked: During a typical work week, about how many hours do you work (including work done outside of office)?
Part-time (1-34 hr/week): Yes, 11, .9% Full-time (35-40 hr/week): Yes, 349, 29% Lower overtime (41-48 hr/week): Yes, 333, 28% Medium overtime (49-69 hr/week): Yes, 493, 41% Higher overtime (70+ hr/week): Yes, 10, .8%, N=1196
Organizational Involvement (5 items)
Mean 17.08; Std Error of Mean 0.08; Median 18; Mode 20; Std. Deviation 2.814; Variance 7.92; Min 5; Max 20; N=1203
Total days off: sick and on vacation.
Total: Mean 19.39; Median 18; Mode 20; Std. Deviation 13.545; Min 0; Max 173; N=1219 Frequencies for Independent Variables: N=1220 Have you ever had a mentor?: Frequencies: Yes, 647, 53%, N=1220
Public Sector: Have you ever had a mentor: Yes, 406, 52%, N=790 Nonprofit Sector: Have you ever had a mentor: Yes 241, 57%, N=430
Age: Age of respondent in 2005: Range 23-81; Mean 49; Standard Deviation 8.913; N=1204
Generation X (1963-1981): Frequency: 266, 22%; N=1204 Nonprofit Sector: Frequency: 94, 22%; N=430 Public Sector: Frequency: 172, 22%, N=790 Employees over 50 yrs old: Frequency: 407, 52%
Gender: Frequencies: Female 538, 46%, N=1180
Public Sector: Female 346, 44%, N=788 Nonprofit Sector: Female 192, 49%, N=392
State: Frequencies: Illinois 661, 56%; Georgia 530, 44%; N=1191
Public Sector: Illinois 361; Georgia 433; Total=794 Nonprofit Sector: Illinois 300; Georgia 97; Total=397
Race: Frequencies: Nonwhite 165, 14% N=1171
Public Sector: Nonwhite 145, 19% N=790 Nonprofit Sector: Nonwhite 20, 5% N=430
Education: Highest level of formal education (0-3 scale): Frequencies: Less than college 163, 14%; College
graduate 495, 41%; Graduate or professional school 546, 45%; N=1204 Public Sector: Frequencies: Less than college 123, 15.7%; College graduate 331, 42%; Graduate or
professional school 330, 42%; N=790

139
Nonprofit Sector: Frequencies: Less than college 40, 9.5%; College graduate 164, 39%; Graduate or professional school 216, 51%; N=430
Current job: Manager: Frequencies: Yes 860, 71% N=1219
Public Sector: Yes 505, 64% N=790 Nonprofit Sector: Yes 355, 83% N=430
Current job: Was a promotion in current organization: Total: Frequencies: Yes 578, 47% N=1219 Public Sector: Frequencies: Yes 439, 56% N=790 Nonprofit Sector: Frequencies: Yes 139, 32% N=430
Current job: Was a promotion from different organization: Total: Frequencies: Yes 263, 22% N=1219 Public Sector: Frequencies: Yes 104, 13% N=790 Nonprofit Sector: Frequencies: Yes 159, 37% N=430
Current job: Tenure: Range 0-39 years, Mean 7.63, Standard Deviation 6.50, N=1157 Public Sector: Range 0-39 years, Mean 7.28, Standard Deviation 6.342, N=759 Nonprofit Sector: Range 0-33 years, Mean 8.29, Standard Deviation 6.719, N=398
Last job was in a private organization: Frequencies: Yes 199, 16% N=1210
Public Sector: Frequencies: Yes 94, 12% N=790 Nonprofit Sector: Frequencies: Yes 105, 25% N=430
Currently, are you either married or living with a domestic partner?
Total: Frequencies: Yes 952, 79%, N=1220 Public Sector: Yes 613, 78%, N=790 Nonprofit Sector: Yes 339, 80%, N=430
How many dependent children do you have?
Total: Range 0-14, mean .96, standard deviation 1.193, N=1195 Public Sector: Range 0-14, mean 1.01, standard deviation 1.233, N=778 Nonprofit Sector: Range 0-5, mean .88, standard deviation 1.109, N=417
Number of employees supervised, if any: Frequencies: Range 0-1200, Mean 21.12, Standard Deviation 73.084;
N=1057 Public Sector: Range 0-1200, Mean 24.20, Standard Deviation 82.396; N=667 Nonprofit Sector: Range 0-900, Mean 15.86, Standard Deviation 53.220; N=390
Organization Size: Number of full-time employees: Frequencies: Range 1-18700, Median 833; Mean 3525.71;
Mode 18700; Standard Deviation 5703.103; N=1125 Public Sector: Range 11-18700, Median 2007; Mean 5220.09, Mode 18700; Standard Deviation 6316.53; N=752 Nonprofit Sector: Range 1-7500, Median 32; Mean 109.7, Mode: 4; Standard Deviation 472.887; N=373
Organization Age: Frequencies: Range 1798-2005, Median 1949; Mean 1947.10; Mode 1972; Standard
Deviation 37.727; N=1091 Public Sector: Range 1798-2004, Median 1960; Mean 1949.56, Mode 1972; Standard Deviation 38.691; N=693
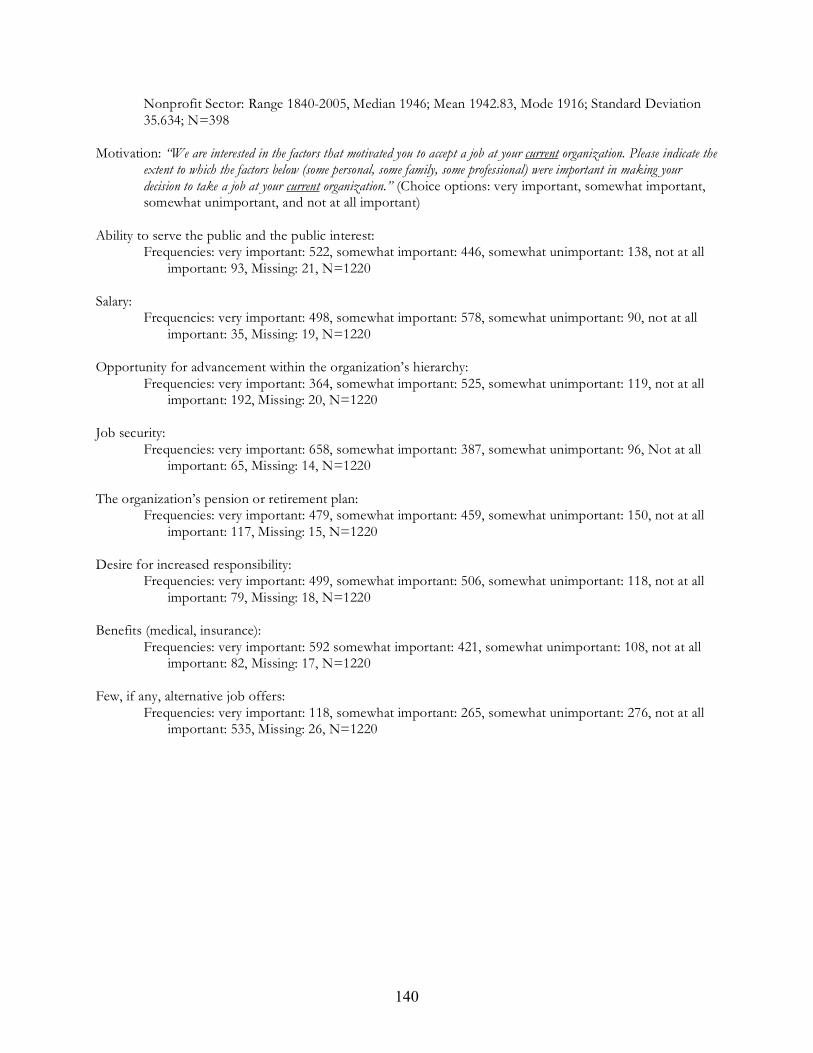
140
Nonprofit Sector: Range 1840-2005, Median 1946; Mean 1942.83, Mode 1916; Standard Deviation 35.634; N=398
Motivation: “We are interested in the factors that motivated you to accept a job at your current organization. Please indicate the
extent to which the factors below (some personal, some family, some professional) were important in making your decision to take a job at your current organization.” (Choice options: very important, somewhat important, somewhat unimportant, and not at all important)
Ability to serve the public and the public interest:
Frequencies: very important: 522, somewhat important: 446, somewhat unimportant: 138, not at all important: 93, Missing: 21, N=1220
Salary:
Frequencies: very important: 498, somewhat important: 578, somewhat unimportant: 90, not at all important: 35, Missing: 19, N=1220
Opportunity for advancement within the organization’s hierarchy:
Frequencies: very important: 364, somewhat important: 525, somewhat unimportant: 119, not at all important: 192, Missing: 20, N=1220
Job security:
Frequencies: very important: 658, somewhat important: 387, somewhat unimportant: 96, Not at all important: 65, Missing: 14, N=1220
The organization’s pension or retirement plan:
Frequencies: very important: 479, somewhat important: 459, somewhat unimportant: 150, not at all important: 117, Missing: 15, N=1220
Desire for increased responsibility:
Frequencies: very important: 499, somewhat important: 506, somewhat unimportant: 118, not at all important: 79, Missing: 18, N=1220
Benefits (medical, insurance):
Frequencies: very important: 592 somewhat important: 421, somewhat unimportant: 108, not at all important: 82, Missing: 17, N=1220
Few, if any, alternative job offers:
Frequencies: very important: 118, somewhat important: 265, somewhat unimportant: 276, not at all important: 535, Missing: 26, N=1220