Embed Size (px)
Citation preview
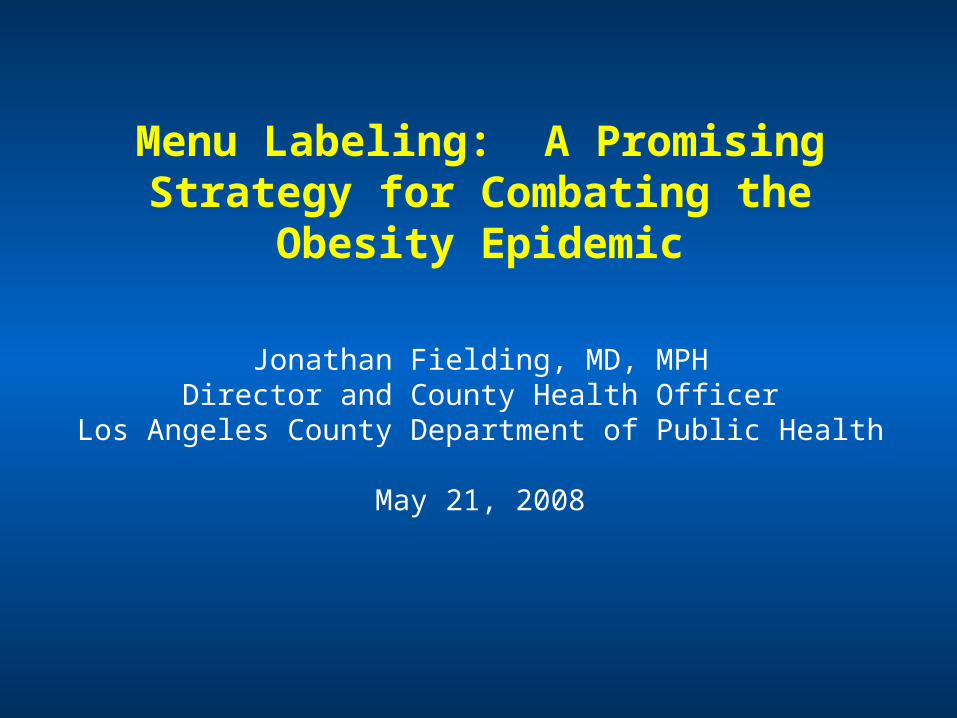
Menu Labeling: A Promising Strategy for Combating the
Obesity Epidemic
Jonathan Fielding, MD, MPHDirector and County Health Officer
Los Angeles County Department of Public Health
May 21, 2008

Prevalence of Overweight Among Children in the Prevalence of Overweight Among Children in the United States (Source: NHANES)United States (Source: NHANES)
4.2 4.0
6.5
11.3
15.3
4.66.1
5.0
10.5
15.5
0
5
10
15
20
1963-65 1971–74 1976–80 1988–94 1999–2000
NHANES Study Period
Pre
vale
nce
(%)
6–11 years of age 12–19 years of age


What’s at Stake?
• Overweight children overweight adults
• Overweight during adulthood associated with heart disease, stroke, diabetes, arthritis, and cancer
• Adverse effects during childhood
– medical (hypertension, dyslipidemia, type 2 diabetes, insulin resistance, asthma, hormonal changes)
– psychosocial (reduced HRQOL, stigma and social marginalization, poor school performance)
• Obesity epidemic accounted for 27% of the growth in health care spending in the U.S. from 1987 to 2001 (Thorpe, et al. Health Affairs, 2004)
• Inflation-adjusted hospital costs associated with obesity among children tripled during the 1980s and 1990s (Wang & Dietz, Pediatrics, 2002)

Prevalence of Obesity Among Adults in Los Angeles County, 1997-2005
14.3%16.7%
19.3%20.9%
0%
10%
20%
30%
40%
1997 1999 2002 2005
Year
Pre
va
len
ce
(%
)
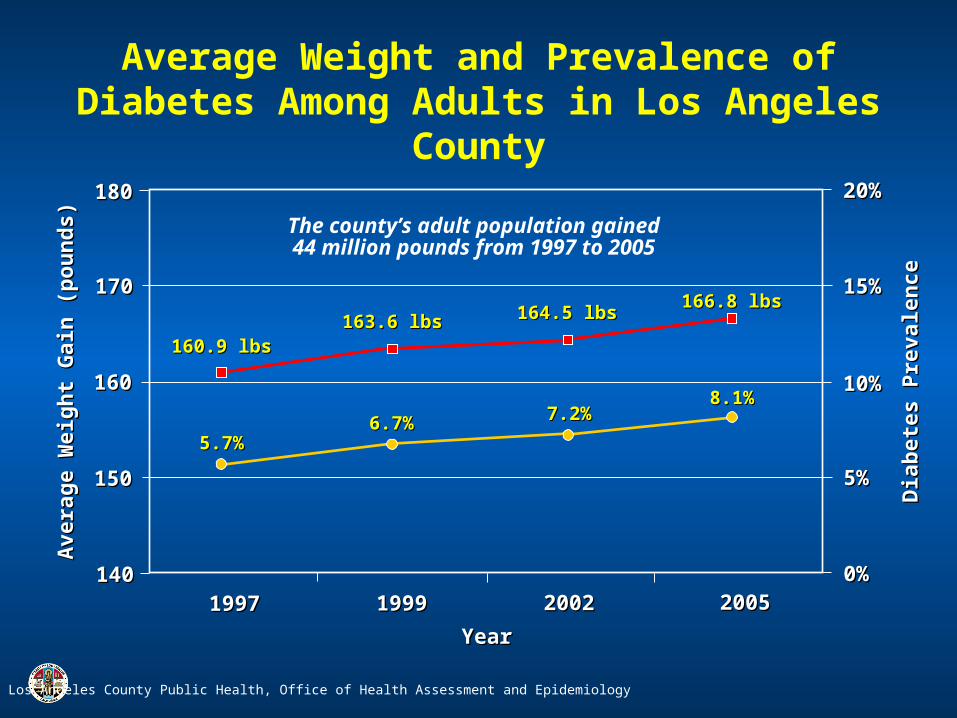
Average Weight and Prevalence of Diabetes Among Adults in Los Angeles County
Los Angeles County Public Health, Office of Health Assessment and Epidemiology
19971997 19991999 20022002 200520050%0%
5%5%
10%10%
15%15%
20%20%
140140
150150
160160
170170
180180
Ave
rag
e W
eig
ht
Gai
n (
po
un
ds)
Ave
rag
e W
eig
ht
Gai
n (
po
un
ds)
Dia
bet
es P
reva
len
ceD
iab
etes
Pre
vale
nce
YearYear
5.7%5.7%6.7%6.7% 7.2%7.2%
8.1%8.1%
160.9 lbs160.9 lbs163.6 lbs163.6 lbs 164.5 lbs164.5 lbs
166.8 lbs166.8 lbs
The county’s adult population gained44 million pounds from 1997 to 2005

Trends in the Leading Causes of Death,Los Angeles County, 1994-2004
Rate (per 100,000) *
Cause of death 1994 2004 Percent change
Coronary heart disease 276 176 -36.2
Stroke 63 48 -23.8
Lung cancer 48 35 -27.1
Emphysema 35 31 -11.4
Pneumonia/Influenza 44 26 -40.9
Diabetes 20 25 +25.0
Colorectal Cancer 20 16 -20.0
Alzheimer’s Disease 5 16 +220.0
Breast Cancer (female) 30 23 -23.3
Homicide 17 10 -41.2
HIV/AIDS 27 5 -81.5
* age-adjusted to year 2000 U.S. standard population
Los Angeles County Public Health, Office of Health Assessment and Epidemiology

Rates of Gestational Diabetes, Los Angeles County
47.9
14.50
10
20
30
40
50
60
1991 1993 1995 1997 1999 2001 2003
Year
Ra
te/1
,00
0 M
oth
ers

20.4% 20.9% 21.9% 22.2%23.3% 22.9%23.0%
18.9%
0%
5%
10%
15%
20%
25%
30%
35%
1999 2000 2001 2002 2003 2004 2005 2006 2007 2008 2009 2010
Ob
es
ity
Pre
va
len
ce
Obesity Rate Among 5th, 7th, and 9th Graders inObesity Rate Among 5th, 7th, and 9th Graders inLos Angeles County Public Schools, 1999-2007, Los Angeles County Public Schools, 1999-2007,
California Physical Fitness Testing ProgramCalifornia Physical Fitness Testing Program
Healthy People 2010 Goal (<5%)
Prevalence of Obesity
Projected obesity prevalence assuming linear trend

10
Cities/Communities with Lowest and Cities/Communities with Lowest and Highest Childhood Obesity Rates Highest Childhood Obesity Rates
*Table excludes cities/communities where number of students with BMI data < 500.
Source: California Physical Fitness Testing Program, California Department of Education. Includes 5th, 7th, and 9th graders enrolled in LA County public schools.
Top 10*
City/Community Name
2005 Youth Obesity
Rate (%)
Rank of Economic Hardship (1 - 128)
Manhattan Beach 4.2 2
Palos Verdes Estates 6.3 5
Beverly Hills 6.9 19
San Marino 7.1 15
Agoura Hills 7.3 10
Calabasas 8.0 8
South Pasadena 9.0 17
La Canada Flintridge 11.4 18
Rancho Palos Verdes 11.6 13
Arcadia 12.3 35
Average 10 lowest 8.0%
Bottom 10*
City/Community Name
2005 Youth Obesity
Rate (%)
Rank of Economic Hardship(1 - 128)
Cudahy 29.4 123
West Whittier-Los Nietos 29.7 81
West Puente Valley 30.0 90
Bell 30.2 115
Willowbrook 30.5 116
Huntington Park 30.6 122
East Los Angeles 31.9 117
Florence-Graham 32.0 128
San Fernando 32.9 103
Maywood 37.4 121
Average 10 highest 31.5%

Many Factors Contributing to the Obesity Epidemic: a Partial List
• Increased marketing of junk food and sodas to children
• Increased portion size of food and beverages
• More meals consumed outside the home
• Decreased physical education in schools
• Fewer safe areas for exercise in communities
• Increased TV and computer time
• Less access to fresh, nutritious, affordable food in underserved areas (and more access to cheap calorie-dense unhealthy foods)
• Increased time spent in cars
• Community design that discourages walking and bicycling

Why do People Overeat?
• Eating influenced more by environmental factors than conscious choice (eating is an “automatic” behavior; Cohen, 2008)
• People served larger portions eat more food, regardless of other factors
• The amount of food eaten increases as the effort to eat it decreases
• Once people begin eating, they usually continue until all the food is gone or until some other external occurrence changes the situation

Implications for PreventionImplications for Prevention
• No single magic bullet—will require multiple strategies operating at multiple levels across multiple sectors.
• Reversing the epidemic will require changing dietary behaviors—a recent study suggests that most of the epidemic (an estimated 75%) in the U.S. is attributable to increased dietary intake rather than reduced caloric expenditure (Bleich et al., 2008).
• Changing dietary behaviors will require changing the “toxic” food environment.

Why the Interest in Menu Labeling?
• Americans eating out more than ever before--in LA County, one in four children 2-17 years of age ate fast food in the past day (2005 LA County Health Survey).
• Supersizing of restaurant food and beverage portions has become widespread.
• Fast food consumption linked with increased caloric intake and excess weight gain.
• Studies have shown that most people (even nutritionists) greatly underestimate the caloric content of restaurant menu items.
• Calorie and other nutritional information not generally available at the point of purchase in restaurants (in contrast to packaged food products which are required by the FDA to include nutrition information).

Menu Labeling Initiatives
• In December 2006, New York City passed an ordinance requiring menu labeling in restaurants that already provide this information (e.g., on websites).
• The New York State Restaurant Association sued in U.S. District Court in 2007 and the ordinance was overturned.
• New York City introduced a revised ordinance that to date has withstood legal challenge and is currently being implemented.
• In July 2007, Seattle-King County adopted a menu and menu board labeling ordinance in restaurant chains, to take effect in August 2008.
• In California, a menu labeling bill (SB 120) was introduced in 2007 (passed by the legislature but vetoed by the Governor) and reintroduced in 2008 (SB 1420).
• Alternative bill (AB 2572) also introduced in 2008.
• Recent county initiatives (San Francisco, Santa Clara)

2008 Menu Labeling Legislation
California Center for Public Health Advocacy, April 2008www.publichealthadvocacy.org 530 297-6000

Require chain restaurants with > 15 outlets in CA to provide nutritional information at point of purchase
- Menu Boards: calories
- Menus: calories, fat, sat/trans fat, carbohydrate, sodium
Applies to standard menu items only
SB 1420 - Menu Labeling
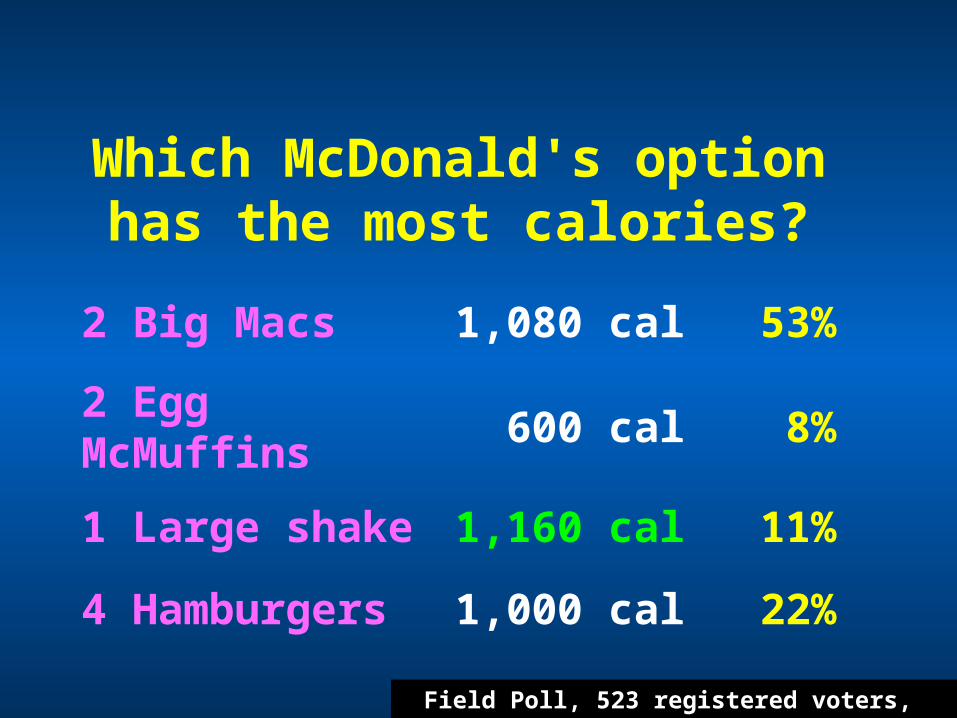
Because common sense doesn’t help

Which McDonald's option has the most calories?
2 Big Macs 1,080 cal 53%
2 Egg McMuffins 600 cal 8%
Large shake 1,160 cal 11%
4 Hamburgers 1,000 cal 22%
Field Poll, 523 registered voters, April 2007

Which McDonald's option has the most calories?
2 Big Macs 1,080 cal 53%
2 Egg McMuffins 600 cal 8%
1 Large shake 1,160 cal 11%
4 Hamburgers 1,000 cal 22%
Field Poll, 523 registered voters, April 2007
Which McDonald's option has the most calories?
2 Big Macs 1,080 cal 53%
2 Egg McMuffins 600 cal 8%
1 Large shake 1,160 cal 11%
4 Hamburgers 1,000 cal 22%
Field Poll, 523 registered voters, April 2007

Which McDonald's option has the most calories?
2 Big Macs 1,080 cal 53%
2 Egg McMuffins 600 cal 8%
1 Large shake 1,160 cal 11%
4 Hamburgers 1,000 cal 22%
Field Poll, 523 registered voters, April 2007

Which Denny’s option has the fewest calories?
Ham & Cheddar Omelet 595 cal 36%
Country Fried Steak & Eggs 464 cal 11%
French Toast w/ Syrup & Marg 1,003 cal 15%
Pancakes w/ Syrup & Marg 650 cal 29%
Field Poll, 523 registered voters, April 2007

Which Denny’s option has the fewest calories?
Ham & Cheddar Omelet 595 cal 36%
Country Fried Steak & Eggs 464 cal 11%
French Toast w/ Syrup & Marg 1,003 cal 15%
Pancakes w/ Syrup & Marg 650 cal 29%
Field Poll, 523 registered voters, April 2007

Which Denny’s option has the fewest calories?
Ham & Cheddar Omelet 595 cal 36%
Country Fried Steak & Eggs 464 cal 11%
French Toast w/ Syrup & Marg 1,003 cal 15%
Pancakes w/ Syrup & Marg 650 cal 29%
Field Poll, 523 registered voters, April 2007

Which Denny’s option has the fewest calories?
Ham & Cheddar Omelet 595 cal 36%
Country Fried Steak & Eggs 464 cal 11%
French Toast w/ Syrup & Marg 1,003 cal 15%
Pancakes w/ Syrup & Marg 650 cal 29%
Field Poll, 523 registered voters, April 2007

Field Research PollApril 2007
“Support requiring fast food restaurants to provide nutritional information on
menus and menu boards?”
84% of all registered voters supported;
78% Republicans, 88% Democrats
81% men, 88% women
83% Whites, 88% Latinos, 90% African Americans
>75% in every region of the state
>80% of every age group
85% making <$20,000, 81% making >$80,000
86% of ≤ high school, 90% graduate degrees
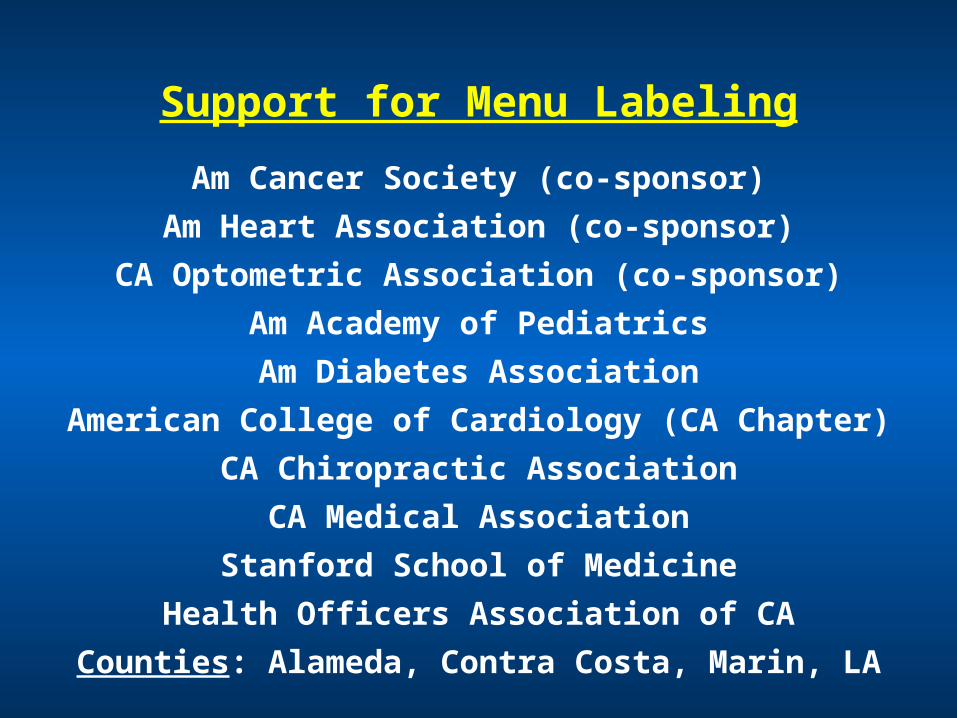
Support for Menu Labeling
Am Cancer Society (co-sponsor)
Am Heart Association (co-sponsor)
CA Optometric Association (co-sponsor)
Am Academy of Pediatrics
Am Diabetes Association
American College of Cardiology (CA Chapter)
CA Chiropractic Association
CA Medical Association
Stanford School of Medicine
Health Officers Association of CA
Counties: Alameda, Contra Costa, Marin, LA

But What is the Potential Impact of Menu Labeling on the Obesity Epidemic?
• LA County DPH recently conducted a health impact assessment (HIA) to quantify the potential impact of menu labeling, as specified in SB 1420, on the obesity epidemic in Los Angeles County.
• The study found that if menu labeling resulted in just 10% of restaurant patrons ordering reduced calorie meals (with an average reduction of 100 calories per meal), a total of 38.9% of the 6.75 million pound average annual weight gain in the county population (5 yrs and older) would be averted.
• Significantly larger impacts could be realized with increased consumer response to the posted calorie information.

Results (sensitivity analysis)
AverageAmount of
CalorieReduction
Percentage of Patrons Who Purchase a Lower-Calorie Meal as a Result of Menu Labeling
10% 20% 30% 40% 50%
25 9.7% 19.4% 29.1% 38.9% 48.6%
50 19.4% 38.9% 58.3% 77.7% 97.2%
75 29.1% 58.3% 87.4% 116.6% 145.7%
100 38.9% 77.7% 116.6% 155.4% 194.3%
125 48.6% 97.2% 145.7% 194.3% 242.9%
150 58.3% 116.6% 174.9% 233.2% 291.5%
175 68.0% 136.0% 204.0% 272.0% 340.0%
200 77.7% 155.4% 233.2% 310.9% 388.6%Green — population weight gain averted (net weight gain still exceeds net weight loss)Yellow — population weight gain averted (net weight loss now exceeds net weight gain)

How feasible are these calorie reductions?
• Analysis of data from three fast food chains indicate that changing:
- from a large to medium soft drink would save 95 calories
- from a large to medium order of french fries would save 163 calories
- from a double meat to single meat patty hamburger would save 244 calories

Conclusions
• Small reductions in calories consumed at large chain restaurants by a relatively small percentage of patrons have the potential to significantly reduce the obesity epidemic, as measured by population weight gain.
• Impact on population weight gain could be greatly enhanced with public education, pricing incentives, or other strategies to increase the percentage of patrons that order reduced calorie meals.
• Potential indirect benefits
- increased public awareness regarding portion size, potentially leading to social norm change toward smaller portions- create incentives for large chain restaurants to offer lower calorie menu options

Subway Menu Board in NYC