Embed Size (px)
Citation preview
Mercosur: The impact of Preferential Liberalisation and prospects for
the Customs Union∗
André Filipe Zago de Azevedo1
Abstract This paper relies on a computable general equilibrium model from the Global Trade Analysis Project (GTAP) to infer directly the impact of Mercosur on welfare in both members and non-member countries and also the existence of trade creation and trade diversion. The simulations examine the effects of the free trade area between 1991 and 1995 and the likely outcome of the establishment of the custom union arising from the implementation of the common external tariff in 2006. The results show that for all bloc members the impact of convergence to the CET is much smaller than that observed under regional liberalisation between 1991 and 1995.
1. Introduction Computable general equilibrium (CGE) models have been widely employed to evaluate the
impact of Preferential Trade Agreements (PTAs) on both members and non-member countries.
They allow estimation of welfare changes associated with preferential reductions in the protection
structure, covering both static and dynamics effects of integration. Potential static gains arise from
the specialisation of production according to comparative advantage, changes in terms of trade,
improved efficiency due to increased foreign competition and economies of scale. Dynamic effects
refer to changes in the rate of economic growth. Baldwin and Venables (1995) divide the CGE
analysis into three different generations based on these effects. The first phase is based on a perfect
competition framework where no dynamics is allowed. In this model only static gains associated
with better resource allocation and improved terms of trade take place. The second phase comprises
evaluations based on imperfect competition with scale economies and product differentiation
playing an important role in some industrial sectors. The third phase introduces the effects of
integration on saving, investment and economic growth.
An interesting point to note is the apparent trade-off between the magnitude of empirical
results obtained from approaches based on different phases and the confidence in the understanding
of these different effects (e.g. Allen et al., 1996; and Hoekman et al., 1998). On the one hand the
∗ This working paper heavily relies on chapter 5 of my thesis submitted for the degree of PhD at University of Sussex in 2001. I would like to thank the Brazilian Federal Agency for Post-Graduate Education (CAPES) for the financial support. I’m also grateful to Aki Kuwahara from UNCTAD for providing data and to Alan Winters, Peter Holmes, David Evans, Edmund Fitzgerald and Jim Rollo for comments and suggestions. The usual disclaimer applies.
2
size of results of approaches based on scale, competition and growth are greater than the gains
obtained by models based on static efficiency and terms of trade changes. On the other hand,
models based on perfect competition involve policy changes of known magnitude and robust
analytical methods, while models from the second and third generation involve inference from a
body of theory with plenty of controversy in relation to issues such as the extent of scale economies
and the estimation of price-cost margins in imperfectly competitive industries. As a result, this
paper uses the Global Trade Analysis Project (GTAP) model, based on perfect competition and
constant returns to scale, to perform an applied general equilibrium evaluation of welfare and trade
pattern changes in both members and non-member countries caused by Mercosur formation.
Two sets of simulations are performed. The first set deals with an analysis of changes in
tariffs from 1991 to 1995, and seeks to distinguish the effects of the preferential trade liberalisation
under the auspices of Mercosur and the unilateral measures adopted simultaneously by its members.
This set consists of two experiments. Initially intra-bloc tariffs are eliminated while tariffs on
imports from third countries are maintained. Then these results are compared with those obtained
from trade liberalisation on a Most Favoured Nation (MFN) basis assuming that the difference
between these two simulations will represent the effective role played by the preferential agreement.
The isolation of the effects that could be attributed exclusively to the bloc formation showed that
most of allocative gains observed under the preferential experiment stemmed from external rather
than internal liberalisation. The second set of simulations examines the implementation of the
common external tariff (CET) on imports from third countries in 2006, starting with the preferential
situation in 1995. The results show that for all bloc members the impact of convergence to the CET
is much smaller than that observed under regional liberalisation between 1991 and 1995.
The paper is organised as follows. Section two presents the regional and sectoral
aggregation chosen for all simulations and the economy in the initial equilibrium in 1995. The
details of the experiments, with emphasis on direction and magnitude of tariff changes as a result of
the simulations are reported in section three. Section four presents the results stressing trade pattern
and welfare consequences of the integration of Mercosur members. The last section concludes.
2. Aggregation and the Pre-Simulation Tariffs GTAP model of global trade (Hertel, 1997) is a standard, multi-region, applied general
equilibrium model that assumes constant returns to scale and perfect competition in production
activities.2 Version 4 of GTAP database (McDougall et al., 1998) discriminates between 45 regions
1 PhD at University of Sussex and Post Doctoral fellow at the Post graduation program in economics at the Federal University of Rio Grande do Sul (UFRGS). 2 Recently, GTAP model have also incorporated imperfect competition (e.g. Francois, 1998).
3
and 50 commodity groups that could be aggregated according to the researcher’s interest. Table 1
shows the regional and product aggregation used in the experiments. The regions are aggregated
into Argentina, Brazil, Uruguay (separated so as to allow measurement of trade and welfare effects
in each of these members of the bloc), the EU, NAFTA, the Andean Pact, ASEAN+Japan, and the
rest of the world. The criterion to establish this aggregation selected the members of the bloc and
those regions with the larger trade ties with bloc members. As a result, only about one quarter of
trade of each Mercosur member was made with the rest of the world region. Paraguay, the smallest
member of the bloc in terms of GDP and trade, is the only member of Mercosur that is not assessed
separately by the simulations. The 50 commodities distinguished in GTAP 4 database were grouped
into 10 aggregates: grains, other agricultural products, livestock, extraction, processed food,
clothing, transport equipment, machinery, other manufactures and services. They were selected by
their importance in terms of trade, bearing in mind the convenience of disaggregating both
agricultural products and manufactures.
Table 1: Regional and Commodity Aggregation
Regional Aggregation Commodity Aggregation 1. Argentina 1. Grains 2. Brazil Paddy rice, wheat, cereal grains nec 3. Uruguay 2. Other Agric. Prods 4. EU 5. NAFTA
Vegetables, fruit, nuts, oil seeds, sugar cane, sugar beet, plant-based fibers, crops nec
6. ANDEAN PACT 3. Livestock 7. ASEAN+JAPAN 8. ROW
Bovine cattle, sheep and goats, horses, animal products, raw milk, wool, silk-worm cocoons
4. Natural Resource, Extractive and related industries Forestry, fishing, coal, oil, gas, minerals nec, petroleum, coal
products 5. Processed Food Bovine meat prods, Meat products nec, vegetable oils and fats, dairy
products, processed rice, sugar, food products nec, beverages and tobacco products
6. Clothing Textiles and wearing apparel 7. Transport Equipment Motor vehicles and parts, transport equipment nec 8. Machinery and Electronic Prods Electronic equipment, machinery and equipment nec 9. Other manufactures Leather products, wood products, paper products, publishing,
chemical, rubber, plastic products, mineral products nec, ferrous metals, metals nec, metal products, manufactures nec
10. Services Electricity, gas manufacture, distribution, water, construction, trade,
transport, financial, business, recreational services, public admin. and defense, education, health, dwellings & services
Source: GTAP 4 Database, McDougall et al. (1999)
4
Before proceeding to the simulations it is worth examining the protection structure in force
in the simulations performed in this paper. Bilateral tariffs at the GTAP level of aggregation are set
up by aggregating applied MFN tariff rates from tariff lines, at HS 06 or 08-digit level, to the GTAP
commodity groups using bilateral import value weights. Thus, the model provides bilateral tariff
rates that reflect composition differences in tariffs and trade in 1995. Positive values represent an
import tariff while negative ones represent an import subsidy. The simulations performed in this
paper, however, change the bilateral weighted tariffs to specific unweighted tariff targets in 1991
and 2006, representing the MFN tariffs and the CET, respectively. In order to avoid comparisons
between two equilibrium generated with weighted and unweighted imported tariffs it was decided
to change the initial equilibrium in 1995, adjusting the weighted tariffs to the unweighted tariffs in
force in this year.3 Thus, in all simulations performed in this paper, the 1995 unweighted tariffs are
altered in order to reach a target unweighted uniform tariff in 1991 (pre-simulation period) and
2006 (implementation of the CET).4
Table 2: Tariff Structure in Initial Equilibrium (1995) as in the ‘PRF Experiment’ (%)
Arg Bra Ury Sectors Intra-
Bloc Extra-Bloc
Intra-Bloc
Extra-Bloc
Intra-Bloc
Extra-Bloc
Grains 0.00 2.57 0.00 2.57 0.00 2.57 OthAgric 0.00 10.08 0.00 10.29 0.00 10.29 Livestock 0.00 7.67 0.00 7.67 0.00 7.67 Extraction 0.00 8.69 0.00 8.39 0.00 8.42 Food 0.00 9.01 0.00 9.32 0.00 9.00 Cloth 0.00 7.99 0.00 8.12 0.00 7.81 TransEqu 0.00 11.17 0.00 16.73 0.00 5.82 Mach 0.00 10.79 0.00 16.69 0.00 7.62 OthManf 0.00 15.43 0.00 14.55 0.00 14.56
Source: Author’s own calculations
Table 2 provides the unweighted tariff structure in the initial equilibrium in 1995 that serve
as the basis for the ‘Preferential simulation’, in which intra-bloc preferences are disregarded.5 As
regards the tariff structure itself, it is possible to observe that in most sectors in 1995 Mercosur
members had very similar, if not identical tariffs, applied on imports from non-member countries,
especially in agricultural products, as a result of the start of tariff convergence to the CET. The
differences are more evident in manufactures, where Brazil applied the highest and Uruguay the
3 The unweighted average tariffs in 1991, 1995 and 2006 were aggregated to the GTAP 10 commodity groups from the tariff lines at HS 06-digit level provided by Aki Kuwahara. 4 The other option would consider the weighted tariffs in both periods, but the lack of trade data at HS 06-digit level did not allow adoption of this procedure. 5 In the ‘Multilateral experiment’ all regions, including the bloc members, face the same tariffs as in table 2 for the regions outside the bloc.
5
lowest tariffs, while Argentina was in an intermediate situation. In the case of transport equipment,
for instance, the Brazilian tariff is about three times higher than that applied by Uruguay. The
difference was also significant in the case of machinery, in which the Uruguayan tariff was less than
half that applied by Brazil. In the remaining manufactures the differences in tariffs were much
smaller. The tariff structure of bloc members is fundamental to understanding the potentially
significant impact on trade patterns and welfare of its members that could be caused by elimination
of intra-bloc tariffs and the changes in extra-bloc tariffs.
3. The Experiments The two major phases of Mercosur formation are internal trade liberalisation and full
implementation of the CET. The former took place between 1991 and 1994 and was completed at
the beginning of 1995, while the latter is scheduled to happen in 2006. The simulations performed
in this paper seek to capture the effects on trade and welfare in members and non-member countries
of Mercosur caused by each of these different phases of the bloc formation.6 The GTAP 4 database
is quite useful for the problem in hand, since it generates its benchmark equilibrium for 1995, the
year in which the intra-bloc duty-free started. Then based on this 1995 equilibrium it would be
possible to back cast for 1991 using the tariffs in force in that year allowing us to estimate the
impact of the creation of free trade based solely on internal liberalisation. On the other hand starting
with the initial equilibrium in 1995 it would be possible to measure the effects exclusive to the
implementation of the CET in 2006.
However, two problems mean the procedure is not as simple as it seems at the first glance.
The first is that although, in principle, GTAP 4 database adjusts the protection data imposing zero
import duty and export subsidy rates within free trade areas for generating the benchmark
equilibrium in 1995, this version only recognises four FTAs in that year not including Mercosur.7
As a result, in the GTAP database all commodity groups face either a tariff or a subsidy in intra-
Mercosur trade. Thus while trade data reflects preferences the policy data (tariff + subsidies) do not.
Thus it is necessary to make them consistent. In order to adjust the protection data, eliminating all
tariffs within the bloc and changing the members’ external protection structure in order to reach a
6 The experiments were conducted with the new multi-regional general equilibrium (New MRGE) closure with output, prices and income endogenous for all regions, while population, policy and technical change variables are exogenous to the model. This closure is appropriate to capture the substitution in production and consumption between commodity groups that takes place due to trade liberalisation. The so-called ‘fixed regional composition’ is adopted in all simulations, which assumes that regional composition of global capital stocks is left unaltered (rordelta=0). Rordelta is a binary coefficient, which determines the mechanism of allocating investment funds across regions, which assumes the value of zero (fixed regional composition) and one (rate of return component). Since the objective is to measure the effects of Mercosur formation, the experiments involve changes only in import tax rates undertaken by bloc members with no scope for other regions to reciprocate.
6
uniform unweighted import tariff, the ‘Altertax’ simulation was used.8 This adjustment in intra and
extra-bloc tariff rates represents the modified initial equilibrium for the first simulation performed
in this paper. In order to measure the impact of intra-bloc trade liberalisation a back cast simulation
was initially performed applying the unweighted import tariff in force in 1991 for all regions,
creating the ‘Preferential experiment’ (PRF).9 However, there is another problem with this
simulation not related with the GTAP database. The problem is that tariff changes implemented in
this simulation capture both unilateral trade liberalisation of the early 1990s, adopted on a MFN
basis, and preferential measures adopted to liberalise intra-Mercosur trade in the same period. Thus,
it would not be possible to distinguish Mercosur effects from the unilateral measures undertaken by
each individual member of the bloc. In order to disentangle the bloc effects from the unilateral
measures, a second simulation was performed. In this experiment, both members and non-member
countries face the same 1995 unweighted MFN tariffs and again a back cast, based on the
unweighted MFN import tariff in force in 1991, was performed generating the ‘Multilateral
experiment’ (MFN). This seeks to capture the impact provoked by non-discriminatory changes in
tariffs from 1991 to 1995. The difference between the Preferential and the Multilateral experiments
will then represent the actual impact of the bloc on trade patterns and welfare.
Table 3: Situation of Import Tariffs by Experiment
Experiments Members Non-Members Pre-Simulation Post-Simulation Pre-Simulation Post-Simulation
Altertax 1995 GTAP zero 1995 GTAP 1995 MFN PRF zero 1991 MFN 1995 MFN 1991 MFN MFN 1995 MFN 1991 MFN 1995 MFN 1991 MFN CET zero zero 1995 MFN 2006 CET
The second set of simulations seeks to capture the effects attributed exclusively to
introduction of the CET in 2006. The ‘CET experiment’ starts from the same 1995 modified
equilibrium as the ‘PRF experiment’, with intra-bloc free trade and the unweighted tariff applied
only on imports from non-member countries created by the ‘Altertax’ program. Thus, while the first
set of simulations measured the impact of internal trade liberalisation, which occurred between
7 The FTAs recognised by GTAP 4 database are the EU, EU-EFTA, NAFTA and Anzcerta. 8 ‘'Altertax’ is a procedure to improve the quality of the base period data whenever better information concerning the base year is available. It uses a special closure and a special parameter file to ensure that changes in tariff rates alter other cost and sales shares as little as possible. It works as in a usual simulation, in which tariff rates are modified and the GTAP model calculates the changes in other flows. As pointed out by Malcolm (1998:01) ‘the difference between a normal experiment and this procedure is that, in the former case, model structure and parameter values are chosen to represent economic reality as accurately as possible, while in the latter case, they are chosen to minimise disturbances to the database.’ 9 The unweighted import tariff for each commodity group and for each member of Mercosur was calculated from the HS 06-digit data, establishing the same MFN tariff for all regions.
7
1991 and 1995, the second set estimates the effects of formation of the customs union scheduled for
2006, completing the effects of the customs union. Table 3 reports the tariffs in place in members
and non-member countries in both the pre and post-simulations. It can be seen that the only, and
fundamental, difference between the PRF and the MFN experiments is that in the latter bloc
members also face the MFN 1995 tariffs instead of free trade. Previous attempts to assess the
impact of Mercosur on trade pattern and welfare based on GTAP version 3 started with a
benchmark equilibrium for 1989 (e.g., Brandão et al., 1998; and Ferreira Filho, 1999) estimating the
impact of the free trade area and the customs union together, not investigating the specific effects
generated by each one of these two phases of integration. As a result, although those authors
recognised the problem, much of the ‘Mercosur effect’ captured by those estimates would be due to
the unilateral dimension of the countries’ trade policies.
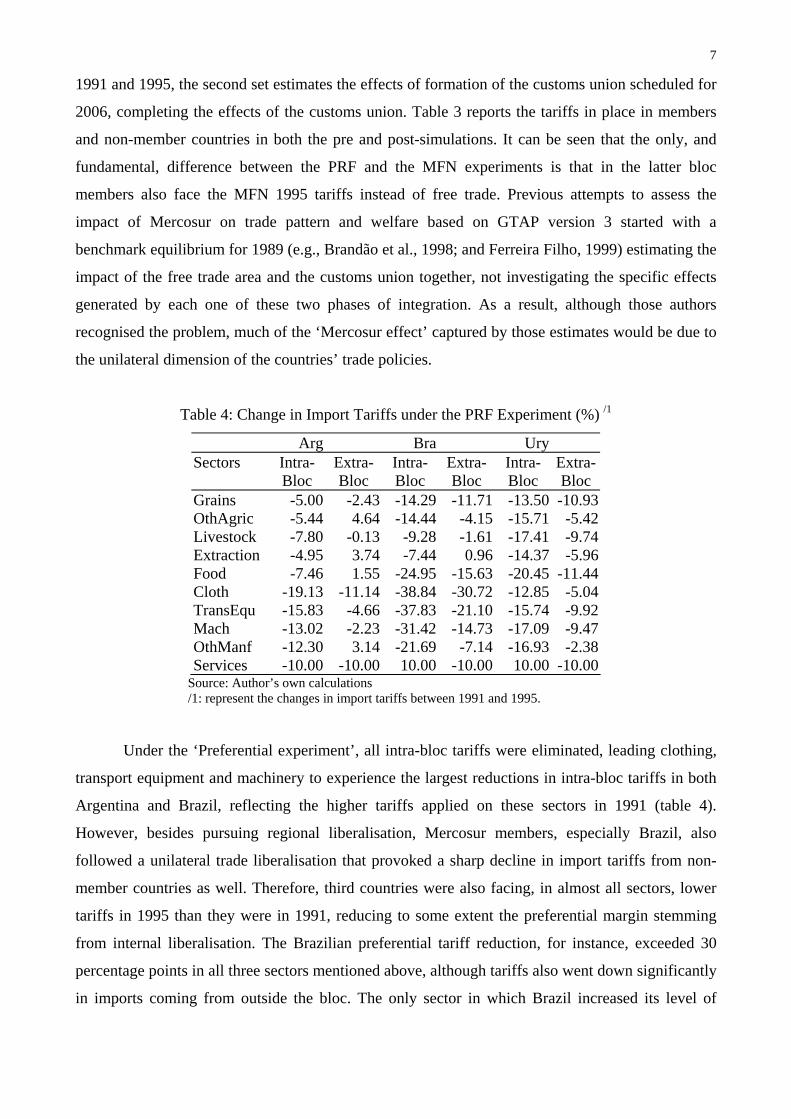
Table 4: Change in Import Tariffs under the PRF Experiment (%) /1
Arg Bra Ury Sectors Intra-
Bloc Extra-Bloc
Intra-Bloc
Extra-Bloc
Intra-Bloc
Extra-Bloc
Grains -5.00 -2.43 -14.29 -11.71 -13.50 -10.93 OthAgric -5.44 4.64 -14.44 -4.15 -15.71 -5.42 Livestock -7.80 -0.13 -9.28 -1.61 -17.41 -9.74 Extraction -4.95 3.74 -7.44 0.96 -14.37 -5.96 Food -7.46 1.55 -24.95 -15.63 -20.45 -11.44 Cloth -19.13 -11.14 -38.84 -30.72 -12.85 -5.04 TransEqu -15.83 -4.66 -37.83 -21.10 -15.74 -9.92 Mach -13.02 -2.23 -31.42 -14.73 -17.09 -9.47 OthManf -12.30 3.14 -21.69 -7.14 -16.93 -2.38 Services -10.00 -10.00 10.00 -10.00 10.00 -10.00
Source: Author’s own calculations /1: represent the changes in import tariffs between 1991 and 1995.
Under the ‘Preferential experiment’, all intra-bloc tariffs were eliminated, leading clothing,
transport equipment and machinery to experience the largest reductions in intra-bloc tariffs in both
Argentina and Brazil, reflecting the higher tariffs applied on these sectors in 1991 (table 4).
However, besides pursuing regional liberalisation, Mercosur members, especially Brazil, also
followed a unilateral trade liberalisation that provoked a sharp decline in import tariffs from non-
member countries as well. Therefore, third countries were also facing, in almost all sectors, lower
tariffs in 1995 than they were in 1991, reducing to some extent the preferential margin stemming
from internal liberalisation. The Brazilian preferential tariff reduction, for instance, exceeded 30
percentage points in all three sectors mentioned above, although tariffs also went down significantly
in imports coming from outside the bloc. The only sector in which Brazil increased its level of
8
protection towards non-member countries was extraction. In Argentina, which had a lower import
tariff in 1991 compared to the other members of the bloc, some sectors, such as other agricultural
products and extraction, faced a reduction in intra-bloc tariffs along with an increase in extra-bloc
tariffs creating the prospect of trade diversion. The unilateral dismantling of tariff barriers was also
a feature of Uruguayan trade policy. In most sectors extra-bloc tariffs declined between 1991 and
1995 with the highest fall, above 11 percentage points, occurring in processed food. Meanwhile, in
the ‘MFN experiment’, changes in tariffs applied on imports from non-member countries are the
same as in the ‘Preferential experiment’ but now intra-bloc tariffs are also altered in the same way
rather than reduced to zero.
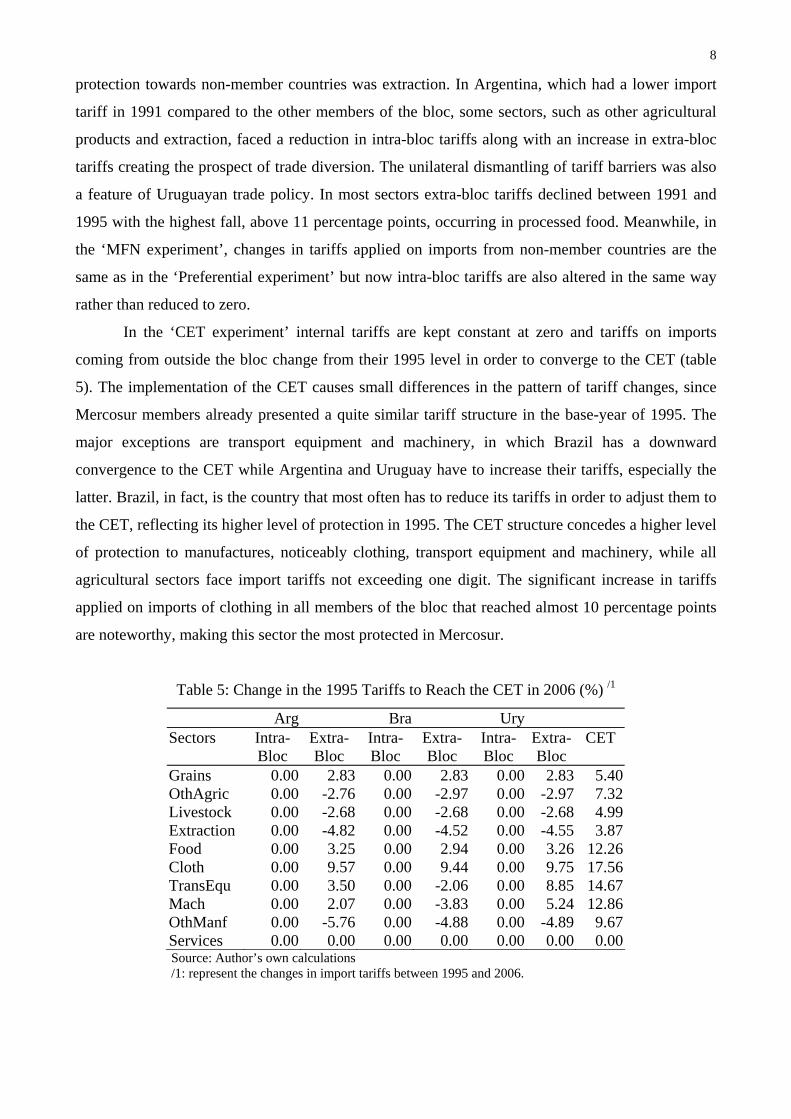
In the ‘CET experiment’ internal tariffs are kept constant at zero and tariffs on imports
coming from outside the bloc change from their 1995 level in order to converge to the CET (table
5). The implementation of the CET causes small differences in the pattern of tariff changes, since
Mercosur members already presented a quite similar tariff structure in the base-year of 1995. The
major exceptions are transport equipment and machinery, in which Brazil has a downward
convergence to the CET while Argentina and Uruguay have to increase their tariffs, especially the
latter. Brazil, in fact, is the country that most often has to reduce its tariffs in order to adjust them to
the CET, reflecting its higher level of protection in 1995. The CET structure concedes a higher level
of protection to manufactures, noticeably clothing, transport equipment and machinery, while all
agricultural sectors face import tariffs not exceeding one digit. The significant increase in tariffs
applied on imports of clothing in all members of the bloc that reached almost 10 percentage points
are noteworthy, making this sector the most protected in Mercosur.
Table 5: Change in the 1995 Tariffs to Reach the CET in 2006 (%) /1
Arg Bra Ury Sectors Intra-
Bloc Extra-Bloc
Intra-Bloc
Extra-Bloc
Intra-Bloc
Extra-Bloc
CET
Grains 0.00 2.83 0.00 2.83 0.00 2.83 5.40 OthAgric 0.00 -2.76 0.00 -2.97 0.00 -2.97 7.32 Livestock 0.00 -2.68 0.00 -2.68 0.00 -2.68 4.99 Extraction 0.00 -4.82 0.00 -4.52 0.00 -4.55 3.87 Food 0.00 3.25 0.00 2.94 0.00 3.26 12.26 Cloth 0.00 9.57 0.00 9.44 0.00 9.75 17.56 TransEqu 0.00 3.50 0.00 -2.06 0.00 8.85 14.67 Mach 0.00 2.07 0.00 -3.83 0.00 5.24 12.86 OthManf 0.00 -5.76 0.00 -4.88 0.00 -4.89 9.67 Services 0.00 0.00 0.00 0.00 0.00 0.00 0.00 Source: Author’s own calculations /1: represent the changes in import tariffs between 1995 and 2006.
9
4. Results The results focus mainly on the quantification of trade creation and trade diversion effects,
based on an apparent consumption analysis, and welfare changes associated with them due to
formation of the free trade area in 1995 and the implementation of the customs union in 2006. Trade
creation is expected to have a positive effect on welfare of bloc members, since abolition of tariffs
in intra-bloc trade allows bloc members to allocate their resources more efficiently in production,
enabling them to import goods, substituting away from inefficient domestic producers. In contrast,
trade diversion is likely to have a negative impact on welfare since a member of the bloc replaces
more efficient producers located outside the bloc.
4.1 Preferential Liberalisation (PRF) The CGE model allows us to obtain both imports and domestic production and, more
importantly, permit one to calculate the impact on welfare. With imports and domestic output it is
possible to identify directly the extent of trade creation and trade diversion under the apparent
consumption analysis, which allows the division of demand into three different sources: domestic
production net of exports (P-X), imports from bloc members (Mi) and from outside the bloc (Mw).
This approach has been widely used to analyse the effects of trade creation and trade diversion, as a
result of a PTA (e.g. Truman, 1975; Jacquemin and Sapir, 1988). Truman (1975) nominates 6
possible configurations arising from changes in the shares of the three sources of supply as a result
of the establishment of a PTA (table 6). Cases 1,2 and 3 involve trade creation and are associated
with a decline in the domestic share along with a higher dependency on imports. If this decline is
soaked up by both intra-bloc and extra-bloc imports it constitutes case 1, known as internal and
external trade creation.10 If, however, the fall in domestic production is entirely absorbed by
imports from outside or inside the bloc, it corresponds to cases 2 and 3, respectively. Cases 4, 5 and
6 are associated with trade diversion, where the share of domestic production increases to the
detriment of intra-bloc imports and/or imports from non-member countries. These situations can
arise especially when tariffs on imports coming from outside the bloc are raised.
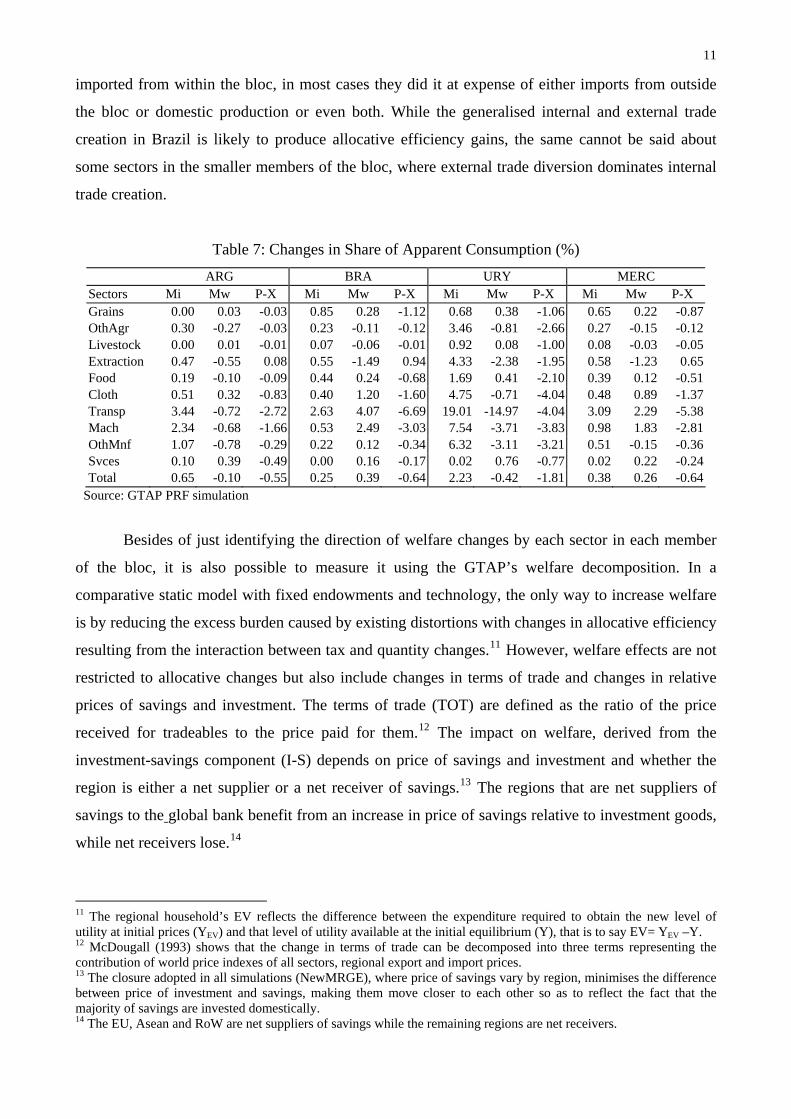
Table 7 shows that, in almost every case, the share of imports from bloc members increases
at the expense of either domestic production or imports from the rest of the world or both. In the
case of Brazil, in most sectors the increase in the share of intra-bloc imports in apparent
consumption is accompanied by a rise in the share of imports from outside the bloc to the detriment
10 Balassa (1967) introduced these two new concepts of external trade creation and external trade diversion. While the former refers to a rise in imports from non-member countries at the expense of home production, the latter assumes a substitution of member imports by non-member countries, both assuming that the CET would be lower than the pre-union external tariffs.
10
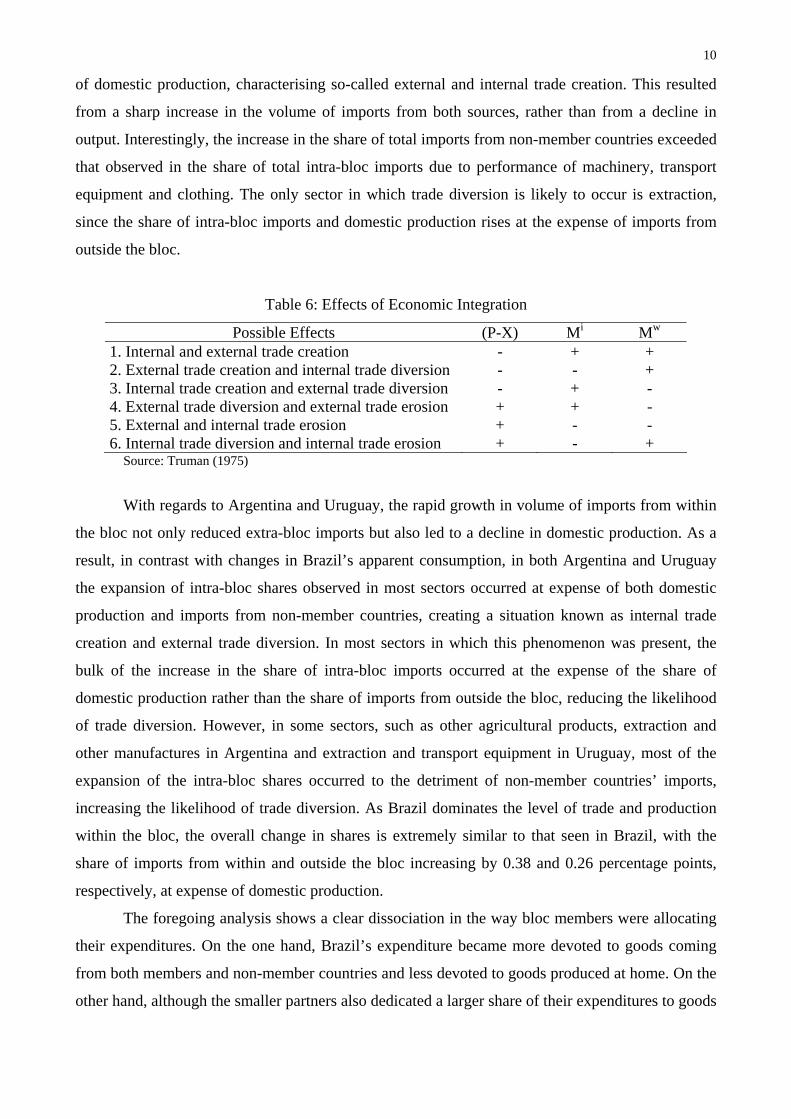
of domestic production, characterising so-called external and internal trade creation. This resulted
from a sharp increase in the volume of imports from both sources, rather than from a decline in
output. Interestingly, the increase in the share of total imports from non-member countries exceeded
that observed in the share of total intra-bloc imports due to performance of machinery, transport
equipment and clothing. The only sector in which trade diversion is likely to occur is extraction,
since the share of intra-bloc imports and domestic production rises at the expense of imports from
outside the bloc.
Table 6: Effects of Economic Integration
Possible Effects (P-X) Mi Mw
1. Internal and external trade creation - + + 2. External trade creation and internal trade diversion - - + 3. Internal trade creation and external trade diversion - + - 4. External trade diversion and external trade erosion + + - 5. External and internal trade erosion + - - 6. Internal trade diversion and internal trade erosion + - +
Source: Truman (1975)
With regards to Argentina and Uruguay, the rapid growth in volume of imports from within
the bloc not only reduced extra-bloc imports but also led to a decline in domestic production. As a
result, in contrast with changes in Brazil’s apparent consumption, in both Argentina and Uruguay
the expansion of intra-bloc shares observed in most sectors occurred at expense of both domestic
production and imports from non-member countries, creating a situation known as internal trade
creation and external trade diversion. In most sectors in which this phenomenon was present, the
bulk of the increase in the share of intra-bloc imports occurred at the expense of the share of
domestic production rather than the share of imports from outside the bloc, reducing the likelihood
of trade diversion. However, in some sectors, such as other agricultural products, extraction and
other manufactures in Argentina and extraction and transport equipment in Uruguay, most of the
expansion of the intra-bloc shares occurred to the detriment of non-member countries’ imports,
increasing the likelihood of trade diversion. As Brazil dominates the level of trade and production
within the bloc, the overall change in shares is extremely similar to that seen in Brazil, with the
share of imports from within and outside the bloc increasing by 0.38 and 0.26 percentage points,
respectively, at expense of domestic production.
The foregoing analysis shows a clear dissociation in the way bloc members were allocating
their expenditures. On the one hand, Brazil’s expenditure became more devoted to goods coming
from both members and non-member countries and less devoted to goods produced at home. On the
other hand, although the smaller partners also dedicated a larger share of their expenditures to goods
11
imported from within the bloc, in most cases they did it at expense of either imports from outside
the bloc or domestic production or even both. While the generalised internal and external trade
creation in Brazil is likely to produce allocative efficiency gains, the same cannot be said about
some sectors in the smaller members of the bloc, where external trade diversion dominates internal
trade creation.
Table 7: Changes in Share of Apparent Consumption (%) ARG BRA URY MERC
Sectors Mi Mw P-X Mi Mw P-X Mi Mw P-X Mi Mw P-X Grains 0.00 0.03 -0.03 0.85 0.28 -1.12 0.68 0.38 -1.06 0.65 0.22 -0.87OthAgr 0.30 -0.27 -0.03 0.23 -0.11 -0.12 3.46 -0.81 -2.66 0.27 -0.15 -0.12Livestock 0.00 0.01 -0.01 0.07 -0.06 -0.01 0.92 0.08 -1.00 0.08 -0.03 -0.05Extraction 0.47 -0.55 0.08 0.55 -1.49 0.94 4.33 -2.38 -1.95 0.58 -1.23 0.65Food 0.19 -0.10 -0.09 0.44 0.24 -0.68 1.69 0.41 -2.10 0.39 0.12 -0.51Cloth 0.51 0.32 -0.83 0.40 1.20 -1.60 4.75 -0.71 -4.04 0.48 0.89 -1.37Transp 3.44 -0.72 -2.72 2.63 4.07 -6.69 19.01 -14.97 -4.04 3.09 2.29 -5.38Mach 2.34 -0.68 -1.66 0.53 2.49 -3.03 7.54 -3.71 -3.83 0.98 1.83 -2.81OthMnf 1.07 -0.78 -0.29 0.22 0.12 -0.34 6.32 -3.11 -3.21 0.51 -0.15 -0.36Svces 0.10 0.39 -0.49 0.00 0.16 -0.17 0.02 0.76 -0.77 0.02 0.22 -0.24Total 0.65 -0.10 -0.55 0.25 0.39 -0.64 2.23 -0.42 -1.81 0.38 0.26 -0.64
Source: GTAP PRF simulation
Besides of just identifying the direction of welfare changes by each sector in each member
of the bloc, it is also possible to measure it using the GTAP’s welfare decomposition. In a
comparative static model with fixed endowments and technology, the only way to increase welfare
is by reducing the excess burden caused by existing distortions with changes in allocative efficiency
resulting from the interaction between tax and quantity changes.11 However, welfare effects are not
restricted to allocative changes but also include changes in terms of trade and changes in relative
prices of savings and investment. The terms of trade (TOT) are defined as the ratio of the price
received for tradeables to the price paid for them.12 The impact on welfare, derived from the
investment-savings component (I-S) depends on price of savings and investment and whether the
region is either a net supplier or a net receiver of savings.13 The regions that are net suppliers of
savings to the global bank benefit from an increase in price of savings relative to investment goods,
while net receivers lose.14
11 The regional household’s EV reflects the difference between the expenditure required to obtain the new level of utility at initial prices (YEV) and that level of utility available at the initial equilibrium (Y), that is to say EV= YEV –Y. 12 McDougall (1993) shows that the change in terms of trade can be decomposed into three terms representing the contribution of world price indexes of all sectors, regional export and import prices. 13 The closure adopted in all simulations (NewMRGE), where price of savings vary by region, minimises the difference between price of investment and savings, making them move closer to each other so as to reflect the fact that the majority of savings are invested domestically. 14 The EU, Asean and RoW are net suppliers of savings while the remaining regions are net receivers.
12
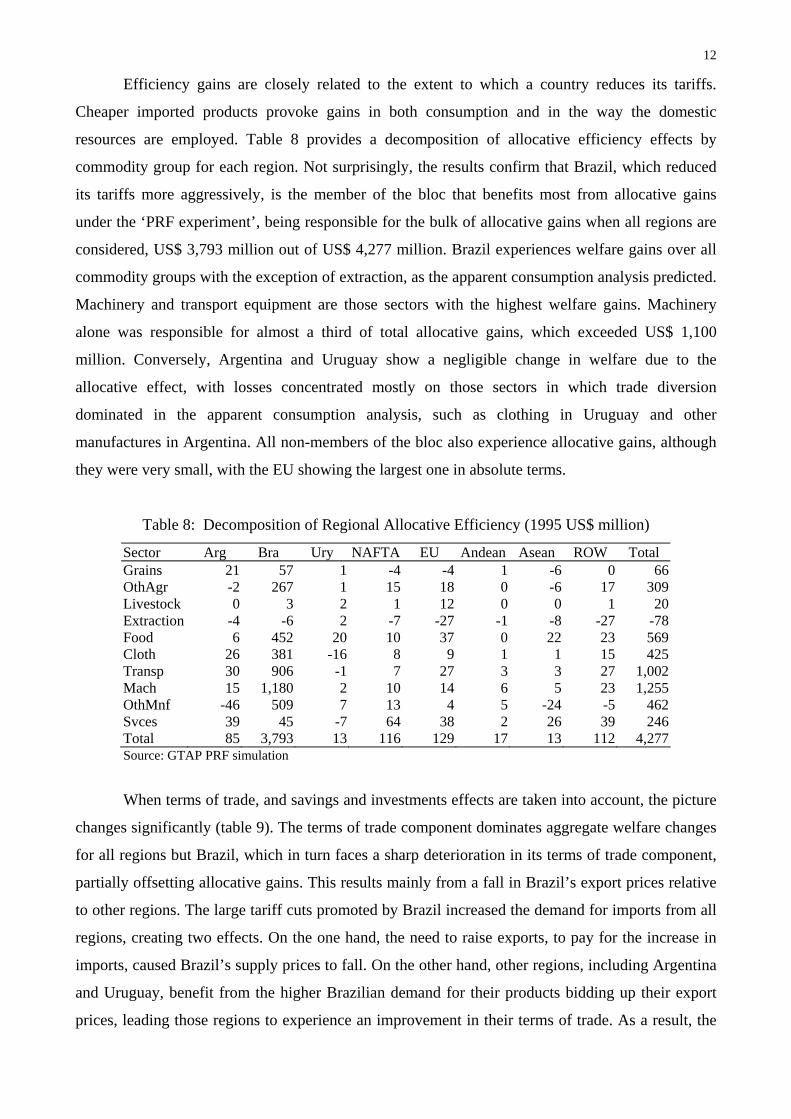
Efficiency gains are closely related to the extent to which a country reduces its tariffs.
Cheaper imported products provoke gains in both consumption and in the way the domestic
resources are employed. Table 8 provides a decomposition of allocative efficiency effects by
commodity group for each region. Not surprisingly, the results confirm that Brazil, which reduced
its tariffs more aggressively, is the member of the bloc that benefits most from allocative gains
under the ‘PRF experiment’, being responsible for the bulk of allocative gains when all regions are
considered, US$ 3,793 million out of US$ 4,277 million. Brazil experiences welfare gains over all
commodity groups with the exception of extraction, as the apparent consumption analysis predicted.
Machinery and transport equipment are those sectors with the highest welfare gains. Machinery
alone was responsible for almost a third of total allocative gains, which exceeded US$ 1,100
million. Conversely, Argentina and Uruguay show a negligible change in welfare due to the
allocative effect, with losses concentrated mostly on those sectors in which trade diversion
dominated in the apparent consumption analysis, such as clothing in Uruguay and other
manufactures in Argentina. All non-members of the bloc also experience allocative gains, although
they were very small, with the EU showing the largest one in absolute terms.
Table 8: Decomposition of Regional Allocative Efficiency (1995 US$ million)
Sector Arg Bra Ury NAFTA EU Andean Asean ROW Total Grains 21 57 1 -4 -4 1 -6 0 66OthAgr -2 267 1 15 18 0 -6 17 309Livestock 0 3 2 1 12 0 0 1 20Extraction -4 -6 2 -7 -27 -1 -8 -27 -78Food 6 452 20 10 37 0 22 23 569Cloth 26 381 -16 8 9 1 1 15 425Transp 30 906 -1 7 27 3 3 27 1,002Mach 15 1,180 2 10 14 6 5 23 1,255OthMnf -46 509 7 13 4 5 -24 -5 462Svces 39 45 -7 64 38 2 26 39 246Total 85 3,793 13 116 129 17 13 112 4,277Source: GTAP PRF simulation
When terms of trade, and savings and investments effects are taken into account, the picture
changes significantly (table 9). The terms of trade component dominates aggregate welfare changes
for all regions but Brazil, which in turn faces a sharp deterioration in its terms of trade component,
partially offsetting allocative gains. This results mainly from a fall in Brazil’s export prices relative
to other regions. The large tariff cuts promoted by Brazil increased the demand for imports from all
regions, creating two effects. On the one hand, the need to raise exports, to pay for the increase in
imports, caused Brazil’s supply prices to fall. On the other hand, other regions, including Argentina
and Uruguay, benefit from the higher Brazilian demand for their products bidding up their export
prices, leading those regions to experience an improvement in their terms of trade. As a result, the
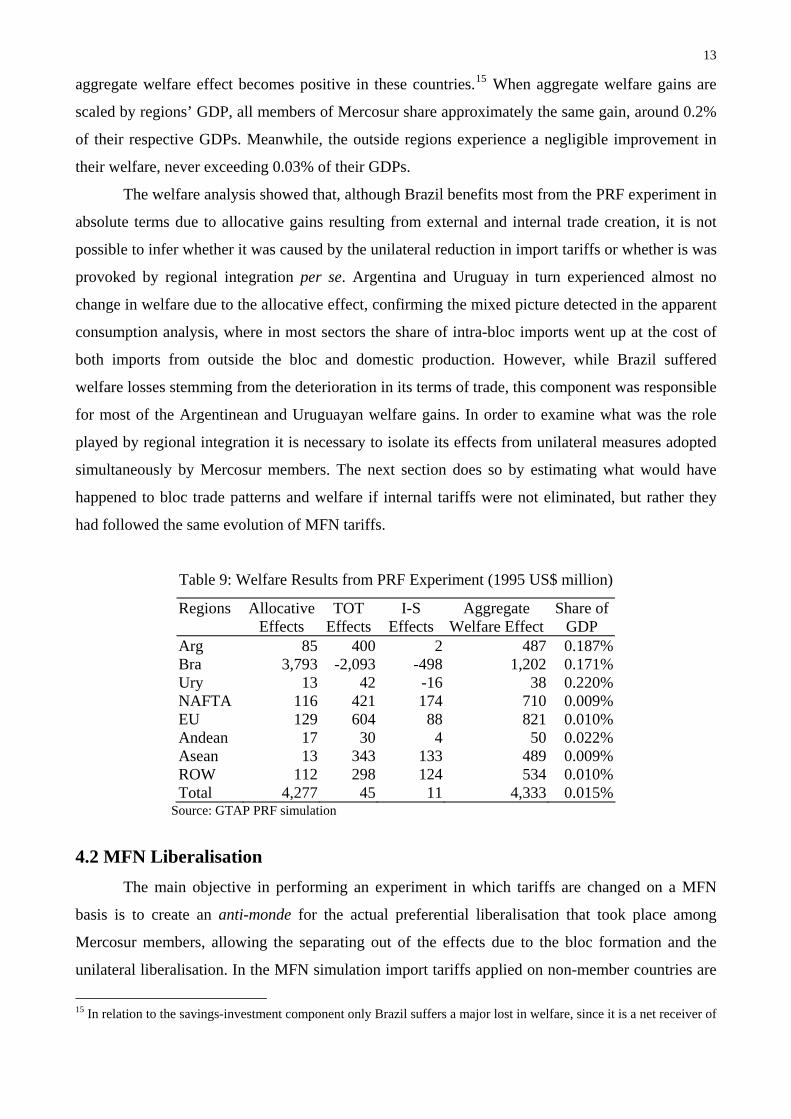
13
aggregate welfare effect becomes positive in these countries.15 When aggregate welfare gains are
scaled by regions’ GDP, all members of Mercosur share approximately the same gain, around 0.2%
of their respective GDPs. Meanwhile, the outside regions experience a negligible improvement in
their welfare, never exceeding 0.03% of their GDPs.
The welfare analysis showed that, although Brazil benefits most from the PRF experiment in
absolute terms due to allocative gains resulting from external and internal trade creation, it is not
possible to infer whether it was caused by the unilateral reduction in import tariffs or whether is was
provoked by regional integration per se. Argentina and Uruguay in turn experienced almost no
change in welfare due to the allocative effect, confirming the mixed picture detected in the apparent
consumption analysis, where in most sectors the share of intra-bloc imports went up at the cost of
both imports from outside the bloc and domestic production. However, while Brazil suffered
welfare losses stemming from the deterioration in its terms of trade, this component was responsible
for most of the Argentinean and Uruguayan welfare gains. In order to examine what was the role
played by regional integration it is necessary to isolate its effects from unilateral measures adopted
simultaneously by Mercosur members. The next section does so by estimating what would have
happened to bloc trade patterns and welfare if internal tariffs were not eliminated, but rather they
had followed the same evolution of MFN tariffs.
Table 9: Welfare Results from PRF Experiment (1995 US$ million)
Regions Allocative Effects
TOT Effects
I-S Effects
Aggregate Welfare Effect
Share of GDP
Arg 85 400 2 487 0.187% Bra 3,793 -2,093 -498 1,202 0.171% Ury 13 42 -16 38 0.220% NAFTA 116 421 174 710 0.009% EU 129 604 88 821 0.010% Andean 17 30 4 50 0.022% Asean 13 343 133 489 0.009% ROW 112 298 124 534 0.010% Total 4,277 45 11 4,333 0.015%
Source: GTAP PRF simulation
4.2 MFN Liberalisation The main objective in performing an experiment in which tariffs are changed on a MFN
basis is to create an anti-monde for the actual preferential liberalisation that took place among
Mercosur members, allowing the separating out of the effects due to the bloc formation and the
unilateral liberalisation. In the MFN simulation import tariffs applied on non-member countries are
15 In relation to the savings-investment component only Brazil suffers a major lost in welfare, since it is a net receiver of
14
modified in the same way they were in the PRF experiment but now the members of the bloc lose
their preferential rates, and face the same 1995 tariffs applied on non-member countries. So, the
difference between the results from these two experiments represents the impact that can be
attributed exclusively to the bloc formation that will be detailed in section 4.3.
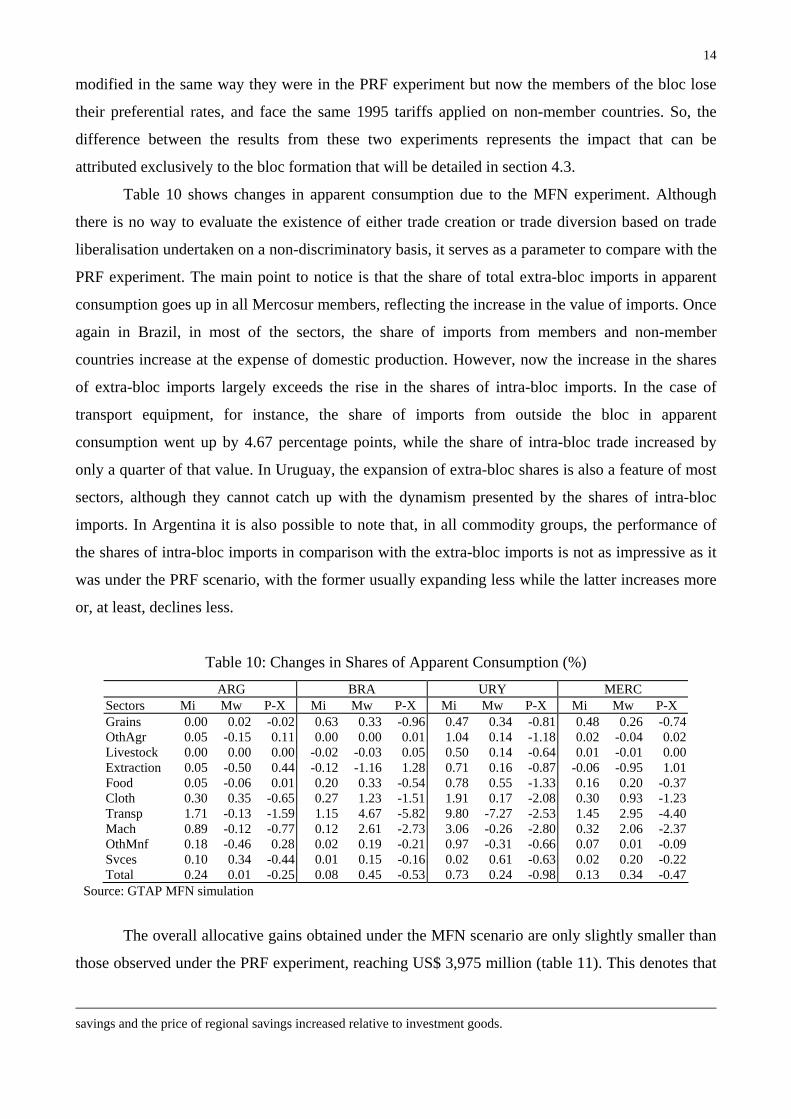
Table 10 shows changes in apparent consumption due to the MFN experiment. Although
there is no way to evaluate the existence of either trade creation or trade diversion based on trade
liberalisation undertaken on a non-discriminatory basis, it serves as a parameter to compare with the
PRF experiment. The main point to notice is that the share of total extra-bloc imports in apparent
consumption goes up in all Mercosur members, reflecting the increase in the value of imports. Once
again in Brazil, in most of the sectors, the share of imports from members and non-member
countries increase at the expense of domestic production. However, now the increase in the shares
of extra-bloc imports largely exceeds the rise in the shares of intra-bloc imports. In the case of
transport equipment, for instance, the share of imports from outside the bloc in apparent
consumption went up by 4.67 percentage points, while the share of intra-bloc trade increased by
only a quarter of that value. In Uruguay, the expansion of extra-bloc shares is also a feature of most
sectors, although they cannot catch up with the dynamism presented by the shares of intra-bloc
imports. In Argentina it is also possible to note that, in all commodity groups, the performance of
the shares of intra-bloc imports in comparison with the extra-bloc imports is not as impressive as it
was under the PRF scenario, with the former usually expanding less while the latter increases more
or, at least, declines less.
Table 10: Changes in Shares of Apparent Consumption (%) ARG BRA URY MERC
Sectors Mi Mw P-X Mi Mw P-X Mi Mw P-X Mi Mw P-X Grains 0.00 0.02 -0.02 0.63 0.33 -0.96 0.47 0.34 -0.81 0.48 0.26 -0.74OthAgr 0.05 -0.15 0.11 0.00 0.00 0.01 1.04 0.14 -1.18 0.02 -0.04 0.02Livestock 0.00 0.00 0.00 -0.02 -0.03 0.05 0.50 0.14 -0.64 0.01 -0.01 0.00Extraction 0.05 -0.50 0.44 -0.12 -1.16 1.28 0.71 0.16 -0.87 -0.06 -0.95 1.01Food 0.05 -0.06 0.01 0.20 0.33 -0.54 0.78 0.55 -1.33 0.16 0.20 -0.37Cloth 0.30 0.35 -0.65 0.27 1.23 -1.51 1.91 0.17 -2.08 0.30 0.93 -1.23Transp 1.71 -0.13 -1.59 1.15 4.67 -5.82 9.80 -7.27 -2.53 1.45 2.95 -4.40Mach 0.89 -0.12 -0.77 0.12 2.61 -2.73 3.06 -0.26 -2.80 0.32 2.06 -2.37OthMnf 0.18 -0.46 0.28 0.02 0.19 -0.21 0.97 -0.31 -0.66 0.07 0.01 -0.09Svces 0.10 0.34 -0.44 0.01 0.15 -0.16 0.02 0.61 -0.63 0.02 0.20 -0.22Total 0.24 0.01 -0.25 0.08 0.45 -0.53 0.73 0.24 -0.98 0.13 0.34 -0.47
Source: GTAP MFN simulation
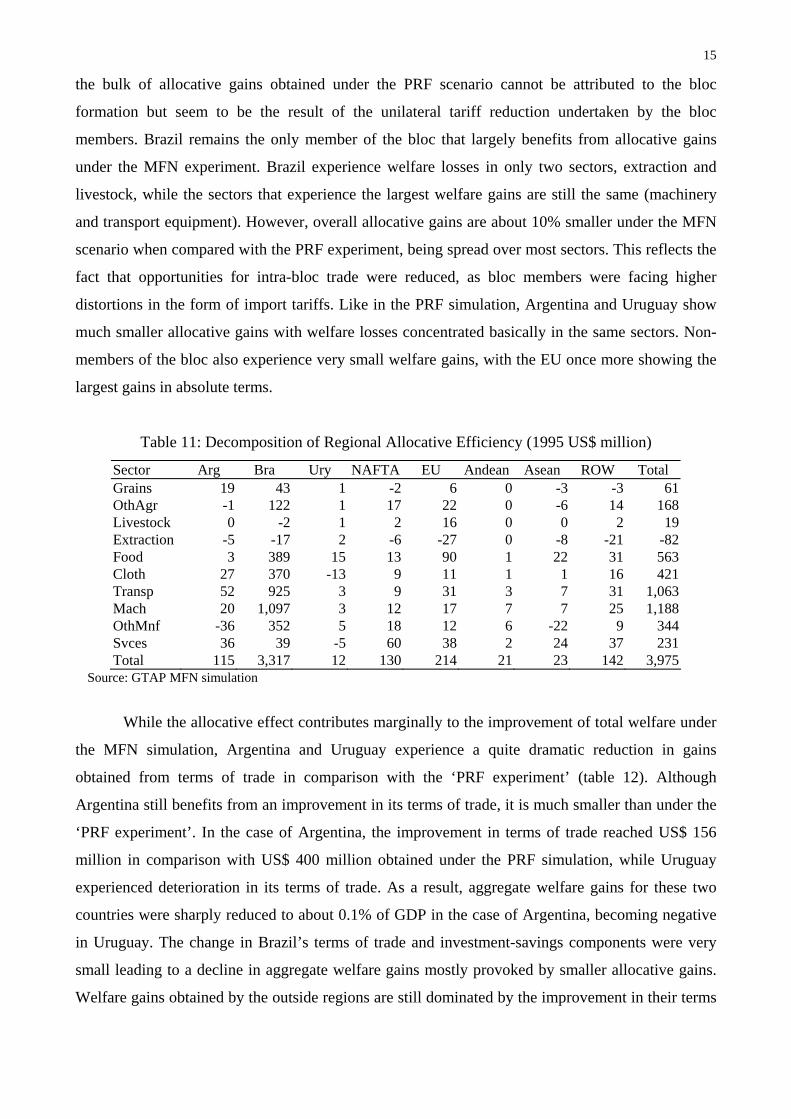
The overall allocative gains obtained under the MFN scenario are only slightly smaller than
those observed under the PRF experiment, reaching US$ 3,975 million (table 11). This denotes that
savings and the price of regional savings increased relative to investment goods.
15
the bulk of allocative gains obtained under the PRF scenario cannot be attributed to the bloc
formation but seem to be the result of the unilateral tariff reduction undertaken by the bloc
members. Brazil remains the only member of the bloc that largely benefits from allocative gains
under the MFN experiment. Brazil experience welfare losses in only two sectors, extraction and
livestock, while the sectors that experience the largest welfare gains are still the same (machinery
and transport equipment). However, overall allocative gains are about 10% smaller under the MFN
scenario when compared with the PRF experiment, being spread over most sectors. This reflects the
fact that opportunities for intra-bloc trade were reduced, as bloc members were facing higher
distortions in the form of import tariffs. Like in the PRF simulation, Argentina and Uruguay show
much smaller allocative gains with welfare losses concentrated basically in the same sectors. Non-
members of the bloc also experience very small welfare gains, with the EU once more showing the
largest gains in absolute terms.
Table 11: Decomposition of Regional Allocative Efficiency (1995 US$ million)
Sector Arg Bra Ury NAFTA EU Andean Asean ROW Total Grains 19 43 1 -2 6 0 -3 -3 61OthAgr -1 122 1 17 22 0 -6 14 168Livestock 0 -2 1 2 16 0 0 2 19Extraction -5 -17 2 -6 -27 0 -8 -21 -82Food 3 389 15 13 90 1 22 31 563Cloth 27 370 -13 9 11 1 1 16 421Transp 52 925 3 9 31 3 7 31 1,063Mach 20 1,097 3 12 17 7 7 25 1,188OthMnf -36 352 5 18 12 6 -22 9 344Svces 36 39 -5 60 38 2 24 37 231Total 115 3,317 12 130 214 21 23 142 3,975
Source: GTAP MFN simulation
While the allocative effect contributes marginally to the improvement of total welfare under
the MFN simulation, Argentina and Uruguay experience a quite dramatic reduction in gains
obtained from terms of trade in comparison with the ‘PRF experiment’ (table 12). Although
Argentina still benefits from an improvement in its terms of trade, it is much smaller than under the
‘PRF experiment’. In the case of Argentina, the improvement in terms of trade reached US$ 156
million in comparison with US$ 400 million obtained under the PRF simulation, while Uruguay
experienced deterioration in its terms of trade. As a result, aggregate welfare gains for these two
countries were sharply reduced to about 0.1% of GDP in the case of Argentina, becoming negative
in Uruguay. The change in Brazil’s terms of trade and investment-savings components were very
small leading to a decline in aggregate welfare gains mostly provoked by smaller allocative gains.
Welfare gains obtained by the outside regions are still dominated by the improvement in their terms
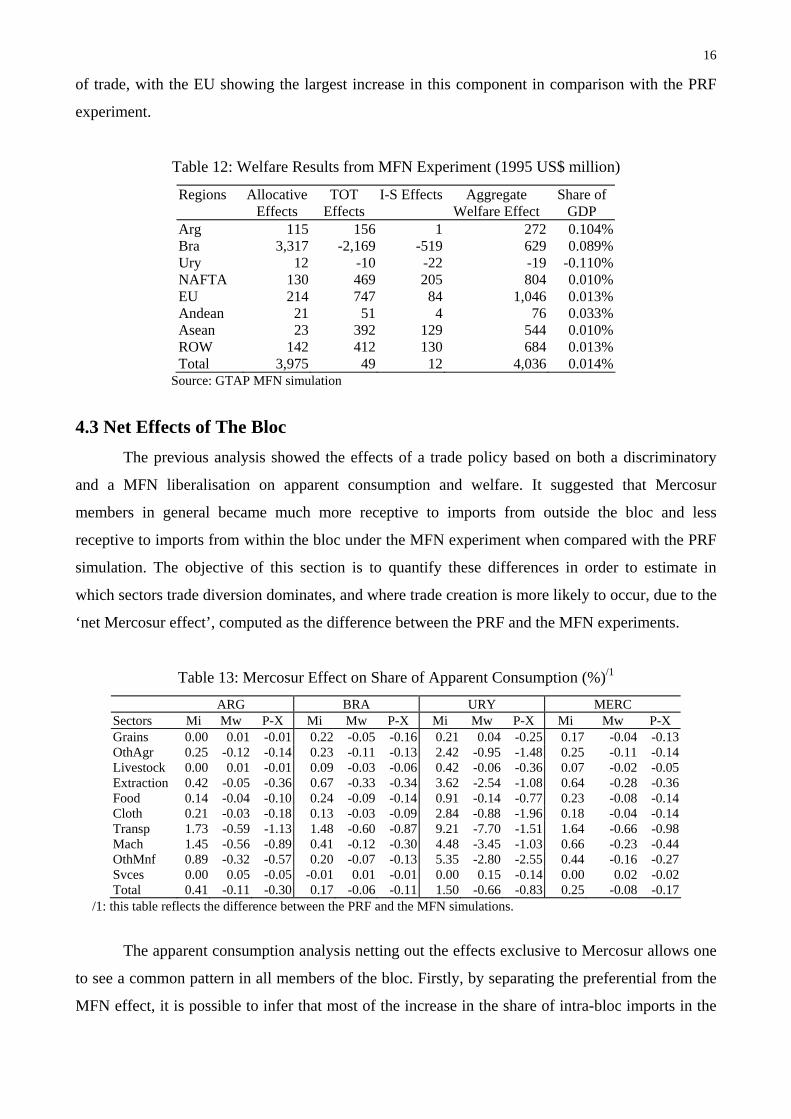
16
of trade, with the EU showing the largest increase in this component in comparison with the PRF
experiment.
Table 12: Welfare Results from MFN Experiment (1995 US$ million)
Regions Allocative Effects
TOT Effects
I-S Effects Aggregate Welfare Effect
Share of GDP
Arg 115 156 1 272 0.104% Bra 3,317 -2,169 -519 629 0.089% Ury 12 -10 -22 -19 -0.110% NAFTA 130 469 205 804 0.010% EU 214 747 84 1,046 0.013% Andean 21 51 4 76 0.033% Asean 23 392 129 544 0.010% ROW 142 412 130 684 0.013% Total 3,975 49 12 4,036 0.014%
Source: GTAP MFN simulation
4.3 Net Effects of The Bloc The previous analysis showed the effects of a trade policy based on both a discriminatory
and a MFN liberalisation on apparent consumption and welfare. It suggested that Mercosur
members in general became much more receptive to imports from outside the bloc and less
receptive to imports from within the bloc under the MFN experiment when compared with the PRF
simulation. The objective of this section is to quantify these differences in order to estimate in
which sectors trade diversion dominates, and where trade creation is more likely to occur, due to the
‘net Mercosur effect’, computed as the difference between the PRF and the MFN experiments.
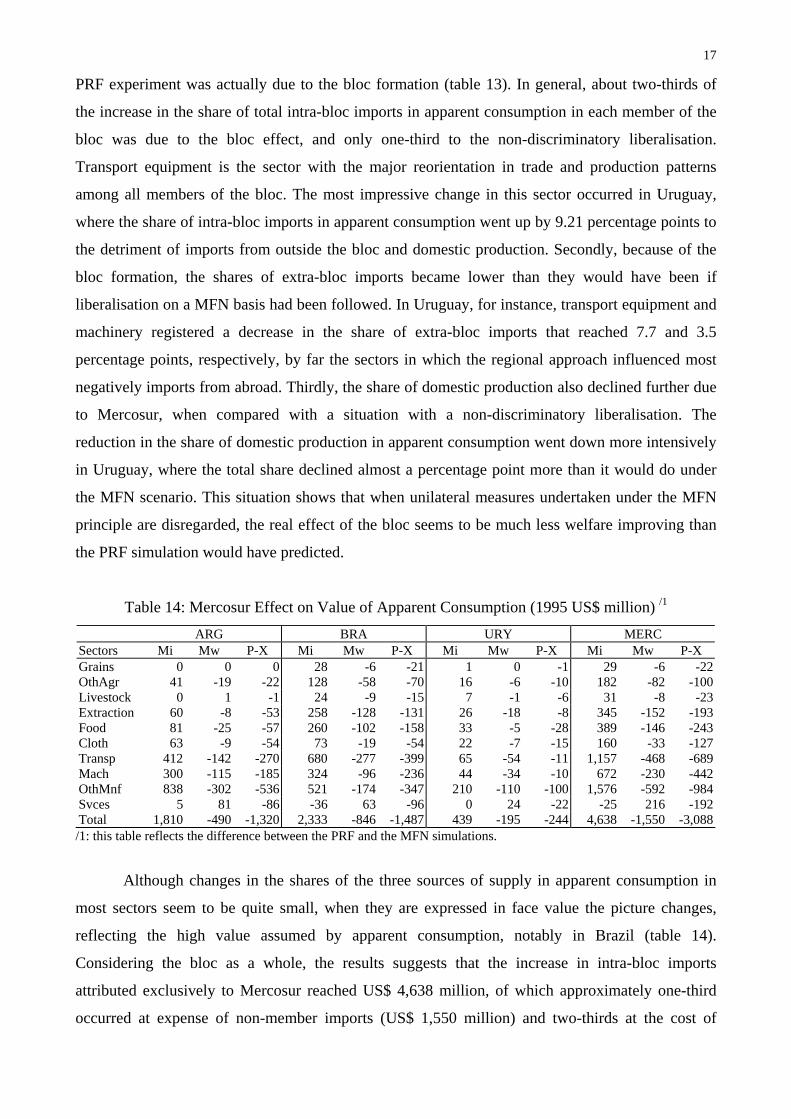
Table 13: Mercosur Effect on Share of Apparent Consumption (%)/1
ARG BRA URY MERC Sectors Mi Mw P-X Mi Mw P-X Mi Mw P-X Mi Mw P-X Grains 0.00 0.01 -0.01 0.22 -0.05 -0.16 0.21 0.04 -0.25 0.17 -0.04 -0.13OthAgr 0.25 -0.12 -0.14 0.23 -0.11 -0.13 2.42 -0.95 -1.48 0.25 -0.11 -0.14Livestock 0.00 0.01 -0.01 0.09 -0.03 -0.06 0.42 -0.06 -0.36 0.07 -0.02 -0.05Extraction 0.42 -0.05 -0.36 0.67 -0.33 -0.34 3.62 -2.54 -1.08 0.64 -0.28 -0.36Food 0.14 -0.04 -0.10 0.24 -0.09 -0.14 0.91 -0.14 -0.77 0.23 -0.08 -0.14Cloth 0.21 -0.03 -0.18 0.13 -0.03 -0.09 2.84 -0.88 -1.96 0.18 -0.04 -0.14Transp 1.73 -0.59 -1.13 1.48 -0.60 -0.87 9.21 -7.70 -1.51 1.64 -0.66 -0.98Mach 1.45 -0.56 -0.89 0.41 -0.12 -0.30 4.48 -3.45 -1.03 0.66 -0.23 -0.44OthMnf 0.89 -0.32 -0.57 0.20 -0.07 -0.13 5.35 -2.80 -2.55 0.44 -0.16 -0.27Svces 0.00 0.05 -0.05 -0.01 0.01 -0.01 0.00 0.15 -0.14 0.00 0.02 -0.02Total 0.41 -0.11 -0.30 0.17 -0.06 -0.11 1.50 -0.66 -0.83 0.25 -0.08 -0.17
/1: this table reflects the difference between the PRF and the MFN simulations.
The apparent consumption analysis netting out the effects exclusive to Mercosur allows one
to see a common pattern in all members of the bloc. Firstly, by separating the preferential from the
MFN effect, it is possible to infer that most of the increase in the share of intra-bloc imports in the
17
PRF experiment was actually due to the bloc formation (table 13). In general, about two-thirds of
the increase in the share of total intra-bloc imports in apparent consumption in each member of the
bloc was due to the bloc effect, and only one-third to the non-discriminatory liberalisation.
Transport equipment is the sector with the major reorientation in trade and production patterns
among all members of the bloc. The most impressive change in this sector occurred in Uruguay,
where the share of intra-bloc imports in apparent consumption went up by 9.21 percentage points to
the detriment of imports from outside the bloc and domestic production. Secondly, because of the
bloc formation, the shares of extra-bloc imports became lower than they would have been if
liberalisation on a MFN basis had been followed. In Uruguay, for instance, transport equipment and
machinery registered a decrease in the share of extra-bloc imports that reached 7.7 and 3.5
percentage points, respectively, by far the sectors in which the regional approach influenced most
negatively imports from abroad. Thirdly, the share of domestic production also declined further due
to Mercosur, when compared with a situation with a non-discriminatory liberalisation. The
reduction in the share of domestic production in apparent consumption went down more intensively
in Uruguay, where the total share declined almost a percentage point more than it would do under
the MFN scenario. This situation shows that when unilateral measures undertaken under the MFN
principle are disregarded, the real effect of the bloc seems to be much less welfare improving than
the PRF simulation would have predicted.
Table 14: Mercosur Effect on Value of Apparent Consumption (1995 US$ million) /1
ARG BRA URY MERCSectors Mi Mw P-X Mi Mw P-X Mi Mw P-X Mi Mw P-X Grains 0 0 0 28 -6 -21 1 0 -1 29 -6 -22OthAgr 41 -19 -22 128 -58 -70 16 -6 -10 182 -82 -100Livestock 0 1 -1 24 -9 -15 7 -1 -6 31 -8 -23Extraction 60 -8 -53 258 -128 -131 26 -18 -8 345 -152 -193Food 81 -25 -57 260 -102 -158 33 -5 -28 389 -146 -243Cloth 63 -9 -54 73 -19 -54 22 -7 -15 160 -33 -127Transp 412 -142 -270 680 -277 -399 65 -54 -11 1,157 -468 -689Mach 300 -115 -185 324 -96 -236 44 -34 -10 672 -230 -442OthMnf 838 -302 -536 521 -174 -347 210 -110 -100 1,576 -592 -984Svces 5 81 -86 -36 63 -96 0 24 -22 -25 216 -192Total 1,810 -490 -1,320 2,333 -846 -1,487 439 -195 -244 4,638 -1,550 -3,088/1: this table reflects the difference between the PRF and the MFN simulations.
Although changes in the shares of the three sources of supply in apparent consumption in
most sectors seem to be quite small, when they are expressed in face value the picture changes,
reflecting the high value assumed by apparent consumption, notably in Brazil (table 14).
Considering the bloc as a whole, the results suggests that the increase in intra-bloc imports
attributed exclusively to Mercosur reached US$ 4,638 million, of which approximately one-third
occurred at expense of non-member imports (US$ 1,550 million) and two-thirds at the cost of
18
domestic production. It is noteworthy that other manufactures and transport equipment accounts for
more than half of the reduction in the value of bloc imports from non-member countries.
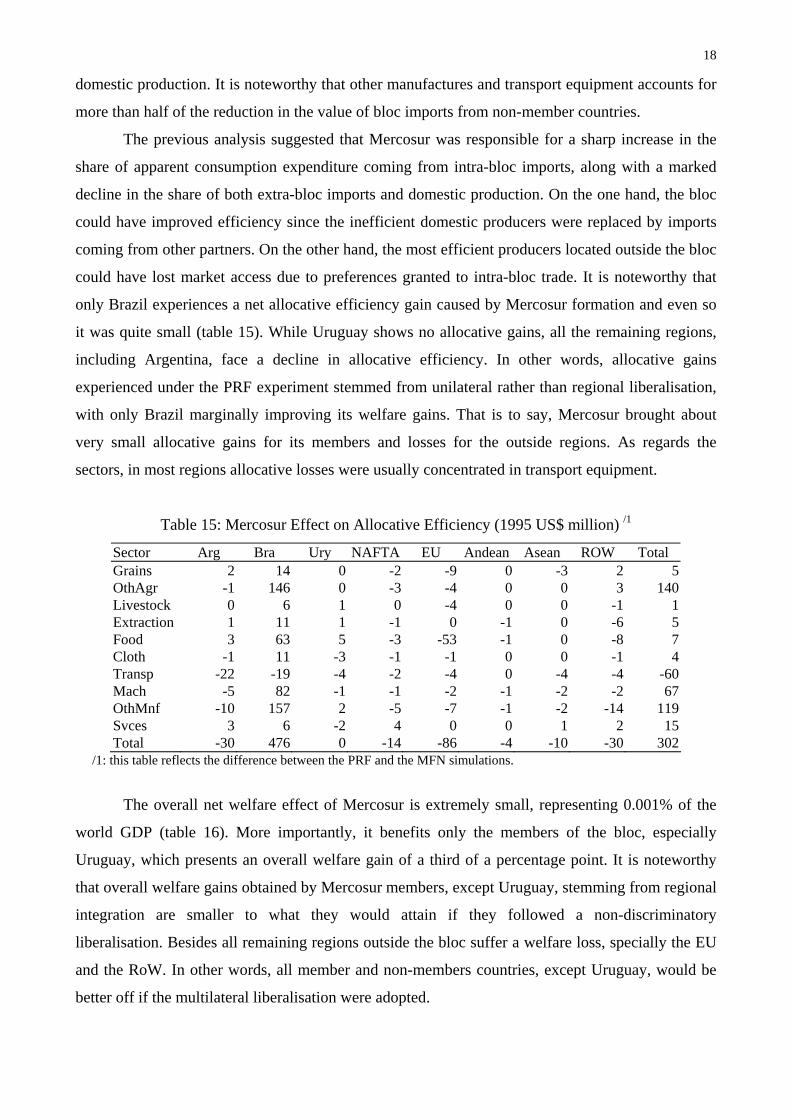
The previous analysis suggested that Mercosur was responsible for a sharp increase in the
share of apparent consumption expenditure coming from intra-bloc imports, along with a marked
decline in the share of both extra-bloc imports and domestic production. On the one hand, the bloc
could have improved efficiency since the inefficient domestic producers were replaced by imports
coming from other partners. On the other hand, the most efficient producers located outside the bloc
could have lost market access due to preferences granted to intra-bloc trade. It is noteworthy that
only Brazil experiences a net allocative efficiency gain caused by Mercosur formation and even so
it was quite small (table 15). While Uruguay shows no allocative gains, all the remaining regions,
including Argentina, face a decline in allocative efficiency. In other words, allocative gains
experienced under the PRF experiment stemmed from unilateral rather than regional liberalisation,
with only Brazil marginally improving its welfare gains. That is to say, Mercosur brought about
very small allocative gains for its members and losses for the outside regions. As regards the
sectors, in most regions allocative losses were usually concentrated in transport equipment.
Table 15: Mercosur Effect on Allocative Efficiency (1995 US$ million) /1
Sector Arg Bra Ury NAFTA EU Andean Asean ROW Total Grains 2 14 0 -2 -9 0 -3 2 5OthAgr -1 146 0 -3 -4 0 0 3 140Livestock 0 6 1 0 -4 0 0 -1 1Extraction 1 11 1 -1 0 -1 0 -6 5Food 3 63 5 -3 -53 -1 0 -8 7Cloth -1 11 -3 -1 -1 0 0 -1 4Transp -22 -19 -4 -2 -4 0 -4 -4 -60Mach -5 82 -1 -1 -2 -1 -2 -2 67OthMnf -10 157 2 -5 -7 -1 -2 -14 119Svces 3 6 -2 4 0 0 1 2 15Total -30 476 0 -14 -86 -4 -10 -30 302
/1: this table reflects the difference between the PRF and the MFN simulations.
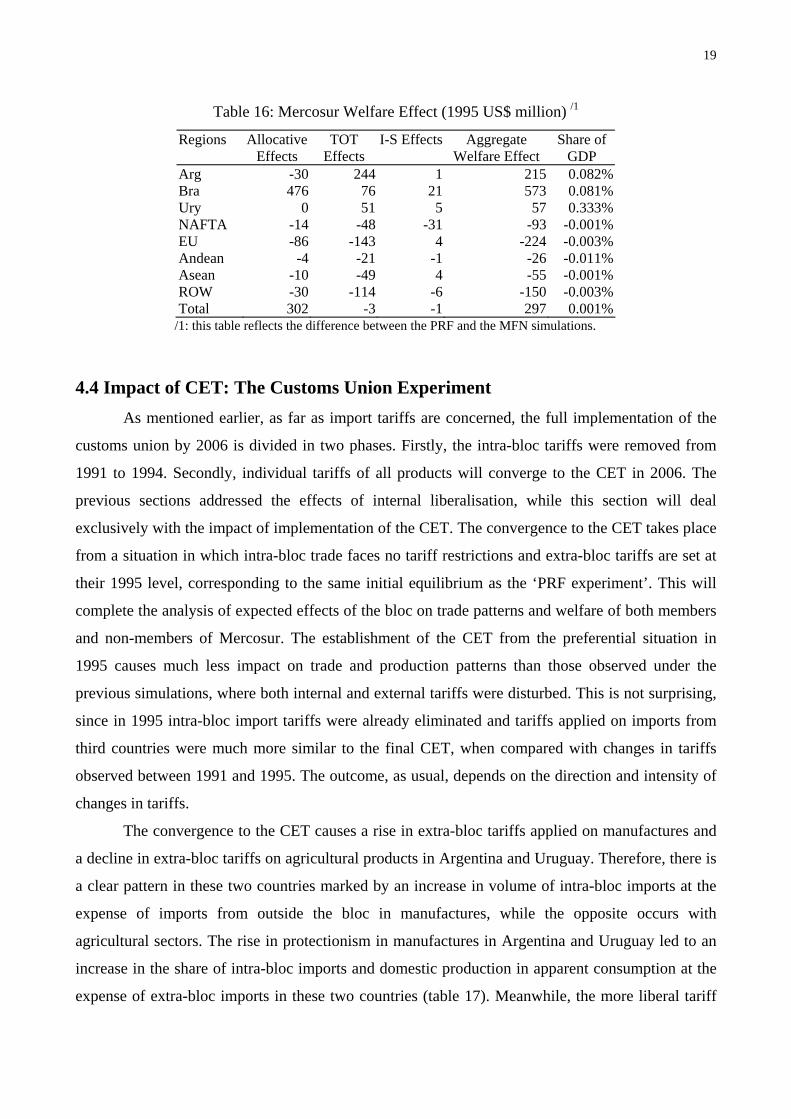
The overall net welfare effect of Mercosur is extremely small, representing 0.001% of the
world GDP (table 16). More importantly, it benefits only the members of the bloc, especially
Uruguay, which presents an overall welfare gain of a third of a percentage point. It is noteworthy
that overall welfare gains obtained by Mercosur members, except Uruguay, stemming from regional
integration are smaller to what they would attain if they followed a non-discriminatory
liberalisation. Besides all remaining regions outside the bloc suffer a welfare loss, specially the EU
and the RoW. In other words, all member and non-members countries, except Uruguay, would be
better off if the multilateral liberalisation were adopted.
19
Table 16: Mercosur Welfare Effect (1995 US$ million) /1
Regions Allocative Effects
TOT Effects
I-S Effects Aggregate Welfare Effect
Share of GDP
Arg -30 244 1 215 0.082% Bra 476 76 21 573 0.081% Ury 0 51 5 57 0.333% NAFTA -14 -48 -31 -93 -0.001% EU -86 -143 4 -224 -0.003% Andean -4 -21 -1 -26 -0.011% Asean -10 -49 4 -55 -0.001% ROW -30 -114 -6 -150 -0.003% Total 302 -3 -1 297 0.001%
/1: this table reflects the difference between the PRF and the MFN simulations.
4.4 Impact of CET: The Customs Union Experiment As mentioned earlier, as far as import tariffs are concerned, the full implementation of the
customs union by 2006 is divided in two phases. Firstly, the intra-bloc tariffs were removed from
1991 to 1994. Secondly, individual tariffs of all products will converge to the CET in 2006. The
previous sections addressed the effects of internal liberalisation, while this section will deal
exclusively with the impact of implementation of the CET. The convergence to the CET takes place
from a situation in which intra-bloc trade faces no tariff restrictions and extra-bloc tariffs are set at
their 1995 level, corresponding to the same initial equilibrium as the ‘PRF experiment’. This will
complete the analysis of expected effects of the bloc on trade patterns and welfare of both members
and non-members of Mercosur. The establishment of the CET from the preferential situation in
1995 causes much less impact on trade and production patterns than those observed under the
previous simulations, where both internal and external tariffs were disturbed. This is not surprising,
since in 1995 intra-bloc import tariffs were already eliminated and tariffs applied on imports from
third countries were much more similar to the final CET, when compared with changes in tariffs
observed between 1991 and 1995. The outcome, as usual, depends on the direction and intensity of
changes in tariffs.
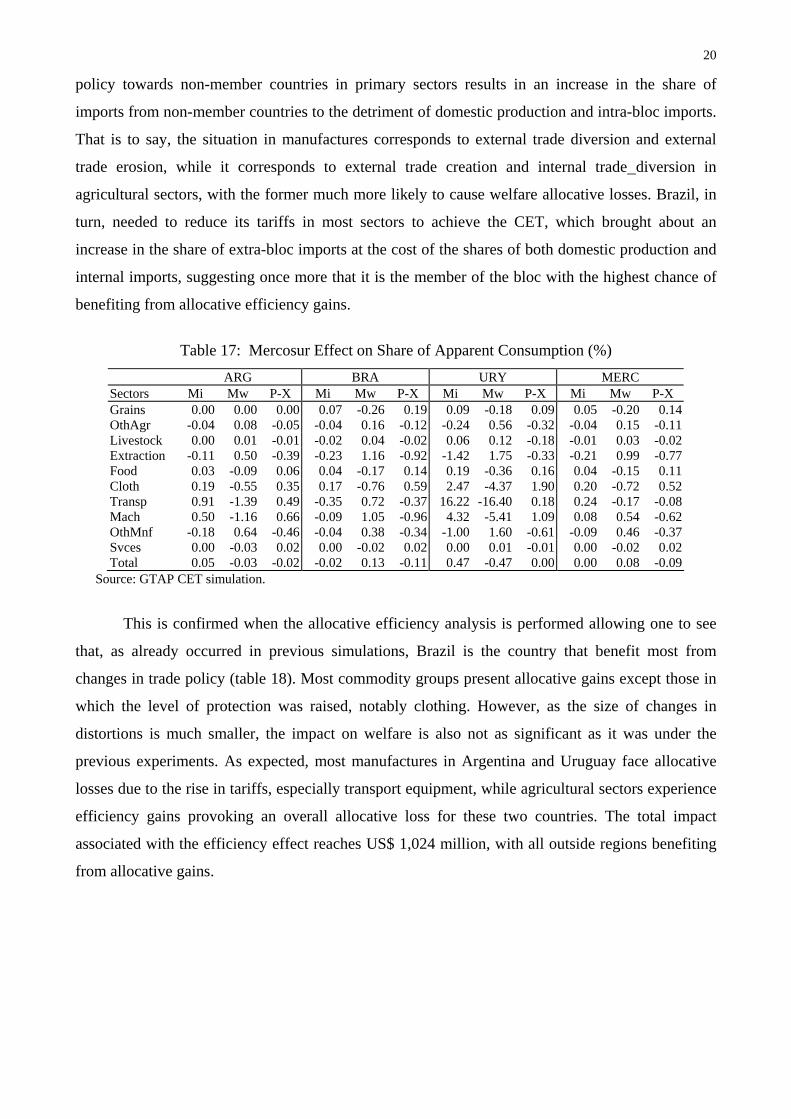
The convergence to the CET causes a rise in extra-bloc tariffs applied on manufactures and
a decline in extra-bloc tariffs on agricultural products in Argentina and Uruguay. Therefore, there is
a clear pattern in these two countries marked by an increase in volume of intra-bloc imports at the
expense of imports from outside the bloc in manufactures, while the opposite occurs with
agricultural sectors. The rise in protectionism in manufactures in Argentina and Uruguay led to an
increase in the share of intra-bloc imports and domestic production in apparent consumption at the
expense of extra-bloc imports in these two countries (table 17). Meanwhile, the more liberal tariff
20
policy towards non-member countries in primary sectors results in an increase in the share of
imports from non-member countries to the detriment of domestic production and intra-bloc imports.
That is to say, the situation in manufactures corresponds to external trade diversion and external
trade erosion, while it corresponds to external trade creation and internal trade diversion in
agricultural sectors, with the former much more likely to cause welfare allocative losses. Brazil, in
turn, needed to reduce its tariffs in most sectors to achieve the CET, which brought about an
increase in the share of extra-bloc imports at the cost of the shares of both domestic production and
internal imports, suggesting once more that it is the member of the bloc with the highest chance of
benefiting from allocative efficiency gains.
Table 17: Mercosur Effect on Share of Apparent Consumption (%)
ARG BRA URY MERC Sectors Mi Mw P-X Mi Mw P-X Mi Mw P-X Mi Mw P-X Grains 0.00 0.00 0.00 0.07 -0.26 0.19 0.09 -0.18 0.09 0.05 -0.20 0.14OthAgr -0.04 0.08 -0.05 -0.04 0.16 -0.12 -0.24 0.56 -0.32 -0.04 0.15 -0.11Livestock 0.00 0.01 -0.01 -0.02 0.04 -0.02 0.06 0.12 -0.18 -0.01 0.03 -0.02Extraction -0.11 0.50 -0.39 -0.23 1.16 -0.92 -1.42 1.75 -0.33 -0.21 0.99 -0.77Food 0.03 -0.09 0.06 0.04 -0.17 0.14 0.19 -0.36 0.16 0.04 -0.15 0.11Cloth 0.19 -0.55 0.35 0.17 -0.76 0.59 2.47 -4.37 1.90 0.20 -0.72 0.52Transp 0.91 -1.39 0.49 -0.35 0.72 -0.37 16.22 -16.40 0.18 0.24 -0.17 -0.08Mach 0.50 -1.16 0.66 -0.09 1.05 -0.96 4.32 -5.41 1.09 0.08 0.54 -0.62OthMnf -0.18 0.64 -0.46 -0.04 0.38 -0.34 -1.00 1.60 -0.61 -0.09 0.46 -0.37Svces 0.00 -0.03 0.02 0.00 -0.02 0.02 0.00 0.01 -0.01 0.00 -0.02 0.02Total 0.05 -0.03 -0.02 -0.02 0.13 -0.11 0.47 -0.47 0.00 0.00 0.08 -0.09
Source: GTAP CET simulation.
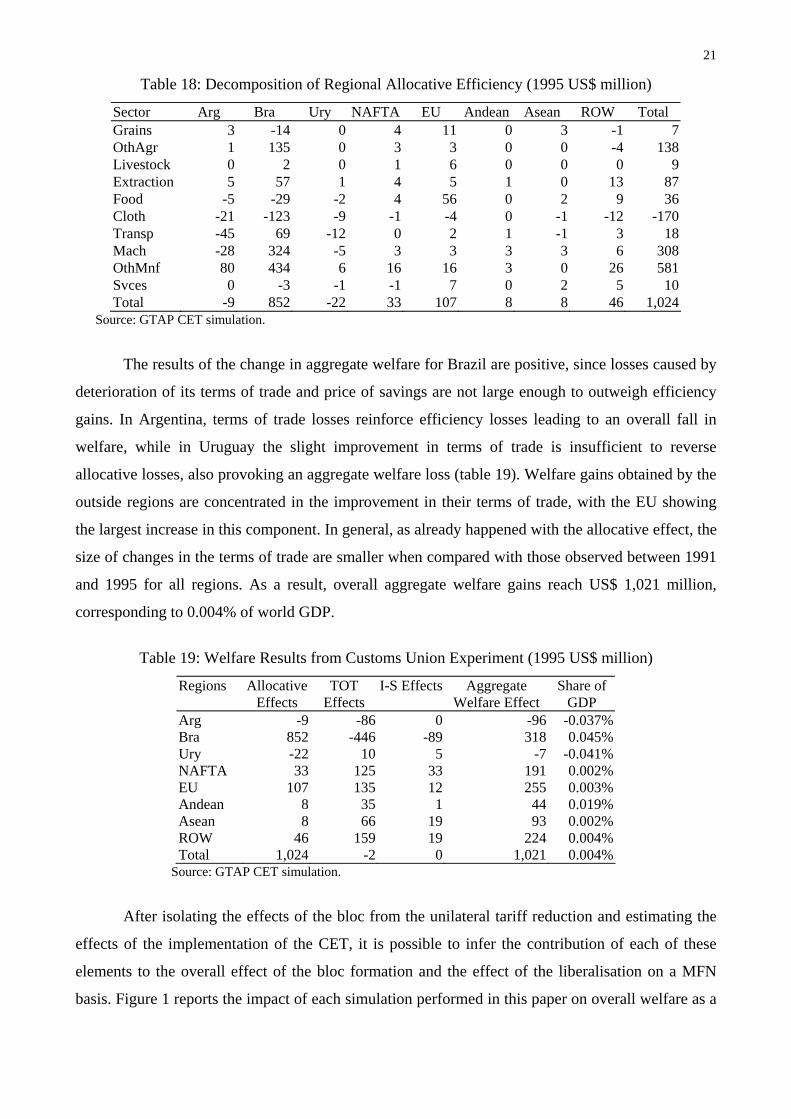
This is confirmed when the allocative efficiency analysis is performed allowing one to see
that, as already occurred in previous simulations, Brazil is the country that benefit most from
changes in trade policy (table 18). Most commodity groups present allocative gains except those in
which the level of protection was raised, notably clothing. However, as the size of changes in
distortions is much smaller, the impact on welfare is also not as significant as it was under the
previous experiments. As expected, most manufactures in Argentina and Uruguay face allocative
losses due to the rise in tariffs, especially transport equipment, while agricultural sectors experience
efficiency gains provoking an overall allocative loss for these two countries. The total impact
associated with the efficiency effect reaches US$ 1,024 million, with all outside regions benefiting
from allocative gains.
21
Table 18: Decomposition of Regional Allocative Efficiency (1995 US$ million)
Sector Arg Bra Ury NAFTA EU Andean Asean ROW Total Grains 3 -14 0 4 11 0 3 -1 7OthAgr 1 135 0 3 3 0 0 -4 138Livestock 0 2 0 1 6 0 0 0 9Extraction 5 57 1 4 5 1 0 13 87Food -5 -29 -2 4 56 0 2 9 36Cloth -21 -123 -9 -1 -4 0 -1 -12 -170Transp -45 69 -12 0 2 1 -1 3 18Mach -28 324 -5 3 3 3 3 6 308OthMnf 80 434 6 16 16 3 0 26 581Svces 0 -3 -1 -1 7 0 2 5 10Total -9 852 -22 33 107 8 8 46 1,024
Source: GTAP CET simulation.
The results of the change in aggregate welfare for Brazil are positive, since losses caused by
deterioration of its terms of trade and price of savings are not large enough to outweigh efficiency
gains. In Argentina, terms of trade losses reinforce efficiency losses leading to an overall fall in
welfare, while in Uruguay the slight improvement in terms of trade is insufficient to reverse
allocative losses, also provoking an aggregate welfare loss (table 19). Welfare gains obtained by the
outside regions are concentrated in the improvement in their terms of trade, with the EU showing
the largest increase in this component. In general, as already happened with the allocative effect, the
size of changes in the terms of trade are smaller when compared with those observed between 1991
and 1995 for all regions. As a result, overall aggregate welfare gains reach US$ 1,021 million,
corresponding to 0.004% of world GDP.
Table 19: Welfare Results from Customs Union Experiment (1995 US$ million)
Regions Allocative Effects
TOT Effects
I-S Effects Aggregate Welfare Effect
Share of GDP
Arg -9 -86 0 -96 -0.037% Bra 852 -446 -89 318 0.045% Ury -22 10 5 -7 -0.041% NAFTA 33 125 33 191 0.002% EU 107 135 12 255 0.003% Andean 8 35 1 44 0.019% Asean 8 66 19 93 0.002% ROW 46 159 19 224 0.004% Total 1,024 -2 0 1,021 0.004%
Source: GTAP CET simulation.
After isolating the effects of the bloc from the unilateral tariff reduction and estimating the
effects of the implementation of the CET, it is possible to infer the contribution of each of these
elements to the overall effect of the bloc formation and the effect of the liberalisation on a MFN
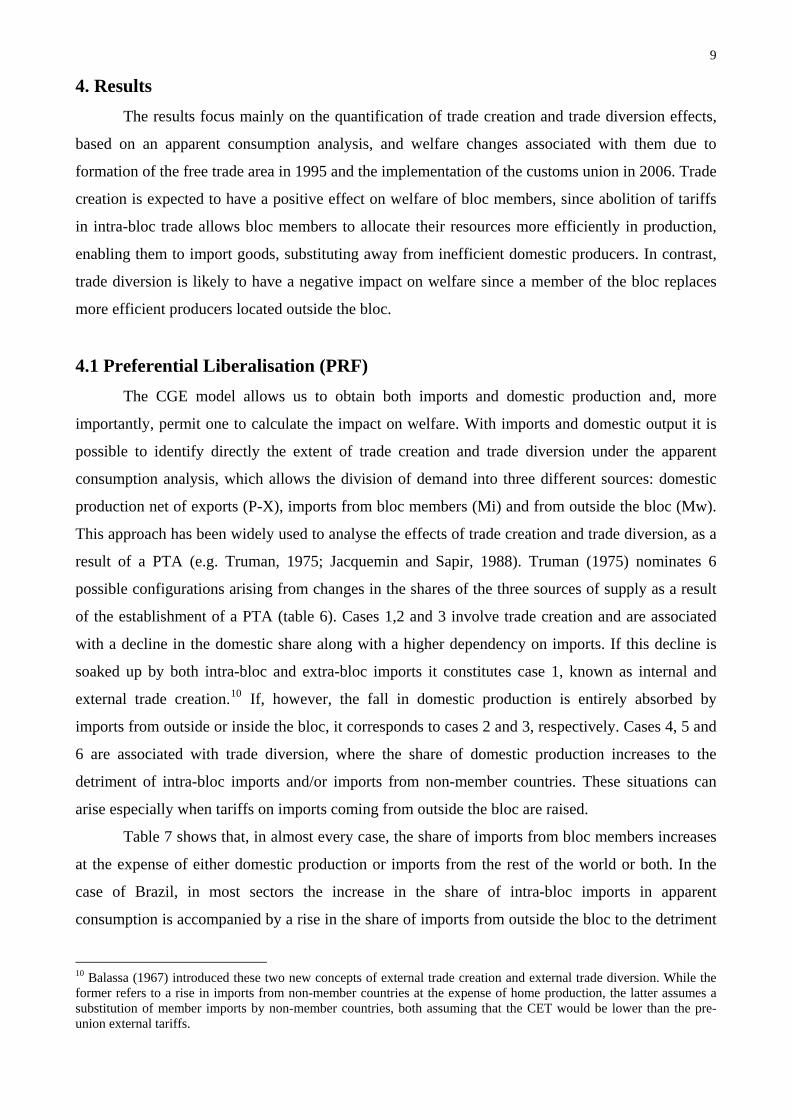
basis. Figure 1 reports the impact of each simulation performed in this paper on overall welfare as a
22
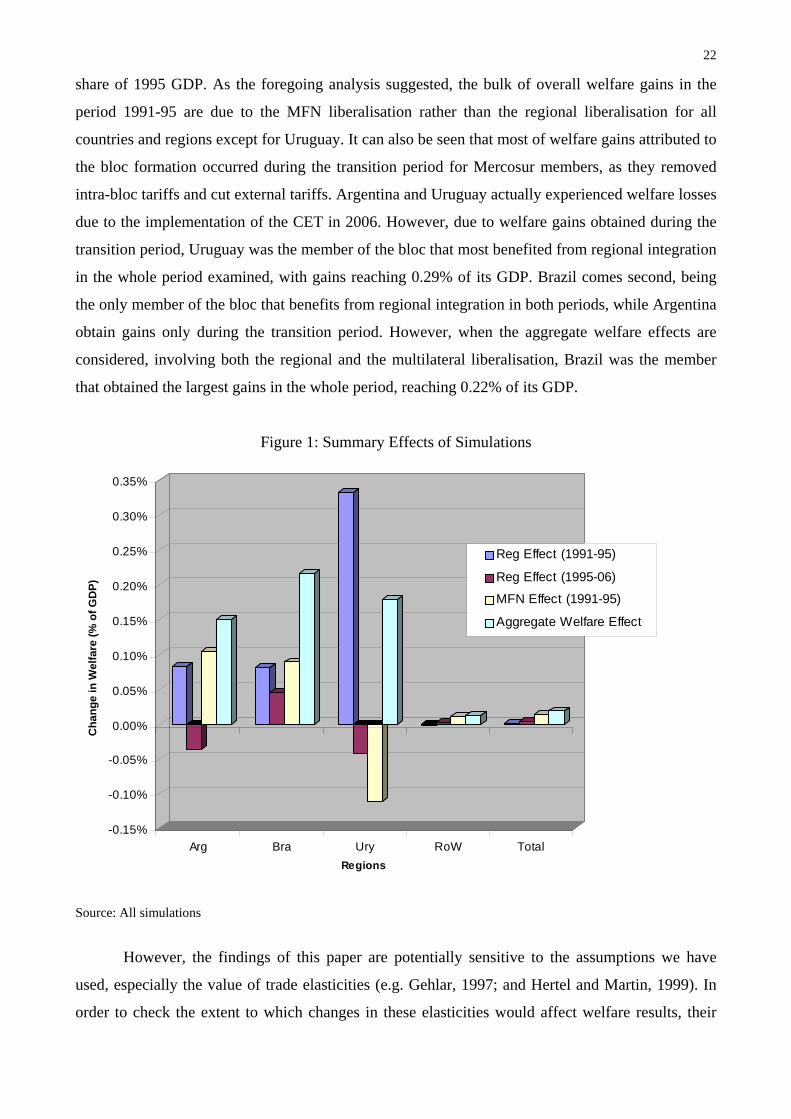
share of 1995 GDP. As the foregoing analysis suggested, the bulk of overall welfare gains in the
period 1991-95 are due to the MFN liberalisation rather than the regional liberalisation for all
countries and regions except for Uruguay. It can also be seen that most of welfare gains attributed to
the bloc formation occurred during the transition period for Mercosur members, as they removed
intra-bloc tariffs and cut external tariffs. Argentina and Uruguay actually experienced welfare losses
due to the implementation of the CET in 2006. However, due to welfare gains obtained during the
transition period, Uruguay was the member of the bloc that most benefited from regional integration
in the whole period examined, with gains reaching 0.29% of its GDP. Brazil comes second, being
the only member of the bloc that benefits from regional integration in both periods, while Argentina
obtain gains only during the transition period. However, when the aggregate welfare effects are
considered, involving both the regional and the multilateral liberalisation, Brazil was the member
that obtained the largest gains in the whole period, reaching 0.22% of its GDP.
Figure 1: Summary Effects of Simulations
-0.15%
-0.10%
-0.05%
0.00%
0.05%
0.10%
0.15%
0.20%
0.25%
0.30%
0.35%
Cha
nge
in W
elfa
re (%
of G
DP)
Arg Bra Ury RoW TotalRegions
Reg Effect (1991-95)
Reg Effect (1995-06)
MFN Effect (1991-95)
Aggregate Welfare Effect
Source: All simulations
However, the findings of this paper are potentially sensitive to the assumptions we have
used, especially the value of trade elasticities (e.g. Gehlar, 1997; and Hertel and Martin, 1999). In
order to check the extent to which changes in these elasticities would affect welfare results, their
23
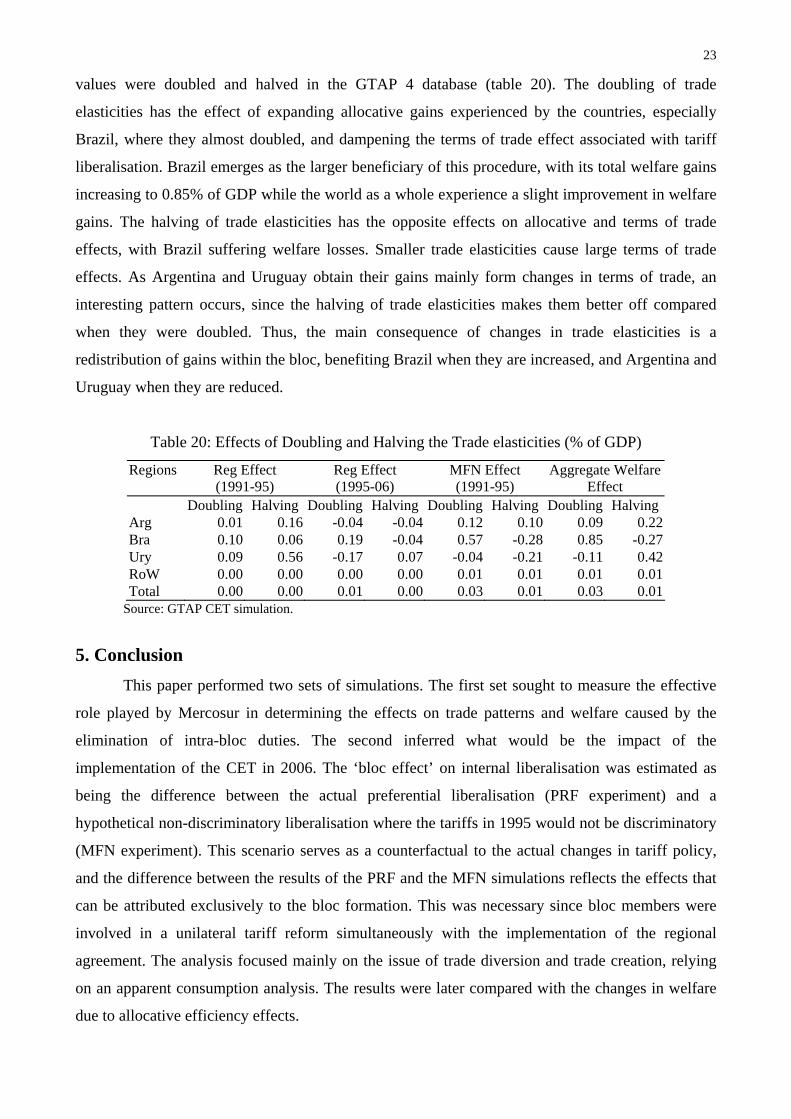
values were doubled and halved in the GTAP 4 database (table 20). The doubling of trade
elasticities has the effect of expanding allocative gains experienced by the countries, especially
Brazil, where they almost doubled, and dampening the terms of trade effect associated with tariff
liberalisation. Brazil emerges as the larger beneficiary of this procedure, with its total welfare gains
increasing to 0.85% of GDP while the world as a whole experience a slight improvement in welfare
gains. The halving of trade elasticities has the opposite effects on allocative and terms of trade
effects, with Brazil suffering welfare losses. Smaller trade elasticities cause large terms of trade
effects. As Argentina and Uruguay obtain their gains mainly form changes in terms of trade, an
interesting pattern occurs, since the halving of trade elasticities makes them better off compared
when they were doubled. Thus, the main consequence of changes in trade elasticities is a
redistribution of gains within the bloc, benefiting Brazil when they are increased, and Argentina and
Uruguay when they are reduced.
Table 20: Effects of Doubling and Halving the Trade elasticities (% of GDP)
Regions Reg Effect (1991-95)
Reg Effect (1995-06)
MFN Effect (1991-95)
Aggregate Welfare Effect
Doubling Halving Doubling Halving Doubling Halving Doubling HalvingArg 0.01 0.16 -0.04 -0.04 0.12 0.10 0.09 0.22Bra 0.10 0.06 0.19 -0.04 0.57 -0.28 0.85 -0.27Ury 0.09 0.56 -0.17 0.07 -0.04 -0.21 -0.11 0.42RoW 0.00 0.00 0.00 0.00 0.01 0.01 0.01 0.01Total 0.00 0.00 0.01 0.00 0.03 0.01 0.03 0.01
Source: GTAP CET simulation.
5. Conclusion This paper performed two sets of simulations. The first set sought to measure the effective
role played by Mercosur in determining the effects on trade patterns and welfare caused by the
elimination of intra-bloc duties. The second inferred what would be the impact of the
implementation of the CET in 2006. The ‘bloc effect’ on internal liberalisation was estimated as
being the difference between the actual preferential liberalisation (PRF experiment) and a
hypothetical non-discriminatory liberalisation where the tariffs in 1995 would not be discriminatory
(MFN experiment). This scenario serves as a counterfactual to the actual changes in tariff policy,
and the difference between the results of the PRF and the MFN simulations reflects the effects that
can be attributed exclusively to the bloc formation. This was necessary since bloc members were
involved in a unilateral tariff reform simultaneously with the implementation of the regional
agreement. The analysis focused mainly on the issue of trade diversion and trade creation, relying
on an apparent consumption analysis. The results were later compared with the changes in welfare
due to allocative efficiency effects.
24
The PRF experiment showed that Brazil experienced a situation characterised as internal and
external trade creation in most sectors where the shares of intra and extra-bloc imports increases at
the expense of domestic production. In Argentina and Uruguay, although the share of apparent
consumption expenditures coming from intra-bloc imports also expanded, it occurred to the
detriment of both domestic production and imports from outside the bloc. The fear of trade
diversion was minimised, since the share of domestic output declined, in most cases, more
intensively than that of imports from third countries. The welfare analysis based on the allocative
efficiency effects of the simulation confirms that Brazil benefited most from the experiment
obtaining the largest welfare increase in most sectors. Argentina and Uruguay faced almost no
change in welfare due to the allocative effect, suggesting that the fears of trade diversion did not
show up at country level, although some sectors, like transport equipment, experienced allocative
losses in these two countries.
However, by netting out the bloc effects by removing the impact of the MFN scenario from
the PRF simulation it was possible to identify that the PRF experiment provides a poor
approximation of the real effect associated with the bloc formation, especially in Brazil where
unilateral liberalisation was more vigorously pursued. Therefore, when the bloc effects were
disentangled from the rest, the results in terms of increases in extra-bloc imports and welfare are
quite impressive. Although there was an increase in allocative efficiency due to the bloc formation,
it was very small when compared with the gains generated by the liberalisation on a MFN basis. In
summary, most of the allocative gains experienced under the PRF experiment stemmed from
external rather than internal liberalisation.
Finally, the impact of the implementation of the CET was estimated starting from a scenario
with free trade within the bloc and the external tariffs as they were in 1995. The results from the
‘CET experiment’ suggested that the implementation of the CET would reinforce the changes in
shares in apparent consumption, which occurred due to the regional liberalisation in Argentina and
Uruguay while partially reversing the changes in Brazil. In Argentina and Uruguay there was a
decline in aggregate welfare, while Brazil and all other regions were better off. This results from the
need to raise the individual tariffs on extra-bloc imports in most commodity groups to match the
level required by the CET in Argentina and Uruguay. Meanwhile Brazil has to reduce its tariffs on
non-member countries to reach the CET levels, provoking an increase in the volume of imports
from third countries along with a reduction in imports from the other partners and in domestic
production bringing about allocative gains.
25
References Allen, C., M. Gasiorek and A. Smith (1996), ‘Trade creation and trade diversion: Competitiveness
impacts of the single market programme’, Brighton: School of European Studies, University of Sussex.
Balassa, B. (1967), ‘Trade creation and trade diversion in manufactures in the European Common Market’, The Economic Journal, 71, 01-21.
Baldwin, R. and A. Venables (1995), ‘Regional economic integration’, in Grossman, G. and K. Rogoff (eds), Handbook of International Economics, vol. 3, Amsterdam: North Holland, 1597-1644.
Brandão, A., M. Lopes and L. Pereira (1998), ‘Uma análise quantitativa dos impactos do Mercosul sobre o Brasil’, in A. Brandão and L. Pereira (eds), Mercosul: Perspectivas da Integração, Rio de Janeiro: Fundação Getúlio Vargas, 47-74.
Brown, D., A. Deardorff and R. Stern (1992), ‘A North-American free trade agreement: Analysis issues and a computational assessment’, The World Economy, 15, 15-29.
Ferreira Filho, J. (1999), ‘Trade creation x trade diversion: Evidences from the GTAP model in the Mercosur integration process’, Paper Presented at the Second Annual Conference on Global Economic Analysis, Denmark.
Flores, R. (1996), ‘The gains from Mercosur: a general equilibrium, imperfect competition evaluation’, Journal of Policy Modelling, 19, 1-18.
Francois, J. (1998), ‘Scale economies and imperfect competition in the GTAP model’, GTAP Technical Paper, no 14, Center for Global Trade Analysis, Purdue University.
Gehlhar, M. (1997), ‘Historical analysis of growth and trade patterns in the Pacific rim: An evaluation of the GTAP framework’, in T. Hertel (ed.), Global Trade Analysis: Modelling and Applications, New York: Cambridge University Press, 349-363.
Gohin, A and T. Hertel (2001), ‘A Note on the CES Functional Form and Its Use in the GTAP Model’, Centre for Global Trade Analysis, Purdue University, available at http://ae761-e.agecon.purdue.edu/gtap/resources/download/449.pdf.
Haaland, J. and V. Norman (1992), ‘Global production effects of European integration’, in L. A. Winters (ed.), Trade Flows and Trade Policy After 1992, Cambridge: Cambridge University Press.
Harrison G., T. Rutherford and D. Tarr (1994), ‘Products standards, imperfect competition and the completion of the market of European Community’, World Bank mimeo, no 6, Washington DC.
Harrison G., T. Rutherford and D. Tarr (1997), ‘Quantifying the Uruguay Round’, The Economic Journal, 107, 1405-1430.
Hertel, T. (1997), Global Trade Analysis: Modelling and Applications, New York: Cambridge University Press.
Hertel, T. and W. Martin (1999), ‘Would Developing Countries Gain from Inclusion of Manufactures in the WTO Negotiations?’, Paper presented at Conference on WTO and the Millenium Round, Geneva.
Hoekman, B., M. Schiff and L. A. Winters (1998), ‘Regionalism and development: Main messages from a World Bank research project’, Development Research Group, Washington DC: World Bank.
26
Jacquemin, A. and A. Sapir (1988), ‘European integration or world integration’, Weltwirschaftliches Archiv, 124, 127-139.
Malcolm, R. (1998), ‘Adjusting tax rates in the GTAP Data Base’, GTAP Technical Paper, no 12, Center for Global Trade and Analysis, Purdue University, available at http://www.agecon.purdue.edu/gtap/techpapr.
McDougall, R. (1993), ‘Two small extensions to Salter’, Salter Working Paper, no 12.
McDougall, R., A. Elbehri and T. Truong (1999), ‘Global trade, assistance and protection: The GTAP 4 Data Base’, Purdue University: Center for Global Trade and Analysis.
Roland-Horst, D., K, Reinert and C. Shiells (1992), ‘North-American trade liberalisation and the role of nontariff barriers’, in ‘Economy-wide modelling of the economic implications of a FTA with Mexico and a NAFTA with Mexico and Canada’, U.S. International Trade Commission Publication, no 2508.
Truman, E. (1975), ‘The effects of European Economic Integration on the production and trade of manufactured products’, in B. Balassa (ed.), European Economic Integration, Amsterdam: North Holland, 3-40.