Embed Size (px)
Citation preview
State of Wisconsin Department of Administration Division of Energy
Environmental Research Program Final Report January 2007 Mercury Chemistry in Power Plant Plumes Prepared by: Leonard Levin Electric Power Research Institute 3412 Hillview Ave. Palo Alto, California 94303 Cosponsor: National Energy Technology Laboratory U.S. Department of Energy Pittsburgh, PA This report in whole is the property of the State of Wisconsin, Department of Administration, Division of Energy, and was funded through the FOCUS ON ENERGY program.
2
DISCLAIMER OF WARRANTIES AND LIMITATION OF LIABILITIES
THIS DOCUMENT WAS PREPARED BY THE ORGANIZATION(S) NAMED BELOW AS AN ACCOUNT OF WORK SPONSORED OR COSPONSORED BY THE ELECTRIC POWER RESEARCH INSTITUTE, INC. (EPRI). NEITHER EPRI, ANY MEMBER OF EPRI, ANY COSPONSOR, THE ORGANIZATION(S) BELOW, NOR ANY PERSON ACTING ON BEHALF OF ANY OF THEM:
(A) MAKES ANY WARRANTY OR REPRESENTATION WHATSOEVER, EXPRESS OR IMPLIED, (I) WITH RESPECT TO THE USE OF ANY INFORMATION, APPARATUS, METHOD, PROCESS, OR SIMILAR ITEM DISCLOSED IN THIS DOCUMENT, INCLUDING MERCHANTABILITY AND FITNESS FOR A PARTICULAR PURPOSE, OR (II) THAT SUCH USE DOES NOT INFRINGE ON OR INTERFERE WITH PRIVATELY OWNED RIGHTS, INCLUDING ANY PARTY'S INTELLECTUAL PROPERTY, OR (III) THAT THIS DOCUMENT IS SUITABLE TO ANY PARTICULAR USER'S CIRCUMSTANCE; OR
(B) ASSUMES RESPONSIBILITY FOR ANY DAMAGES OR OTHER LIABILITY WHATSOEVER (INCLUDING ANY CONSEQUENTIAL DAMAGES, EVEN IF EPRI OR ANY EPRI REPRESENTATIVE HAS BEEN ADVISED OF THE POSSIBILITY OF SUCH DAMAGES) RESULTING FROM YOUR SELECTION OR USE OF THIS DOCUMENT OR ANY INFORMATION, APPARATUS, METHOD, PROCESS, OR SIMILAR ITEM DISCLOSED IN THIS DOCUMENT.
ORGANIZATION(S) THAT PREPARED THIS DOCUMENT
Energy & Environmental Research Center Grand Forks, North Dakota
Electric Power Research Institute Palo Alto, California
Electric Power Research Institute and EPRI are registered service marks of the Electric Power Research Institute, Inc. EPRI. ELECTRIFY THE WORLD is a service mark of the Electric Power Research Institute, Inc.
Copyright © 2006 Electric Power Research Institute, Inc. All rights reserved.
iii
CITATIONS
This report was prepared by
Energy & Environmental Research Center 15 North 23rd Street Grand Forks, ND 58203
Principal Investigator D. Laudal
Electric Power Research Institute 3412 Hillview Ave. Palo Alto, CA 94303
Project Manager L. Levin
This report describes research sponsored by EPRI, the U.S. Department of Energy, and the State of Wisconsin.
The report is a corporate document that should be cited in the literature in the following manner:
EPRI, 2006; Mercury Chemistry in Power Plant Plumes; Electric Power Research Institute, Palo Alto, CA.

v
PROJECT DESCRIPTION
Recent field and pilot-scale results indicate that divalent mercury emitted from power plants may be rapidly transformed to elemental mercury within the power plant plumes. Such evidence has been found from laboratory plume simulation experiments, single-source comparisons of mercury emissions speciation with downwind plume impingement measurements, and one set of measurements by air and ground at a full-scale operational coal-fired power plant. Simulations of mercury chemistry in plumes have been carried out based on chemical reduction rates measured to date. Such simulations demonstrate improved fits between regional model results and wet deposition data, at least for particular years, while not degrading model performance for remaining years of the data record.
This project seeks to establish a data basis for whether or not significant reduction or oxidation reactions occur in mercury species emitted in the plume from a coal-fired power plant. The project also seeks to assign what chemical redox rate should apply to extend the results to other such sources for modeling power plant mercury plume chemistry.
The determination of mercury speciation in a dispersing emissions plume is most relevant for estimating mercury transformation and fate in the atmosphere. In particular, such transformations determine the eventual deposition rates and patterns of mercury downwind of its multiple sources. The million-fold greater solubility of divalent mercury in water drives its deposition behavior vs. that of elemental mercury, as well as the resulting downwind surface concentrations due to upwind sources.
The importance of these potential plume reactions for mercury deposition led to a joint field study jointly sponsored by EPRI, the U.S Department of Energy (DOE), and the State of Wisconsin Department of Administration. The study was carried out at the We Energies Pleasant Prairie Power Plant, Pleasant Prairie, Wisconsin, just west of Kenosha.
Results & Findings
Aircraft and ground measurements support the occurrence of a reduction in the fraction of reactive gaseous mercury (RGM) (with a corresponding increase in elemental mercury) as part of the Total Gaseous Mercury (TGM) emitted from the Pleasant Prairie stack. This occurrence is based on comparison of the RGM concentrations in the plume (at standard conditions) compared to the RGM in the stack. There was found to be a 44% drop in the fraction of RGM between the stack exit and the first sampling arc and a 66% reduction from the stack to the 5-mile sampling arc, with no additional drop between the 5- and 10-mile arcs.
Challenges & Objectives
Experiments have been carried out in both test chambers and pilot-scale coal combustors to determine whether mercury in power plant plumes may be oxidized or reduced in valence state.
vi
These experiments have indicated the presence of rapid and relatively complete reduction reactions converting divalent into elemental mercury within such plumes prior to full dispersion in the atmosphere. The measurements, however, have been unable to identify whether the reactions occur during plume rise (during positive thermal buoyancy) or downwind dispersion. To fully demonstrate the occurrence of these reactions, they must also be shown to be present in plume environments associated with fully operational power plants. That requirement, to capture reaction products that may be occurring very close to stack exits in highly turbulent environments, constrains the precision and reproducibility with which such full-scale experiments can be carried out. The work described here is one of several initial steps required to test whether, and in what direction, such rapid mercury redox reactions might be occurring in emissions plumes.
Applications, Values & Use
The linking of mercury atmospheric sources and downwind receptors, particularly receiving waters with the potential for fish uptake and bioaccumulation of mercury, requires the use of atmospheric physicochemical models. Current models either inadequately simulate chemical processes in plume environments, or do not include such processes at all. Additionally, there is little evidence of what such processes involving mercury might require in terms of physical environment or other constituents. Establishing whether mercury redox reactions occur in plume environments will allow improvements in simulation models of power plant contributions. In turn, this will allow a better fit between model outcomes and observed data, to allow more realistic allocation of deposited mercury to its sources.
EPRI Perspective
The chemical form of inorganic mercury, whether elemental or divalent, strongly determines its solubility in precipitable water in the atmosphere. This, in turn, may have orders-of-magnitude effects on ground-level concentrations and deposition rates at local and regional scales. The work described here that was done at the Pleasant Prairie Power Plant is a fundamental contribution to understanding these differences. The reactions implied may substantially alter the relative contributions of nearby vs. distant sources to Hg deposition patterns.
Approach
The overall project objective was to gain an understanding of Hg chemistry as a plume moves downwind from the stack and to determine what changes occur. To accomplish this, an aircraft-mounted sensor/analyzer was employed. The aircraft, a turboprop DHC-6-300 Twin Otter deHavilland Vistaliner, carried an automated Tekran ambient mercury monitor. Aircraft sampling was done at three locations downwind of the stack exit, flying repeated “racetrack” closed loops across the plume at plume centerline altitude. The first location was approximately 1500 ft downwind of the stack. The second and third locations were approximately 5 and 10 statute miles downwind of the stack, respectively.
Determining the altitude and direction of the plume was accomplished using a combination of visual inspection (on the flight arc closest to the stack) and measurements of NOx
vii
concentrations with a rapid-response sensor. Except for the closest location, the Tekran Hg analyzer was triggered by a NOx set point.
To establish baseline conditions for comparison with the plume samples, in-stack ground sampling was carried out during each flight, providing measurements of the Hg speciation in the stack. Hg sampling at the stack was accomplished using the Ontario Hydro mercury speciation wet-chemistry method along with a continuous mercury monitor. In addition, arcs upwind of the stack were flown by the instrumented aircraft to establish levels of reactive gaseous mercury and total gaseous mercury in background ambient air for calculating plume contributions to those levels.
Keywords
Mercury Utilities Plume(s) Reactive Gaseous Mercury Elemental Mercury Air Toxics

ix
ABSTRACT
Studies of mercury sources, controls, and source-receptor relationships rely on a knowledge of the chemical forms and amounts of mercury emitted from each source. Models of mercury atmospheric transport and chemistry similarly rely on source characterization to provide input forms of mercury to reactions based on heterogeneous and homogeneous microenvironments in the free atmosphere.
A missing key element of these simulations, and the data they are based on, is whether substantial mercury reactions occur within source emissions plumes prior to full dispersion into the atmosphere. The environments in these plumes can be expected to be turbulent and contain concentrations of co-emitted material that may be orders of magnitude higher than in the ambient atmosphere. These conditions, combined with elevated stack exit temperatures of approximately 200C or more, are favorable for reactions to occur with mercury under some conditions.
EPRI has conducted two field studies at operating power plants, in 2002 and 2003, to investigate the possible reduction or oxidation of mercury under plume conditions. The first study was at Plant Bowen, Cartersville, Georgia, operated by Georgia Power, part of Southern Company. The second study was at the Pleasant Prairie Power Plant, Pleasant Prairie, Wisconsin, operated by We Energies. At that site, surface and aircraft measurements were carried out by the University of North Dakota Energy and Environmental Research Center (EERC), with additional studies at the stack and in plume simulation chambers by Frontier Geosciences. The primary focus of this report is on the work at the Pleasant Prairie site.
The overall project objective was to gain an understanding of Hg chemistry as the stack emissions plume is transported downwind from the stack. Toward this end, measurements were carried out on the ground and by aircraft to characterize mercury chemistry simultaneously within the power plant and within the stack emissions plume. Ground measurements characterized mercury amounts and speciation from the plant boilers, through the air pollution control devices, to the stack base, with additional measurements carried out at stack ports on the periphery of the structure. Aircraft measurements were carried out by flying a Twin Otter aircraft through the plume at several locations (a point nearest the stack, at approximately effective stack height; 5 miles from the stack; and 10 miles from the stack) and measuring the speciated mercury composition in the plume using an automated ambient Hg monitor.
The results of the project appeared to show a chemical reduction in reactive gas mercury (RGM) (with a corresponding increase in the fraction of elemental Hg) when the proportion of RGM in the plume is compared to the proportion in the stack. There was a 44% reduction of RGM from the stack to the first sample point and a 66% reduction from the stack to the 5-mile sample point, with no additional reduction observed between the 5- and 10-mile locations. Simultaneous measurements in the static plume dilution chamber found no reduction or oxidation of mercury occurring under simulated plume conditions.
x
ACKNOWLEDGMENTS
This work would not have been possible without the efforts of many individuals. The authors would like to acknowledge the following people.
For their direction and leadership, appreciation is expressed to William Aljoe and Lynn Brickett of the U.S. Department of Energy National Energy Technology Laboratory, Pittsburgh. The work could also not have been completed without support from the Wisconsin Department of Administration, Wisconsin Focus on Energy, and Ingrid Kelley of that program.
At the University of North Dakota, thanks go to Grant Dunham, Blaise Mibek, and Richard Schulz from the Energy & Environmental Research Center and David Delene from the School of Aerospace Sciences,
For Frontier Geosciences, appreciation is extended to Eric Prestbo and his colleagues.
Deep appreciation is also expressed to the other researchers who contributed to the effort, including Ray Valente from the Tennessee Valley Authority.
Special thanks are expressed to Ed Morris and David Michaud of We Energies for facilitating the testing conducted at the Pleasant Prairie Power Plant and for all of the help their colleagues provided.
xi
NOMENCLATURE
AF atomic fluorescence CEM continuous emission monitor CMM continuous mercury monitor CVAFS cold-vapor atomic fluorescence spectroscopy DOE U.S. Department of Energy EERC Energy & Environmental Research Center ESP electrostatic precipitator Fd value relating gas volume to the heat content of the fuel, equal to dscf/106 Btu GEM gaseous elemental mercury GPS global positioning system HCl hydrochloric acid Hg mercury Hg0 elemental mercury Hg+2 divalent mercury HYSPLIT HYbrid Single-Particle Lagrangian Integrated Trajectory model lpm liters per minute MW megawatts nm nautical mile NOx nitrogen oxides NOy reactive nitrogen species OH Ontario Hydro mercury speciation method ppb parts per billion PRB Powder River Basin RGM reactive gaseous mercury SCR selective catalytic reduction SnCl2 stannous chloride SO2 sulfur dioxide SPDC static plume dilution chamber TECO Thermal Electron Corporation TVA Tennessee Valley Authority

xiii
EXECUTIVE SUMMARY
This report provides a detailed summary of the project entitled “Direct Measurement of Mercury Reactions in Coal Power Plant Plumes.” The data were obtained during testing at the We Energies Pleasant Prairie Power Plant, Pleasant Prairie, Wisconsin during August-September of 2003. The project was sponsored by EPRI with key funding from the U.S. Department of Energy (DOE) National Energy Technology Laboratory and the State of Wisconsin Department of Administration.
Introduction
A full understanding of the chemical and physical transformations of environmental mercury requires both measurement and model simulations. Part of this full understanding is a characterization of mercury chemical forms in the flue gas exhaust stream of combustion sources, including coal-fired power plants. It is known that emissions of mercury from these facilities may be in three forms, or “species”: elemental mercury; divalent, or reactive gaseous, mercury (RGM); and particulate-bound mercury. The speciation of mercury within the stack must be quantified to develop control strategies and to provide input data for atmospheric deposition models. However, the determination of speciation changes in a dispersing power plant stack emissions plume, if that occurs, is also required to correctly set input conditions for mercury atmospheric models. These plume transformations would determine the rate and form of Hg that finally is dispersed into the free atmosphere. Stack characterization alone will provide an incomplete and perhaps misleading portrayal of the forms of mercury emitted into the atmosphere.
To address these issues, the Electric Power Research Institute has undertaken a program of direct measurements of mercury in the emissions plumes at operating power plants. The first field experiment in this program was at Plant Bowen (operated by Georgia Power Company), with the Tennessee Valley Authority (TVA) conducting the aircraft studies and the University of North Dakota Energy and Environmental Research Center (EERC) and Frontier Geosciences doing Hg measurements at the stack. The second such study, reported on here, was conducted at the Pleasant Prairie Power Plant, Pleasant Prairie, Wisconsin. Measurements at that site, which is operated by We Energies, were by EERC (aircraft and stack Hg measurements), with additional stack measurements done by Frontier Geosciences. This report provides insight into the work at Pleasant Prairie; that work was sponsored by EPRI, EPRI member companies, the U.S. Department of Energy (via the National Energy Technology Laboratory, Pittsburgh, PA), and the State of Wisconsin Department of Administration (via Wisconsin Focus on Energy).
Project Objectives
The overall project goal was to gain an understanding of Hg chemistry as a plume moves downwind from the stack exit. Specific objectives include:
• Develop sampling techniques to measure speciated Hg in the plume.
xiv
• Develop techniques to determine the location of the plume at various points downwind of the stack.
• Determine the speciated Hg emissions at the stack and compare these results to those obtained from in- plume sampling aloft.
• Compute a Hg mass balance using dilution factors and other relevant parameters.
Project Description
Power Plant Description
The Pleasant Prairie Power Plant is located near the city of Pleasant Prairie just west of Kenosha, Wisconsin. The power plant has two generating units (Units 1 and 2) identical in operation with the exception of one (Unit 2) having a selective catalytic reduction (SCR) system installed at the time of these measurements. Both units have electrostatic precipitators (ESPs) for particulate control, and share a common stack. Other specifications of the Pleasant Prairie facility are:
• Fuel type: Powder River Basin (PRB) subbituminous coal • Boiler capacity: 617 MW (each unit) • Boiler type: opposed-fired pulverized coal (both units) • NOx control: SCR on Unit 2, low-NOx burners on both units • SO2 control: none, combustion of low-sulfur coal (both units) • Particulate control: ESP (both units)
The coal is fairly typical of PRB in that both the Hg and chlorine levels in the coal are comparatively low; the Hg averaged 0.041 µg/g and the chlorine, 10 ppm.
Aircraft and Equipment Used for the Project
The aircraft used for the emission plume sampling was a deHavilland turboprop DHC-6-300 Twin Otter deHavilland Vistaliner. The twin-engine plane was selected for use because of its large payload capacity and spacious arrangement for equipment, and the ability to operate efficiently at low altitudes and relatively low speeds with moderate fuel consumption. Most importantly for the plume study project, it could be flown at relatively slow speeds (80–160 knots/150–300 km/hr) and in tight formation to allow consistent plume traverses at fixed heights and downwind distances.
The Hg analyzer used in the aircraft was a Tekran® Model 2537A mercury vapor analyzer coupled with a Tekran® Model 1130 mercury speciation unit and a Tekran® Model 1135 particulate module. The analyzer portion of the system is based on the principle of atomic fluorescence and has detection limits <1 pg/m3. With this system, it was possible to simultaneously measure elemental mercury (Hg0), reactive gas mercury (RGM), and particulate-bound Hg species during the flight.
To compare the Hg concentrations in the plume to those in the stack, a dilution factor was determined. Based on the earlier tests conducted at Plant Bowen [2], it was decided that the
xv
NOx concentration in the stack vs. that in the plume be used to determine the dilution factor as shown in the following equation:
( )( )NOxBackgroundNOxPlume
NOxBackgroundNOxStackRatioDilution−−
=
In addition, the NOx analyzer was used to determine the location of the plume. The analyzer that was used for this project was a dual range Model 42C Thermo Electron ambient air NOx analyzer. This analyzer was able to measure 0–50 parts per billion (ppb) NOx in the low range and up to 500 ppb NOx in the high range.
Experimental Approach
Aircraft Sampling Locations
Following background sampling at a location upwind of the stack, aircraft sampling was done at three locations downwind of the plume. The first location was approximately 1500 ft from the stack, at approximately the effective stack height. The second and third locations were approximately 5 and 10 miles downwind of the stack, respectively. A number of different patterns were flown at the closest sampling point in an effort to maximize the sampling time within the emissions plume material. At the other two locations, a racetrack pattern was flown. To provide data on aircraft position as a function of time, a satellite-based global positioning system was used.
Aircraft sampling flights were conducted in daylight under fair weather conditions, during wind speeds ranging from 5.3 to 8.3 m/s. These wind speeds were still low enough that the aircraft was able to locate the plume by NOx sensors, and sometimes visually. Wind conditions were selected to ensure good plume tracking, with little likelihood of plume looping or touchdown close to the stack.
Stack Sampling
To establish baseline conditions for comparison with the plume samples, in-stack sampling was carried out simultaneously with each flight, providing measurements of the Hg speciation in the stack. Hg sampling at the stack was completed using the Ontario Hydro (OH) Hg speciation sampling method along with operation of a continuous mercury monitor (CMM). Prior to the start of the testing, the CMM was placed at the stack outlet and remained there during the entire project. During each flight day, one OH sample was taken at the stack.
In addition to Hg measurements by EERC, the plant operators continuously measured the NOx concentration in the stack using a continuous emission monitor. Although the NOx concentrations in the stack at the Pleasant Prairie Power Plant were somewhat lower than optimal for aircraft plume measurements (since half the flue gas was being diverted for treatment using an SCR), it was still possible to detect a difference between the background and plume, even at 10 miles. The average stack NOx concentration was 144 ppm(v).
xvi
Results and Discussion
Stack Results at Pleasant Prairie
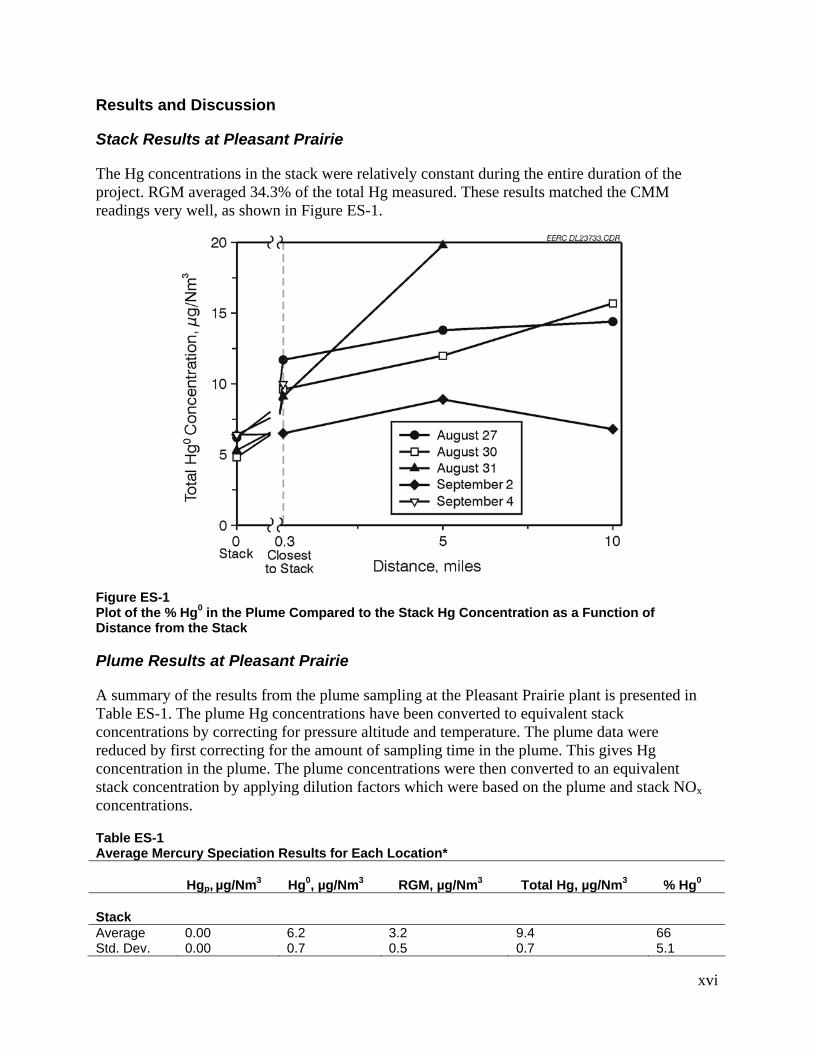
The Hg concentrations in the stack were relatively constant during the entire duration of the project. RGM averaged 34.3% of the total Hg measured. These results matched the CMM readings very well, as shown in Figure ES-1.
Figure ES-1 Plot of the % Hg0 in the Plume Compared to the Stack Hg Concentration as a Function of Distance from the Stack
Plume Results at Pleasant Prairie
A summary of the results from the plume sampling at the Pleasant Prairie plant is presented in Table ES-1. The plume Hg concentrations have been converted to equivalent stack concentrations by correcting for pressure altitude and temperature. The plume data were reduced by first correcting for the amount of sampling time in the plume. This gives Hg concentration in the plume. The plume concentrations were then converted to an equivalent stack concentration by applying dilution factors which were based on the plume and stack NOx concentrations.
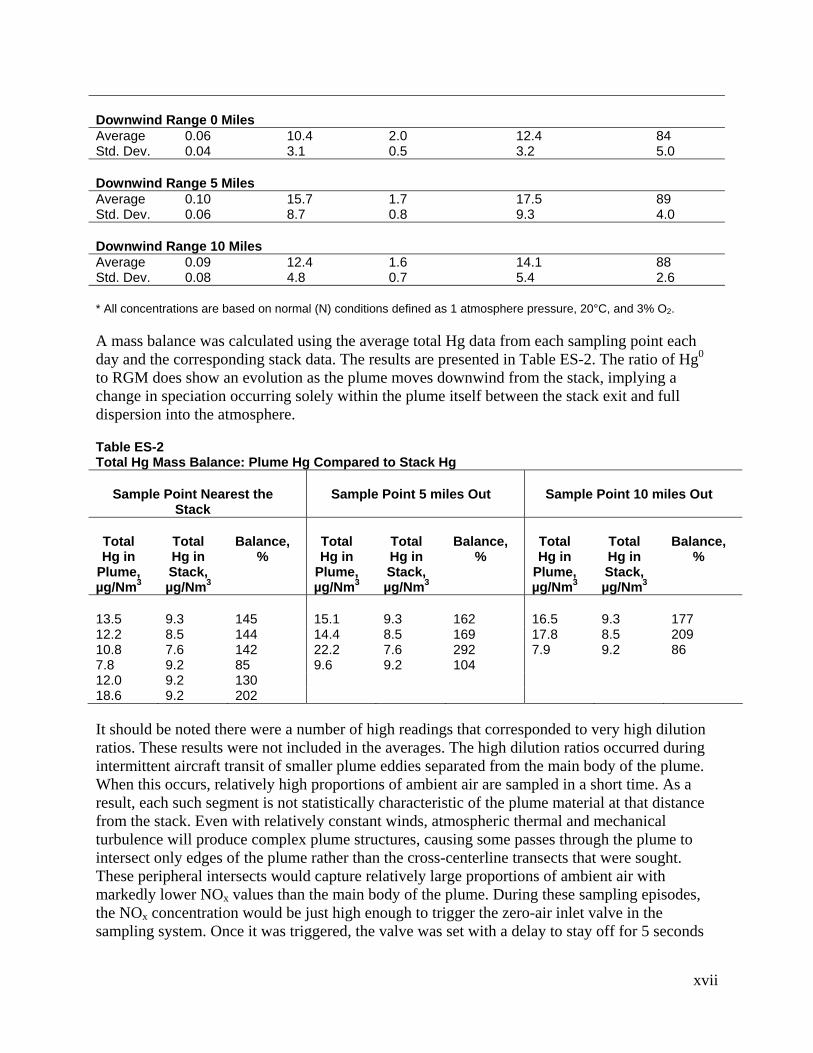
Table ES-1 Average Mercury Speciation Results for Each Location*
Hgp, µg/Nm3 Hg0, µg/Nm3 RGM, µg/Nm3 Total Hg, µg/Nm3 % Hg0
Stack Average 0.00 6.2 3.2 9.4 66 Std. Dev. 0.00 0.7 0.5 0.7 5.1
xvii
Downwind Range 0 Miles Average 0.06 10.4 2.0 12.4 84 Std. Dev. 0.04 3.1 0.5 3.2 5.0
Downwind Range 5 Miles Average 0.10 15.7 1.7 17.5 89 Std. Dev. 0.06 8.7 0.8 9.3 4.0
Downwind Range 10 Miles Average 0.09 12.4 1.6 14.1 88 Std. Dev. 0.08 4.8 0.7 5.4 2.6
* All concentrations are based on normal (N) conditions defined as 1 atmosphere pressure, 20°C, and 3% O2.
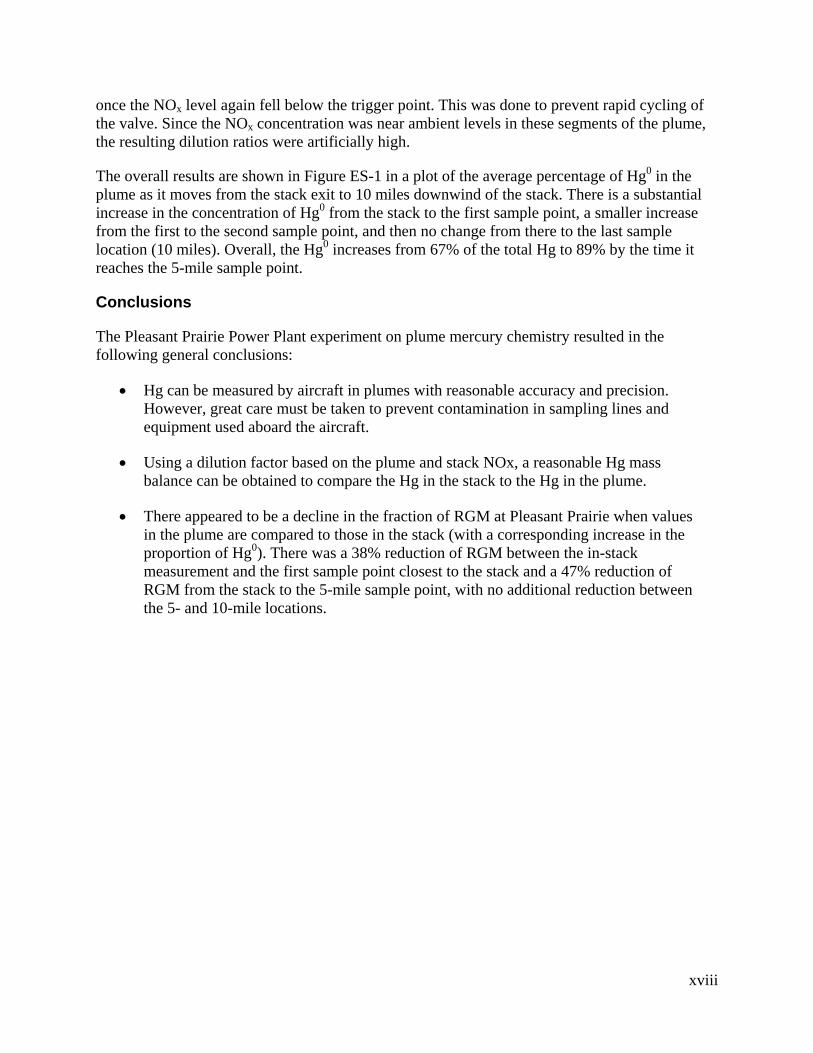
A mass balance was calculated using the average total Hg data from each sampling point each day and the corresponding stack data. The results are presented in Table ES-2. The ratio of Hg0 to RGM does show an evolution as the plume moves downwind from the stack, implying a change in speciation occurring solely within the plume itself between the stack exit and full dispersion into the atmosphere.
Table ES-2 Total Hg Mass Balance: Plume Hg Compared to Stack Hg
Sample Point Nearest the Stack
Sample Point 5 miles Out Sample Point 10 miles Out
Total Hg in
Plume, µg/Nm3
Total Hg in Stack, µg/Nm3
Balance, %
Total Hg in
Plume, µg/Nm3
Total Hg in Stack, µg/Nm3
Balance, %
Total Hg in
Plume, µg/Nm3
Total Hg in Stack, µg/Nm3
Balance, %
13.5 9.3 145 15.1 9.3 162 16.5 9.3 177 12.2 8.5 144 14.4 8.5 169 17.8 8.5 209 10.8 7.6 142 22.2 7.6 292 7.9 9.2 86 7.8 9.2 85 9.6 9.2 104 12.0 9.2 130 18.6 9.2 202
It should be noted there were a number of high readings that corresponded to very high dilution ratios. These results were not included in the averages. The high dilution ratios occurred during intermittent aircraft transit of smaller plume eddies separated from the main body of the plume. When this occurs, relatively high proportions of ambient air are sampled in a short time. As a result, each such segment is not statistically characteristic of the plume material at that distance from the stack. Even with relatively constant winds, atmospheric thermal and mechanical turbulence will produce complex plume structures, causing some passes through the plume to intersect only edges of the plume rather than the cross-centerline transects that were sought. These peripheral intersects would capture relatively large proportions of ambient air with markedly lower NOx values than the main body of the plume. During these sampling episodes, the NOx concentration would be just high enough to trigger the zero-air inlet valve in the sampling system. Once it was triggered, the valve was set with a delay to stay off for 5 seconds
xviii
once the NOx level again fell below the trigger point. This was done to prevent rapid cycling of the valve. Since the NOx concentration was near ambient levels in these segments of the plume, the resulting dilution ratios were artificially high.
The overall results are shown in Figure ES-1 in a plot of the average percentage of Hg0 in the plume as it moves from the stack exit to 10 miles downwind of the stack. There is a substantial increase in the concentration of Hg0 from the stack to the first sample point, a smaller increase from the first to the second sample point, and then no change from there to the last sample location (10 miles). Overall, the Hg0 increases from 67% of the total Hg to 89% by the time it reaches the 5-mile sample point.
Conclusions
The Pleasant Prairie Power Plant experiment on plume mercury chemistry resulted in the following general conclusions:
• Hg can be measured by aircraft in plumes with reasonable accuracy and precision. However, great care must be taken to prevent contamination in sampling lines and equipment used aboard the aircraft.
• Using a dilution factor based on the plume and stack NOx, a reasonable Hg mass balance can be obtained to compare the Hg in the stack to the Hg in the plume.
• There appeared to be a decline in the fraction of RGM at Pleasant Prairie when values in the plume are compared to those in the stack (with a corresponding increase in the proportion of Hg0). There was a 38% reduction of RGM between the in-stack measurement and the first sample point closest to the stack and a 47% reduction of RGM from the stack to the 5-mile sample point, with no additional reduction between the 5- and 10-mile locations.
xix
CONTENTS
1 INTRODUCTION.....................................................................................................................1-1
2 PROJECT DESCRIPTION......................................................................................................2-3 2.1 Power Plant Description...............................................................................................2-3 2.2 Mercury Analyzers .......................................................................................................2-4
2.2.1 Aircraft Hg Measurement System .......................................................................2-4 2.2.2 Stack Hg Analyzer...............................................................................................2-5
2.3 NOx Analyzer ...............................................................................................................2-6 2.4 Plume Dilution Chambers ............................................................................................2-6
3 EXPERIMENTAL APPROACH ..............................................................................................3-1 3.1 Plume Sampling...........................................................................................................3-1
3.1.1 Aircraft Sampling Arcs.........................................................................................3-1 3.1.3 Plume-Sampling Procedures ..............................................................................3-3
3.2 Stack Sampling............................................................................................................3-4
4 RESULTS AND DISCUSSION ...............................................................................................4-1 4.1 Stack Results at Pleasant Prairie.................................................................................4-1 4.2 Plume Results at Pleasant Prairie ...............................................................................4-2
4.2.1 Data Censoring ...................................................................................................4-4 4.2.2 Mass Balance Calculations .................................................................................4-4 4.2.3 Plume Hg Speciation Results..............................................................................4-6
4.3 Vertical Mercury Profile................................................................................................4-9 4.4 Static Plume Dilution Chamber Findings ...................................................................4-10
5 CONCLUSIONS AND RECOMMENDATIONS ......................................................................5-1
6 REFERENCES........................................................................................................................... 2

xxi
LIST OF FIGURES
Figure 2-1 Schematic of the Pleasant Prairie Power Plant ........................................................2-4 Figure 3-1 Flight Track on August 27, 2003...............................................................................3-1 Figure 3-2 Flight Track on August 30, 2003...............................................................................3-2 Figure 3-3 Flight Track on August 31, 2003...............................................................................3-2 Figure 3-4 Flight Track on September 2, 2003 ..........................................................................3-3 Figure 4-1 Stack CMM Mercury Speciation Results ..................................................................4-2 Figure 4-2 Plot of the Concentration of Hg0 in the Plume As It Moves from the Stack to
10 miles Downwind of the Stack ........................................................................................4-7 Figure 4-3 Plot of the % Hg0 in the Plume Compared to the Stack Hg Concentration As a
Function of Distance from the Stack ..................................................................................4-7 Figure 4-4 Plot of the Concentration of Total Mercury in the Plume As It Moves from the
Stack to 10 miles Downwind of the Stack ..........................................................................4-8 Figure 4-5 Plot of the Concentration of RGM in the Plume As It Moves from the Stack to
10 miles Downwind of the Stack ........................................................................................4-8

xxiii
LIST OF TABLES
Table 2-1 Location of Major Cities in Relationship to the Plant ................................................2-3 Table 2-2 Pleasant Prairie Coal Analysis (on an as-received basis) ........................................2-4 Table 4-1 Stack Ontario Hydro Mercury Speciation Results.....................................................4-1 Table 4-2 Plume Mercury Speciation Data ...............................................................................4-3 Table 4-3 Average Mercury Speciation Results for Each Location (from Table 6-2)*...............4-4 Table 4-4 Total Hg Mass Balance: Plume Hg Compared to Stack Hg......................................4-6
1-1
1 INTRODUCTION
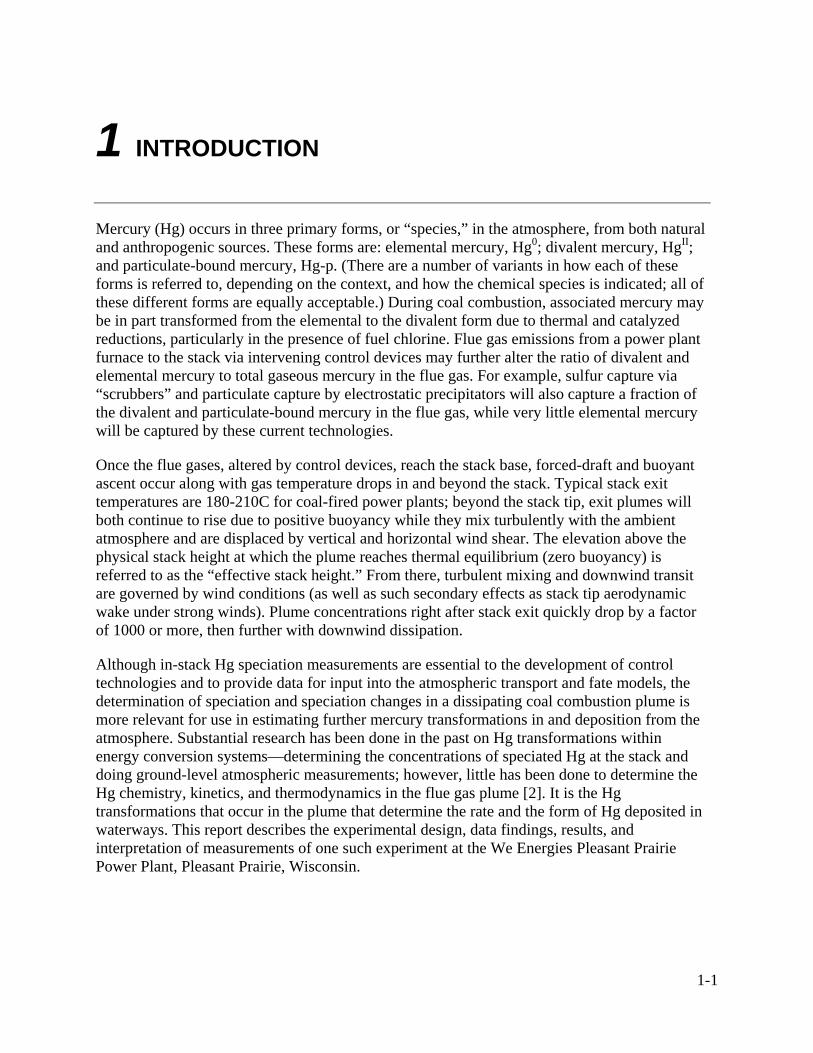
Mercury (Hg) occurs in three primary forms, or “species,” in the atmosphere, from both natural and anthropogenic sources. These forms are: elemental mercury, Hg0; divalent mercury, HgII; and particulate-bound mercury, Hg-p. (There are a number of variants in how each of these forms is referred to, depending on the context, and how the chemical species is indicated; all of these different forms are equally acceptable.) During coal combustion, associated mercury may be in part transformed from the elemental to the divalent form due to thermal and catalyzed reductions, particularly in the presence of fuel chlorine. Flue gas emissions from a power plant furnace to the stack via intervening control devices may further alter the ratio of divalent and elemental mercury to total gaseous mercury in the flue gas. For example, sulfur capture via “scrubbers” and particulate capture by electrostatic precipitators will also capture a fraction of the divalent and particulate-bound mercury in the flue gas, while very little elemental mercury will be captured by these current technologies.
Once the flue gases, altered by control devices, reach the stack base, forced-draft and buoyant ascent occur along with gas temperature drops in and beyond the stack. Typical stack exit temperatures are 180-210C for coal-fired power plants; beyond the stack tip, exit plumes will both continue to rise due to positive buoyancy while they mix turbulently with the ambient atmosphere and are displaced by vertical and horizontal wind shear. The elevation above the physical stack height at which the plume reaches thermal equilibrium (zero buoyancy) is referred to as the “effective stack height.” From there, turbulent mixing and downwind transit are governed by wind conditions (as well as such secondary effects as stack tip aerodynamic wake under strong winds). Plume concentrations right after stack exit quickly drop by a factor of 1000 or more, then further with downwind dissipation.
Although in-stack Hg speciation measurements are essential to the development of control technologies and to provide data for input into the atmospheric transport and fate models, the determination of speciation and speciation changes in a dissipating coal combustion plume is more relevant for use in estimating further mercury transformations in and deposition from the atmosphere. Substantial research has been done in the past on Hg transformations within energy conversion systems—determining the concentrations of speciated Hg at the stack and doing ground-level atmospheric measurements; however, little has been done to determine the Hg chemistry, kinetics, and thermodynamics in the flue gas plume [2]. It is the Hg transformations that occur in the plume that determine the rate and the form of Hg deposited in waterways. This report describes the experimental design, data findings, results, and interpretation of measurements of one such experiment at the We Energies Pleasant Prairie Power Plant, Pleasant Prairie, Wisconsin.

Project description
2-3
2 PROJECT DESCRIPTION
The power plant plume observations were carried out at the Pleasant Prairie Power Plant of We Energies in a combined field campaign involving in-plant, in-stack, and aircraft measurements of emitted mercury. Measurements of mercury within the flue gas stream were carried out by the University of North Dakota (UND) Energy and Environmental Research Center (EERC) at a number of locations from the power plant boilers to the stack. UND also flew sampling patterns that intersected the plume in a deHavilland Twin Otter modified for in-flight sampling of mercury. Full details of in-plant and aircraft sampling are described in Appendix A. Simultaneously, measurements of mercury reaction products were carried out by Frontier Geosciences using both a static plume dilution chamber (SPDC) and a dynamic plume dilution chamber (DPDC) situated adjacent to the stack on an elevated platform, accessing flue gases via stack sampling ports.
2.1 Power Plant Description
The Pleasant Prairie Power Plant, owned and operated by We Energies, is located in Pleasant Prairie, Wisconsin, just west of Kenosha. The distance and direction from the power plant to nearby major cities within a 50-mile radius is shown in Table 2-1.
Table 2-1 Location of Major Cities in Relationship to the Plant
City Distance,1 miles Direction Kenosha 7 NE Milwaukee 31 NNW Chicago 45 SSE Racine 17 NNE 1 Distance from Kenosha Regional Airport.
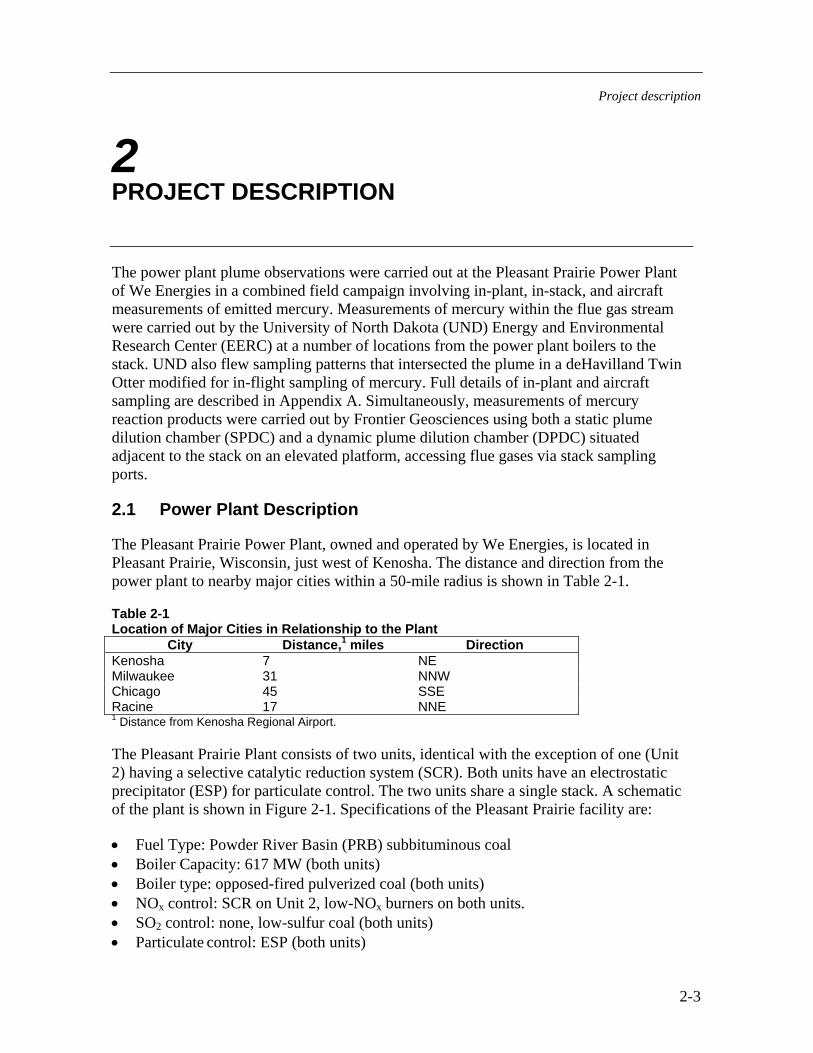
The Pleasant Prairie Plant consists of two units, identical with the exception of one (Unit 2) having a selective catalytic reduction system (SCR). Both units have an electrostatic precipitator (ESP) for particulate control. The two units share a single stack. A schematic of the plant is shown in Figure 2-1. Specifications of the Pleasant Prairie facility are:
• Fuel Type: Powder River Basin (PRB) subbituminous coal • Boiler Capacity: 617 MW (both units) • Boiler type: opposed-fired pulverized coal (both units) • NOx control: SCR on Unit 2, low-NOx burners on both units. • SO2 control: none, low-sulfur coal (both units) • Particulate control: ESP (both units)
Project description
2-4
Figure 2-1 Schematic of the Pleasant Prairie Power Plant
The analysis of the coal fired at the Pleasant Prairie Power Plant is shown in Table 4-2. The coal is typical of a PRB in that the Hg concentration is relatively low, <0.05 ppm, and the chlorine content is very low, 10 ppm.
Table 2-2 Pleasant Prairie Coal Analysis (on an as-received basis)
Component Value Hg, ppm (dry) 0.041
Chlorine, ppm (dry) 10 Proximate Analysis
Moisture, wt% 30.0 Volatile Matter, wt% 33.0 Fixed Carbon, wt% 31.5
Ash, wt% 5.5 Ultimate Analysis
Hydrogen, wt% 6.6 Carbon, wt% 46.9
Nitrogen, wt% 0.9 Sulfur, wt% 0.4
Oxygen, wt% 39.7 Heating Value, Btu/lb 8,190
Fd, dscf/106 Btu* 9,519 * Emission factor.
2.2 Mercury Analyzers
2.2.1 Aircraft Hg Measurement System
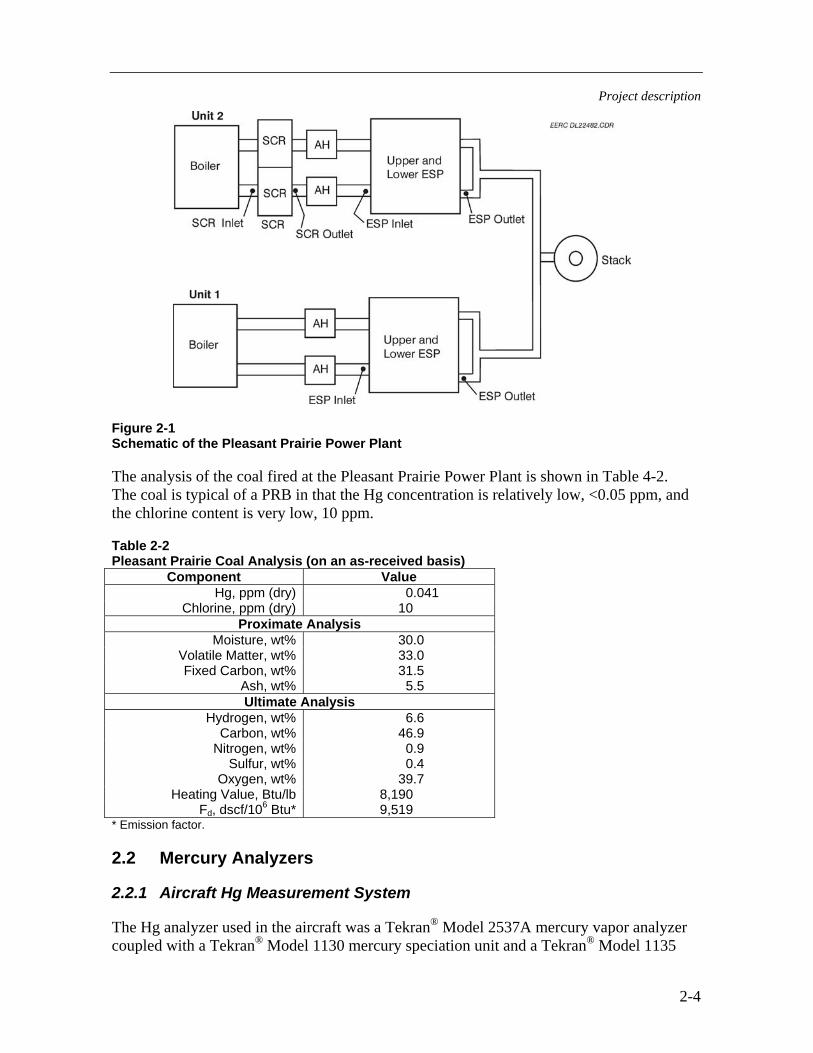
The Hg analyzer used in the aircraft was a Tekran® Model 2537A mercury vapor analyzer coupled with a Tekran® Model 1130 mercury speciation unit and a Tekran® Model 1135
Project description
2-5
particulate module. Figure 2-1 shows a schematic of the Tekran® components. Several modifications were made to the Tekran® setup:
• Addition of an optional impactor • Adding an external pump to pull an isokinetic sample from the probe • Adding a probe and heated sample transfer line to the sample path • Adding a soda-lime trap • Adding a zero-air valve trigger
Figure 2-1 Schematic of the Tekran Mercury System
The analyzer portion of the system (Model 2537A) uses cold-vapor atomic fluorescence spectroscopy (CVAFS). The system uses a gold-impregnated trap for preconcentrating the Hg and separating it from potential interferences that degrade sensitivity. The denuder (Model 1130) and particulate modules (1135) are integrated with the analyzer and are automated, allowing simultaneous monitor of Hg0, RGM, and particulate-bound Hg species during aircraft operations. One sampling cycle would consist of one hour’s sample recovery and analysis, during periods when the aircraft was in both the free atmosphere and the plume environment; time within the plume environment was summed via records from the rapid-response NOx analyzer. Further details are provided in Appendix A.
2.2.2 Stack Hg Analyzer
A Tekran Hg analyzer (Model 2537A modified to operate at the higher concentrations of Hg found in flue gas) was used at the stack to provide Hg speciation data continuously during the experimental period (August 25–September 6, 2003). The system is calibrated using Hg0 as the primary standard. The Hg0 is contained in a closed vial, which is held in a thermostatic bath. The temperature of the Hg is monitored, and the amount of Hg is determined using vapor pressure calculations. The unit calibration proved stable over a 24-hour period.
Project description
2-6
Upstream of the Tekran, a wet-chemistry PS Analytical conversion/pretreatment system was used. The purpose of the pretreatment/conversion system was to remove acid gases (HCl) that can swamp the gold traps, to convert all the Hg to Hg0 so that it can be measured by the atomic fluorescence detector, and to allow the instrument to speciate Hg. The wet-chemistry conversion unit used SnCl2 to convert all of the Hg to Hg0 prior to analysis; a KCl solution was used to strip out the Hg2+ (for speciation purposes), and a sodium hydroxide solution removed the acid gases.
2.3 NOx Analyzer
Aboard the aircraft, the zero-air valve on the Tekran Model 1130 pump module was triggered using an ambient air NOx analyzer. It was expected that a NOx differential between ambient air and the plume environment would be detectable well downwind of the stack. The detection of this gradient along with a global positioning system (GPS) was then used to determine the location of the plume and thereby control the zero-air valve. A rapid-response NOx analyzer was necessary to allow recording of NOx concentration changes as the aircraft crossed the edges of elevated plume concentrations, and assumed that NOx dispersed identically with total gaseous mercury (TGM). The assumption of neutral buoyancy and equivalent Froude numbers for all plume constituents at and beyond equivalent stack height and distance was used to calculate in-plume portions of the Hg concentration.
The analyzer that was used for this project was a rapid response, dual-range TECO Model 42C ambient air NOx analyzer. This analyzer was able to measure 0–50 ppb NOx in the low range and up to 500 ppb NOx in the high range, which based on the test at Bowen appeared to be adequate. By the removal of an external filter and replacement of ¼” lines with 1/8” Teflon lines, the analyzer response time from the inlet of the sample probe was decreased to 2 seconds. A separate TECO Model 111 calibration unit was used to calibrate the analyzer. The system required a tank of NO calibration gas and a source of zero air. The TECO Model 111 uses mass flow controllers to mix the calibration and zero gases to produce a desired calibration concentration.
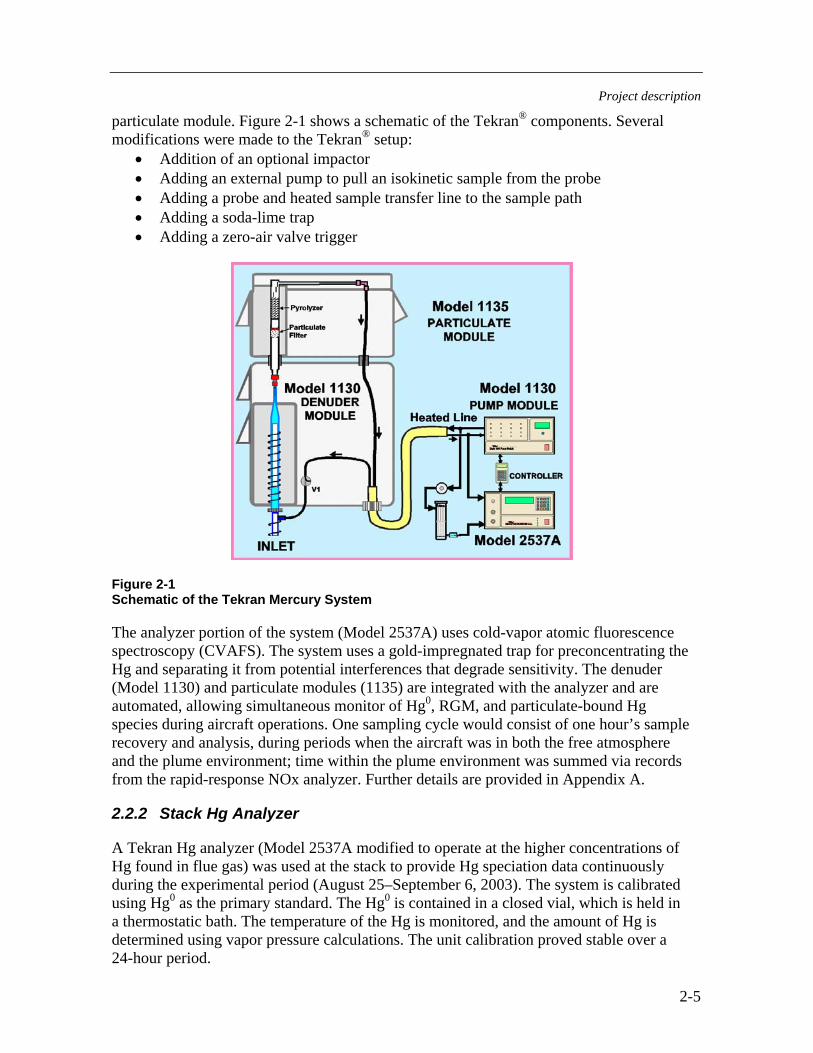
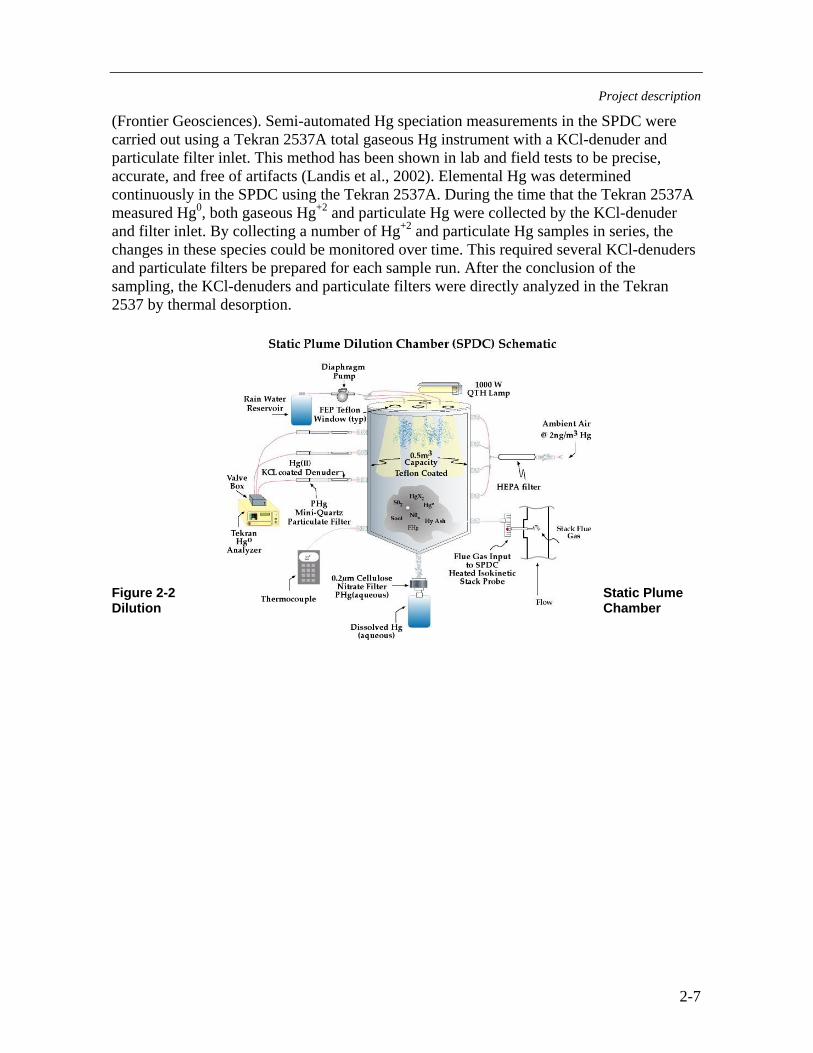
2.4 Plume Dilution Chambers During aircraft operations, and at times between measurements aloft, a static and (later) a dynamic plume dilution chamber were operated from scaffolding attached to the outside of the Pleasant Prairie stack structure. The static plume dilution chamber (SPDC) (Figure 2-2) is a 0.5-m3 partially evacuated stainless steel flask into which, successively, flue gas and ambient air (total of 3 to 5 l) are introduced. The SPDC is equipped with switchable caps allowing either artificial rainfall, artificial sunlight, or both to be introduced. Successive samples are withdrawn from the SPDC and analyzed using a Tekran instrument to gauge the changes in speciation and concentration of mercury that occur over the sampling period.
The flue gas diluted with filtered ambient air is allowed to react for a fixed amount of time, typically 4 minutes, before sampling begins. The air pressure is maintained near ambient (1 atm) in the SPDC. Dilution ratios [ambient air:flue gas bulk concentrations] were held at approximately 140:1. The Tekran determines the initial mass-balance of gas-phase Hg0. Simultaneously with flue gas introduction into the SPDC, speciation of the flue gas at the stack probe was determined using the Ontario-Hydro method and the FMSS method
Project description
2-7
(Frontier Geosciences). Semi-automated Hg speciation measurements in the SPDC were carried out using a Tekran 2537A total gaseous Hg instrument with a KCl-denuder and particulate filter inlet. This method has been shown in lab and field tests to be precise, accurate, and free of artifacts (Landis et al., 2002). Elemental Hg was determined continuously in the SPDC using the Tekran 2537A. During the time that the Tekran 2537A measured Hg0, both gaseous Hg+2 and particulate Hg were collected by the KCl-denuder and filter inlet. By collecting a number of Hg+2 and particulate Hg samples in series, the changes in these species could be monitored over time. This required several KCl-denuders and particulate filters be prepared for each sample run. After the conclusion of the sampling, the KCl-denuders and particulate filters were directly analyzed in the Tekran 2537 by thermal desorption.
Figure 2-2 Static Plume Dilution Chamber
3-1
3 EXPERIMENTAL APPROACH
3.1 Plume Sampling
3.1.1 Aircraft Sampling Arcs
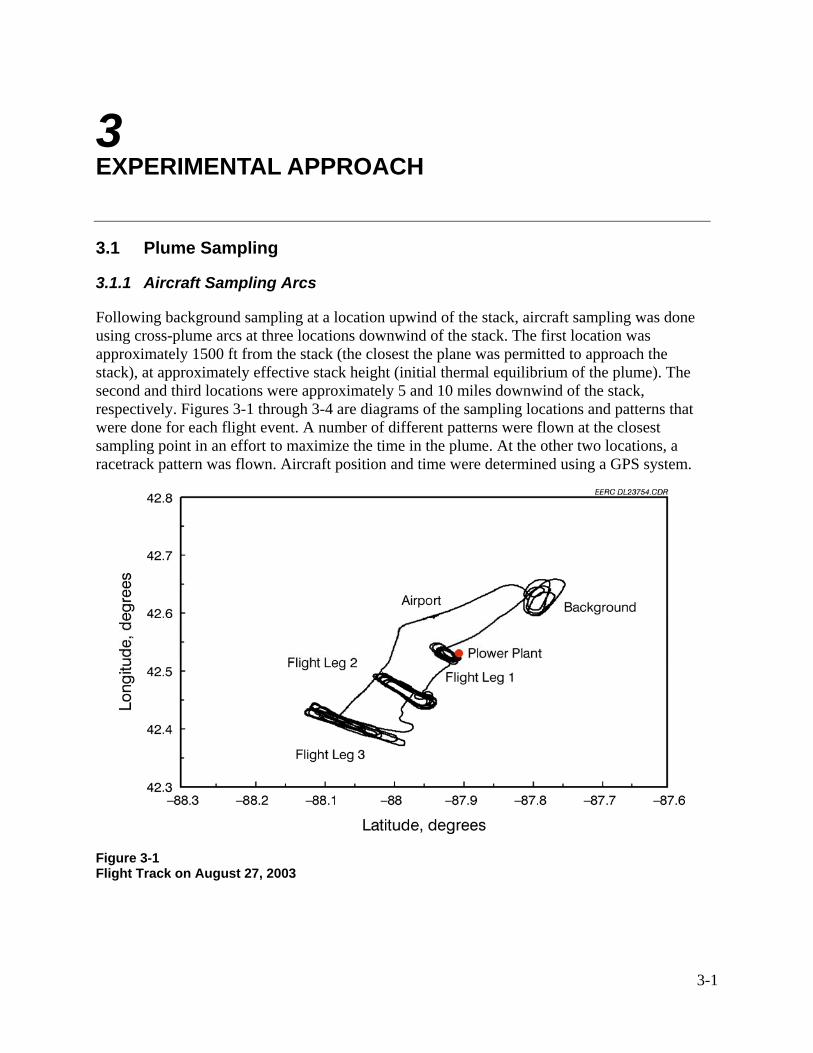
Following background sampling at a location upwind of the stack, aircraft sampling was done using cross-plume arcs at three locations downwind of the stack. The first location was approximately 1500 ft from the stack (the closest the plane was permitted to approach the stack), at approximately effective stack height (initial thermal equilibrium of the plume). The second and third locations were approximately 5 and 10 miles downwind of the stack, respectively. Figures 3-1 through 3-4 are diagrams of the sampling locations and patterns that were done for each flight event. A number of different patterns were flown at the closest sampling point in an effort to maximize the time in the plume. At the other two locations, a racetrack pattern was flown. Aircraft position and time were determined using a GPS system.
Figure 3-1 Flight Track on August 27, 2003
Experimental Approach
3-2
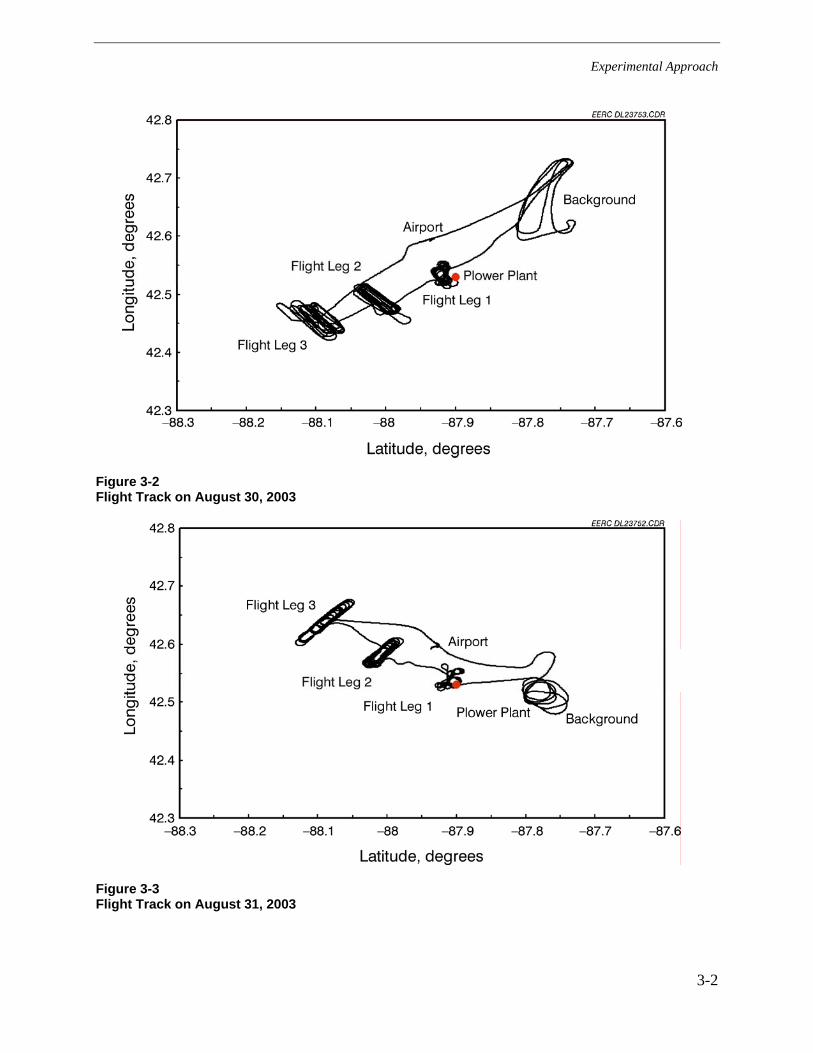
Figure 3-2 Flight Track on August 30, 2003
Figure 3-3 Flight Track on August 31, 2003
Experimental Approach
3-3
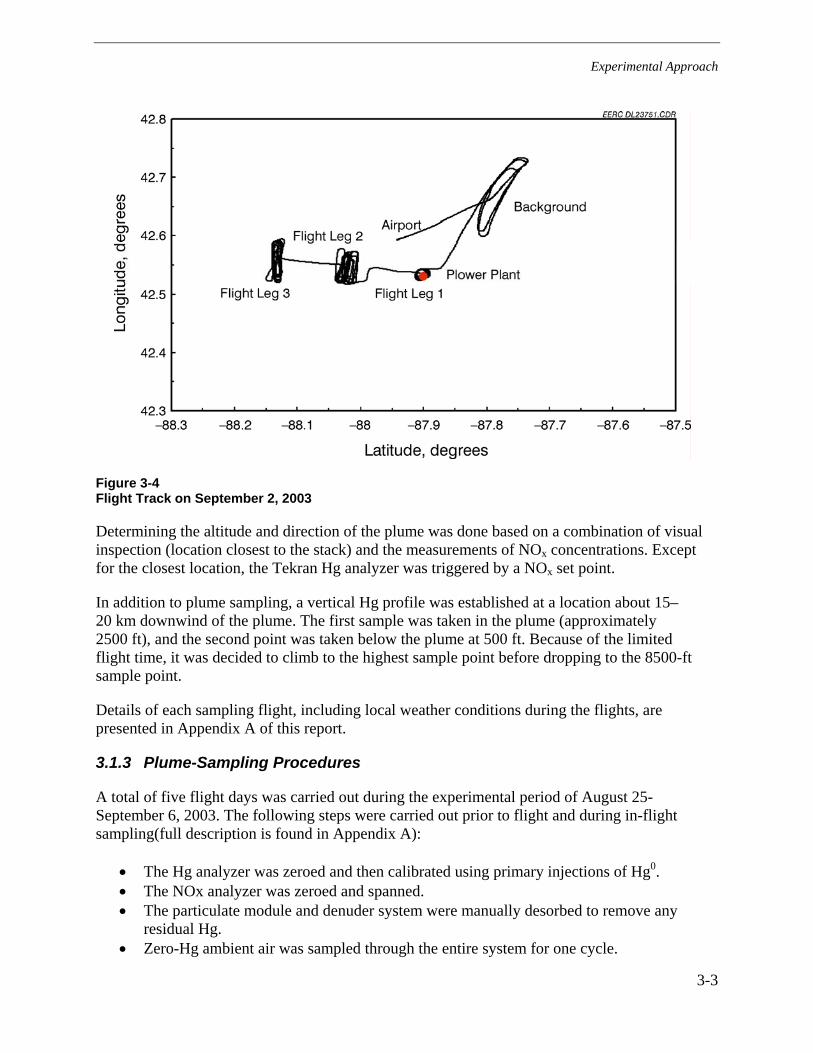
Figure 3-4 Flight Track on September 2, 2003
Determining the altitude and direction of the plume was done based on a combination of visual inspection (location closest to the stack) and the measurements of NOx concentrations. Except for the closest location, the Tekran Hg analyzer was triggered by a NOx set point.
In addition to plume sampling, a vertical Hg profile was established at a location about 15–20 km downwind of the plume. The first sample was taken in the plume (approximately 2500 ft), and the second point was taken below the plume at 500 ft. Because of the limited flight time, it was decided to climb to the highest sample point before dropping to the 8500-ft sample point.
Details of each sampling flight, including local weather conditions during the flights, are presented in Appendix A of this report.
3.1.3 Plume-Sampling Procedures
A total of five flight days was carried out during the experimental period of August 25-September 6, 2003. The following steps were carried out prior to flight and during in-flight sampling(full description is found in Appendix A):
• The Hg analyzer was zeroed and then calibrated using primary injections of Hg0. • The NOx analyzer was zeroed and spanned. • The particulate module and denuder system were manually desorbed to remove any
residual Hg. • Zero-Hg ambient air was sampled through the entire system for one cycle.
Experimental Approach
3-4
• Background samples were taken in the plane at a point approximately 5 miles upwind of the stack.
• The plume was then located by visual means at the point nearest to the stack (~1500 ft), and Hg samples were taken over a 25-minute period.
• After the plume was located at the 5-mile arc, the NOx trigger point was set at an appropriate level for that distance downwind of the stack to trigger sampling when the plume was entered.
• After the analysis of the first sample was completed, Hg sampling was done for another 25 minutes at the 5-mile location.
• The process was repeated at a point in the plume 10 miles downwind of the stack.
3.2 Stack Sampling
For comparison with plume mercury samples, in-stack sampling was carried out simultaneously during the flights. Hg sampling at the stack was carried out using the Ontario Hydro (OH) Hg speciation sampling method and a continuous mercury monitor (CMM) placed at the stack exit. One OH sample was taken per flight day.
During the sampling period, it was expected that the two units at the Pleasant Prairie Plant would be operating at or near normal operating conditions. Plant operating conditions (i.e., load, O2, NOx, SO2, CO2) were logged by plant personnel during the sampling period. From plant data, operating conditions were relatively constant for each day. Since stack NOx values were used to calculate dilution ratios for the plume samples, relatively constant operating conditions were required to allow application of ground-calculated dilution ratios to aircraft-collected data.:
( )( )NOxBackgroundNOxPlume
NOxBackgroundNOxStackRatioDilution−−
= [Eq. 1]
Since one of the two Pleasant Prairie units had a selective catalytic reduction (SCR) device operational, the NOx concentrations in the stack were somewhat lower than desired for aircraft plume measurement. It should be noted that the ESPs at Pleasant Prairie Power Plant were very efficient (>99.8%), which is illustrated by the low opacity (<10%). As a result, the plume was difficult to find visually from the air even at the closest location to the stack.
The Hg measurements by the aircraft and at the stack were compared to SPDC located at the stack by Frontier Geosciences, Inc.
4-1
4 RESULTS AND DISCUSSION
4.1 Stack Results at Pleasant Prairie
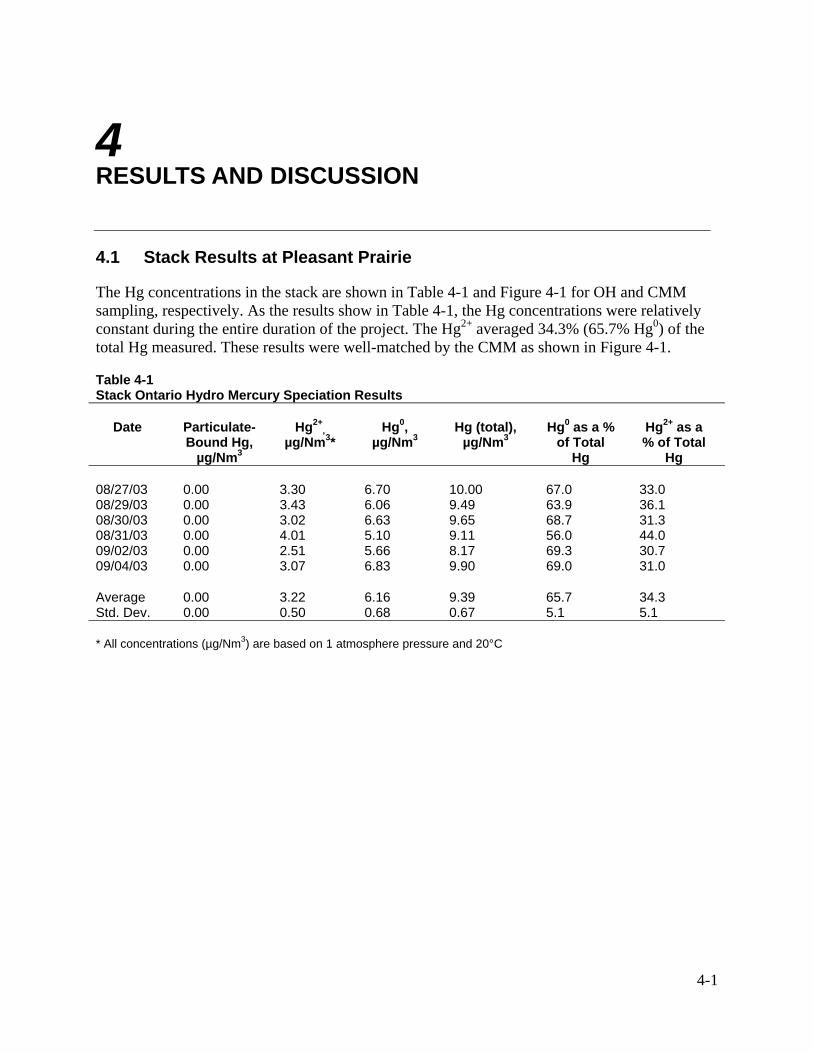
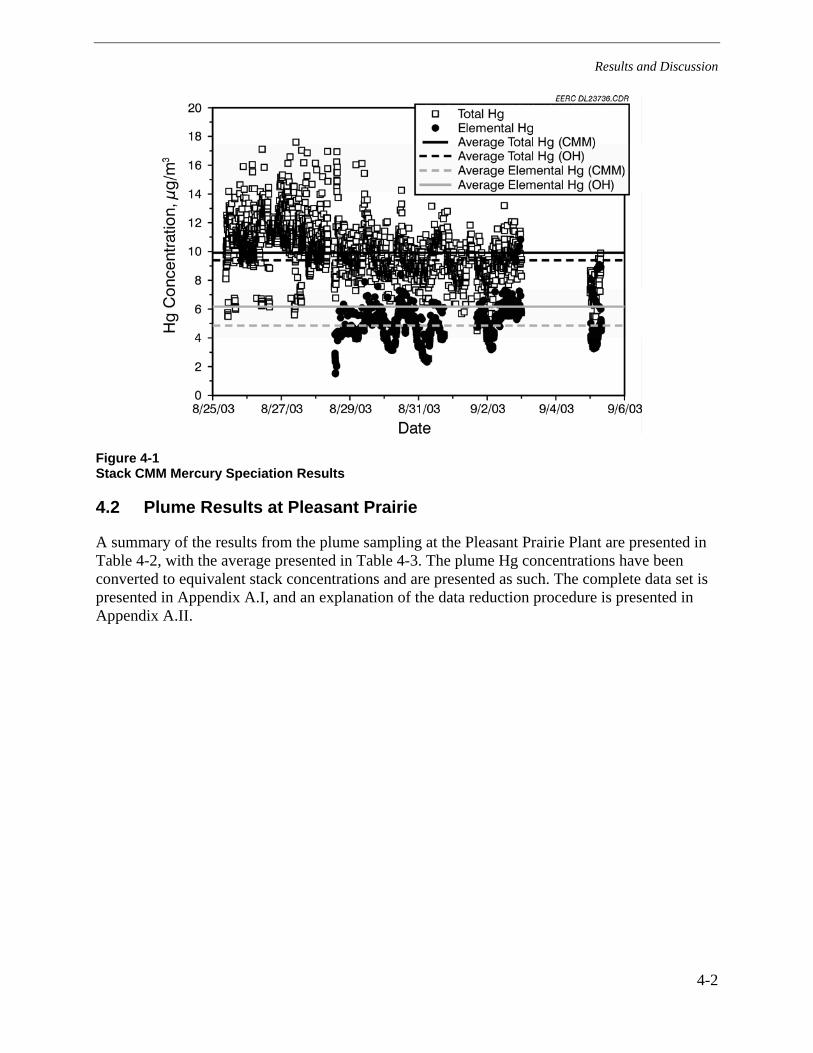
The Hg concentrations in the stack are shown in Table 4-1 and Figure 4-1 for OH and CMM sampling, respectively. As the results show in Table 4-1, the Hg concentrations were relatively constant during the entire duration of the project. The Hg2+ averaged 34.3% (65.7% Hg0) of the total Hg measured. These results were well-matched by the CMM as shown in Figure 4-1.
Table 4-1 Stack Ontario Hydro Mercury Speciation Results
Date Particulate-Bound Hg,
µg/Nm3
Hg2+,
µg/Nm3* Hg0,
µg/Nm3 Hg (total),
µg/Nm3 Hg0 as a %
of Total Hg
Hg2+ as a % of Total
Hg
08/27/03 0.00 3.30 6.70 10.00 67.0 33.0 08/29/03 0.00 3.43 6.06 9.49 63.9 36.1 08/30/03 0.00 3.02 6.63 9.65 68.7 31.3 08/31/03 0.00 4.01 5.10 9.11 56.0 44.0 09/02/03 0.00 2.51 5.66 8.17 69.3 30.7 09/04/03 0.00 3.07 6.83 9.90 69.0 31.0
Average 0.00 3.22 6.16 9.39 65.7 34.3 Std. Dev. 0.00 0.50 0.68 0.67 5.1 5.1
* All concentrations (µg/Nm3) are based on 1 atmosphere pressure and 20°C
Results and Discussion
4-2
Figure 4-1 Stack CMM Mercury Speciation Results
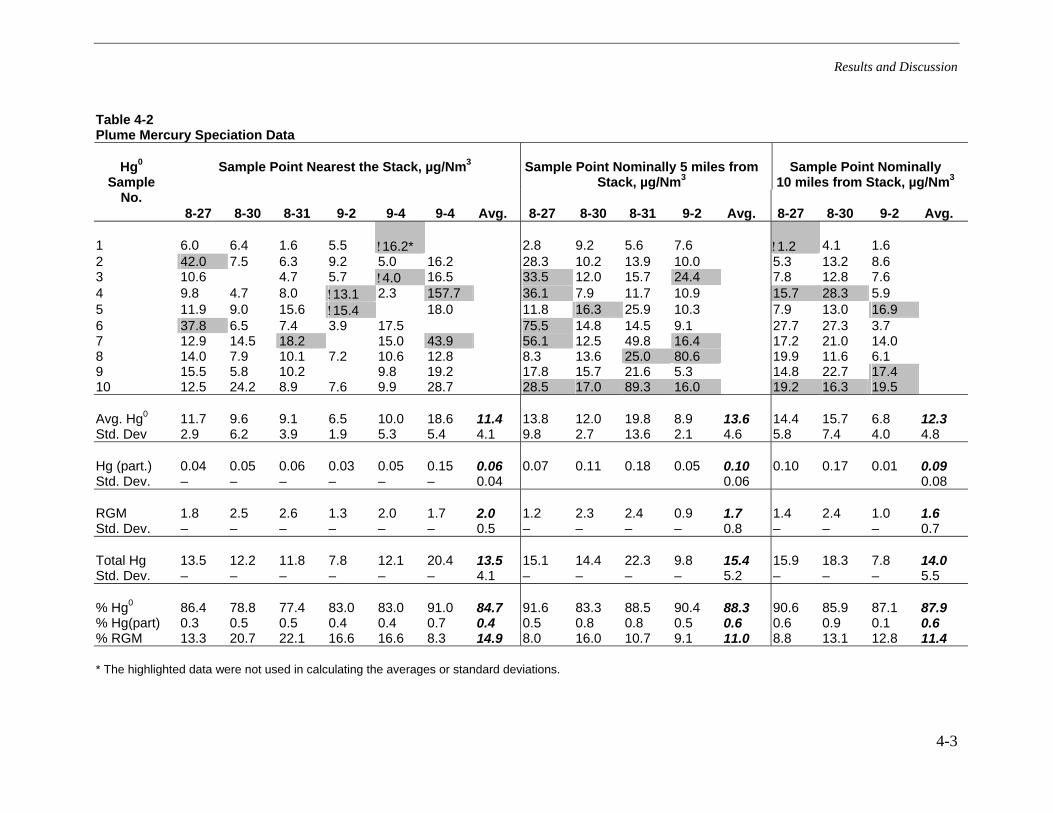
4.2 Plume Results at Pleasant Prairie
A summary of the results from the plume sampling at the Pleasant Prairie Plant are presented in Table 4-2, with the average presented in Table 4-3. The plume Hg concentrations have been converted to equivalent stack concentrations and are presented as such. The complete data set is presented in Appendix A.I, and an explanation of the data reduction procedure is presented in Appendix A.II.
Results and Discussion
4-3
Table 4-2 Plume Mercury Speciation Data
Sample Point Nearest the Stack, µg/Nm3 Sample Point Nominally 5 miles from Stack, µg/Nm3
Sample Point Nominally 10 miles from Stack, µg/Nm3
Hg0 Sample
No. 8-27 8-30 8-31 9-2 9-4 9-4 Avg. 8-27 8-30 8-31 9-2 Avg. 8-27 8-30 9-2 Avg.
1 6.0 6.4 1.6 5.5 !16.2* 2.8 9.2 5.6 7.6 !1.2 4.1 1.6 2 42.0 7.5 6.3 9.2 5.0 16.2 28.3 10.2 13.9 10.0 5.3 13.2 8.6 3 10.6 4.7 5.7 !4.0 16.5 33.5 12.0 15.7 24.4 7.8 12.8 7.6 4 9.8 4.7 8.0 !13.1 2.3 157.7 36.1 7.9 11.7 10.9 15.7 28.3 5.9 5 11.9 9.0 15.6 !15.4 18.0 11.8 16.3 25.9 10.3 7.9 13.0 16.9 6 37.8 6.5 7.4 3.9 17.5 75.5 14.8 14.5 9.1 27.7 27.3 3.7 7 12.9 14.5 18.2 15.0 43.9 56.1 12.5 49.8 16.4 17.2 21.0 14.0 8 14.0 7.9 10.1 7.2 10.6 12.8 8.3 13.6 25.0 80.6 19.9 11.6 6.1 9 15.5 5.8 10.2 9.8 19.2 17.8 15.7 21.6 5.3 14.8 22.7 17.4 10 12.5 24.2 8.9 7.6 9.9 28.7 28.5 17.0 89.3 16.0 19.2 16.3 19.5
Avg. Hg0 11.7 9.6 9.1 6.5 10.0 18.6 11.4 13.8 12.0 19.8 8.9 13.6 14.4 15.7 6.8 12.3 Std. Dev 2.9 6.2 3.9 1.9 5.3 5.4 4.1 9.8 2.7 13.6 2.1 4.6 5.8 7.4 4.0 4.8
Hg (part.) 0.04 0.05 0.06 0.03 0.05 0.15 0.06 0.07 0.11 0.18 0.05 0.10 0.10 0.17 0.01 0.09 Std. Dev. – – – – – – 0.04 0.06 0.08
RGM 1.8 2.5 2.6 1.3 2.0 1.7 2.0 1.2 2.3 2.4 0.9 1.7 1.4 2.4 1.0 1.6 Std. Dev. – – – – – – 0.5 – – – – 0.8 – – – 0.7
Total Hg 13.5 12.2 11.8 7.8 12.1 20.4 13.5 15.1 14.4 22.3 9.8 15.4 15.9 18.3 7.8 14.0 Std. Dev. – – – – – – 4.1 – – – – 5.2 – – – 5.5
% Hg0 86.4 78.8 77.4 83.0 83.0 91.0 84.7 91.6 83.3 88.5 90.4 88.3 90.6 85.9 87.1 87.9 % Hg(part) 0.3 0.5 0.5 0.4 0.4 0.7 0.4 0.5 0.8 0.8 0.5 0.6 0.6 0.9 0.1 0.6 % RGM 13.3 20.7 22.1 16.6 16.6 8.3 14.9 8.0 16.0 10.7 9.1 11.0 8.8 13.1 12.8 11.4
* The highlighted data were not used in calculating the averages or standard deviations.
Results and Discussion
4-4
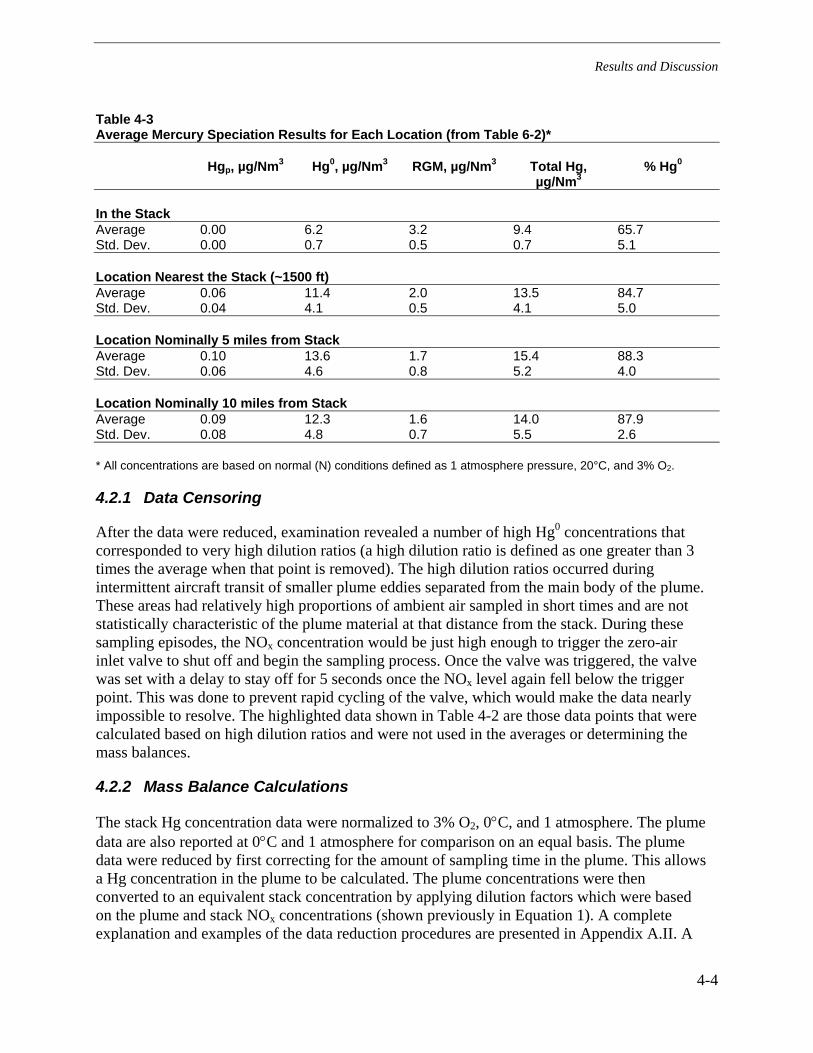
Table 4-3 Average Mercury Speciation Results for Each Location (from Table 6-2)*
Hgp, µg/Nm3 Hg0, µg/Nm3 RGM, µg/Nm3 Total Hg, µg/Nm3
% Hg0
In the Stack Average 0.00 6.2 3.2 9.4 65.7 Std. Dev. 0.00 0.7 0.5 0.7 5.1
Location Nearest the Stack (~1500 ft) Average 0.06 11.4 2.0 13.5 84.7 Std. Dev. 0.04 4.1 0.5 4.1 5.0
Location Nominally 5 miles from Stack Average 0.10 13.6 1.7 15.4 88.3 Std. Dev. 0.06 4.6 0.8 5.2 4.0
Location Nominally 10 miles from Stack Average 0.09 12.3 1.6 14.0 87.9 Std. Dev. 0.08 4.8 0.7 5.5 2.6
* All concentrations are based on normal (N) conditions defined as 1 atmosphere pressure, 20°C, and 3% O2.
4.2.1 Data Censoring
After the data were reduced, examination revealed a number of high Hg0 concentrations that corresponded to very high dilution ratios (a high dilution ratio is defined as one greater than 3 times the average when that point is removed). The high dilution ratios occurred during intermittent aircraft transit of smaller plume eddies separated from the main body of the plume. These areas had relatively high proportions of ambient air sampled in short times and are not statistically characteristic of the plume material at that distance from the stack. During these sampling episodes, the NOx concentration would be just high enough to trigger the zero-air inlet valve to shut off and begin the sampling process. Once the valve was triggered, the valve was set with a delay to stay off for 5 seconds once the NOx level again fell below the trigger point. This was done to prevent rapid cycling of the valve, which would make the data nearly impossible to resolve. The highlighted data shown in Table 4-2 are those data points that were calculated based on high dilution ratios and were not used in the averages or determining the mass balances.
4.2.2 Mass Balance Calculations
The stack Hg concentration data were normalized to 3% O2, 0°C, and 1 atmosphere. The plume data are also reported at 0°C and 1 atmosphere for comparison on an equal basis. The plume data were reduced by first correcting for the amount of sampling time in the plume. This allows a Hg concentration in the plume to be calculated. The plume concentrations were then converted to an equivalent stack concentration by applying dilution factors which were based on the plume and stack NOx concentrations (shown previously in Equation 1). A complete explanation and examples of the data reduction procedures are presented in Appendix A.II. A

Results and Discussion
4-5
mass balance was calculated using the average total Hg data from each sampling point each day and the corresponding stack data. The results are presented in Table 4-4. Although many of the mass balance closures are somewhat high, they are quite reasonable considering the variability of the data and the difficult nature of the sampling. The most likely causes for the high Hg concentration are underreported NOx concentration or Hg offgassing from the soda-lime traps used in the aircraft Hg analyzer when exposed to plume gas. These will be discussed in detail in Section 6.2.3.
Results and Discussion
4-6
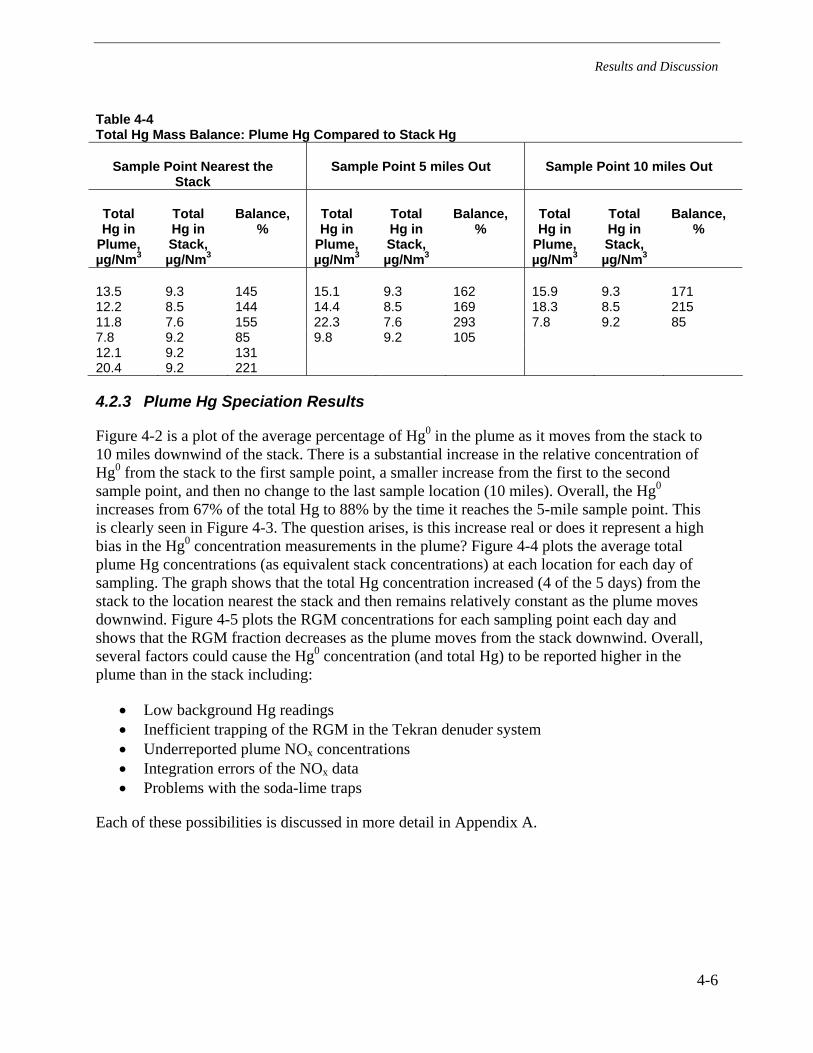
Table 4-4 Total Hg Mass Balance: Plume Hg Compared to Stack Hg
Sample Point Nearest the Stack
Sample Point 5 miles Out Sample Point 10 miles Out
Total Hg in
Plume, µg/Nm3
Total Hg in Stack, µg/Nm3
Balance, %
Total Hg in
Plume, µg/Nm3
Total Hg in Stack, µg/Nm3
Balance, %
Total Hg in
Plume, µg/Nm3
Total Hg in Stack, µg/Nm3
Balance, %
13.5 9.3 145 15.1 9.3 162 15.9 9.3 171 12.2 8.5 144 14.4 8.5 169 18.3 8.5 215 11.8 7.6 155 22.3 7.6 293 7.8 9.2 85 7.8 9.2 85 9.8 9.2 105 12.1 9.2 131 20.4 9.2 221
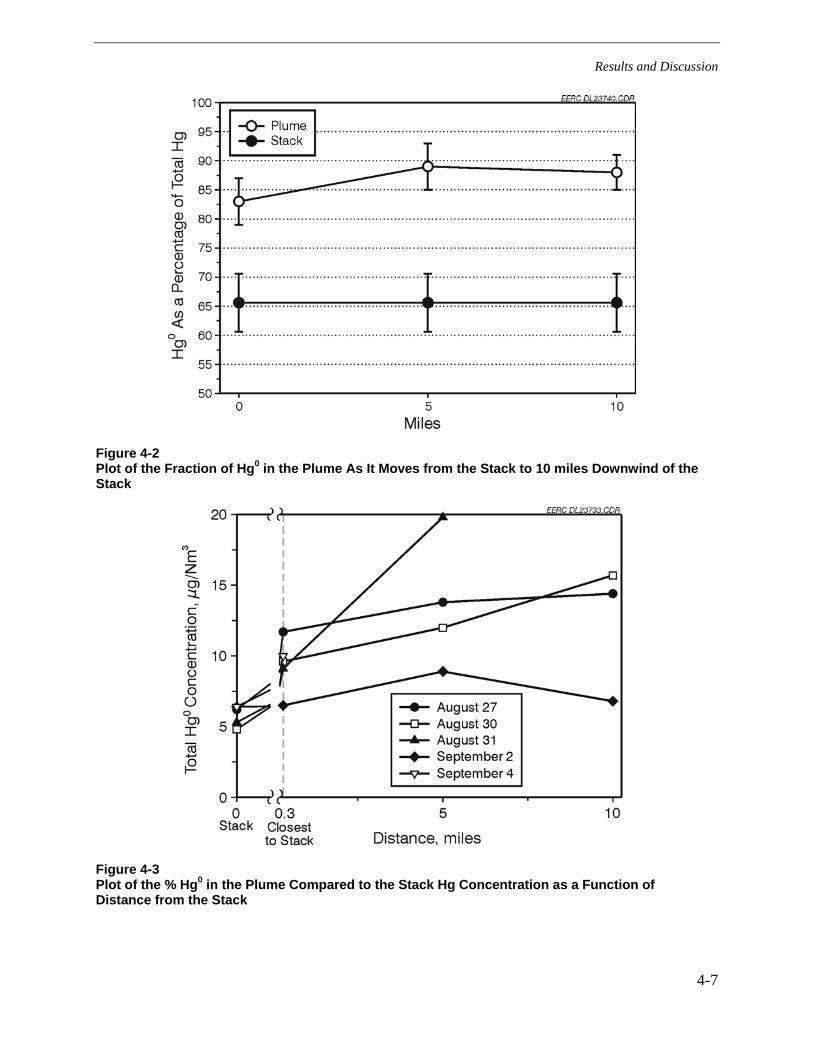
4.2.3 Plume Hg Speciation Results
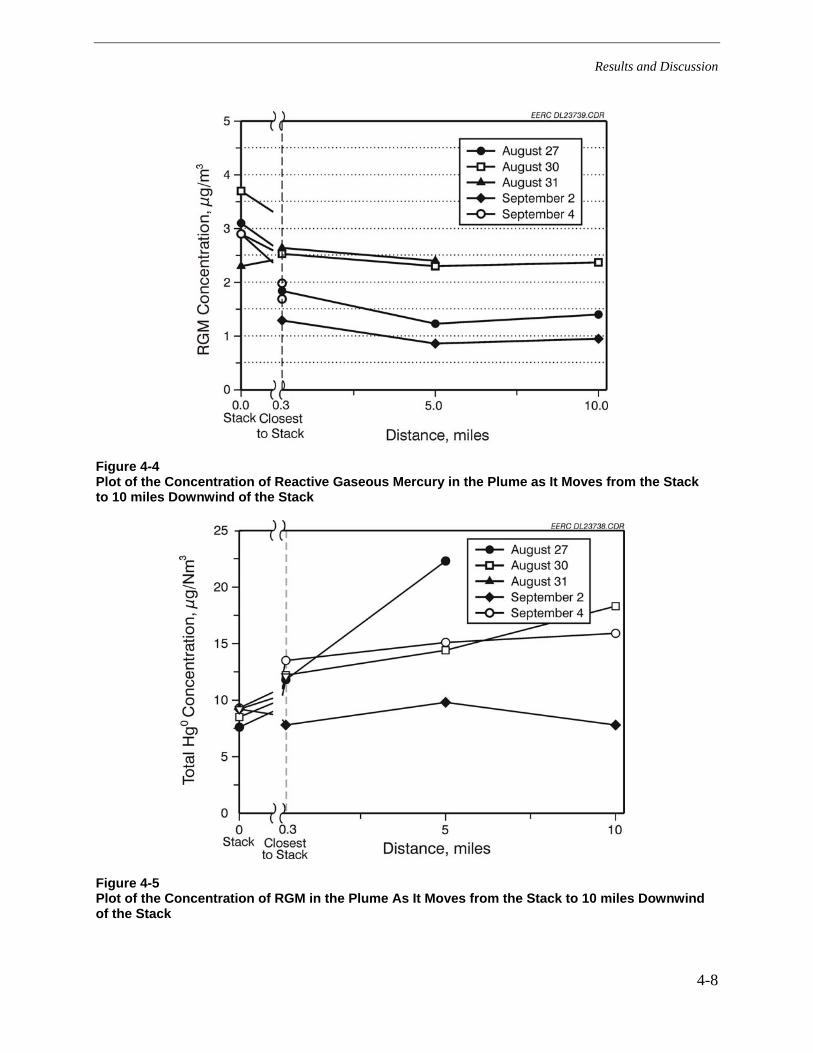
Figure 4-2 is a plot of the average percentage of Hg0 in the plume as it moves from the stack to 10 miles downwind of the stack. There is a substantial increase in the relative concentration of Hg0 from the stack to the first sample point, a smaller increase from the first to the second sample point, and then no change to the last sample location (10 miles). Overall, the Hg0 increases from 67% of the total Hg to 88% by the time it reaches the 5-mile sample point. This is clearly seen in Figure 4-3. The question arises, is this increase real or does it represent a high bias in the Hg0 concentration measurements in the plume? Figure 4-4 plots the average total plume Hg concentrations (as equivalent stack concentrations) at each location for each day of sampling. The graph shows that the total Hg concentration increased (4 of the 5 days) from the stack to the location nearest the stack and then remains relatively constant as the plume moves downwind. Figure 4-5 plots the RGM concentrations for each sampling point each day and shows that the RGM fraction decreases as the plume moves from the stack downwind. Overall, several factors could cause the Hg0 concentration (and total Hg) to be reported higher in the plume than in the stack including:
• Low background Hg readings • Inefficient trapping of the RGM in the Tekran denuder system • Underreported plume NOx concentrations • Integration errors of the NOx data • Problems with the soda-lime traps
Each of these possibilities is discussed in more detail in Appendix A.
Results and Discussion
4-7
Figure 4-2 Plot of the Fraction of Hg0 in the Plume As It Moves from the Stack to 10 miles Downwind of the Stack
Figure 4-3 Plot of the % Hg0 in the Plume Compared to the Stack Hg Concentration as a Function of Distance from the Stack
Results and Discussion
4-8
Figure 4-4 Plot of the Concentration of Reactive Gaseous Mercury in the Plume as It Moves from the Stack to 10 miles Downwind of the Stack
Figure 4-5 Plot of the Concentration of RGM in the Plume As It Moves from the Stack to 10 miles Downwind of the Stack
Results and Discussion
4-9
4.3 Vertical Mercury Profile
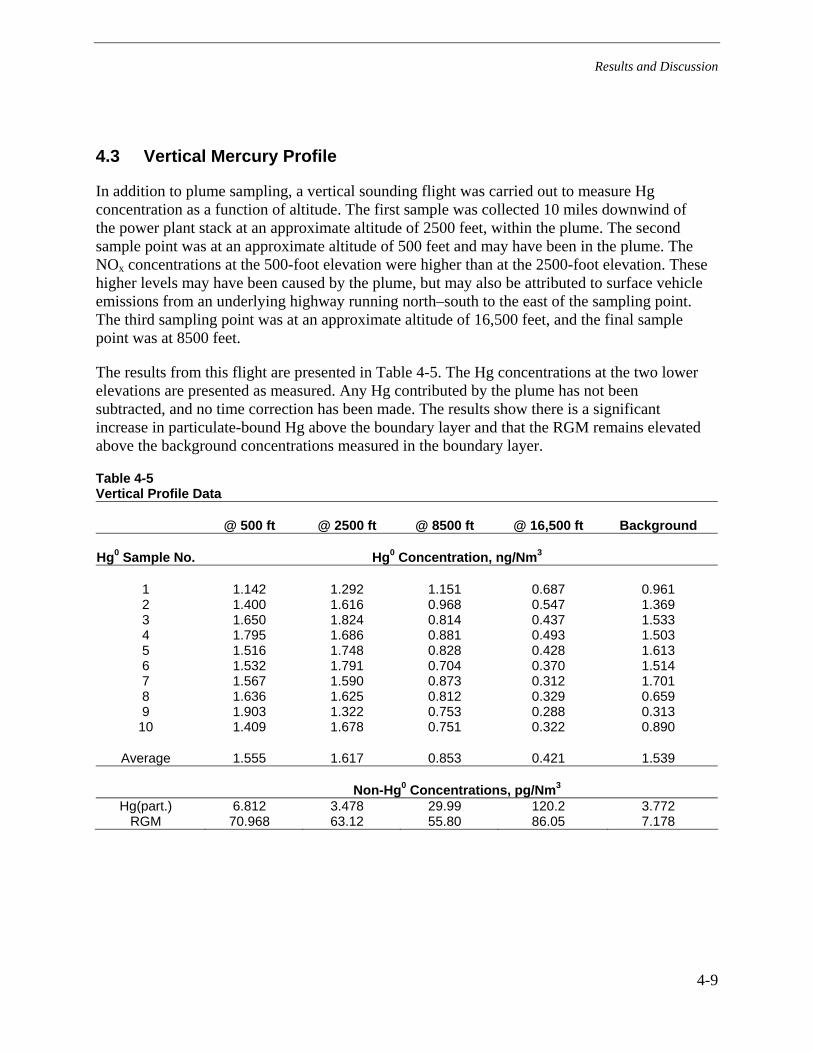
In addition to plume sampling, a vertical sounding flight was carried out to measure Hg concentration as a function of altitude. The first sample was collected 10 miles downwind of the power plant stack at an approximate altitude of 2500 feet, within the plume. The second sample point was at an approximate altitude of 500 feet and may have been in the plume. The NOx concentrations at the 500-foot elevation were higher than at the 2500-foot elevation. These higher levels may have been caused by the plume, but may also be attributed to surface vehicle emissions from an underlying highway running north–south to the east of the sampling point. The third sampling point was at an approximate altitude of 16,500 feet, and the final sample point was at 8500 feet.
The results from this flight are presented in Table 4-5. The Hg concentrations at the two lower elevations are presented as measured. Any Hg contributed by the plume has not been subtracted, and no time correction has been made. The results show there is a significant increase in particulate-bound Hg above the boundary layer and that the RGM remains elevated above the background concentrations measured in the boundary layer.
Table 4-5 Vertical Profile Data
@ 500 ft @ 2500 ft @ 8500 ft @ 16,500 ft Background
Hg0 Sample No. Hg0 Concentration, ng/Nm3
1 1.142 1.292 1.151 0.687 0.961 2 1.400 1.616 0.968 0.547 1.369 3 1.650 1.824 0.814 0.437 1.533 4 1.795 1.686 0.881 0.493 1.503 5 1.516 1.748 0.828 0.428 1.613 6 1.532 1.791 0.704 0.370 1.514 7 1.567 1.590 0.873 0.312 1.701 8 1.636 1.625 0.812 0.329 0.659 9 1.903 1.322 0.753 0.288 0.313
10 1.409 1.678 0.751 0.322 0.890
Average 1.555 1.617 0.853 0.421 1.539
Non-Hg0 Concentrations, pg/Nm3 Hg(part.) 6.812 3.478 29.99 120.2 3.772
RGM 70.968 63.12 55.80 86.05 7.178
Results and Discussion
4-10
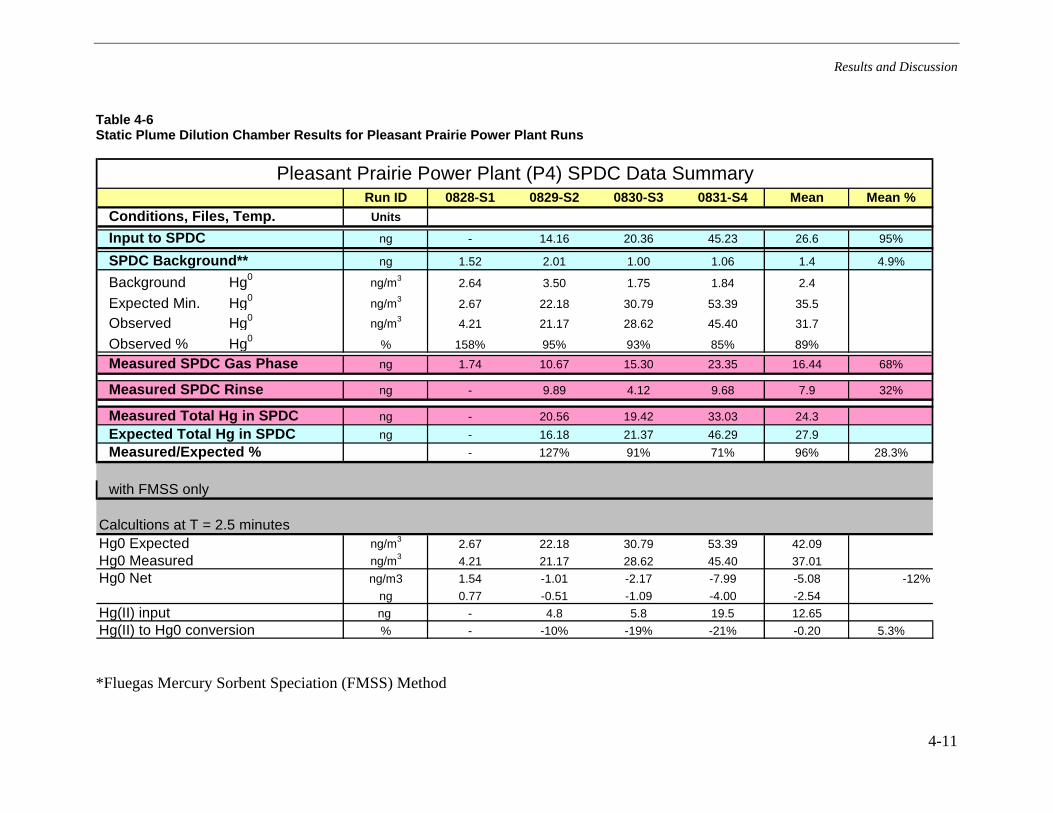
4.4 Static Plume Dilution Chamber Findings
As a supplement to the direct mercury speciation measurements carried out within the plant, at the stack, and aloft by aircraft, the Static Plume Dilution Chamber (SPDC) was run during or nearly in time with the aircraft soundings. The purpose of the SPDC runs during the experiment was to determine whether an alternative, less expensive measurement method could be employed for wider field measurement that would simulate plume chemistry at many power plants. Method testing of the SPDC simulation chamber along with full-scale measurements at a number of operating power plants would, if the method is verified by its replicating full-scale measurements, allow faster and more efficacious determination of plume mercury transformations at a great number of power plants. Such widespread use of an indirect, but replicative, method would allow more rapid closure on potential chemical mechanisms for any redox reactions, as well as allowing development of an iterative or projective computational method for redox rates and products in plumes to be applied to national modeling exercises.
Table 4-6 displays results from the SPDC runs at Pleasant Prairie. As is evident, the SPDC measurements, using both the automated Tekran device and the Fluegas Mercury Sorbent Speciation (FMSS) method, using wet chemistry and sorbent traps, failed to replicate the aircraft measurements of Hg+2 reduction in part to Hg0. Indeed, the SPDC method in this case exhibited a relative loss of Hg0 over time within the dilution chamber. Only Run 2 on 29 August 2003 appeared to show a reduction of the fraction occurring as Hg+2 and a relative increase of Hg0 over the 2.5 minute observation time elapsed from dilution of the intake flue gas by ambient air. Thus, the SPDC was unable to replicate the measured full-scale reduction of divalent to elemental mercury in the Pleasant Prairie plant emissions plume.
Results and Discussion
4-11
Table 4-6 Static Plume Dilution Chamber Results for Pleasant Prairie Power Plant Runs
Run ID 0828-S1 0829-S2 0830-S3 0831-S4 Mean Mean %Units
ng - 14.16 20.36 45.23 26.6 95%
ng 1.52 2.01 1.00 1.06 1.4 4.9%
Background Hg0 ng/m3 2.64 3.50 1.75 1.84 2.4
Expected Min. Hg0 ng/m3 2.67 22.18 30.79 53.39 35.5
Observed Hg0 ng/m3 4.21 21.17 28.62 45.40 31.7
Observed % Hg0 % 158% 95% 93% 85% 89%ng 1.74 10.67 15.30 23.35 16.44 68%
ng - 9.89 4.12 9.68 7.9 32%
ng - 20.56 19.42 33.03 24.3ng - 16.18 21.37 46.29 27.9
- 127% 91% 71% 96% 28.3%
with FMSS only
Hg0 Expected ng/m3 2.67 22.18 30.79 53.39 42.09Hg0 Measured ng/m3 4.21 21.17 28.62 45.40 37.01Hg0 Net ng/m3 1.54 -1.01 -2.17 -7.99 -5.08 -12%
ng 0.77 -0.51 -1.09 -4.00 -2.54Hg(II) input ng - 4.8 5.8 19.5 12.65Hg(II) to Hg0 conversion % - -10% -19% -21% -0.20 5.3%
Measured/Expected %
SPDC Background**
Conditions, Files, Temp.
Calcultions at T = 2.5 minutes
Measured SPDC Rinse
Measured SPDC Gas Phase
Expected Total Hg in SPDC
Pleasant Prairie Power Plant (P4) SPDC Data Summary
Measured Total Hg in SPDC
Input to SPDC
*Fluegas Mercury Sorbent Speciation (FMSS) Method
5-1
5 CONCLUSIONS AND RECOMMENDATIONS
Based on the overall testing program at the Pleasant Prairie Power Plant, the following conclusions can be supported:
• Using a dilution factor based on the plume and stack NOx, a reasonable Hg mass balance can be obtained when the Hg in the stack is compared to the Hg in the plume.
• There appeared to be a chemical reduction in divalent mercury in the Pleasant Prairie Power Plant plume when the RGM in the plume is compared to the RGM in the stack. This reduction is matched by a corresponding increase in the proportion of Hg0. Overall, there was a 44% reduction of RGM from the stack to the first sample point near the effective stack height, and a 66% reduction of RGM from the stack to the 5-mile sample point, with no additional reduction observed between the 5- and 10-mile locations.
Although the results from the ground and aircraft measurements of this test tend to support a reduction in RGM and a corresponding increase in Hg0 in the plume, those results are still not definitive. The SPDC tests failed to show a similar reduction, instead showing an apparent net oxidation in the simulated plume. In addition, although the earlier measurements in this series (at Georgia Power Plant Bowen in 2002) also showed plume mercury reductions, and were matched there by SPDC measurements, additional measurements in a wider range of source and ambient conditions are needed. Also, a reasonable chemical mechanism for such reduction reactions is still lacking. A primary need is for a mechanism to be developed that can explain the results observed in non-heterogeneous (though generally not homogeneous) plume conditions.
In planning future field tests of this type, experimental sites with the following general characteristics should be sought:
• Predicted fraction of emitted mercury occurring at stack exit as Hg+2 is greater than 70%.
• Has a single stack to prevent complications from merged plumes exhausting furnaces or fuel feeds with large differences.
• Does not employee SCR technology (to favor higher concentrations of NOx as a co-tracer for the plume).
• Is relatively isolated from other upwind and near-downwind sources of atmospheric mercury.
References
2
6 REFERENCES
1. Toxicological Effects of Methylmercury. National Academies Press, Washington, D.C., 2000.
2. Lindqvist, O.; Rodhe, H. Atmospheric Mercury—A Review. Tellus 1995, 37B, 136–159.
3. Danilchik, P; Imhoff, R.; Liang, L.; Valente, R.; Dismukes, E.; Brown, C.; Spurling, D.; Huang, Z.; Prestbo, E. A Comparison of the Fate of Mercury in Flues and Plumes of Coal-Fired Boilers. Presented at the Mercury as a Global Pollutant Conference, July 10–14, 1994, Whistler, British Columbia.
4. Imhoff, R.E. Preliminary Report on Measurements of Gas- and Particle-Phase Mercury in the Plumes of Coal-Fired Boilers; Atmospheric Sciences Department, Environmental Research Center, Tennessee Valley Authority, March 15, 1995
5. Prestbo, E.M.; Calhoun, J.A.; Brunette, R.C.; Paladini, M. Hg Speciation in a Simulated Coal Combustion Plume. In Proceedings of Air Quality: Mercury, Trace Elements, and Particulate Matter Conference; McLean, VA, Dec 1–4, 1998.
6. Laudal, D.L; Prestbo, E. Investigation of the Fate of Mercury in a Coal Combustion Plume Using a Static Plume Dilution Chamber; Final Report for U.S. Department of Energy Contract No. DE-FC-26-95FT40321; Energy & Environmental Research Center: Grand Forks, ND, Oct 2001.
7. Edgerton, E.; Hartsell, B.; Jansen, J. Field Observations of Mercury Partitioning in Power Plant Plumes. In Proceedings of the International Conference on Air Quality III: Mercury, Trace Elements, and Particulate Matter; Arlington, VA, Sept 2002
8. Banic, C.M.; Beauchamp, S.T.; Tordon, R.J.; Schroeder, W.H.; Steffen, A.; Anlauf, K.A.; Wong, H.K.T. Vertical Distribution of Gaseous Elemental Mercury in Canada. J. Geophys. Res. 2003, 108 (D9), 4264.