Embed Size (px)
Citation preview

Merging AI and OR to solve high-dimensional stochastic
optimization problems using approximate dynamic programming
Warren B. PowellDepartment of Operations Research and Financial Engineering
Princeton University, Princeton, NJ 08544
September 7, 2008

Abstract
We consider the problem of optimizing over time hundreds or thousands of discrete entities that maybe characterized by relatively complex attributes, in the presence of different forms of uncertainty.Such problems arise in a range of operational settings such as transportation and logistics, where theentities may be aircraft, locomotives, containers or people. These problems can be formulated usingdynamic programming, but encounter the widely cited “curse of dimensionality.” Even deterministicformulations of these problems can produce math programs with millions of rows, far beyond any-thing being solved today. This paper shows how we can combine concepts from artificial intelligenceand operations research to produce practical solution methods that scale to industrial-strength prob-lems. Throughout, we emphasize concepts, techniques and notation from artificial intelligence andoperations research to show how the fields can be brought together for complex stochastic, dynamicproblems.

Consider the problem of training a computer to play a game such as backgammon. The computer
has to recognize the state of the board, evaluate a number of choices and determine which move will
put the player into the best position. The logic has to consider the decisions of the opponent and
the roll of the dice. To determine the best decision, the computer has to compute the value of the
state resulting from the decision.
Now consider the problem of managing a fleet of hundreds or thousands of trucks moving goods
around the country, where a truck moves an entire load from one location to the next. For each
truck, we have to decide what loads to move to maximize profits while achieving other goals such as
minimizing empty miles, obeying work rules (which limit how many hours a driver can move each
day and week) and getting the driver home on time. Before a company assigns a driver to move a
load, it is necessary to think about where the driver will be after moving a load, and the prospects
for the driver in the future.
Both of these problems represent decisions that have to be made over time, where decisions now
need to anticipate the effect on future rewards. Both problems involve forms of uncertainty (the
roll of the dice, the phone calls of customers). The first example is a classic problem addressed
by the artificial intelligence (AI) community, while the second is the type of problem addressed by
the operations research (OR) community. Both problems can be formulated compactly as Markov
decision processes. If we let St be the state of our system at “time” t (for the case of the board
game, t indexes pairs of plays, or the number of plays by a particular player), dt is the decision
(typically represented as action at in the AI community) and let C(St, dt) be the contribution of
making decision dt when in state St, we can find the value of being in state St by using Bellman’s
equation
Vt(St) = maxdt
(C(St, dt) +
∑s′∈S
pt(s′|St, dt)Vt+1(s′)
), (1)
where S is the set of possible states and pt(s′|St, dt) is the probability of going to state s′ if we are
currently in state St and make decision dt. Note that this is the form of Bellman’s equation for
finite-horizon or nonstationary problems. It is popular in both the AI as well as the OR communities
to focus on steady state problems, where Bellman’s equation would be written
V (s) = maxd
(C(s, d) +
∑s′∈S
p(s′|S, d)V (s′)
). (2)
1

This form of Bellman’s equation is more compact and elegant, but it hides the timing of information
which becomes important as we focus on the modeling of complex problems (an issue that seems
more important in operations research). Also, it is easy to convert the time-indexed version in
equation 1 to the steady-state version in (2) (you just drop any time index), but not the other way
around. Finally, even for a stationary problem, we may need a time-dependent formulation if our
policy depends on the initial starting state.
Both the AI and OR communities may start with equation (1), but they have evolved very
different solution strategies for these problems. The reason reflects differences in the nature of
the problems addressed by each community. The AI community often works on problems that
could be described as managing a single, complex entity (such as a backgammon board), while the
OR community is often trying to optimize multiple (sometimes many) entities that are relatively
simple. The AI community will sometimes address multi-entity problems, but often in a multi-agent
framework, where each agent is effectively solving a single-entity problem. The AI community will
measure complexity in terms of the size of the state space, while the OR community will measure
the number of decision variables or the rows (constraints) in a linear program, and the number of
scenarios (random outcomes) in a stochastic program.
The trucking problem, for example, is described by the number of drivers with a particular set
of attributes (such as location), and a set of decisions that covers how to assign a set of drivers to
a set of loads. Consider how the problem looks when viewed as a traditional dynamic program. If
at time t there are Rt trucks looking at Lt loads, then a decision involves a matching of up to Rt
drivers to up to Lt loads. Let x = (xr`)n,` be the decision vector where xr` = 1 if we assign driver r
to load `. A problem with 100 drivers being matched to 100 loads produces a decision vector with
10,000 dimensions (with 100! ≈ 10157 distinct “actions”).
The state space is even larger. Assume each driver is described by a vector a = (a1, . . . , an) of
attributes (such as location, equipment type, driver characteristics). If there are R drivers, each of
which can take up to A attributes, then it is possible to show that the size of the state space for our
trucking problem is
|S| =(R+A− 1A− 1
). (3)
Table 1 illustrates how the state space grows as a function of both the number of trucks we are
managing, and the number of possible attributes each truck can take. We note that real problems
2

can have thousands of trucks (for the very largest companies), with attribute spaces in the millions.
Truck attributesTrucks 10 100 1000
10 9× 10⁴ 4× 10¹³ 3× 10²³
100 4× 10¹² 5× 1058 1× 10144
250 1× 10¹⁶ 1× 1089 1× 10270
Table 1: State space for a fleet management problem: 10, 100 and 250 trucks with 10, 100 and 1000attributes.
The problem of playing the game or managing a single truck driver can be viewed as single entity
problems (in the language of operations research, we might describe our truck driver as a single
resource or asset). Managing a fleet of drivers would be a multiple entity/resource/asset problem
(managing multiple games of backgammon at the same time makes little sense). Clearly, increasing
the number of entities that we are managing increases the complexity of the problem.
A second dimension that affects the difficulty of the problem is the complexity of each entity.
Managing a single truck whose only attribute is location is fairly simple. However, our driver may
have other attributes: How many days has he been away from home? How many hours has he been
awake and driving this day? How many hours did he drive on each of the last seven days? What
type of equipment is he pulling? In realistic problems, a driver might be described by over a dozen
attributes. This makes the problem much harder, and impossible to solve exactly. In other words,
managing a complex driver starts looking like the problem of playing a game such as backgammon
or chess.
For the purposes of our discussion, we categorize our problems along two major dimensions: the
number of entities, and the complexity of the entities being managed. These two dimensions create
four major problem classes as shown in table 2. Single, simple entity problems are the easiest and
can be solved using standard textbook methods for Markov decision processes (see, for example,
Puterman (1994)). The AI community has accumulated a substantial literature on problems that
can be described as a single, complex entity (playing board games, controlling robots). The OR
community has similarly developed a rich set of tools for problems with multiple, simple entities
(managing fleets of vehicles, routing and scheduling problems). The problem of managing multiple,
complex entities under uncertainty (people, machines, transportation equipment) has seen relatively
3

little attention.
AttributesNumber of entities Simple Complex
Single Single, simple emtity Single, complex emtityMultiple Multiple, simple emtities Multiple, complex emtities
Table 2: Major problem classes
In this article, we are going to show how we can bring together the fields of AI (in the form of
machine learning and reinforcement learning) and OR (in the form of math programming) to solve
classes of dynamic programs with 10100 states or more (using the most common measure of size in
dynamic programming), or equivalently, multistage stochastic linear programs with 1010 rows or more
(using the most common measure of size in math programming). The solutions are approximate,
but are supported by a strong theoretical foundation. The point of the presentation is not to present
a specific algorithm for a specific problem, but rather to illustrate how the techniques of AI and
OR can be combined to solve (approximately) problems that would have previously been viewed as
intractable by both communities.
We begin in section 1 by introducing specific notation for modeling single entity and multiple
entity problems. We also introduce a specific candidate application which serves to illustrate the ideas
throughout the remainder of the paper. Section 2 provides different forms of Bellman’s equations,
and introduces the concept of the post-decision state variable which is central to solving large-scale
problems. The remainder of the paper is a tour of the four major problem classes described in table
2. Section 3 points out that if we have a single, simple entity, the problem can be easily solved using
standard techniques from Markov decision processes. Section 4 addresses the problems involving a
single, complex entity that are so often the focus of papers in artificial intelligence. Section 5 turns to
problems involving multiple, simple entities that are typically addressed in operations research. We
note that the OR community does not traditionally view dynamic programming as a starting point
for this problem class. For both of these problems, we use the same foundation of Markov decision
processes that we used for the simplest problems, but introduce different approximation techniques
suited to the problem class. Section 6 combines the techniques from these communities to produce
a practical solution strategy for a problem with multiple, complex entities. We close with section 7
which provides a general set of guidelines for designing strategies for solving a wide range of complex,
stochastic resource allocation problems. This section provides important guidelines for how to adapt
4

the general strategy described in the paper to a much broader set of problems.
1 Modeling dynamic programs
It is common to model dynamic programs using generic notation such as s for a discrete state in a
set S = {1, 2, . . . , s, . . . , |S|}. This is known in the AI community as a flat representation. While
the generality is attractive, this is precisely what makes general dynamic programs impossible to
solve. Far more effective is to use a factored representation (Boutilier et al. (1999), Guestrin et al.
(2003)) where we retain the specific structure of the state variable. The term “flat representation”
is also used in the AI community to distinguish non-hierarchical from hierarchical representations.
Some refer to “unstructured representation” to describe an indexed (flat) state representation, while
“structured” refers to representations which are factored but not necessarily hierarchical.
For our purposes, we need to introduce more specific modeling elements, in particular to allow
us to distinguish modeling single and multiple entities. In section 1.1 we provide the notation for
modeling a single entity, while section 1.2 provides the notation for handling multiple entities. Our
notation represents a compromise between artificial intelligence, Markov decision processes, math
programming and simulation. A major goal of this presentation is to provide a richer notation that
captures the structure of the problem.
We will illustrate the concepts using a number of examples, but we are going to use one particular
example as a unifying theme through the presentation. This example involves the management of
one or more drivers for a trucking company in an industry known as truckload trucking, where a
driver picks up an entire load of freight and moves it to its destination before picking up a new load
(there is no consolidation of shipments on the vehicle). This problem was our original motivating
application and helps to illustrate all four problem classes.
1.1 Modeling a single entity problem
We are going to deal with both simple and complex entities. When we have a simple entity, it is
most natural to represent the states of the entity using
I = the set of potential states of the entity, given by (1, 2, . . . , |I|). We let i and j indexelements of I.
5

If we are making a decision at time t, we might let it be the state of our system (entity). When
we use this notation, we assume that the set I is small enough to enumerate (that is, it might have
thousands or tens of thousands of elements, but probably not millions). In our trucking example, i
would be a city or region, where we might divide the country into 100 or 1,000 locations.
It is common in the AI and Markov decision process communities (see Sutton & Barto (1998) and
Puterman (1994)) to represent a decision as “action a.” This can be thought of as a flat representation
of decisions. We are going to consider problems (in particular, those with multiple entities) where
we are not able to enumerate all the decisions (just as we may not be able to enumerate all the
states). We also wish to distinguish between a type of action (“switch the machine to paint blue,”
“fly to Chicago”) and quantity decisions (“sell 500 cars,” “fly the plane at 200 miles per hour”). We
represent a type of decision using
d = a type of decision that can be used to act on an entity,
D = the set of different decision types that can be used to act on a single entity.
We always assume that the decision set D is small enough to enumerate. For our trucking example,
a decision d might be to move to a location, or to pick up a load (in this case, D would have to
include all possible locations, and all possible loads).
A decision generates a contribution (often designated a reward if maximizing or a cost if mini-
mizing) which we define as
C(i, d) = contribution generated by acting on an entity in state i using decision d ∈ D.
Whenever we represent the state of the system using i ∈ I, we are using a flat representation.
For many applications, it makes more sense to represent the state as a vector. We are going to need
to distinguish between the state of a single entity versus the state of a system with multiple entities.
The OR community often refers to the “attribute” of an entity (or resource) as it evolves over time.
For this reason, we define the state of a single entity as
a = the vector of attributes (these may be categorical, discrete numerical or continuousnumerical)
= (a1, a2, . . . , aI),
A = set of possible values that a may take.
6

For our trucking example, the attribute of a driver might include his location, his home domicile,
the type of equipment he is using, the number of days he has been away from home, and his driving
history (federal law requires that he keep a record of how many hours he drives on each of the last
eight days). The AI community would refer to an element ai of the vector a as a feature of an entity.
The OR community sometimes refers to the attribute vector a as a label, a term that is adapted from
the shortest path algorithms.
If we are solving a single entity problem (e.g. the game of backgammon), then at (the attribute
of our entity at time t) is also the state of our system, where we might use St as our state variable.
Our only reason for introducing new notation for the state of a single entity is our interest in making
the transition to planning multiple entities. We also do not make any structural assumptions about
the specific nature of an attribute vector; all the attributes could be categorical, with no particular
ordering or metric.
Dynamic systems evolve over time. We assume that we are working with a stochastic system in
discrete time (defined as the points in time when we make decisions). We let t = 0 be “here and
now.” It is useful to view information as arriving in continuous time, where time interval t is the
period between points in time t−1 and t. This eliminates any ambiguity surrounding the information
available when we make a decision. We model information using the generic notation
Wt = the exogenous information that arrives to the system during time interval t.
The exogenous information Wt will normally be one or more functions (random variables) describing
new information that arrived between the decision made at time t− 1 and the decision made at time
t. Wt could be the roll of the dice, the play of an opponent, new customer demands, equipment
failures, and so on.
Given the information process, we describe the evolution of our system using the attribute tran-
sition function
at+1 = aM (at, dt,Wt+1). (4)
If we represent the state of the system using the flat representation I, we might define the transition
function using it+1 = iM (it, dt,Wt+1). There are many stochastic problems where the attribute
transition function is deterministic. For example, a truck may drive from i to j (deterministically
7

arriving to j), but where the demands to use the truck once it arrives to j are random, or where
the cost of transportation is random. In these cases, we can simply drop the argument Wt+1 and let
at+1 = aM (at, dt) (or it+1 = iM (it, dt)). For algebraic purposes, it is useful to define the indicator
function
δa′(a, d) =
{1 if decision d ∈ D modifies an entity with attribute a to attribute a′,0 otherwise.
If we use state i ∈ I, we would write δj(i, d).
1.2 Modeling multiple entity problems
When we are modeling multiple entities (or resources), we define
Rti = the number of entities with attribute (state) i at time t,
Rt = (Rti)i∈I .
If we wish to model multiple complex entities, we would use Rta to represent the number of resources
with attribute a at time t. To use our trucking example, we might let Rti be the number of trucks
in city i, but Rta would be the number of drivers with attribute a. We refer to Rt as the resource
state vector (using the vocabulary from operations research where these problems are most common)
since it describes the state of all the resources.
The number of possible values that Rt can take is given by equation (3) which, as we showed
earlier, grows very quickly with both the number of resources and the size of the attribute space that
describes the resources.
We always view d as a decision acting on a single entity. For multiple entities, we represent
decisions using
xtad = the number of entities with attribute a which we act on with a decision of typed ∈ D,
xt = (xtad)a∈A,d∈D.
Whereas d is a type of decision which may be defined using categorical descriptions (move an aircraft
to Chicago, clean the truck, or perform a machine setup), xtad is a numerical value. Furthermore, a
8
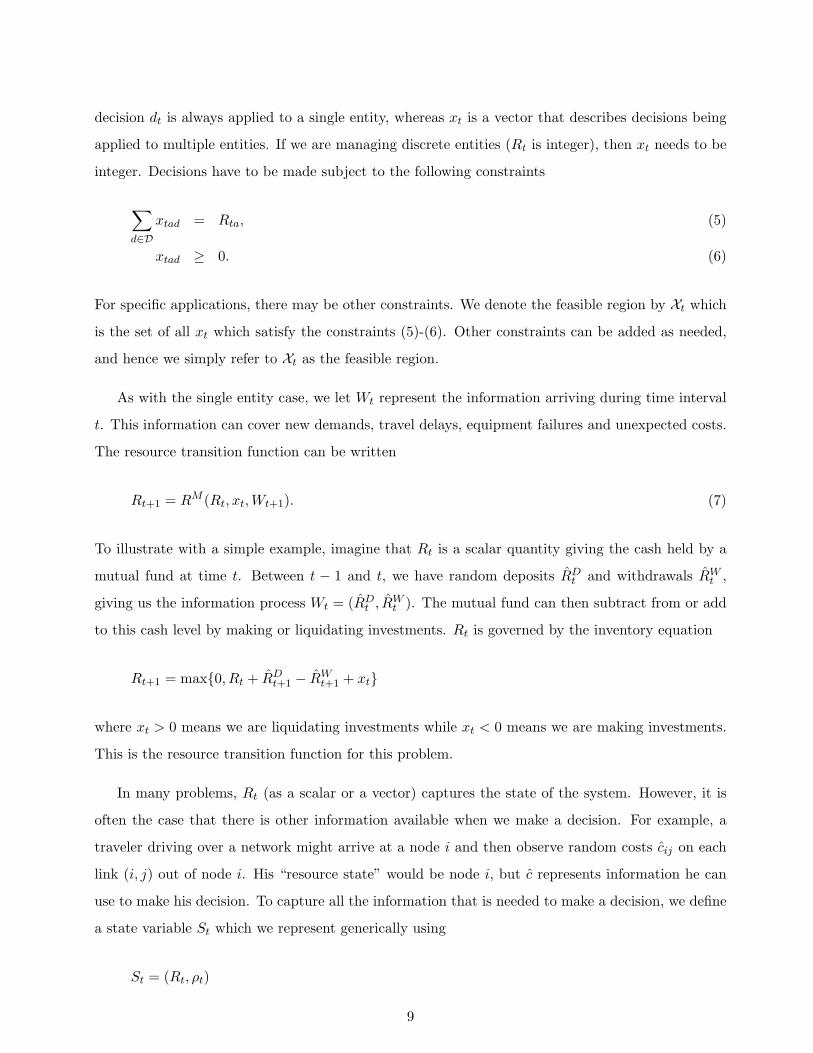
decision dt is always applied to a single entity, whereas xt is a vector that describes decisions being
applied to multiple entities. If we are managing discrete entities (Rt is integer), then xt needs to be
integer. Decisions have to be made subject to the following constraints
∑d∈D
xtad = Rta, (5)
xtad ≥ 0. (6)
For specific applications, there may be other constraints. We denote the feasible region by Xt which
is the set of all xt which satisfy the constraints (5)-(6). Other constraints can be added as needed,
and hence we simply refer to Xt as the feasible region.
As with the single entity case, we let Wt represent the information arriving during time interval
t. This information can cover new demands, travel delays, equipment failures and unexpected costs.
The resource transition function can be written
Rt+1 = RM (Rt, xt,Wt+1). (7)
To illustrate with a simple example, imagine that Rt is a scalar quantity giving the cash held by a
mutual fund at time t. Between t − 1 and t, we have random deposits RDt and withdrawals RWt ,
giving us the information process Wt = (RDt , RWt ). The mutual fund can then subtract from or add
to this cash level by making or liquidating investments. Rt is governed by the inventory equation
Rt+1 = max{0, Rt + RDt+1 − RWt+1 + xt}
where xt > 0 means we are liquidating investments while xt < 0 means we are making investments.
This is the resource transition function for this problem.
In many problems, Rt (as a scalar or a vector) captures the state of the system. However, it is
often the case that there is other information available when we make a decision. For example, a
traveler driving over a network might arrive at a node i and then observe random costs cij on each
link (i, j) out of node i. His “resource state” would be node i, but c represents information he can
use to make his decision. To capture all the information that is needed to make a decision, we define
a state variable St which we represent generically using
St = (Rt, ρt)
9

where Rt is the “resource state” and ρt represents (for the moment) “other information” (such as
c) that is needed to make a decision. ρt is sometimes referred to as the state of the environment.
We assume that we are given a set of equations that describes how St evolves over time, which is
represented using the state transition function
St+1 = SM (St, xt,Wt+1). (8)
In some communities, SM (·) is known as the “plant model” (literally, the model of a physical pro-
duction plant) or “system model” (hence our use of the superscript M), but we feel that “transition
function” is the most descriptive. We use SM (·) to describe the transition function for the full state
vector. Similarly, RM (·) describes the transition function for the vector Rt, while aM (·) represents
the transition function for a single entity with attribute at.
We make decisions using a decision function or policy that defines the action xt we are going to
take given that we are in state St. The decision function is represented using
Xπt (St) = a decision function that returns a feasible vector xt ∈ Xt given the state St,
where Xt is the feasible region for xt. We let Π be our family of policies (decision functions). Our
contribution is given by
C(St, xt) = the contribution returned by making decision xt when we are in state St.
Now our optimization problem can be written
maxπ∈Π
ET∑t=0
γtC(St, Xπt (St)), (9)
where T is the planning horizon and γ is a discount factor. The evolution of St is governed by (8).
1.3 Notation and problem structure
Perhaps one of the biggest challenges when looking at research in another community is understanding
the implicit assumptions being made about problem scale and structure. In our presentation, we
assume that I can be enumerated. The attribute vector a (which describes the state of a single
10

entity) may have several, or several dozen, dimensions, but not thousands (or more). An attribute
may be discrete (categorical or numeric) or continuous (but most of our presentation will assume
it is discrete). As a result, we assume that A cannot be enumerated. We also assume that D is
“not too large” (that is, we can enumerate all the elements in D), but the set X is too large to
enumerate. If we have a single simple entity, we can enumerate I, but if we have multiple simple
entities, Rt = (Rti)i∈I is a vector which (we assume) is too large to enumerate.
2 Solving the problem
Solving equation (9) directly is usually computationally intractable. As a result, a number of com-
putational strategies have evolved, spanning dynamic programming (Puterman (1994)), stochastic
programming (Birge & Louveaux (1997)), stochastic search and control (Spall (2003)), and optimiza-
tion of simulation (Chang et al. (2007)). Our interest is primarily in the line of research devoted to
finding approximate solutions to a dynamic programming model. This research has evolved under
names such as neuro-dynamic programming (Bertsekas & Tsitsiklis (1996), reinforcement learning
(Sutton & Barto (1998)), and approximate dynamic programming (Si et al. (2004), Powell (2007)).
We start with Bellman’s equations in section 2.1, and review the three curses of dimensionality
that plague its solution in section 2.2. We then introduce a powerful concept known as the post-
decision state variable in section 2.3 which sets up an algorithmic strategy that scales to very large
problems.
2.1 Bellman’s equation
The most common representation of Bellman’s equation given in equation (1) when a decision is a
discrete, scalar quantity, but we state it again where the decision is potentially a high-dimensional
vector xt, giving us
Vt(St) = maxxt∈Xt
(C(St, xt) + γ
∑s′∈S
pt(s′|St, xt)Vt+1(s′)
), (10)
where S is our discrete state space, pt(s′|St, xt) is the one-step transition matrix giving the probability
that St+1 = s′ given that we are in state St and take action xt. We refer to equation (10) as the
standard form of Bellman’s equation, since it is so widely used in textbooks on Markov decision
processes (see Bellman (1957), Howard (1971), Puterman (1994)).
11

For a finite horizon problem, the standard way of solving (10) is to assume that we are given
VT+1(ST+1) and then compute Vt(St) from Vt+1(St+1) by stepping backward in time. This strategy
requires finding Vt(St) for all St ∈ S. If St is a scalar, this is usually very easy. But if it is a vector,
we encounter the classic “curse of dimensionality” that is so widely cited as a reason why we cannot
use dynamic programming.
For our purposes, it is useful to adopt an equivalent but slightly different form of Bellman’s
equation. Instead of using the one-step transition matrix, we recognize that this is being used to
compute an expectation, allowing us to write Bellman’s equation as
Vt(St) = maxxt∈Xt
(C(St, xt) + γE{Vt+1(SM (St, xt,Wt+1))|St}
). (11)
We refer to (11) as the expectation form of Bellman’s equation.
2.2 The three curses of dimensionality
Regardless of whether we use the standard form or expectation form of Bellman’s equation, finding
Vt(St) for each (presumably discrete) value of St is computationally intractable when St is a vector
with more than a few dimensions. For problems in operations research, our challenge is actually
much harder. There are, in fact, three curses of dimensionality. The first is the state variable, where
we might have to describe the number of resources (people, equipment, facilities, product) of different
types at a point in time. If we are modeling simple resources such as trucks, we might have a resource
state vector Rt = (Rti)i∈I with a hundred dimensions or more. But if we are modeling more complex
resources such as drivers, Rt = (Rta)a∈A and we obtain a resource vector whose dimensionality is
the size of the attribute space A (we might call this the “curse of curses”).
The second is the expectation, which implies a sum (or integral) over all the dimensions of the
information variable Wt+1. There are applications where Wt+1 refers to the demand in period t or the
price of an asset. But there are many other applications where Wt+1 is a vector. For example, in our
trucking example an element of Wt+1 might be the demand to move freight from location i to location
j of type k. If we have 100 locations and 10 product types, Wt+1 would have 100,000 dimensions.
If the information includes the possibility of equipment failures, then Wt+1 is the number of failures
of equipment with attribute a (Wt+1 might have |A| dimensions). The problem of computing the
expectation is disguised by the standard form of Bellman’s equation, which uses a one-step transition
12

matrix (often viewed as input data). But a one-step transition matrix is itself an expectation. If
1{s′=SM (s,x,W )} is the event that we transition from s to s′ given x and W , then the one-step transition
matrix is given by p(s′|s, x) = E{1s′=SM (s,x,W )}. If W is a vector, computing the expectation can be
computationally intractable.
The third curse of dimensionality is the decision vector xt, which can have dimensionality up to
|A| × |D|. Searching over all possible values of xt ∈ Xt is computationally intractable for problems
with more than a few dimensions. The math programming community might express surprise at this
perspective since problems where xt has thousands of dimensions are considered routine, but if we
use a discrete representation of the value function (a common assumption), then it is not possible to
use major classes of algorithms such as the simplex method to solve the problem.
These “curses” all assume that states, information and actions are discrete, and that we have to
enumerate all possible values. In many (most?) applications, we can exploit structure to avoid a
brute force enumeration. In the remainder of this paper, we build up the tools needed to solve high-
dimensional resource allocation problems by combining the tools of artificial intelligence, approximate
dynamic programming and math programming.
It has been our finding that the most problematic of the “curses” is the expectation. In the next
section, we lay the foundation for circumventing this problem.
2.3 The post-decision state variable
The first step of our development requires formulating Bellman’s equation around the post-decision
state variable. Let St be our traditional state variable measured at time t (alternatively, at the end
of time interval t) just before we make a decision. Let Sxt be the state immediately after we make a
decision. We can write the sequence of states, information and actions using
(S0, x0, Sx0 ,W1, S1, x1, S
x1 , . . . ,Wt, St, xt, S
xt , . . .).
The post-decision state variable is relatively unknown in textbooks on Markov decision processes,
where equation (1) and its variations are completely standard. But it is an idea that seems to
come up in specific settings. Sutton & Barto (1998) refer to it as the after-state variable, as in the
position of a game board after one player has made his move but before his opponent has moved.
Judd (1998) refers to it as the end-of-period state. The concept is standard in modeling of decision
13

trees which uses decision nodes (pre-decision state variables) and outcome nodes (post-decision state
variables) (see Skinner (1999)). We prefer the term “post-decision state” which was first used by
Van Roy et al. (1997), since this emphasizes the property that there is no new information in the
post-decision state (hence it is indexed by time t). For our work, the concept of the post-decision
state is particularly powerful when decisions are vectors and we need the tools of math programming
to solve the one-period optimization problem.
If we model the evolution from St to Sxt to St+1, we might introduce the transition functions
SM,W (·) and SM,x(·) such that
St = SM,W (Sxt−1,Wt), (12)
Sxt = SM,x(St, xt). (13)
We similarly use RM,W (·) and RM,x(·) to represent the transition functions for the resource state
variable Rt, and aM,W (·) and aM,x(·) for the attribute transition function (when talking about a
single entity).
To illustrate using our fleet management application, assume that we wish to act on a truck in
state i with decision d. The indicator function δj(i, d) = 1 if the truck then ends up in state j as a
result of the decision d. The post-decision resource vector would be given by
Rxtj =∑i∈I
∑d∈D
δj(i, d)xtid. (14)
After that, we have random changes in our fleet due to departures (drivers quitting) and additions
(new hires), which we represent using Rt+1,i. The next pre-decision resource state is then
Rt+1,i = Rxti + Rt+1,i. (15)
The pre-decision resource state is Rt along with the state of the environment ρt, which might include
market prices, customer demands, changes in technology and the weather. We might let ρt+1 be
exogenous changes to ρt, which evolves according to ρt+1 = ρt + ρt+1. We might assume that ρt
evolves purely as a result of exogenous changes, which means the pre- and post-decision version of
14

ρt are the same. As a result, we would write
St = (Rt, ρt)
Sxt = (Rxt , ρt).
Now let Vt(St) be the value of being in state St just before we make a decision (as we have done),
and let V xt (Sxt ) be the value of being in state Sxt just after we have made a decision. Vt(St) and
V xt (Sxt ) are related to each other via
Vt(St) = maxxt∈Xt
(C(St, xt) + γV x
t
(SM,x(St, xt)
) ), (16)
V xt (Sxt ) = E
{Vt+1
(SM,W (Sxt ,Wt+1)
)|Sxt}. (17)
We note that in writing (16), the feasible region Xt is a function of the state St. Rather than write
Xt(St), we let the subscript t indicate that the feasible region depends on the information available
at time t (and hence depends on St).
Substituting (17) into (16) gives us the expectation form of Bellman’s equation (11). However,
we are going to work with equations (16) and (17) individually. We are going to use (17) to develop
an approximation of V xt (Sxt ), and then use the fact that (16) is a deterministic problem. If we
design our approximation of V xt (Sxt ) in a suitable way, we can solve (16) using a vast library of
optimization algorithms. For example, if C(St, xt) is linear in xt and if we replace V xt (Sxt ) with a
function that is linear in Sxt (which is also linear in xt), then we can solve the optimization problem
using linear programming. If we require xt to be integer, we can use integer programming or our
favorite metaheuristic (see Blum & Roli (2003) and Glover & Kochenberger (2003) for introductions).
3 A single, simple entity
A nice illustration of our single, simple entity is a truck driver whose state is his current location i ∈ I.
Imagine that when the driver arrives at location i, he learns about a set of demands Dt = (Dtij)i,j∈I
where Dtij is the number of loads going from i to j. The state of our driver is his location i, but the
state of the system is his location and the demands that are available to be moved, Dt. Let Rti = 1
if the driver is in location i. Then Rt captures his physical state, but the complete state variable
is given by St = (Rt, Dt). Rt is effectively a scalar, but Dt is a vector, which means that St is a
15

vector. If we were to try to model this using Bellman’s equation, we would encounter the first curse
of dimensionality.
We can get around this problem by using the post-decision state. Assume that if a demand is not
served at time t, it is lost. If our driver is at i and has accepted to move a load to j, then his post-
decision state is Sxt = Rxt where Rxtj = 1 if he is headed to location j. The number of possible values
of Rxt is equal to the number of locations, which is quite small. So, while it may be computationally
impossible to find the value function Vt(St) around the pre-decision state, it is quite easy to find it
around the post-decision state. Aside from using the concept of the post-decision state, we can solve
the problem exactly using the classical techniques of Markov decision processes (Puterman (1994)).
4 A single, complex entity
There are many “single entity” problems where we need to describe the entity using a vector of
attributes a (normally, we would use “S” to denote the state of our “system”). Assuming the
attributes are discrete, we could associate the index i with a specific attribute vector a and form
a state space I (a classical flat representation). However, when the attribute vector has as few as
five or six elements (depending on the number of outcomes each dimension can take), the attribute
space may be too large to enumerate. In this case, we use a factored representation by retaining the
explicit structure of the attribute vector a.
Given an entity in state a, we can act on the entity using one of a set of decisions d ∈ D (which
generally depends on the state we are in). We let C(a, d) be the contribution earned from this
decision (this may be stochastic, but for our presentation we assume it is deterministic). For a finite
horizon problem defined over t = 0, 1, . . . , T , we can find the optimal policy by solving Bellman’s
equation (1) where the state St = at is the attribute of the entity.
The problem is that we are no longer able to solve this problem for each attribute at. In the
remainder of this section, we describe how approximate dynamic programming can be used to produce
practical solutions to this problem. We note that as a byproduct, we provide an algorithm that easily
handles vectors of information (the second curse of dimensionality), but for the moment, we are going
to assume that we have a relatively small set of decisions D which can be enumerated.
16

4.1 Approximate dynamic programming
Classical dynamic programming works backward in time, where we assume that we have a value
function Vt+1(a′) which allows us to find Vt(a) for each attribute (state) a. When we use approximate
dynamic programming, we can step forward in time, using an approximate value function to make
decisions. Classical treatments of approximate dynamic programming (see, for example, Bertsekas
& Tsitsiklis (1996) and Sutton & Barto (1998)) replace the value function in equation (11) with an
approximation, giving us an optimization problem that looks like
vnt = maxdt∈D
(C(ant , dt) + γE
{V n−1t+1 (aM (ant , dt,Wt+1))|ant
} ). (18)
Here, ant is the current state of our entity at time t in iteration n, and vnt is a sample estimate of
the value of being in state ant . V n−1t+1 (a′) is the value function approximation obtained from iteration
n− 1. We update our estimate of the value of being in state ant using the simple updating formula
V nt (ant ) = (1− αn−1)V n−1
t (ant ) + αn−1vnt , (19)
where αn−1 is a stepsize between 0 and 1. This type of updating assumes that we are using a
lookup-table representation, where we have a value of being in state ant .
There are a number of variations in how states are traversed and updated. After updating a
state ant , we may simply choose another state at random, or we may take the decision dnt that solves
(18), then simulate new information Wt+1 to obtain the next state ant+1, a strategy that is sometimes
referred to as real-time dynamic programming, or RTDP (Barto et al. (1995)). There are also different
ways of updating the value function. Equations (18) and (19) are purely illustrative.
Let dnt be the decision produced by solving (18). We then choose a random observation of
Wt+1. We represent this mathematically by letting ωn denote the sample path, where Wnt+1 =
Wt+1(ωn) is a sample realization of the random variable Wt+1. The next pre-decision state is given
by ant+1 = aM (ant , dnt ,Wt+1(ωn)), which is pure simulation, allowing us to use arbitrarily complex
information processes. But if Wt is vector-valued, we are probably going to have difficulty computing
the expectation in (18) (the second curse of dimensionality).
We overcome the second curse of dimensionality by using equations (16)-(17). Instead of produc-
ing a value function approximation around the pre-decision state ant , it is easier to update the value
17

function around the post-decision state, ax,nt−1. There are several ways to represent a post-decision
state, but it always captures what we know about the state of the system after we make a decision,
before any new information has arrived (see Powell (2007), section 4.4 for a more complete discus-
sion of post-decision state variables). If we are playing backgammon, it would be the state of the
board after we make our move, but before the next roll of the dice. If we are moving a truck from
Dallas to Chicago, it would be the attributes that we forecast the truck will have when it arrives in
Chicago, but before it has left Dallas. The post-decision state can also use an estimate of what might
happen (a forecast), before knowing what actually happens (for example, the expected travel time
from Dallas to Chicago). For our single, complex entity, this means that we replace the updating
equation (19) with
V nt−1(ax,nt−1) = (1− αn−1)V n−1
t−1 (ax,nt−1) + αn−1vnt .
Note that we are using vnt , the value observed when our entity had attribute ant , to update V n−1t−1 (ax,nt−1),
the value around the previous post-decision attribute (or state) ant−1. Equation (20) is a mechanism
for approximating the expectation of the value of being in post-decision state ax,nt−1.
This step means that the optimization problem in (18) is replaced with the deterministic problem
vnt = maxdt∈D
(C(ant , dt) + γV n−1
t (aM,x(ant , dt))). (20)
Thus, we no longer have an expectation, and we still simulate our way from ant to
ant+1 = aM,W (ax,nt ,Wt+1(ωn)), as we did before. This means that the methodology easily handles
complex stochastic processes, but we have not yet solved the problem of small action spaces (we still
assume that the set D is small enough to enumerate). Figure 1 describes the complete algorithm.
Specialists in reinforcement learning will recognize the basic updating step in equation (18) as a
form of temporal-difference learning (see Sutton & Barto (1998) and Bertsekas & Tsitsiklis (1996))
known as “TD(0).” Another popular technique is known as Q-learning (Watkins & Dayan (1992),
Sutton & Barto (1998)) which involves starting with a state-action pair ((a, d) in the notation of this
section), then choosing a random outcome Wnt+1 = Wt+1(ωn) of what might happen in the future,
and estimating a q-factor using
qnt (ant , dnt ) = C(ant , dt) + γmax
d∈DQn−1t (ant , dt),
18

Step 0: Initialization:
Step 0a. Initialize V 0t , t ∈ T .
Step 0b. Set n = 1.
Step 0c. Initialize a10.
Step 1: Choose a sample path ωn.
Step 2: Do for t = 0, 1, . . . , T :
Step 2b: Solve:
vnt = max
dt
(C(an
t , dt) + γV n−1t (aM,x(an
t , dt)))
Let dnt be the best decision, and let ax,n
t = aM,x(ant , d
nt ).
Step 2c: Update the value function:
V nt−1(ax,n
t−1) = (1− αn−1)V n−1t−1 (ax,n
t−1) + αn−1vnt
Step 2d: Compute the new pre-decision state
ant+1 = aM,W (ax,n
t ,Wt+1(ωn)).
Step 3. Increment n. If n ≤ N go to Step 1.
Step 4: Return the value functions (V nt )T
t=1.
Figure 1: An approximate dynamic programming algorithm for a single, complex entity.
which is then smoothed to estimate
Qnt (ant , dnt ) = (1− αn−1)Qn−1
t (ant , dnt ) + αn−1q
nt (ant , d
nt ). (21)
There are similarities between Q-learning and ADP with a post-decision state variable. Q-learning
requires that you learn a value Qt(at, dt) for each action at and decision dt, whereas the method
we have described requires only that we learn the value of being in a specific post-decision state.
Q-learning is often described as a technique for “model-free” dynamic programs, a concept that is
relatively unfamiliar to the OR community. These applications arise when we can observe a state,
but we do not have access to a transition function (the “model”) to predict the state resulting from
an action (this might also happen when we do not have a mathematical model for the information
process). Model-free dynamic programming arises when there is a physical process that is used to
observe the results of decisions.
4.2 Approximation techniques
Approximate dynamic programming gives the appearance of overcoming the challenge of large state
spaces because we do not have to loop over all states. This is somewhat of a myth. In practice,
the computational burden of looping over all states in backward dynamic programming has been
19

replaced with the statistical problem of estimating the value of many states. It is not enough to
know the value of being in states that we actually visit. If we are making good decisions, we have
to have good estimates of the value of states that we might visit. This may be far smaller than the
entire set of states, but it can still be an extremely large number.
There is a vast array of statistical techniques that can be used to approximate the value function
for a single, complexity entity, especially if we are willing to take advantage of the structure of the
attribute vector. In this section, we review two of the most popular strategies. The first uses simple or
mixed aggregation, which makes almost no assumptions about the structure of the attribute vector.
The second uses the concept of “basis functions” which is simply a way of describing statistical
regression models. This strategy requires that we make explicit use of the properties of specific
attributes.
4.2.1 Aggregation
Perhaps the most widely used method for approximating value functions is aggregation. Assume
that we have a family of aggregation functions where
G = the set of indices corresponding to the levels of aggregation,
Gg : A → A(g), g ∈ G,
a(g) = Gg(a), the gth level aggregation of the attribute vector a.
Thus, Gg is an aggregation function that acts on the attribute space A producing a smaller attribute
space A(g). In the AI community, aggregation is a form of state abstraction. The function G could
discretize a numerical attribute, or it might simply ignore an attribute. For example, we could list
attributes a = (a1, a2, . . . , aN ) in decreasing order of importance, and create a series of aggregations
using the attribute vectors
a(0) = (a1, a2, . . . , aN−1, aN ),
a(1) = (a1, a2, . . . , aN−1, -),
a(2) = (a1, a2, . . . , -, -),
and so on. For our trucking application, the attribute vector might be (location, equipment-type,
driver-domicile, days-from-home). We could then create aggregations by ignoring days-from-home,
20

then ignoring driver-domicile, and so on. Also, we could create aggregations on a single attribute
such as location or domicile; instead of using a 5-digit zip, we could use a 3-digit zip.
If we visit state ant at time t during iteration n, the updating equation for an aggregated estimate
would be given by
V(g,n)t (a) =
{(1− αn−1)V (g,n−1)
t (a) + αn−1vnt if G(ant ) = a
V(g,n)t (a(g)) otherwise,
(22)
where V (g,n)t (a) is an estimate of the value of being in aggregated state a(g) = Gg(a). This uses
a traditional form of aggregation where each state is aggregated up to a unique aggregate state.
Another strategy is soft state aggregation (Singh et al. (1995)) where aggregations can be overlapping.
Soft state aggregation can be viewed as a form of nonparametric regression for state spaces which
lack a distance metric (for example, one or more attributes may be categorical).
Aggregation is a widely used method for solving the problem of large state spaces (for a sample
of relevant research, see Rogers et al. (1991)). The limitation is that there is no good answer to
determining the right level of aggregation. The answer depends on how many iterations you can run
your algorithm. In fact, it would be best to change the level of aggregation as the algorithm progresses
(Bertsekas & Castanon (1989), Luus (2000)). A strategy that is more flexible than choosing a single
level of aggregation is to define a family of aggregation functions Gg, g ∈ G. We can then use a
weighted sum of estimates at different levels of aggregation, such as
vna =∑g∈G
w(g)a v(g)
a , (23)
where w(g)a is the weight applied to the estimate of the value of being in state a at the gth level of
aggregation if we are in state a. This model allows us to adjust weights based on how often we visit
a state. Using our trucking application, we will have few observations of drivers in less-populated
states such as Montana as opposed to denser states such as Illinois. But it does mean that we have a
lot of weights to compute. In fact, when the attribute space is large, we will often find that we have
no observations for many attributes at the most disaggregate level, but we always have something
at the more aggregate levels.
There are different strategies for estimating the weights w(g)a . A simple method that has proven
very effective in this context is to use weights that are proportional to the variance of v(g)a (see
21
George et al. (to appear) or Powell (2007), chapter 6). The field of machine learning offers a range of
techniques for choosing the relevant attributes and levels of aggregation (Hastie et al. (2001) contains
a nice overview of these methods).
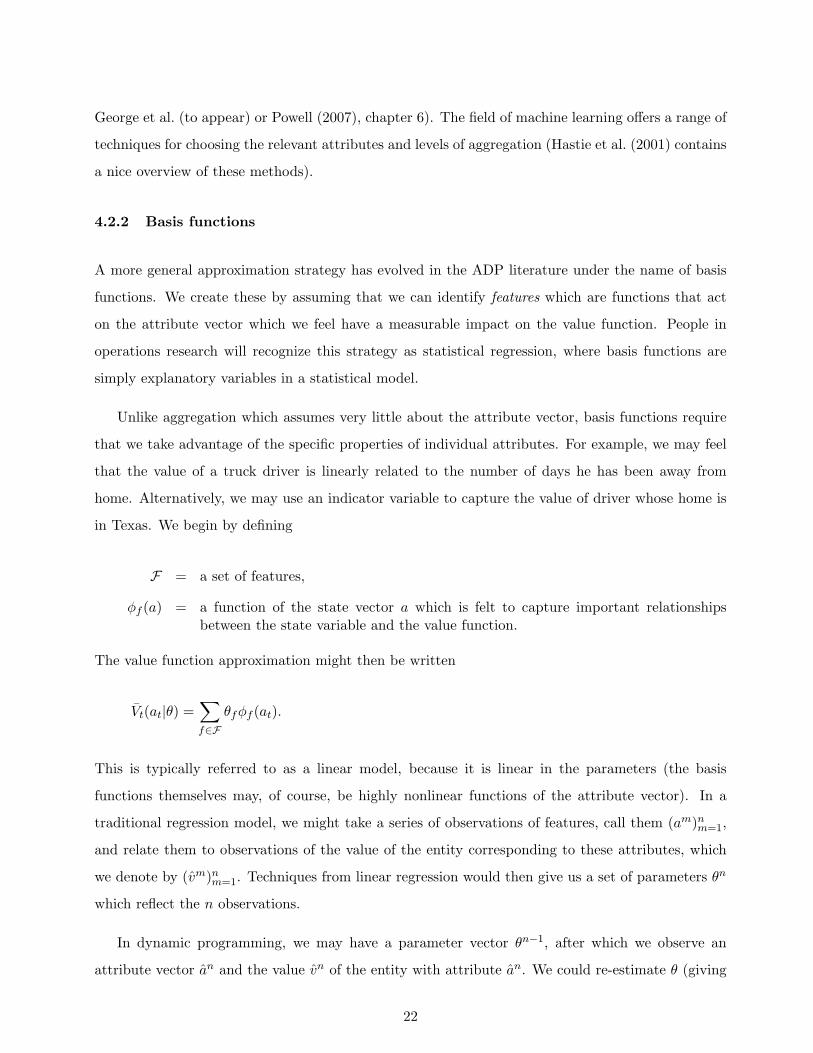
4.2.2 Basis functions
A more general approximation strategy has evolved in the ADP literature under the name of basis
functions. We create these by assuming that we can identify features which are functions that act
on the attribute vector which we feel have a measurable impact on the value function. People in
operations research will recognize this strategy as statistical regression, where basis functions are
simply explanatory variables in a statistical model.
Unlike aggregation which assumes very little about the attribute vector, basis functions require
that we take advantage of the specific properties of individual attributes. For example, we may feel
that the value of a truck driver is linearly related to the number of days he has been away from
home. Alternatively, we may use an indicator variable to capture the value of driver whose home is
in Texas. We begin by defining
F = a set of features,
φf (a) = a function of the state vector a which is felt to capture important relationshipsbetween the state variable and the value function.
The value function approximation might then be written
Vt(at|θ) =∑f∈F
θfφf (at).
This is typically referred to as a linear model, because it is linear in the parameters (the basis
functions themselves may, of course, be highly nonlinear functions of the attribute vector). In a
traditional regression model, we might take a series of observations of features, call them (am)nm=1,
and relate them to observations of the value of the entity corresponding to these attributes, which
we denote by (vm)nm=1. Techniques from linear regression would then give us a set of parameters θn
which reflect the n observations.
In dynamic programming, we may have a parameter vector θn−1, after which we observe an
attribute vector an and the value vn of the entity with attribute an. We could re-estimate θ (giving
22

us θn), but it is much better to do this recursively. There are several techniques for doing this, but
one of the simplest is a stochastic gradient algorithm, given by
θn = θn−1 − αn−1
(V (an|θn−1)− vn(an)
)∇θVt(an|θn−1)
= θn−1 − αn−1
(V (an|θn−1)− vn(an)
)
φ1(an)φ2(an)
...φF (an)
. (24)
This method requires that we start with an initial estimate θ0 before we have any observations. We
then get an updated estimate after each observation. The stepsize αn−1 determines how much weight
we put on the most recent observation.
Basis functions, and stochastic gradient algorithms for fitting the parameters, are widely used
in the approximate dynamic programming literature (Tsitsiklis & Van Roy (1996), Tsitsiklis & Van
Roy (1997), Van Roy et al. (1997), Van Roy (2001)). A major strength of this strategy is that it
allows us to exploit structure in the attribute vector. However, this also means that we have to
identify functions that recognize this structure, a potential problem if the attributes are not well
defined (or if we do not fully understand how they interact with each other).
5 Multiple entities, simple attributes
We now make the transition to handling multiple entities, where there are different types of entities.
We assume that the number of different types of entities is not too large. A nice illustration is
managing blood inventories where blood is characterized by one of eight blood types, and age (0
to five weeks), giving us a total of 48 usable “blood attributes” (blood type plus age). For our
trucking example, we would be modeling the inventories of trucks around the country (rather than
the availability of drivers). For this class of applications, we have all three curses of dimensionality:
the state variable (e.g. the 48 blood attributes), the information process (16 dimensions, covering
eight dimensions of blood donations and eight dimensions for blood demands), and the decision
variables (over 200 dimensions to describe all the different types of allowable blood uses).
We can model a problem with multiple, simple entities using the same notation we introduced in
section 1.2, but where we would use the index i instead of the attribute vector a. Thus, the resource
state vector would be Rt = (Rti)i∈I , where Rti is the number of resources in state i.
23

We can use the same basic algorithm that we described in figure 1, with a few changes. Instead
of state at, we use Rt. Instead of choosing a decision dt ∈ D, we are going to choose a vector xt ∈ Xt
(the third curse of dimensionality). We solve this problem by using the tools of math programming.
For our illustration, we will need to solve the decision problem using a linear programming package.
This in turn means that we cannot use a look-up table representation for our value function. Instead,
we need to use a functional approximation that retains the structure of our decision problem as a
linear program.
Following the approximation strategy we introduced in section 4.1, we start in state Rnt (at time
t in iteration n) and then solve the optimization problem using
Xπ(Rnt ) = arg maxxt∈Xn
t
(C(Rnt , xt) + γV n−1
t (Rxt ))
(25)
where Rxt = RM,x(Rnt , xt) is a deterministic function that depends on xt. Note that we avoid the
need to deal with an expectation imbedded within the optimization problem. We face our first
application where xt is a vector, with possibly thousands of dimensions. If we were just using a
myopic policy (Vt(Rxt ) = 0), the problem would be a straightforward mathematical program, where
handling decision functions with thousands of dimensions is routine. Not surprisingly, we want to
design a value function approximation that allows us to take advantage of this structure.
The two simplest strategies that can be used for approximating the value function are linear (in
the resource state), which is written
Vt(Rxt ) =∑j∈I
vtjRxtj , (26)
and nonlinear but separable, given by
Vt(Rxt ) =∑j∈I
Vtj(Rxtj). (27)
The approximation Vtj(Rxtj) can be piecewise linear, or a continuously differentiable nonlinear func-
tion. If it is linear or piecewise linear, then equation (25) can be solved as a linear program. Figure 2
illustrates the linear program when we use a separable, piecewise-linear approximation. This linear
programs scales to large, industrial applications, where I might have thousands of elements (such as
locations).
24

Value function approximation
64748
,1tR
,2tR
,3tR
,4tR
Known demands⎫⎬⎭
Figure 2: Illustration of decision problem using separable, piecewise-linear value function approxi-mation.
We illustrate the process of updating the value function using a linear value function approxima-
tion. In this case, equation (25) becomes
xnt = arg maxxt∈Xn
t
∑i∈I
∑d∈D
ctidxtid + γ∑j∈I
vn−1tj Rxtj
. (28)
Using equation (14) and a little algebra takes us to
xnt = arg maxxt∈Xn
t
{∑i∈I
∑d∈D
(ctid + γvn−1t,iMj (i,d)
)xtid
}. (29)
This is a linear program which can be solved for very large scale problems.
Once we know that we can solve the decision problem, we next face the challenge of updating
the value function approximation. In section 4, we updated the value function approximation using
an estimate vnt of the value of being in a state ant . Now, we are going to use derivatives to update
slopes of the value function approximation, rather than using the value of being in a state. This is a
fairly common strategy in the control theory community, where approximate dynamic programming
25

is often called “heuristic dynamic programming,” while the use of derivatives is known as “dual
heuristic dynamic programming” (see Werbos (1990) and Ferrari & Stengel (2004)).
Obtaining slopes is relatively easy when we note that solving (29) as a linear program subject to
the constraints in (5)-(6) produces dual variables for the flow conservation constraints (5). Let vnti
represent the dual variable for each of these constraints i ∈ I, obtained in the nth iteration of the
algorithm. We emphasize that it is important that we are able to obtain an estimate of the slope
for each element of Rt, since this will no longer be the case when we make the final step to handling
multiple, complex entities. If we were managing a single entity, obtaining vnti for all i ∈ I is the same
as getting an updated estimate of the value of being in each state at each iteration (also known as
synchronous dynamic programming).
The ability to use slopes is particularly effective in the context of solving optimization problems
involving multiple entities. First, it is generally the case that we need estimates of the slopes of the
value function instead of the value function itself (adding a constant does not change the solution).
Second, instead of obtaining a single observation vnt of the value of being in state Snt , we obtain
a vector of slopes, one for each i ∈ I. If the set I has hundreds or thousands of elements, then
at each iteration, instead of getting a single update, we get hundreds or thousands of pieces of
new information which dramatically improves the overall rate of convergence. The idea of using
derivatives was first introduced by Werbos (1990) in the control-theory literature under the name
“dual heuristic dynamic programming,” but it has been used throughout the stochastic programming
literature (see Higle & Sen (1996) and Birge & Louveaux (1997) for reviews).
Once we obtain the gradients vnti, our value function approximation is updated using
vnt−1,i = (1− αn)vn−1t−1,i + αnv
nti.
Note that vnti, which contains information that becomes known in time period t, is used to update
vn−1t−1,i, which is an approximation of an expectation which only contains information up through time
t− 1.
Linear value function approximations work well when we are primarily interested in making sure
we use the right type of resource. For example, Simao et al. (2008) describes a problem where we
have to decide which driver should move a load to New York. The important issue is not how many
drivers are in New York, but whether we should have a driver in New York whose home is Texas
26

or California. In other words, we want the right type of driver. Piecewise-linear value function
approximations allow us to capture the declining marginal value of additional resources, and are
therefore more useful when we are trying to decide how many resources.
If separability is too strong of an approximation, a powerful technique is to use Bender’s decom-
position (see Higle & Sen (1991), Birge & Louveaux (1997), or Powell (2007), chapter 11). At time
t, iteration n we would solve a problem with the form
maxxt,z
C(St, xt) + z (30)
subject to xt ∈ Xt and
z ≤ (αnt (v))Txt + βnt (v) ∀ v ∈ Vnt . (31)
Equation (31) represents a series of cuts that approximates the value function. The set Vnt refers to
a set of vertices (or cuts) which are generated as the algorithm progresses. The coefficients αnt (v)
and βnt (v) are computed by solving the linear program at time t+ 1 and using the dual to infer the
coefficients. This method will produce optimal solutions (in the limit), although convergence can
become slow as the dimensionality of the resource state vector increases (see Powell et al. (2004)).
Another strategy is to use a regression model (basis functions), where we might specify a value
function approximation of the form
Vt(Rt) = θt0 +∑i∈I
θ1iRti +∑i∈I
θ2iR2ti.
For the determined reader, Klabjan & Adelman (2007) describes how to use ridge regression to
produce a novel class of approximation strategies.
5.1 Discussion
This section has demonstrated that approximate dynamic programming can be used to solve (ap-
proximately) certain classes of resource allocation problems that are much larger than would have
been achievable using classical approximate dynamic programming techniques. These methods have
been demonstrated on problems where the number of dimensions of the state vector Rt is in the
thousands. But this work does assume that there is a dual variable vnti for each dimension i ∈ I of
27

Rt. While this is certainly a breakthrough, we are interested in even larger problems. In the next
section, we show how we return to the fundamentals of approximate dynamic programming to solve
these very large scale problems.
6 Multiple, complex assets
There are many applications where we have to manage multiple, complex entities. These may be
people, aircraft, or complex equipment (e.g. power generators). Return to our notation where at is a
vector of attributes describing an entity. Let Rta be the number of entities with this attribute. If we
manage a single, complex entity with attribute at, where at might have several dozen dimensions, we
have seen that we are in the domain of artificial intelligence problems where the state space A is too
large to enumerate, requiring us to use approximation methods. When we have multiple entities, we
have a state variable where the number of dimensions is comparable to the size of the state space of
a large dynamic program.
While this problem may seem intractably complex, we already have the tools we need to solve it
(approximately). We have already seen in section 5 that we can obtain high quality solutions if we
use value function approximations that are linear in Rta or nonlinear but separable in Rta. The major
limitation of this approach is that we assumed that we could measure the dual variable vta (or obtain
a gradient) for each type of entity of type a (we used type i in section 5). When our space of entities
is not too large (ten thousand is a reasonable upper limit), this is a good assumption. But with as
few as three or four attributes, the attribute space A can grows exponentially. As with the types
of dynamic programs considered in the AI community, the state space of a single entity can easily
reach numbers such as 1010 or more. For all practical purposes, the vector Rt is infinite-dimensional.
If our value function approximation is linear in the resource state (equation (26)), we can approx-
imate the marginal value of a unit of resource with attribute a using the approximation methods of
section 4.2.1, where
vnta =∑g∈G
w(g,n)a v
(g,n)ta . (32)
This approximation can then be used just as we did in the simple entity case. If we repeat the
28
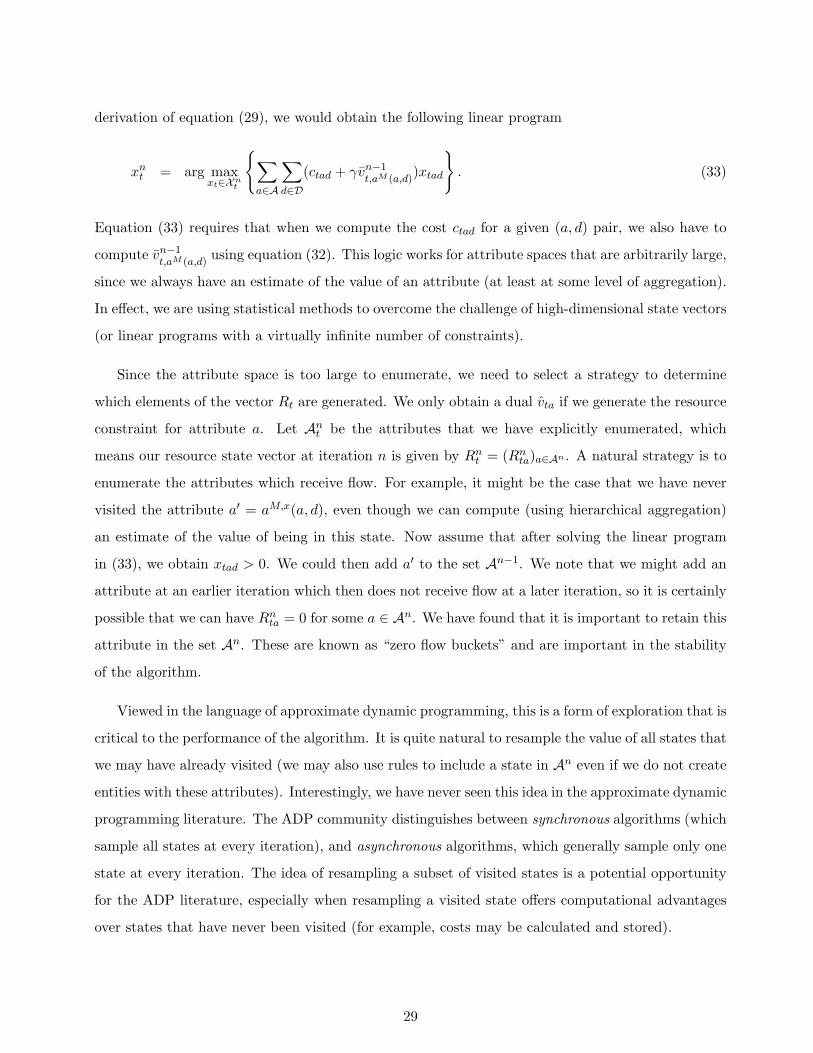
derivation of equation (29), we would obtain the following linear program
xnt = arg maxxt∈Xn
t
{∑a∈A
∑d∈D
(ctad + γvn−1t,aM (a,d)
)xtad
}. (33)
Equation (33) requires that when we compute the cost ctad for a given (a, d) pair, we also have to
compute vn−1t,aM (a,d)
using equation (32). This logic works for attribute spaces that are arbitrarily large,
since we always have an estimate of the value of an attribute (at least at some level of aggregation).
In effect, we are using statistical methods to overcome the challenge of high-dimensional state vectors
(or linear programs with a virtually infinite number of constraints).
Since the attribute space is too large to enumerate, we need to select a strategy to determine
which elements of the vector Rt are generated. We only obtain a dual vta if we generate the resource
constraint for attribute a. Let Ant be the attributes that we have explicitly enumerated, which
means our resource state vector at iteration n is given by Rnt = (Rnta)a∈An . A natural strategy is to
enumerate the attributes which receive flow. For example, it might be the case that we have never
visited the attribute a′ = aM,x(a, d), even though we can compute (using hierarchical aggregation)
an estimate of the value of being in this state. Now assume that after solving the linear program
in (33), we obtain xtad > 0. We could then add a′ to the set An−1. We note that we might add an
attribute at an earlier iteration which then does not receive flow at a later iteration, so it is certainly
possible that we can have Rnta = 0 for some a ∈ An. We have found that it is important to retain this
attribute in the set An. These are known as “zero flow buckets” and are important in the stability
of the algorithm.
Viewed in the language of approximate dynamic programming, this is a form of exploration that is
critical to the performance of the algorithm. It is quite natural to resample the value of all states that
we may have already visited (we may also use rules to include a state in An even if we do not create
entities with these attributes). Interestingly, we have never seen this idea in the approximate dynamic
programming literature. The ADP community distinguishes between synchronous algorithms (which
sample all states at every iteration), and asynchronous algorithms, which generally sample only one
state at every iteration. The idea of resampling a subset of visited states is a potential opportunity
for the ADP literature, especially when resampling a visited state offers computational advantages
over states that have never been visited (for example, costs may be calculated and stored).
29

7 More complex problems
This presentation has demonstrated how approximate dynamic programming, combined with math
programming (linear and integer) can be used to solve extremely large-scale problems (approxi-
mately), producing solutions that are much more than mere simulations of complex, dynamic prob-
lems. The techniques of approximate dynamic programming allow us to approximate linear programs
with effectively an infinite number of rows (in one time period), with only linear growth in run times
for multiple time periods. The resulting formulations are much smaller and easier to solve than
deterministic models that encompass the entire planning horizon.
There is a vast range of more complex problems that fall under the umbrella of “dynamic resource
management,” spanning such difficult problems as R & D portfolio optimization (Beaujon et al.
(2001)), stochastic multicommodity flow problems (Topaloglu & Powell (2006)), stochastic machine
scheduling (Pinedo (1995)), and dynamic vehicle routing (Ichoua et al. (2005), and Adelman (2004)).
However, as of this writing the use of ADP for these more difficult problems has to be viewed in its
infancy.
Approximate dynamic programming offers the potential of breaking down very hard combinatorial
problems into sequences of much easier ones. The challenge is obtaining solutions of high quality
(and proving this). This strategy can be followed on a broad range of problems by following four
simple steps.
First, imagine that you are solving the problem myopically (for example, assigning machines to
serve the tasks you know about, or routing a vehicle to pick up customers that have already called in).
Now design an algorithm for this problem. You may feel that you can solve the problem optimally,
especially since these problems tend to be much smaller than problems where everything is known.
However, you may need to use your favorite heuristic (local search, tabu search, genetic algorithms),
as illustrated in Gendreau et al. (1999). Your choice of algorithm will determine how you have to
approximate your value function.
Second, you have to identify a value function approximation that you feel captures the important
behaviors of your problem, but which does not complicate unnecessarily your algorithmic strategy
for the myopic problem. If you are using a heuristic search algorithm, you can live with almost any
functional approximation. However, if you are solving it optimally, your approximation may have
to have special structure. If your decision problem requires the use of a linear, nonlinear or integer
30

programming package, you have to choose your value function approximation accordingly.
Third, you need to design an updating strategy to improve your approximation. In our motivating
application, we could use dual variables or finite differences to capture the value of an entity with
a particular type of attribute. For more complex combinatoric problems, even approximating the
incremental value of an entity may be quite hard (and unreliable). For example, our heuristic may
produce routes for a fleet of vehicles. From this solution, we can estimate the cost (or contribution)
of each vehicle by following its route. However, this is not the same as estimating the change that
would happen if we did not have that particular vehicle (in other words, a derivative). An open
research question would be to estimate the error from approximating the value of a vehicle by using
the cost of the path that it follows instead of using the marginal value (which involves dropping the
vehicle from the solution and reoptimizing).
Finally, you need to develop a method for testing your approximation. For some problems, it is
possible to obtain optimal or near-optimal solutions for deterministic versions of the problem which
serve as useful metrics. In most cases, you are just hoping to obtain solutions that are better than
your myopic approximation (which ignores the impact of decisions now on the future).
We believe that this simple strategy can be applied to a vast range of dynamic resource man-
agement problems. Developing an effective approximate dynamic programming algorithm, which
includes finding a value function approximation that is computationally tractable, proposing an up-
dating strategy and showing that the value function produces higher quality solutions than a simple
myopic model, represents a significant (and potentially patentable) contribution.
Acknowledgements
This research was supported in part by grant AFOSR-F49620-93-1-0098 from the Air Force Office
of Scientific Research.
References
Adelman, D. (2004), ‘A price-directed approach to stochastic inventory/routing’, Operations Research52(4), 499–514.
Barto, A. G., Bradtke, S. J. & Singh, S. P. (1995), ‘Learning to act using real-time dynamic pro-gramming’, Artificial Intelligence, Special Volume on Computational Research on Interaction andAgency 72, 81–138.
31

Beaujon, G. J., Marin, S. & McDonald, G. (2001), ‘Balancing and optimizing a portfolio of R & Dprojects’, Naval Research Logistics 48(1), 18–40.
Bellman, R. (1957), Dynamic Programming, Princeton University Press, Princeton.
Bertsekas, D. & Castanon, D. (1989), ‘Adaptive aggregation methods for infinite horizon dynamicprogramming’, IEEE Transactions on Automatic Control 34(6), 589–598.
Bertsekas, D. & Tsitsiklis, J. (1996), Neuro-Dynamic Programming, Athena Scientific, Belmont, MA.
Birge, J. & Louveaux, F. (1997), Introduction to Stochastic Programming, Springer-Verlag, NewYork.
Blum, C. & Roli, A. (2003), ‘Metaheuristics in Combinatorial Optimization: Overview and Concep-tual Comparison’, ACM Computing Surveys 35(3), 268–308.
Boutilier, C., Dean, T. & Hanks, S. (1999), ‘Decision-theoretic planning: Structural assumptionsand computational leverage’, Journal of Artificial Intelligence Research 11, 1–94.
Chang, H., Fu, M., Hu, J. & Marcus, S. (2007), Simulation-Based Algorithms for Markov DecisionProcesses, Springer, Berlin.
Ferrari, S. & Stengel, R. F. (2004), Model-based adaptive critic designs, in J. Si, A. G. Barto, W. B.Powell & D. Wunsch, eds, ‘Handbook of Learning and Approximate Dynamic Programming’, IEEEPress, New York.
Gendreau, M., Guertin, F., Potvin, J. & Taillard, E. (1999), ‘Parallel tabu search for real-time vehiclerouting and dispatching’, Transportation Science 33, 381–390.
George, A., Powell, W. B. & Kulkarni, S. (to appear), ‘Value function approximation using hierar-chical aggregation for multi-attribute resource management’, J. Machine Learning Research.
Glover, F. & Kochenberger, G. (2003), Handbook of Metaheuristics, Springer.
Guestrin, C., Koller, D. & Parr, R. (2003), ‘Efficient solution algorithms for factored MDPs’, Journalof Artificial Intelligence Research 19, 399–468.
Hastie, T., Tibshirani, R. & Friedman, J. (2001), The Elements of Statistical Learning, Springerseries in Statistics, New York, NY.
Higle, J. & Sen, S. (1991), ‘Stochastic decomposition: An algorithm for two-stage linear programswith recourse’, Mathematics of Operations Research 16(3), 650–669.
Higle, J. L. & Sen, S. (1996), Stochastic Decomposition: A Statistical Method for Large Scale Stochas-tic Linear Programming, Kluwer Academic Publishers.
Howard, R. (1971), Dynamic Probabilistic Systems, Volume II: Semimarkov and Decision Processes,John Wiley and Sons, New York.
Ichoua, S., Gendreau, M. & Potvin, J.-Y. (2005), ‘Exploiting knowledge about future demands forreal-time vehicle dispatching’, Transportation Science 40(2), 211–225.
Judd, K. (1998), Numerical Methods in Economics, MIT Press.
Klabjan, D. & Adelman, D. (2007), ‘An infinite-dimensional linear programming algorithm for de-terministic semi-Markov decision processes on Borel spaces’, Mathematics of Operations Research32(3), 528–550.
Luus, R. (2000), Iterative Dynamic Programming, Chapman & Hall/CRC, New York.
Pinedo, M. (1995), Scheduling: Theory, Algorithms, and Systems, Prentice Hall, Englewood Cliffs,NJ.
32

Powell, W. B. (2007), Approximate Dynamic Programming: Solving the curses of dimensionality,John Wiley and Sons, New York.
Powell, W. B., Ruszczynski, A. & Topaloglu, H. (2004), ‘Learning algorithms for separable approxi-mations of stochastic optimization problems’, Mathematics of Operations Research 29(4), 814–836.
Puterman, M. L. (1994), Markov Decision Processes, John Wiley & Sons, New York.
Rogers, D., Plante, R., Wong, R. & Evans, J. (1991), ‘Aggregation and disaggregation techniquesand methodology in optimization’, Operations Research 39(4), 553–582.
Si, J., Barto, A. G., Powell, W. B. & Wunsch, D., eds (2004), Handbook of Learning and ApproximateDynamic Programming, IEEE Press, New York.
Simao, H. P., Day, J., George, A. P., Gifford, T., Nienow, J. & Powell, W. B. (2008), ‘An ap-proximate dynamic programming algorithm for large-scale fleet management: A case application’,Transportation Science.
Singh, S., Jaakkola, T. & Jordan, M. I. (1995), Reinforcement learning with soft state aggregation, inG. Tesauro, D. Touretzky & T. K. Leen, eds, ‘Advances in Neural Information Processing Systems7’, MIT Press, Cambridge, MA.
Skinner, D. C. (1999), Introduction to Decision Analysis, Probabilistic Publishing, Gainesville, Fl.
Spall, J. C. (2003), Introduction to Stochastic Search and Optimization: Estimation, Simulation andControl, John Wiley & Sons, Hoboken, NJ.
Sutton, R. & Barto, A. (1998), Reinforcement Learning, The MIT Press, Cambridge, Massachusetts.
Topaloglu, H. & Powell, W. B. (2006), ‘Dynamic programming approximations for stochastic, time-staged integer multicommodity flow problems’, Informs Journal on Computing 18(1), 31–42.
Tsitsiklis, J. & Van Roy, B. (1997), ‘An analysis of temporal-difference learning with function ap-proximation’, IEEE Transactions on Automatic Control 42, 674–690.
Tsitsiklis, J. N. & Van Roy, B. (1996), ‘Feature-based methods for large scale dynamic programming’,Machine Learning 22, 59–94.
Van Roy, B. (2001), Neuro-dynamic programming: Overview and recent trends, in E. Feinberg &A. Shwartz, eds, ‘Handbook of Markov Decision Processes: Methods and Applications’, Kluwer,Boston.
Van Roy, B., Bertsekas, D. P., Lee, Y. & Tsitsiklis, J. N. (1997), A neuro-dynamic programmingapproach to retailer inventory management, in ‘Proceedings of the IEEE Conference on Decisionand Control’, Vol. 4, pp. 4052–4057.
Watkins, C. & Dayan, P. (1992), ‘Q-learning’, Machine Learning 8, 279–292.
Werbos, P. (1990), A menu of designs for reinforcement learning over time, in R. S. W.T. Miller &P. Werbos, eds, ‘Neural Networks for Control’, MIT PRess, Cambridge, MA, pp. 67–96.
33