Embed Size (px)
Citation preview

Better energy future
MERIDIAN ENERGY LIMITED 2015 Annual results roadshow presentation

Disclaimer The information in this presentation was prepared by Meridian Energy with due care and attention. However, the information is supplied in summary form and is therefore not necessarily complete, and no representation is made as to the accuracy, completeness or reliability of the information. In addition, neither the company nor any of its directors, employees, shareholders nor any other person shall have liability whatsoever to any person for any loss (including, without limitation, arising from any fault or negligence) arising from this presentation or any information supplied in connection with it.
This presentation may contain forward-looking statements and projections. These reflect Meridian’s current expectations, based on what it thinks are reasonable assumptions. Meridian gives no warranty or representation as to its future financial performance or any future matter. Except as required by law or NZX or ASX listing rules, Meridian is not obliged to update this presentation after its release, even if things change materially.
This presentation does not constitute financial advice. Further, this presentation is not and should not be construed as an offer to sell or a solicitation of an offer to buy Meridian Energy securities and may not be relied upon in connection with any purchase of Meridian Energy securities.
This presentation contains a number of non-GAAP financial measures, including Energy Margin, EBITDAF, Underlying NPAT and gearing. Because they are not defined by GAAP or IFRS, Meridian's calculation of these measures may differ from similarly titled measures presented by other companies and they should not be considered in isolation from, or construed as an alternative to, other financial measures determined in accordance with GAAP. Although Meridian believes they provide useful information in measuring the financial performance and condition of Meridian's business, readers are cautioned not to place undue reliance on these non-GAAP financial measures.
The information contained in this presentation should be considered in conjunction with the condensed interim financial statements, which are included in Meridian’s annual report for the year ended 30 June 2015 and is available at:
http://www.meridianenergy.co.nz/investors/
All currency amounts are in New Zealand dollars unless stated otherwise.
2
SEPTEMBER 2015
MERIDIAN ENERGY LIMITED 2015 Annual results roadshow presentation

Meridian and the New Zealand market
MERIDIAN ENERGY LIMITED 2015 Annual results roadshow presentation

About Meridian
4
SEPTEMBER 2015
MERIDIAN ENERGY LIMITED 2015 Annual results roadshow presentation
Vertically integrated renewable generator, retailing electricity to over 330,000 customers in New Zealand and Australia
New Zealand’s largest generator from purely renewable sources
Seven hydro stations
Flexible plant with New Zealand’s largest storage
Long life assets with low operating cost
Benchmark operational efficiency and low capital needs
Seven wind farms
More than a decade of construction and operational experience
Unsubsidised in NZ with high capacity factors

The New Zealand electricity market
5
5
SEPTEMBER 2015
MERIDIAN ENERGY LIMITED 2015 Annual results roadshow presentation
Major
generators 1 Transmission
grid operator 29 Distribution
businesses 26 Electricity retail
brands 2 Million
consumers

2015 highlights
MERIDIAN ENERGY LIMITED 2015 Annual results roadshow presentation

Profitability and yield
7
And delivering to investors
Great financial result
Free cash flow1
$398m
+6% on FY2014, +8% on PFI2
EBITDAF $618m
+6% on FY2014, +5% on PFI
Underlying NPAT
$209m
+7% on FY2014, +17% on PFI
NPAT $247m
+7% on FY2014, +17% on PFI
Ordinary dividend 12.88cps
+17% on FY2014, +12% on PFI
Special dividend 2.91cps
From asset sales and one-offs
Capital manage-
ment
2.44cps special dividend ($62.5m)
and +71% since listing
TSR +36%
1See pg 32 for a definition and breakdown of free cash flow 2Prospective financial information contained in Meridian’s prospectus
SEPTEMBER 2015
MERIDIAN ENERGY LIMITED 2015 Annual results roadshow presentation

The last year More rational political views on the sector
Transmission pricing progressed
NZAS immediate future is clearer
NZ demand has grown
Announcement of thermal plant retirement
Review to the Renewable Energy Target completed
Powershop Australia gaining momentum
8
SEPTEMBER 2015
MERIDIAN ENERGY LIMITED 2015 Annual results roadshow presentation

Operational highlights A year of average inflows
The now familiar late summer dry spell was well managed
Rapid resolution of Manapōuri transformer issues
Wind investment has driven record level of NZ generation (Tekapo adjusted)
Retail sales volume growth with a strong irrigation season
Resilient retail prices despite intense competition and summer irrigation pricing
Lid on operating costs, some growth supporting Powershop and new wind
Ranked as the most reputable electricity company in NZ
9
SEPTEMBER 2015
MERIDIAN ENERGY LIMITED 2015 Annual results roadshow presentation

Health and safety Preparing for changes to health and safety legislation later this year
That work has re-evaluated high areas of risk and the processes to manage those risks
Particular emphasis on management of fatal risks
Cultural focus has been on moving to accountability and fairness in safety reporting
LTI frequency rate of 2.27, below industry average of 4.85
10
0
2
4
6
8
10
12
14
16
2011 2012 2013 2014 2015
INCI
DEN
TS P
ER M
ILLI
ON
HO
URS
Financial Year ended 30 June
EMPLOYEE TRIFR1
1Total recordable injury frequency rate – the number of incidents per million hours worked by permanent employees
SEPTEMBER 2015
MERIDIAN ENERGY LIMITED 2015 Annual results roadshow presentation

25,000
30,000
35,000
40,000
45,000
2011 2012 2013 2014 2015
GWh
Financial Year ended 30 June
NATIONAL DEMAND The New Zealand market Positive demand growth returned in the last year, but caution needed
Provincial led, with some weather driven growth but genuine underlying increase
Significant thermal plant closure is occurring and requires strategic thought by all market participants
New investment signals may be moving closer
High retail competition
Offers focused on sign-on pricing and use of prompt payment discounts
Emerging differentiation and growing number of smaller retailers
Multiple regulatory reforms underway focused on competition and reliability
11
+2.8% -0.6% -1.9% -0.5% year on
year change
source: Transpower, Meridian
SEPTEMBER 2015
MERIDIAN ENERGY LIMITED 2015 Annual results roadshow presentation

250
255
260
265
270
275
2012 2013 2014 2015
TWh
Financial Year ended 30 June
NEM ELECTRICITY CONSUMPTION The Australian market Declining demand at the market level
RET1 agreed but mixed political sentiment on renewables
A lot of permitted wind options, but nearly all are short dated
Appetite for conventional PPAs2 is low
Grid scale solar continues to get cheaper
Increased penetration of rooftop solar, even without subsidy
Consolidation among smaller retailers is a continuing pattern
12
0.0% -2.6%
-2.3%
source: Bloomberg
1Renewable energy target 2Power purchasing agreements – contracts for the sale and purchase of electricity between parties
SEPTEMBER 2015
MERIDIAN ENERGY LIMITED 2015 Annual results roadshow presentation

Tiwai Point smelter contract Contract terms (other than price) similar to those previously agreed
Price on 400MW unchanged from 2013 variation, higher price on 172MW from 1 January 2017
Window to give 12 months notice to reduce to 400MW extended to 1 April 2016, then any time after 30 April 2017
Other generators provided back to back cover of varying quantity and tenure
13
3 Aug 2015 30 Apr 2016 1 Jan 2017 30 Apr 2017 31 Dec 2030
Termination right (12 months notice)
Price (+CPI): 2013 price on 400MW 2013 price on 172MW 2015 price on 172MW
Reduction to 400MW (12 months notice)
SEPTEMBER 2015
MERIDIAN ENERGY LIMITED 2015 Annual results roadshow presentation
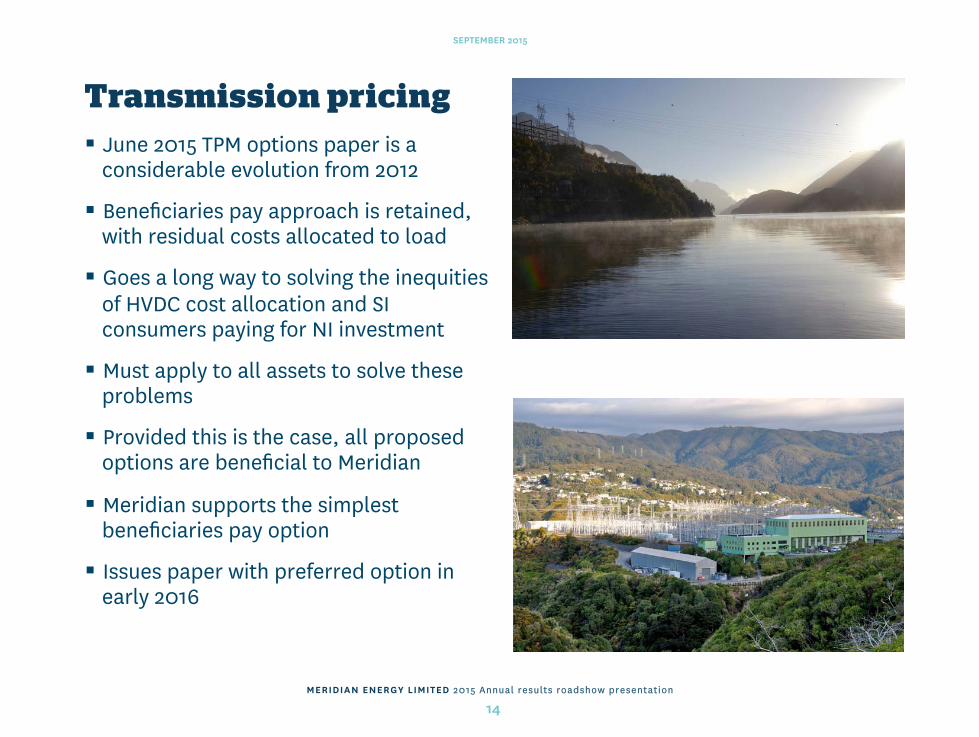
Transmission pricing June 2015 TPM options paper is a considerable evolution from 2012
Beneficiaries pay approach is retained, with residual costs allocated to load
Goes a long way to solving the inequities of HVDC cost allocation and SI consumers paying for NI investment
Must apply to all assets to solve these problems
Provided this is the case, all proposed options are beneficial to Meridian
Meridian supports the simplest beneficiaries pay option
Issues paper with preferred option in early 2016
14
SEPTEMBER 2015
MERIDIAN ENERGY LIMITED 2015 Annual results roadshow presentation

Meridian Retail Segment EBITDAF up +$3m (+17%) adjusted for the sale of Arc Innovations
A year of operational improvement:
Lift in customer retention rate
$3m less bad debts written off with 44% less disconnections
70% reduction in vacant site consumption
20% decrease in call centre volumes
And pricing improvements:
Historical anomalies resolved
Solar export rates reset
Inflation based price changes for some networks from July 2015
15
SEPTEMBER 2015
MERIDIAN ENERGY LIMITED 2015 Annual results roadshow presentation

Powershop New Zealand Customer satisfaction above 90% for 7 years in a row
Industrialisation of processes for ease of use at scale
Which supports growth in Australia and potential new market opportunities
Maintaining market share on low marketing spend
Lifting load through a much improved business customer experience
16
SEPTEMBER 2015
MERIDIAN ENERGY LIMITED 2015 Annual results roadshow presentation

Powershop Australia Viable business with strong sources of competitive advantage:
Customer control
Renewable profile
Fair pricing
Differentiated service
Promotional spend needed to support customer acquisition
Brand position has allowed us to establish unique channels to market that support sustainable growth
Competitors are improving their service offers and we need to remain agile
17
13,426
21,775
28,353
35,138
48,208
0
20,000
40,000
60,000
Jun-14 Sep-14 Dec-14 Mar-15 Jun-15
FRMP POWERSHOP AUSTRALIA CUSTOMERS
SEPTEMBER 2015
MERIDIAN ENERGY LIMITED 2015 Annual results roadshow presentation

Concluding remarks Over the next year, NZ focus will be on: Positioning for upcoming thermal contraction Lifting retail profitability Improving quality and cost effectiveness of customer experience Achieving more from existing assets Operating and capital cost management Support for transmission pricing change
Growth in Australia through Powershop
Decision on the viability of offshore Powershop opportunities
Not providing forecasts, enhancing monthly operating disclosure
18
SEPTEMBER 2015
MERIDIAN ENERGY LIMITED 2015 Annual results roadshow presentation

2015 financial performance
MERIDIAN ENERGY LIMITED 2015 Annual results roadshow presentation

954
123
238
618
247 209
440
147
467
924
129
237
585
230 195
433
316 334
0
200
400
600
800
1,000
1,200
$M FINANCIAL PERFORMANCE AGAINST PRIOR YEAR
12 months to 30 June 2015 12 months to 30 June 2014
Financial performance
20
Energy Margin
+3%
+$30m
Trans- mission
-5% -$6m
Operating Costs
+0% +$1m
EBITDAF
+6%
+$33m
NPAT
+7%
+$17m
Underlying NPAT
+7%
+$14m
Operating Cash Flow
+2% +$7m
Investment Expenditure
-53%
-$169m
Dividend Declared
+40%
+$133m
SEPTEMBER 2015
MERIDIAN ENERGY LIMITED 2015 Annual results roadshow presentation

11.01 12.88
2.00
5.35
0
5
10
15
20
2014 actual 2015 actual
CPS DIVIDENDS DECLARED
Ordinary dividends Special dividends Dividends Ordinary final dividend of 8.08 cps, 55% imputed
Brings full year FY2015 ordinary dividend to 12.88 cps, representing 83% of free cash flow, 72% imputed
Special final dividend of 3.95 cps, unimputed
Special final dividend comprises:
2.44 cps capital management
1.51 cps from gains on sale and a tax liability release
Brings full year FY2015 special dividend to 5.35 cps, 26% imputed
21
83% FCF payout
FY 2015 DIVIDENDS DECLARED AMOUNT CPS
IMPUTATION %
Interim Ordinary Dividend 4.80 100%
Interim Special Dividend 1.40 100%
Final Ordinary Dividend 8.08 55%
Final Special Dividend 3.95 0%
Total Dividend 18.23
75% FCF payout
SEPTEMBER 2015
MERIDIAN ENERGY LIMITED 2015 Annual results roadshow presentation

950 763
916 924 954
0
200
400
600
800
1,000
1,200
2011 2012 2013 2014 2015
$M
Financial Year ended 30 June
ENERGY MARGIN1
Earnings ‘Like for like’ EBITDAF (excluding insurance proceeds and IPO costs) increase of $20m (3%) in FY2015 from:
+ Additional generation from Mill Creek in NZ and Mt Mercer in Australia
+ Higher residential/SME sales volumes in both countries
- Higher market purchase and customer costs to support this volume
+ Higher sell-side CFD volumes and lower acquired generation, off the back of higher NZ generation
+ Lower HVDC charges in the calendar year to March 2015
- Lower other revenue following sale of Arc and surplus farm land
22
+3%
660 477
585 585 618
0
200
400
600
800
2011 2012 2013 2014 2015
$M
Financial Year ended 30 June
EBITDAF2
+6%
1See pg 27 for a definition of energy margin 2Earnings before interest, taxation, depreciation, amortisation, changes in fair value of financial instruments, impairments and gain/(loss) on sale of assets
Results for the year ended 30 June 2011 include the Tekapo power stations, which were sold to Genesis Energy in June 2011 SEPTEMBER 2015
MERIDIAN ENERGY LIMITED 2015 Annual results roadshow presentation

266
543
309 415
85 0
100
200
300
400
500
600
2011 2012 2013 2014 2015
$M
Financial Year ended 30 June
CAPITAL ASSET ADDITIONS
Costs
23
+3%
-80%
Results for the year ended 30 June 2011 include the Tekapo power stations, which were sold to Genesis Energy in June 2011
86 88 91
94 79 80
49 44 39
14 18 28
238 227 246 237 238
0
50
100
150
200
250
300
2011 2012 2013 2014 2015
$M
Financial Year ended 30 June
OPERATING COSTS Retail segment Wholesale Corporate/Elims International IPO Costs
Adjusting for IPO costs, Operating costs have increased +$9m (+4%) in FY2015
Mt Mercer and Powershop customer service costs have lifted international costs $10m
Mill Creek costs are largely being absorbed
Further improvement from continued focus on corporate costs
Some metering cost growth from Arc sale, expected to reduce
Some development resource growth in Powershop NZ
Stay in business capital expenditure was $61m in FY2015
Recent phase of growth capital expenditure now completed
SEPTEMBER 2015
MERIDIAN ENERGY LIMITED 2015 Annual results roadshow presentation

219
106 163
195 209
0
50
100
150
200
250
2011 2012 2013 2014 2015
$M
Financial Year ended 30 June
UNDERLYING NPAT1
303
75
295 230 247
0
50
100
150
200
250
300
350
2011 2012 2013 2014 2015
$M
Financial Year ended 30 June
NET PROFIT AFTER TAX
Below EBITDAF
24
+7%
+7%
Results for the year ended 30 June 2011 include the Tekapo power stations, which were sold to Genesis Energy in June 2011
Additional depreciation +$19m (+9%) from the Mill Creek and Mt Mercer
Net finance costs +$5m (+7%) from FY2014 project interest capitalisation (FY2015 interest paid is lower)
Negative change in fair value of treasury instruments from forward rate changes
One-off items in the numbers:
$19m of gains on the sale from Arc and surplus farm land $38m of Australian impairments $28m release of capital gains tax liability not eventuating $34m reduction in accounting tax from successful resolution on powerhouse deductibility
Underlying NPAT +$14m (+7%) from FY2015
1Net profit after tax adjusted for the effects of non cash fair value movements and one-off items A reconciliation between net profit after tax and underlying net profit after tax is on p31
SEPTEMBER 2015
MERIDIAN ENERGY LIMITED 2015 Annual results roadshow presentation
Latest operating information
MERIDIAN ENERGY LIMITED 2015 Annual results roadshow presentation

Market data
26
Demand in the 2015 calendar year has slowed to be 2.0% higher than the same eight month period last year
Switching remains high with the 12 month average switching rate for all retailers at 19.4% at the end of July 2015
August 2015 and early September 2015 has seen significant upward movement in ASX prices, on average up +8% across 2016 to 2018
This follows thermal plant retirement announcements by Genesis Energy (two Huntly Rankine units, 500MW) and Contact Energy (Otahuhu B, 400MW)
SEPTEMBER 2015
MERIDIAN ENERGY LIMITED 2015 Annual results roadshow presentation
2,600
2,800
3,000
3,200
3,400
3,600
3,800
Jan Feb Mar Apr May Jun Jul Aug Sep Oct Nov Dec
GWh NATIONAL DEMAND
Range (2009-2014) 2011 2012 2013 2014 2015
45
55
65
75
85
95
Q3 2015
Q4 2015
Q1 2016
Q2 2016
Q3 2016
Q4 2016
Q1 2017
Q2 2017
Q3 2017
Q4 2017
Q1 2018
Q2 2018
Q3 2018
Q4 2018
$/MWh BENMORE ASX FUTURES SETTLEMENT PRICE
31 July 2015 5 August 2015 14 August 2015 17 August 2015 19 August 2015 20 August 2015 31 August 2015 7 September 2015

617 624 603 600 642
407 319 346 356 377
1,024 943 949 956
1,019
0
200
400
600
800
1,000
1,200
2011 2012 2013 2014 2015
GWh
Two Months ended 31 August
MERIDIAN'S RETAIL SALES VOLUMES
Residential/SME Corporate
117 106 108 104 103
123 115 114 116 117
48 51 55 56 56
287 272 277 277 275
0
50
100
150
200
250
300
350
Jun-12 Jun-13 Jun-14 Jun-15 Aug-15
ICP (000) NEW ZEALAND CUSTOMER NUMBERS
Meridian North Island Meridian South Island Powershop
New Zealand retail
27
-0.3%
+7%
Small decline in ICP numbers since June 2015, reflecting aggressive residential sales activity
To date this financial year residential/SME sales volumes are 7% higher than the same period last year
Corporate sales volumes are 6% higher than the same period last year
To date this financial year the average retail sales price is 4% higher than the same period last year
SEPTEMBER 2015
MERIDIAN ENERGY LIMITED 2015 Annual results roadshow presentation

Hydrology
28
July and August 2015 monthly inflows together were 117% of average
Storage at the end of August 2015 was 134% of historical average
To date this financial year Meridian’s New Zealand generation is 5% lower than the same period last year
To date this financial year the average price Meridian has received for its New Zealand generation is 13% lower than the same period last year
Similarly the average price Meridian paid to supply contracted sales is 16% lower than the same period last year
SEPTEMBER 2015
MERIDIAN ENERGY LIMITED 2015 Annual results roadshow presentation
0
500
1,000
1,500
2,000
2,500
2002 2003 2004 2005 2006 2007 2008 2009 2010 2011 2012 2013 2014 2015 2016
GWh
Financial year
MERIDIAN'S COMBINED CATCHMENT INFLOWS
Aug YTD 82 year average
0
500
1,000
1,500
2,000
2,500
1-Jan 1-Mar 1-May 1-Jul 1-Sep 1-Nov
GWh MERIDIAN'S WAITAKI STORAGE
Average 1979- 2010 2011 2012
2013 2014 2015