Embed Size (px)
Citation preview
Mesoamerican and Caribbean (MAC) Smog Blog Initial Training
Global Air Quality Case Studies
September 11-12, 2008CATHALAC, Panama
MODIS 15 May 2007Data from NASA GSFC
Global Air Quality Case Studies
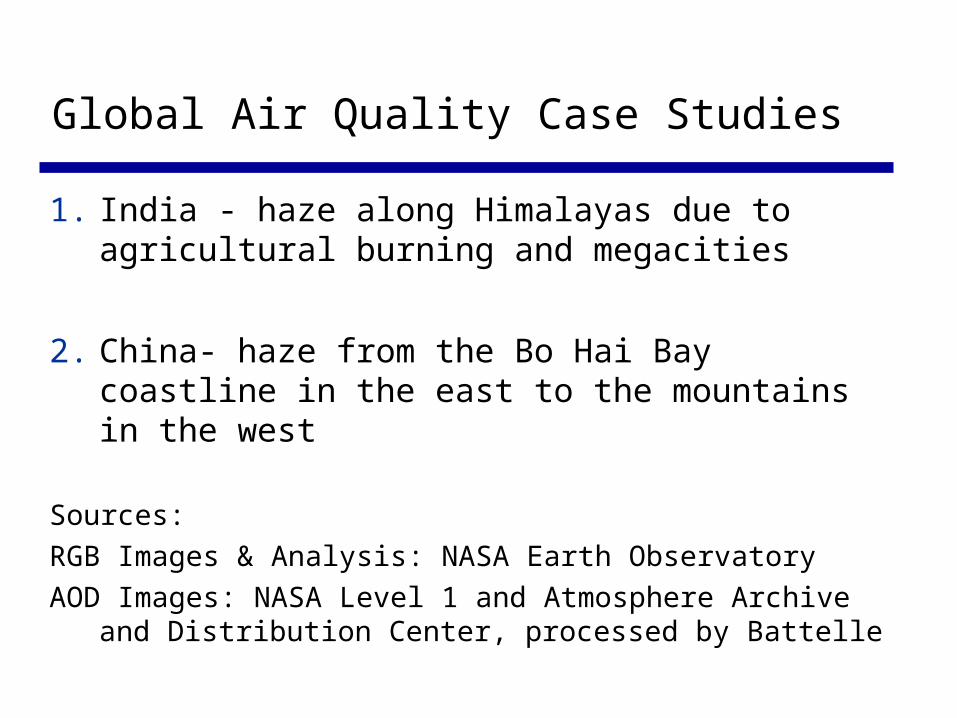
1. India - haze along Himalayas due to agricultural burning and megacities
2. China- haze from the Bo Hai Bay coastline in the east to the mountains in the west
Sources:
RGB Images & Analysis: NASA Earth Observatory
AOD Images: NASA Level 1 and Atmosphere Archive and Distribution Center, processed by Battelle
MODIS True Color Image of Northern India, Nepal, Bangladesh – 2/5/06

Insert AOD jpg
MODIS Image, Processed by Battelle
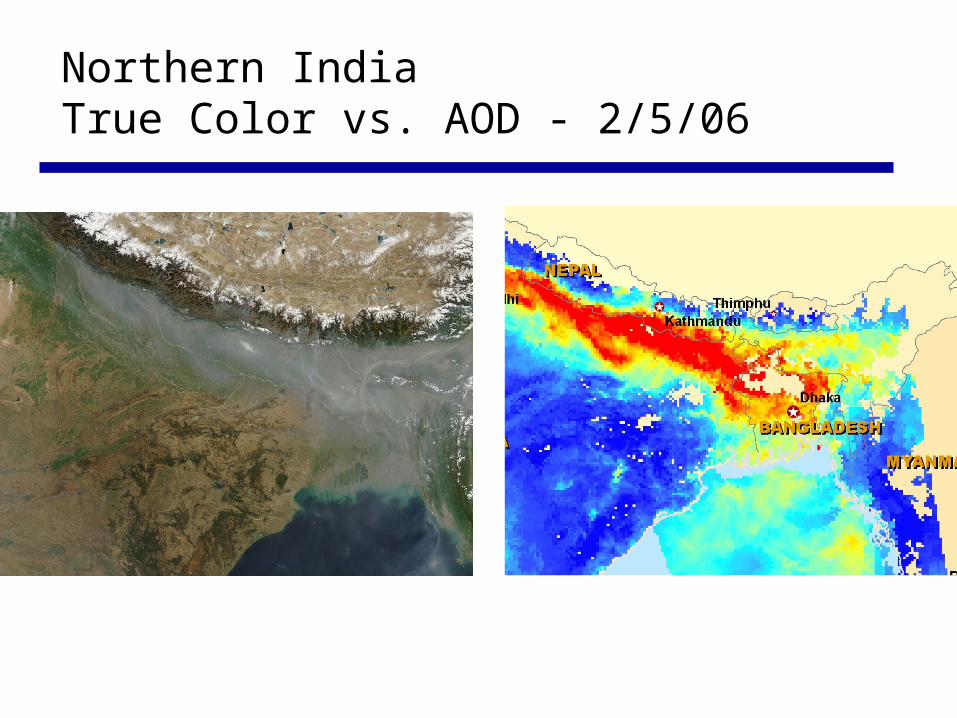
Northern India True Color vs. AOD - 2/5/06
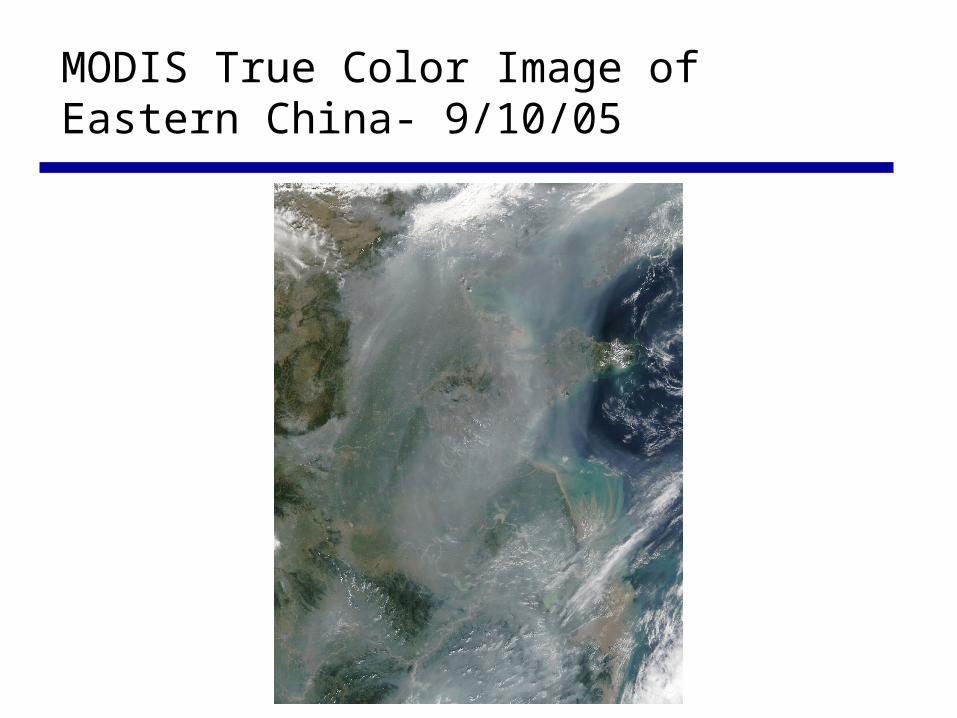
MODIS True Color Image of Eastern China- 9/10/05
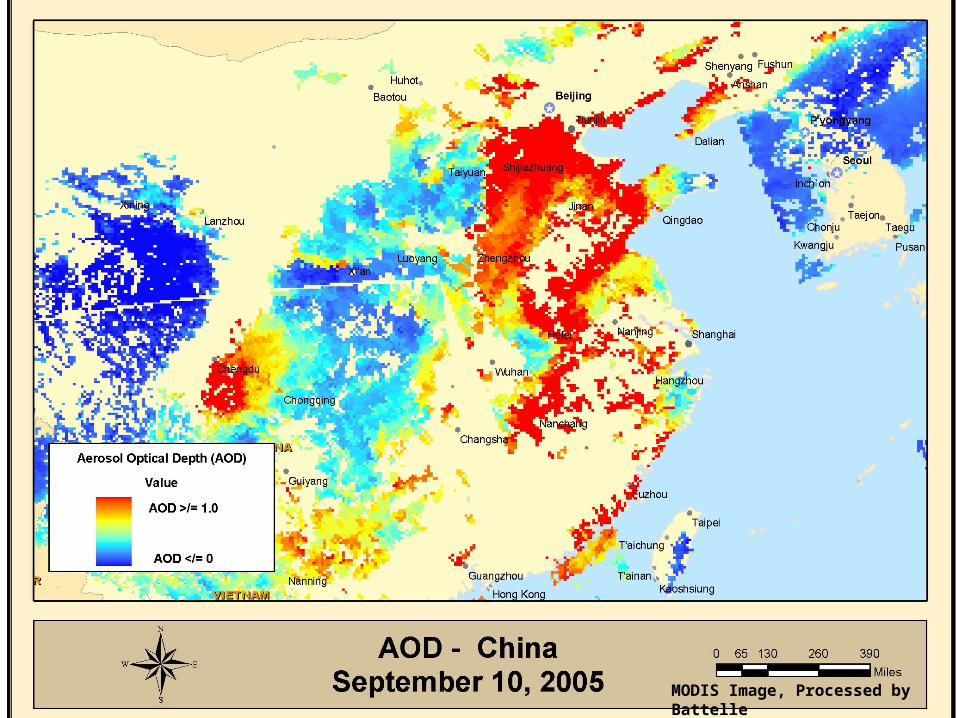
MODIS Image, Processed by Battelle

Eastern ChinaTrue Color vs. AOD - 9/10/05

Advantages and Limitations of Satellites for Air Pollution
• Advantages • Greater detail over regions especially those with no
ground monitors• Synoptic and transboundary view (time and space)• Adds value when combined with other data and
models• Visual appeal
Advantages and Limitations of Satellites for Air Pollution
• Limitations• Lack of specificity about some pollutants• Resolution and temporal scales sometimes too
large• Vertical layer sometimes not clear (sum over
column of air), need lidar• Large complex datasets difficult to acquire and use• New satellite sensors will help address some of the
limitations
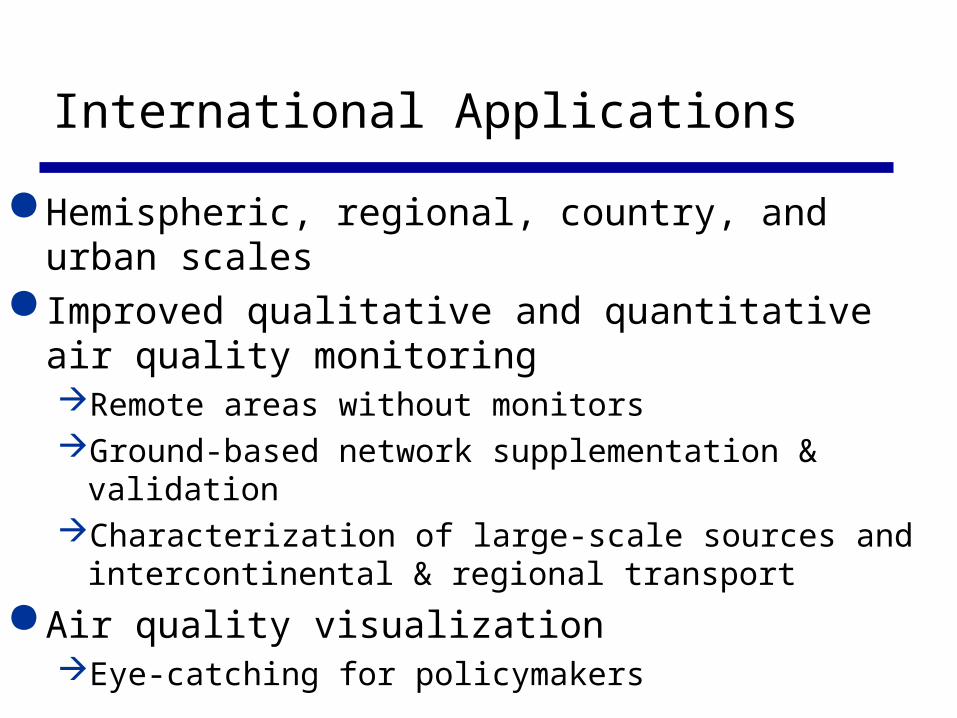
International Applications
Hemispheric, regional, country, and urban scales Improved qualitative and quantitative air quality
monitoringRemote areas without monitorsGround-based network supplementation & validationCharacterization of large-scale sources and
intercontinental & regional transport
Air quality visualizationEye-catching for policymakers
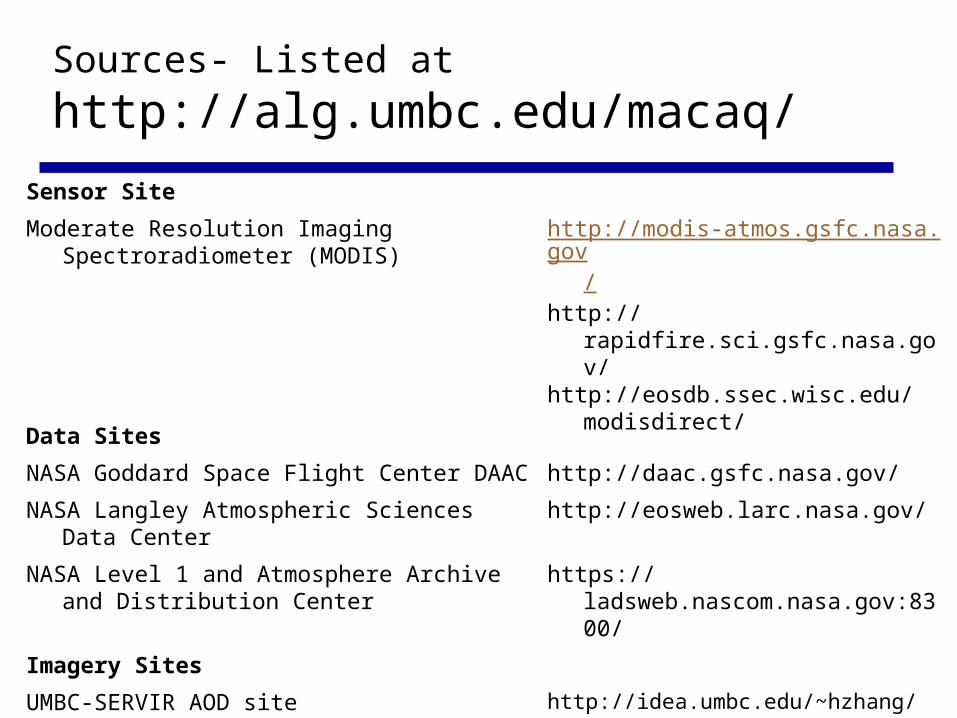
Sources- Listed at
http://alg.umbc.edu/macaq/
Sensor Site
Moderate Resolution Imaging Spectroradiometer (MODIS)
http://modis-atmos.gsfc.nasa.gov/http://rapidfire.sci.gsfc.nasa.gov/http://eosdb.ssec.wisc.edu/modisdirect/
Data Sites
NASA Goddard Space Flight Center DAAC http://daac.gsfc.nasa.gov/
NASA Langley Atmospheric Sciences Data Center
http://eosweb.larc.nasa.gov/
NASA Level 1 and Atmosphere Archive and Distribution Center
https://ladsweb.nascom.nasa.gov:8300/
Imagery Sites
UMBC-SERVIR AOD siteNASA Earth Observatory
http://idea.umbc.edu/~hzhang/MODIS/http://earthobservatory.nasa.gov/
NASA Visible Earth http://visibleearth.nasa.gov/
NOAA Operational Significant Event Imagery U.S. Air Quality (“Smog Blog”)
http://www.osei.noaa.gov/http://alg.umbc.edu/usaq/