Embed Size (px)
Citation preview

i
FINAL REPORT
Mesophotic Benthic Habitats and Associated Reef Communities at Lang Bank, St. Croix, USVI
by:
Jorge R. García-Sais, Stacey M. Williams, Jorge Sabater-Clavell,
Rene Esteves, Milton Carlo
P. O. Box 3424 Lajas, P. R.
Submitted to: Caribbean Fishery Management Council
San Juan, Puerto Rico
August 2014

ii
I. Executive summary This research represents an effort towards the characterization of essential fish habitats and associated reef communities from Puerto Rico and the U. S. Virgin Islands sponsored by NMFS thru the Caribbean Fishery Management Council (CFMC). Since 1993, the CFMC has seasonally closed Lang Bank to all bottom tending gear in order to protect spawning aggregations of the red hind, Epinephelus guttatus. The main objectives of the study included the production of a georeferenced benthic habitat map of the mesophotic insular shelf and upper slope within the 30 – 50 m depth range, provide a quantitative and qualitative characterization of the sessile-benthic and motile-megabenthic invertebrates and fish populations of the main benthic habitat types and provide a fisheries independent survey of the most important commercially valuable fish and shellfish populations from mesophotic habitats at Lang Bank, located at the eastern tip of St. Croix, USVI. Five main benthic habitat types were discovered within the 30 – 50 m depth range at Lang Bank, these include a Bank Coral Reef system (BCR), Colonized Pavement (CPV), Colonized Rhodolith Reef (CRR), Spur and Groove Reef (SAG), and Patch Reef (PRF). The BCR habitat occupied an estimated area of 2.0 km2, or 32 % of the total area surveyed. It is an impressive continuous formation of scleractinian corals, particularly boulder star coral, Orbicella franksi growing at depths of 30 m to at least 50 m (100 – 165’) throughout the deep outer shelf basin of Lang Bank with an average live coral cover of 29.0 %. The most extensive habitat surveyed within the 30 – 50 m depth range corresponded to CPV, with a total area of 2.5 km2, or 41 % of the total area surveyed. Continuous sections of CPV habitat were found associated with the reef tops of the inner and outer shelf edge, and down the outer shelf insular slope. The SAG was observed to be largely a neritic habitat that extended just to the shallow margin of the mesophotic realm at a depth of 30 m in some of its deepest sections and thus, not properly addressed by this study. It is the habitat where spawning aggregations of red hind (Epinephelus guttatus) had been reported. PRFs were mostly found near the boundaries of the BCR at the deep basin walls. These were more common at the inner slope of the outer shelf break and covered a total estimated area of 0.6 km2, or 9.3 % of the total area surveyed. CRR habitats were observed mostly down the insular slope of the outer shelf break. A few patches were observed as well near the edges of the deep basin and in small sections of the BCR. The areal extension of CRR habitat was estimated as 0.9 km2, or 14.9 % of the surveyed area. Based on its relatively high composition of live coral cover and high within habitat affinity or similarity, the BCR was statistically different in terms of sessile-benthic community structure to all other mesophotic habitat types at Lang Bank within the 30 – 50 m depth range. The CPV, PRF and CRR benthic habitats were characterized by relatively low affinity (high variability) on the relative composition of substrate categories within stations. High variability within transects was measured for abiotic cover, live corals and octocorals. The CPV and CRR habitats were distributed throughout a wide range of depths (30 – 50 m) and slopes, factors that may have influenced benthic community structure. The sessile-benthic invertebrate community observed from mesophotic habitats at Lang Bank included altogether, a total of 26 spp of hard corals, 10 genera of octocorals, and at least 53 sponge spp. The reef fish community was comprised by at least 87 spp, distributed into 25 families. The highest densities (42.8 Ind/30 m2) and species richness (70 spp) were surveyed from the BCR. Fish community structure at the BCR was characterized by relatively high within habitat affinity with an average similarity of 31.4 %. Within habitat similarity was strongly influenced by the relatively uniform density of bicolor damselfish (Stegastes partitus), blue chromis (Chromis cyanea), yellowhead wrasse (Halichoeres garnoti) and princess parrotfish (Scarus taeniopterus). Statistically significant differences were found between the relative abundances of fishes at the BCR and all other habitats surveyed at Lang Bank. The highest dissimilarity resulted between the BCR and the CRR (colonized rhodolith reef) at 80.8 %. The fish community at the BCR was more specious than the CRR and other habitats surveyed at Lang Bank. The higher densities and species richness at the BCR appear to be associated with the higher benthic habitat complexity
iii
and rugosity. Fish community structure at the CPV, PRF, and CRR habitats were characterized by relatively low affinity (high variability) within sampling stations, influenced by the high variability of reef physiographic conditions in terms of depth, topographic relief and slope. A total of 283 fish individuals distributed into 22 species and 77 shellfish individuals distributed into two species were included in the fishery independent surveys performed at Lang Bank. The total area surveyed was 13, 200 m2. Surveys at the CPV and BCR habitats represented approximately 78 % of the total area surveyed. Large groupers and snappers were observed in very low numbers at Lang Bank. It is possible that the high availability of protective structures at the BCR may have influenced underestimates of large grouper/snapper densities and sightings, but CPV and CRR habitats at Lang Bank were mostly devoid of such protective structures. The lack of physical and biological complexity at these habitats may limit the occurrence of large demersal fishes because of the virtual absence of prey items and residential structures. Nurse sharks (Ginglymostoma cirratum) were the largest top predators observed from mesophotic habitats at Lang Bank. The lionfish (Pterois sp), an invasive fish of potential commercial value as food was the most abundant fish larger than 25 cm. Lionfishes (Pterois sp) occurred within the entire mesophotic depth range studied at Lang Bank, but were more common at the upper insular slope (35 – 40m) close to the shelf-edge, and associated with rocky outcrops, crevices and coral heads. Red hinds were observed to be part of the residential fish assemblage at the BCR, SAG and CPV mesophotic habitats of Lang Bank, with higher densities surveyed from the BCR. Densities of red hind at Lang Bank are within the range estimated from visual surveys at other mesophotic habitats within the US Caribbean EEZ. Mutton snapper (Lutjanus analis) was the most abundant commercially important snapper observed from mesophotic habitats at Lang Bank. Higher densities were surveyed from the BCR, but were present from all benthic habitats studied. Queen conch (Strombus gigas) were observed in very high densities (up 50 Ind/1000m2), but mostly concentrated on CRR habitats, which have relatively limited distribution within the 30 – 50 m mesophotic depth range in Lang Bank. The size frequency distribution was strongly skewed towards the larger size classes, indicative that mesophotic habitats at Lang Bank, particularly the CRR functions as an important habitat mostly for adult queen conch. Spiny lobsters (Panulirus argus) were highly abundant at Lang Bank, particularly at the CPV habitat, where densities of up to 5 Ind/1000m2 were surveyed. Spiny lobsters were mostly concentrated at the outer shelf-edge ridge at depths of 33 – 38 m associated with coral heads and crevices in a relatively flat pavement colonized by sponges, gorgonians and isolated coral heads.

0
Table of Contents Page
I Executive Summary ii II. Introduction 1 III. Research Background 3 IV. Study Objectives 6 V. Methods 7
1.0 Study Site 7 2.0 Benthic Habitat Mapping 8 3.0 Characterization of Mesophotic Reef Communities 8
3.1 Sessile benthic community 8 3.2 Fishes and motile megabenthic invertebrates 11
VI. Results and Discussion 13 1.0 Benthic Habitat Map 13
1.1 Bank Coral Reef 13 1.2 Patch Coral Reef 13 1.3 Colonized Pavement 14 1.4 Colonized Rhodolith Reef 15 1.5 Spur and Groove Reef 15 1.6 Uncosolidated Bottom Habitats 15
2.0 Biological Characterization of Mesophotic Habitats 17 2.1 Sessile Benthic Community 17
2.1.1 Colonized Pavement 17 Photo Album 1. Colonized Pavement 24 2.1.2 Bank Coral Reef 27 Photo Album 2. Bank Coral Reef 30 2.1.3 Patch Coral Reef 33 Photo Album 3. Patch Coral Reef 35 2.1.4 Spur and Groove Reef 38 2.1.5 Colonized Rhodolith Reef 40 Photo Album 4. Colonized Rhodolith Reef 42
2.2 Fish and Shellfish Community 45 2.2.1 Colonized Pavement 45 2.2.2 Bank Coral Reef 49 2.2.3 Colonized Rhodolith Reef 50
2.3 Fishery Independent Surveys 52 2.3.1 Lionfish 53 2.3.2 Red Hind 55 2.3.3 Mutton Snapper 55 2.3.4 Queen Triggerfish 57 2.3.5 Queen Conch 60 2.3.6 Spiny Lobster 60 Photo Album 5. Fish and Shellfish 64
VII. Conclusions 66 VIII. Literature Cited 68 IX. Appendices 70

1
II. Introduction Lang Bank is a submerged coral reef system located along the eastern shelf of St. Croix,
USVI. The easternmost tip, with an extension of approximately 10 km2 has been
seasonally (December – February) closed to all bottom tending gear (traps, pots, nets
and long lines) by the CFMC since 1993 to protect a spawning aggregation of red hind,
Epinephelus guttatus. The closed fishing area fringes the shelf-edge and includes a
deep outer shelf basin with mesophotic terraces and ridges. Prada (2003), under
contract by the CFMC produced a benthic habitat map of Land Bank based on visual
interpretations of Side Scan Sonar (SSS) imagery and geotiff mosaics of multibeam
bathymetry. Soft corals, or gorgonian plains were reported as the dominant benthic
habitat type, representing nearly 70% of the total area surveyed. Field verifications of
mesophotic habitats were not included in the mapping effort by Prada (2003). Aside
from unpublished observations of coral composition at the red hind spawning
aggregation site studied by Nemeth et al. (2006, 2007), scientific characterizations of
mesophotic benthic habitats and associated sessile-benthic and pelagic communities of
Lang Bank were lacking. In addition to research focused on the red hind spawning
aggregation, a Seamap fishery survey on the shallow sections of the bank was reported
by Tobias et al. (2002).
Research recently completed on Isla Desecheo (García-Sais et al., 2005b), Bajo de Sico
(García-Sais et al., 2007), Abrir La Sierra (García-Sais et al., 2010), El Seco-Vieques
(Garcia-Sais et al. 2011) and the St. Thomas, USVI Hind Bank Marine Conservation
District Reef (Nemeth et al. 2008, Smith et al, 2010) have contributed to the location and
mapping of mesophotic reefs with technical support (bathymetry, benthic habitat maps)
from NOAA’s Biogeography Team
(http://ccma.nos.noaa.gov/products/biogeography/usvi_nps/data.html). The
aforementioned studies have demonstrated that mesophotic reef systems function as
important residential and foraging habitats, as well as spawning aggregation sites for a
variety of commercially important demersal reef fishes that have virtually disappeared
from shallow reef systems in Puerto Rico. In addition, coral species that have been
severely impacted and are presently vulnerable to bleaching events associated with
increasing water temperatures in shallow reefs; such as Orbicella (formerly Montastraea)
annularis (complex) have been protected from the bleaching effects in mesophotic reefs

2
until present (but see Menza, 2007 and Smith et al., 2010). Thus, mesophotic reefs also
represent genetic reservoirs for these coral species and associated biota.
This investigation identifies and maps the main benthic habitat types found at Lang Bank
within the 30 – 50 m depth range and provides a quantitative and qualitative
characterization of the predominant sessile-benthic and fish communities associated to
the main benthic habitats. A fishery independent survey of the commercially important
fish and shellfish populations, with particular attention to the red hind (Epinephelus
guttatus) during its seasonal spawning aggregation was also included as part of the
quantitative assessment of mesophotic habitats at Lang Bank.
The Caribbean Fishery Management Council (CFMC) subcontracted with Principal
Investigator Dr. Jorge R. García-Sais and other personnel to carry out the proposed
work herewith. Mrs. Maria A. Irizarry acted as the Fiscal Administrator and Graciela
García-Moliner as the study monitor.

3
III. Research Background Characterizations of reef habitats and associated sessile-benthic and fish communities
at depths between 30 – 100 m (mesophotic) are rare in the Caribbean, and until
recently, mostly available from submersible surveys. Colin (1974; 1976) described the
taxonomic composition of reef fishes at depths between 90 – 305 m off the coasts of
Jamaica, Belize and the Bahamas as a mixed assemblage of shallow reef (< 30 m) and
true “deep-reef” species seldom present shallower than 50 m. Colin (1974) argued that
the vertical distribution of some reef fish species was more related to local environmental
conditions (habitat features) than depth, and noted ontogenetic trends in the vertical
distribution of “deep-reef” species, where juvenile stages were typically observed at
shallower depths than adults. In Puerto Rico, the Seward Johnson- Sea Link
submersible survey (Nelson and Appeldoorn, 1985) provided a qualitative
characterization of benthic habitats and associated fishes of the insular slope,
encompassing depths between 100 – 1,250 m. Despite observations of a “rich and
highly complex” reef fish community associated with the upper insular slope (30 – 100
m), these habitats were left virtually undescribed by the Seward Johnson - Sea Link
survey.
Quantitative assessments of reef substrate cover by sessile-benthic communities from
mesophotic reef habitats in the Caribbean include the autonomous underwater vehicle
(AUV) surveys of the La Parguera shelf-edge (Singh et al., 2004) and the Marine
Conservation District (MCD) coral reef system located south of St. Thomas, USVI
(Armstrong et al., 2006). Menza et al. (2007) reported on coral taxonomic composition,
percent substrate cover, and recent degradation of a mesophotic coral reef system
(MSR-1) dominated by Orbicella (formerly Montastraea) annularis (complex) on the
outer shelf south of St. John, USVI using video and still camera images dropped from
the NOAA R/V Nancy Foster. Smith et al. (2010) also reported on diseased colonies of
O. annularis at the Hind Bank MCD, USVI. The aforementioned studies identified mayor
differences of sessile-benthic community structure associated with the various
mesophotic habitat types and depth gradients, but lack inferences about their reef fish
communities. Beets and Friedlander (1997) and Nemeth (2005) conducted quantitative
surveys of the red hind (Epinephelus guttatus) population within the MCD, a known
spawning aggregation site for this species. These studies provided a baseline and an
assessment of the effectiveness of the closed fishing regulation for the recovery of the

4
red hind population within the MCD, but do not include information on fish - habitat
associations for other species. A more general description of the fish community at the
MCD from AGRRA surveys is available from Nemeth et al. (2008).
The spatial and temporal patterns of migration and movement by red hind during its
seasonal spawning aggregation at Lang Bank was studied by Nemeth et al. (2007). The
aggregation site was located at the edge of a coral spur that projects into a deeper water
basin within outer shelf. The study found that E. guttatus migrated 5 – 18 km from an
area of about 90 km around St. Croix. Similarities in terms of movement timing,
temporal and spatial changes in sex ratios, annual and lunar predictabilities and sexual
behavioral responses to environmental cues were similar than those at the Hind Bank,
MCD in St. Thomas. With respect to the benthic habitat, Nemeth et al (2007) noted that
Lang Bank presented less topographic relief than the MCD at the aggregation site, but
that the composition of the reef coral species was similar between sites. Data on coral
composition was cited as “unpublished” by Nemeth et al (2007).
As part of the NMFS-CFMC initiative toward the mapping and characterization of
mesophotic reef systems in the U.S. Caribbean EEZ, the marine reserve at Isla
Desecheo and the seasonally closed reefs at Bajo de Sico and Abrir La Sierra in Mona
Passage, El Seco Reef in Vieques, and the Hind Bank Marine Conservation District of
St. Thomas, USVI have been recently studied (Garcia-Sais et al, 2005, 2007, 2010;
2011; Nemeth et al, 2008, Smith et al. 2010). Statistically significant differences of
sessile-benthic and fish community structure were found between euphotic and
mesophotic habitats at Isla Desecheo (Garcia-Sais, 2010). The percent of live coral
cover and the relative composition of coral species, sponges and benthic algae exhibited
marked variations with depth and/or benthic habitat (Garcia-Sais et al. 2005, Garcia-
Sais, 2010). Similar findings were reported for Bajo de Sico and Abrir La Sierra (Garcia-
Sais et al., 2007, 2010), where important shifts of sessile-benthic and fish community
structure appear to be associated not only with depth, but also with habitat type, slope
and rugosity.
The recently studied mesophotic reefs share the presence of large demersal fishes in
abundances never previously reported for shallow reefs in Puerto Rico. In general, fish
assemblages exhibit marked differences of relative abundance associated with habitat

5
type and/or depths, high taxonomic connectivity between habitats across depth
gradients, and presence of what appears to be a small group of indicator fish species of
mesophotic reefs (Garcia-Sais et al., 2007, 2010; Garcia-Sais, 2010). A relevant
conclusion from these researches is that mesophotic reefs function as the residential
and foraging habitats for a wide spectrum of commercially exploited reef fishes,
particularly large groupers and snappers, and also for queen conch. These populations
appear to migrate from their mesophotic residential habitats to their spawning
aggregation sites in shallower sections of the shelf-edge. Also, the particularly high
abundance of post-settlement juveniles of Coneys (Cephalopholis fulva), Blue Chromis
(Chromis cyanea) and Fairy Basslet (Gramma loreto) reported for Isla Desecheo, Bajo
de Sico and Abrir La Sierra suggests that these mesophotic reefs may function as prime
recruitment sites for these and other reef fish populations.
Fishery independent surveys of commercially important fish and shellfish populations
from mesophotic habitats within a 30 – 50 m depth range were performed at reef sites
within the Puertorrican EEZ, Abrir la Sierra (ALS), Isla Desecheo (Des), and Bajo de
Sico (BDS) during the February 2011 thru January 2012 (Garcia-Sais et al. 2012). Fish
targets included large groupers (red hind, Nassau, yellowfin, black), snappers (mutton,
cubera, dog, schoolmaster, yellowtail), large parrotfish (midnight, blue, rainbow), hogfish,
queen triggerfish, lionfish, great barracuda, and sharks. Shellfish targets included spiny
lobster and queen conch. Mesophotic benthic habitats at sites surveyed included reef
tops, slope walls and rhodolith reefs at ALS; slope walls, patch reefs with colonized
pavement and rhodolith reefs at Des; and rock reef promontories and rhodolith reef at
BDS. Marked variations in the composition and abundance of several commercially
important fish and shellfish populations between sites were noted. Higher abundance of
queen conch, large snappers (mutton, dog, cubera) and hogfish were observed from at
ALS, as compared to Des and BDS. Given the similarity of benthic habitat types
between sites and the habitat plasticity displayed by many fish populations, it is
proposed that the sharp differences in population size and species composition of
commercially important fish and shellfish populations is related to the recruitment
enhancement effect provided by the within shelf connectivity between nursery and
mesophotic habitats at ALS, compared to the partial isolation imposed by the oceanic
boundary of Mona Passage separating Des and BDS from the PR shelf. Several
populations evidenced marked preferences for particular benthic habitats. For example:

6
more than 90 % of all queen conch from all sites was observed from the rhodolith reef at
ALS. Conversely, spiny lobsters, groupers, hogfishes, lionfishes and snappers, with the
exception of mutton snapper, were more abundant at the reef top and slope wall habitats
than at the rhodolith reef. Queen conch was more abundant during the August –
September survey, coinciding with their peak reproductive season at ALS. Couples of
queen conchs were observed engaged in copulation and egg masses discovered buried
on the rhodolith habitat at depths ranging between 38 – 45 m (125 – 145 ‘) during the
August-September survey.
IV. Study Objectives
1) Provide a baseline quantitative and qualitative characterization of the sessile-
benthic, motile-megabenthic invertebrate and demersal fish communities
associated with the principal mesophotic reef habitats within a depth range of 30
– 50 m at Lang Bank.
2) Validate by direct diver observations mesophotic habitats (30 – 50 m) included in
the benthic habitat map of Lang Bank prepared by Geophysique GPR
International, Inc. (Prada, 2003).
3) Analyze relationships between the benthic and fish community structure with
physical factors, such as habitat type, and evaluate the function of mesophotic
habitats in the life cycle of commercially important reef fish populations
4) Provide a fisheries-independent assessment of the abundance and size
frequency distributions of commercially important and transitory fish and shellfish
(queen conch, spiny lobster) species associated with mesophotic (30 – 50 m)
reef habitats at Lang Bank.
5) Produce a digital photographic and video album of deep reef communities from
Lang Bank.

7
V. Methods 1.0 Study Site Lang Bank is a submerged coral reef system located along the eastern shelf of St. Croix, USVI
(Figure 1). The easternmost tip, with an extension of approximately 10 km2 has been seasonally
(December – February) closed to all bottom tending gear (traps, pots, nets and long lines) by
the CFMC since 1993 to protect a spawning aggregation of red hind, Epinephelus guttatus. The
closed fishing area fringes the shelf-edge and includes a deep outer shelf basin with mesophotic
terraces and ridges. Prada (2003) produced a benthic habitat map of Land Bank based on
visual interpretations of Side Scan Sonar (SSS) imagery and geotiff mosaics of multibeam
bathymetry. Soft corals, or gorgonian plains were reported as the dominant benthic habitat type,
representing nearly 70% of the total area surveyed. Field verifications of mesophotic habitats
were not included in the mapping effort by Prada (2003). Aside from unpublished observations
of coral composition at the red hind spawning aggregation site studied by Nemeth et al. (2006,
2007), scientific characterizations of mesophotic benthic habitats and associated sessile-benthic
and pelagic communities of Lang Bank are lacking. In addition to research focused on the red
hind spawning aggregation, a Seamap fishery survey on the shallow sections of the bank was
reported by Tobias et al. (2002).
Figure 1. Location of Lang Bank in the east coast of St. Croix with Side Scan Sonar bathymetry data produced by GPR (2003).

8
2.0 Benthic Habitat Mapping
The side-scan (SSC) bathymetric survey of the southeast coast of St. Croix, USVI prepared by
GPR International, Inc. (2003) was used as the main footprint for the selection of sampling
stations for characterization of benthic habitats and for preparation of the benthic habitat map.
Benthic habitat transitions at Lang Bank were generally characterized by particular topographic
features of the seafloor recognized from the SSC bathymetry and derived rugosity values. At
least four distinct reef physiographic zones were evident from the bathymetry map: 1) an inner
shelf-break and slope at depths between 25 – 40 m; 2) a deep outer shelf basin at depths
between 40 – 60+ m; 3) an outer reef top ridge at depth between 30 – 35 m; and 4) the outer
shelf-edge and slope (Figure 2).
The reef top ridge and outer shelf-edge and slope were characterized by a series of roughly
equidistantly separated sets of 10 depth-stratified station clusters at 30, 40 and 50 m for a total
of 30 transects. Due to the existence of several extensive pools deeper than 50 m interspersed
within the deep outer basin, a total of 33 sampling stations were selected to provide both
geographical coverage and depth characterization to this physiographic zone. A total of nine (9)
stations were sampled at 30 m, 13 stations were sampled at 40 m and 11 stations were
sampled at 50 m, for a total of 33 transects surveyed within the deep basin. The inner shelf
break and slope were sampled at 19 stations haphazardly selected to provide both geographical
and depth coverage to this physiographic zone with nine (9) transects at 30m and 10 transects
at 40 m. In all, 85 stations were sampled for quantitative biological observations and benthic
habitat mapping (Figure 3). The exact station geographic position, depth, habitat type, and
additional observations are included as Appendix 1.
3.0 Characterization of Mesophotic Reef Communities
3.1 Sessile-Benthic Community
At each of the 85 sampling stations selected for characterization of the main reef physiographic
zones one 20 m line transect was laid over the substrate using a fiberglass tape measure. The
initial 10 m were photographed using a Nikon D70 digital camera with an Aquatica housing
maintaining a constant distance between the camera and the seafloor. Ten (10) non-

9
Figure 2. Bathymetry map of Lang Bank showing the main physiographic features. Produced
after Prada (2003)
10
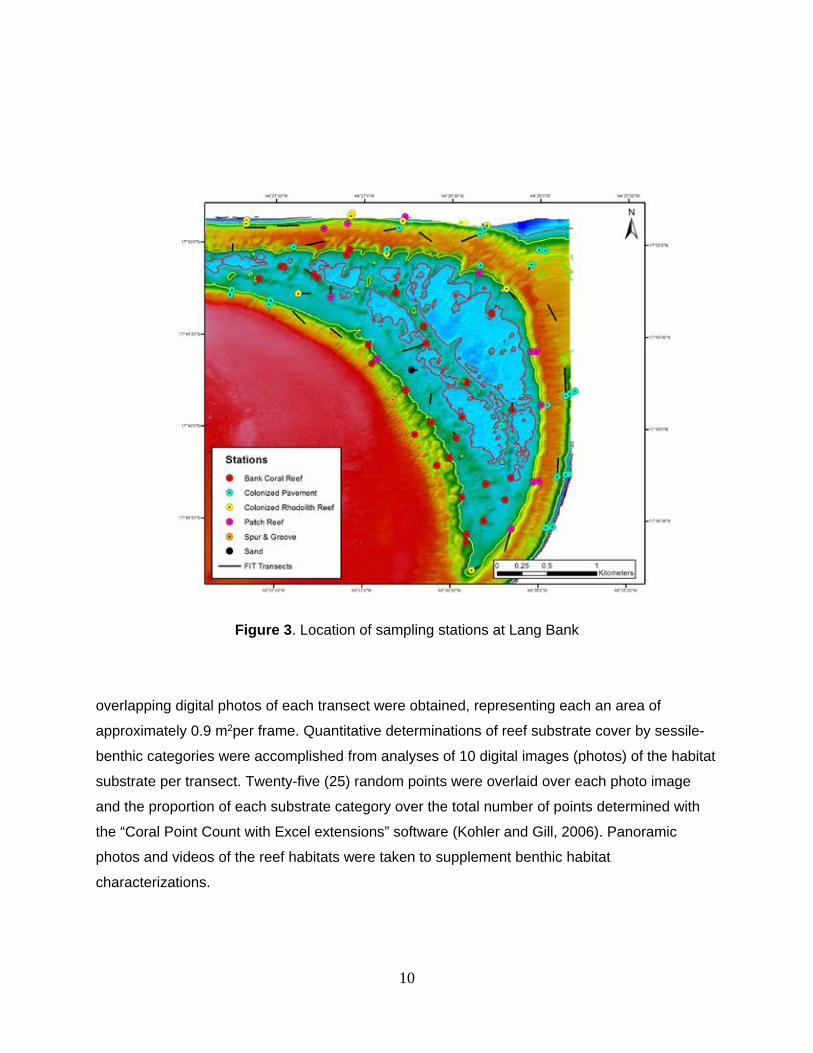
Figure 3. Location of sampling stations at Lang Bank
overlapping digital photos of each transect were obtained, representing each an area of
approximately 0.9 m2per frame. Quantitative determinations of reef substrate cover by sessile-
benthic categories were accomplished from analyses of 10 digital images (photos) of the habitat
substrate per transect. Twenty-five (25) random points were overlaid over each photo image
and the proportion of each substrate category over the total number of points determined with
the “Coral Point Count with Excel extensions” software (Kohler and Gill, 2006). Panoramic
photos and videos of the reef habitats were taken to supplement benthic habitat
characterizations.

11
Substrate classifications included the following:
· Stony corals – reported by species and percent substrate cover included stony hydrocorals and scleractinian corals (e.g. Millepora alcicornis, Montastraea cavernosa.)
· Octocorals -(soft corals) reported by species and percent substrate cover, included sea fans, sea whips and encrusting forms, such as Erythropodium sp.
· Sponges – percent substrate cover reported by species or lowest possible taxon,
· Zoanthids – percent substrate cover by species or lowest possible taxon
· Algal Turf – percent substrate cover reported for a mixed assemblage of short algae intermixed with other small epibenthic biota forming a mat or carpet over hard substrate
· Calcareous Algae – percent substrate cover or lowest possible taxon
Coralline Algae - percent substrate cover or lowest possible taxon
· Fleshy Algae – percent substrate cover reported as total fleshy algae, or lowest possible taxon for vertically projected, mostly brown, red and green macroalgae
· Abiotic Substrate – percent substrate cover by unconsolidated sediment, bare rock, deep holes, crevices and gaps.
3.2 Characterization of Fishes and Motile Megabenthic Invertebrate
a) Small Demersal Fishes
Demersal (non-cryptic) and territorial reef fish populations and motile megabenthic (> 5 cm)
invertebrates (MI) were surveyed from 10 m long by 3 m wide (30 m2) belt-transects centered
over the reference line of transects used for sessile-benthic reef characterizations. Locations of
transect sampling stations are shown in Figure 2. Each transect was surveyed during 10-12
minutes, subject to the species richness and abundance encountered. The initial two minutes
focused on elusive and/or transitory species that could swim away of the “belt-transect” area
upon detection of a diver (e.g. snappers, large groupers, hogfish, mackerel, large parrotfishes,
etc.). During the next two minutes, the diver swam over the center of the transect counting
fishes attracted to divers, such as wrasses and butterflyfishes (e.g. Thalassoma, Halichoeres
spp., Chaetodon spp.). Then, fishes that form schooling aggregations at less than 3 meters over
the reef (e.g. Chromis spp., Clepticus parrae, Bodianus, etc.) and other transitory species were
counted as they entered the belt-transect area. Runs over both sides of transects were
performed during the last four-six minutes of the survey area in order to enumerate demersal
and territorial fishes (e.g. Stegastes spp, Gramma loreto, squirrelfishes, etc.) that remain within

12
the transect area. Fish species observed outside transect areas were reported to supplement
the taxonomic assessment, but were not included in density (abundance) determinations.
b) Large demersal and transitory pelagic fishes
Transitory pelagic and other large demersal but elusive fishes that usually represent the
commercially important assemblage were quantified along 20 m long x 3 m wide (area: 60 m2)
belt-transects. These were extensions of the same 10 m long transects used for benthic
invertebrates and small demersal fish assessments. Survey of these transects preceded all
other sampling activities in the reef in order to obtain the most accurate information regarding
densities of these large fishes in their natural environment. All fishes of commercial value were
targeted by this sampling approach, with particular attention to large demersal reef snappers,
groupers and hogfish, but also included reef pelagics, such as sharks, mackerels, jacks,
barracudas and others present within three (3) meters above the reef substrate. A size estimate
of each fish was made in order to provide size frequency data for each species present. Large
megabenthic invertebrates of commercial value, such as lobsters and conch were included in
the survey.
In addition, a series of 26 drift transects were executed to contribute fishery independent data
and supplement taxonomic characterizations and density estimates of the large elusive,
commercially important fish and shellfish community. Transect locations (Figure 3) were
selected to characterize the main benthic habitat types, including the Bank Coral Reef (BCR),
Colonized Pavement (CPV), and Colonized Rhodolith Reef (CRR). Transect width was kept
constant at 6 m. The distance varied due to depth, current speed and the presence of queen
conch, but generally ranged between 100 – 200 m, to yield transect areas of 600 – 1200 m2 per
transect.

13
VI. Results and Discussion 1.0 Benthic Habitat Map The benthic habitat mapping effort in this study includes a total surface area of 7.5 km2,
extending 3.7 km from the eastern shelf-edge towards the west and 4.0 km from the southern
shelf-edge towards the north. An area of 1.4 km2, within the deep basin, with water depths
deeper than 50m was not surveyed and thus excluded from the habitat map. As a result of this,
the total area mapped was actually 6.1 Km2. Five predominant benthic habitat types were
observed within the study area at Lang Bank; these include: bank coral reef (BCR), colonized
rhodolith reef (CRR), colonized pavement (CPV), spur and groove coral reef (SGR), and patch
coral reef (PCR).
1.1 Bank Coral Reef. The bank coral reef habitat is an impressive continuous formation
of scleractinian corals growing at depths of 30 m to at least 50 m (100 – 165’) throughout the
deep outer shelf basin of Lang Bank (Figure 4). The total surface area of the coral reef bank
within the study area was estimated as of 1.97 km2, or 32 % of the total area surveyed (Table 1).
The bank coral reef habitat is largely (almost a biotope) of Orbicella (formerly Montastraea)
franksi, a sibling species of O. annularis growing as laminar planks of up to 1 m of diameter,
supported by pedestals of unknown origin and variable heights. The coral reef system has
developed at the inner shelf slope starting at a depth of approximately 30 m and extends down
the gradual slope towards the deep section of the basin. The coral reef system, as defined by
the contiguous growth of coral colonies creating a topographic anomaly and physical habitat
was observed to reach a maximum depth of 52.4 m (173’). It is unknown if isolated coral
colonies or smaller “patch reef” formations exist deeper than our diving depth limit of 50 m within
the deep basin of Lang Bank.
1.2 Patch Coral Reef
A series of small coral reef patches were observed at 11 dive sites/stations within the study area
at Lang Bank, occupying an estimated area of 0.57 km2 (Table 1). Patch reefs were mostly
found near the boundaries of the bank coral reef at the deep basin walls. These were more
common at the inner slope of the outer shelf break (Figure 4), but were also observed at the
slope wall of the inner shelf break, near the edge of the outer shelf break, and down the outer
shelf slope. Patch reefs associated with the deep basin walls were essentially discontinuous
sections of the bank coral reef comprised by variable sets of Orbicella franksi colonies growing

14
together with other reef benthic biota and surrounded by sand. Patch reefs observed at the
outer shelf edge and slope were typically found as sponge-coral bioherms associated with
substrate anomalies in an otherwise biologically featureless pavement habitat. These patch
reefs typically presented a more diverse reef benthic biota and appeared to concentrate fishes
and shellfish, particularly spiny lobsters.
Table 1. Areal surface cover for each benthic habitat as represented in the benthic
habitat map constructed for Lang Bank, St. Croix, USVI. 2013.
Benthic Habitat Area (m2) Area (km2) %
Colonized Pavement 2,508,593 2.51 41.2
Bank Coral Reef 1,970,912 1.97 32.4
Colonized Rhodolith Reef 907,452 0.91 14.9
Patch Coral Reef 568,978 0.57 9.3
Sand 93,379 0.09 1.5
Spur and Groove Reef 40,058 0.04 0.7
Total Area = 6,089,372 6.09 Not Surveyed (>50 m) 1422748 1.42
1.3 Colonized Pavement.
The colonized pavement habitat is here defined as hard ground substrate of variable
topographic relief where corals and/or other reef biota, when present, grow mostly as isolated
colonies without forming any complex physical/structural habitat that significantly increases
biodiversity relative to adjacent habitats. At Lang Bank, the colonized pavement habitat
presented a highly variable benthic composition that appeared to be influenced by slope, depth
and water currents. Extensive continuous sections of colonized pavement habitat were found
associated with the reef tops of the inner and outer shelf edge, and down the outer shelf insular
slope (Figure 4). The total area covered by colonized pavement was estimated as 2.5 km2, or

15
41.2 % of the total study area within the 30 – 50 m depth range (Table 1).
1.4 Colonized Rhodolith Reef
Rhodolith reefs are deposits of crustose coralline algal nodules of variable dimensions and
shapes that once stabilized over the bottom undergo a process of biological colonization by
fleshy and turf algae, sponges, corals and other encrusting reef biota. Although typically of low
relief, rhodolith deposits produce an environment of high microhabitat availability that can serve
for establishment of a reef community of high biodiversity relative to adjacent habitats.
Colonized rhodolith reefs were observed at the edges of the northern and southern inner slope
and along the deeper sections of the outer shelf slope (Figure 4), occupying a total area of
0.907 km2, or 14.9 % of the study area (Table 1).
1.5 Spur and Groove
Spur and groove coral reef formation was observed at only one sampling station near the edge
of the inner shelf edge (Figure 4). This station was studied because it was the location of the red
hind spawning aggregation. The spur and groove coral reef appears to be a common feature of
the shallow sections of the inner shelf edge, particularly along the southern section of the study
area in the 20 – 27 m depth range, distributed towards the insular shelf, at the boundary of the
mesophotic realm.
1.6 Uncolonized bottom habitats.
Sand patches were observed at the deepest sections of the study area below our diving depth
limit of 50 m. This observation was made while diving at the deep boundaries of the bank coral
reef, but quantitative assessments of its areal cover are not available.

16
Figure 4. Benthic habitat map of Lang Bank, ST. Croix USVI.

17
2.0 Biological Characterization of Mesophotic Benthic Habitats
2.1Sessile-benthic community
2.1.1 Colonized Pavement (CPV)
The relative composition by substrate categories from the 26 transects surveyed at the CPV
habitat is shown in Figure 5. Species-specific data for all transects surveyed is included as
Appendix 1. Benthic algae were the dominant benthic substrate with an overall mean of 61.6%
(range: 35.7 - 95.0%). The encrusting fan alga, Lobophora variegata, was the main taxonomic
component averaging 33.4% or 54.2 % of the benthic algae assemblage (Table 2). Turf algae,
which is a mixed assemblage of short filamentous algae growing as a carpet over the substrate
was present from almost all sites, averaging a reef substrate cover 24.6 %. Brown fleshy
(Stypopodium sp, Dictyota sp), calcareous (Halimeda sp.) and crustose coralline algae were
also identified from the CPV habitat. Blue-green algae, or cyanobacterial films were observed
from 11 out of the 26 transects with a mean of 0.7%. Abiotic substrates, particularly sand,
ranked second in terms of percent substrate cover with a mean of 13.8% (range: 0 – 56.3%).
Sand pockets within the CPV habitat were colonized by cyanobacteria or rhodoliths.
Sponges, represented by 42 species and averaging a reef substrate cover of 7.1 % were the
dominant taxa among sessile-benthic invertebrates of the CPV habitat. The more common
sponges present were the barrel sponge, Xestospongia muta, and an unknown brown
encrusting sponge. The large erect structure of X. muta contributed substantially to the
topographic complexity of the colonized pavement habitat. Barrel sponges were present at 20
transects, averaging 1.3% of the benthic cover.

18
Figure 5. Mean percent composition of substrate categories from a total of 26 transects surveyed at the colonized pavement habitat in Lang Bank, ST. Croix USVI.
Hard corals were represented by a 17 species within transects and averaged a reef substrate
cover of 3.64 % (range: 0 – 19.5 %). Boulder star coral, Orbicella (formerly Montastraea)
franksi, was the dominant species in terms of substrate cover with a mean of 1.6% and was
present in 12 out of the 26 transects surveyed. Lettuce corals (Agaricia spp), mustard hill coral
(Porites astreoides) and massive starlet coral (SIderastrea siderea) were present in at least 10
transects and along with boulder star coral appeared to be the main coral assemblage of the
CPV. The corals exhibited mostly encrusting and/or mound shaped growth and typically
occurred as small, isolated colonies. At the outer shelf-edge ridge, small to moderate sized coral
heads were observed in association with erect and branching sponges, forming sponge-coral
bioherms that were particularly important as microhabitats for spiny lobsters (Panulirus argus).
In other sections of the outer shelf ridge, corals were more abundant within rocky outcrop
substrates and in some areas corals were observed growing together, forming biologically
complex systems with substantial contributions to the overall structural topographic relief. It can
be argued that in many rocky outcrops of the CPV, coral growth significantly increased the value
and function of these habitats as protective structures

19
Table 2. Mean percent cover by substrate categories at the main mesophotic (30–50 m) benthic habitats surveyed by photo transects at Lang Bank, St. Croix, USVI. 2013
Benthic Habitats Substrate categories Colonized Bank Patch
Spur & Groove Colonized
Pavement Coral Reef Coral Reef Coral Reef
Rhodolith Reef
Abiotic Dead coral 0.15 0.36 1.49 1.39 0.21
Pavement 1.39
5.74
0.45 Rhodolith 0.36
0.88
3.88
Rubble 1.00 0.17 3.75 0.18 1.95 Sand 11.23 3.79 24.94 3.13 25.79
Total abiotic 14.14 4.32 36.80 4.70 32.28
Benthic algae Crustose coralline algae 0.47 8.47 0.30 3.08 0.27
Dictyota spp. 0.78 1.40 2.00 2.95 4.50 Halimeda spp. 0.13 0.04 0.08
0.19
Lobophora spp. 33.45 29.47 30.27 15.19 37.65 Macroalgae 2.10 1.18 4.26 2.07 1.03
Stypopodium spp. 0.07
0.71 Turf 24.57 19.90 12.19 40.99 10.41
Total benthic algae 61.57 60.47 49.09 64.28 54.76
Cyanobacteria 0.74 0.27 0.76
0.94
Hard corals Agaricia agaricites 0.08 0.04 0.08 0.17
Agaricia grahamae 0.12 0.65 0.21
0.06 Agaricia lamarcki 0.21 0.42 0.28
0.15
Colpophyllia natans
0.65
2.33 Coral spp. 0.06 0.03 0.10
0.06
Diploria labyrinthiformis 0.03 0.01 Diploria strigosa 0.12
0.04
Diploria strigosa
0.54 0.17 Eusmilia strigosa 0.03 0.05
Leptoseris cucullata
0.04 Madracis decactis 0.17 0.11 0.08 0.50 0.09
Manicina areolata 0.02 Meandrina meandrites 0.08 0.03
0.05
Millepora alcicornis 0.12
0.11 0.17 Millepora alcicornis
0.02
Montastraea cavernosa 0.22 0.42 0.11 0.67
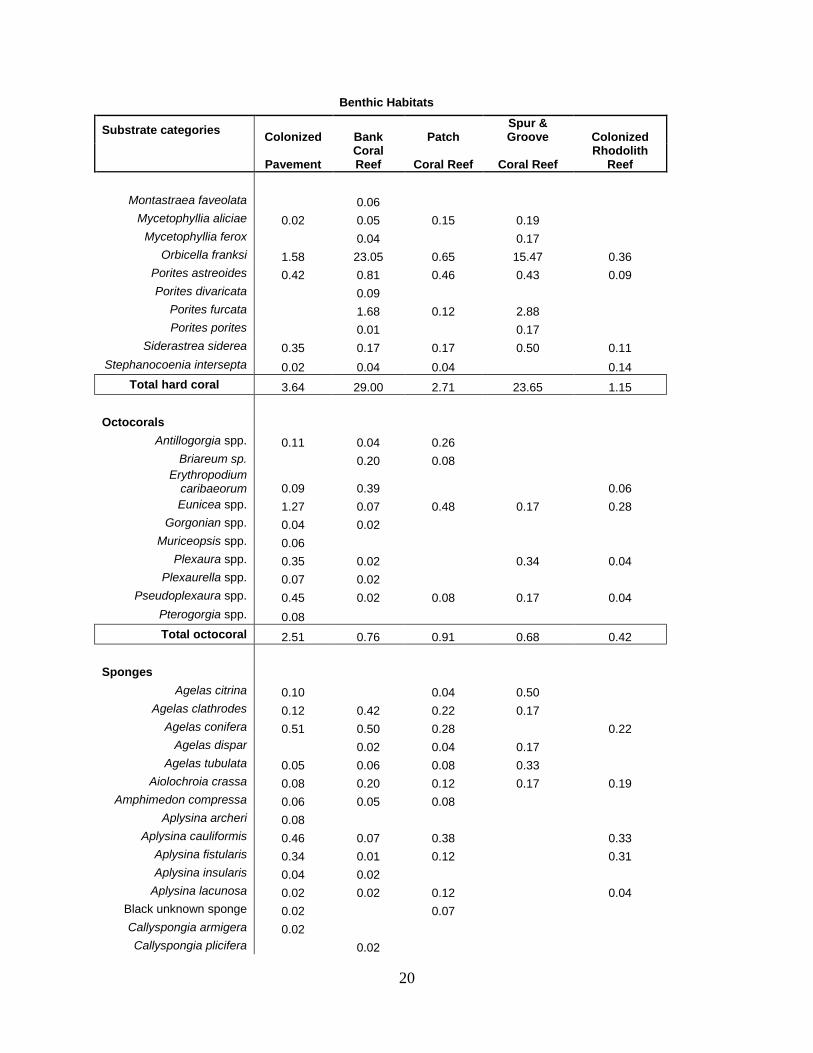
20
Benthic Habitats
Substrate categories Colonized Bank Patch Spur & Groove Colonized
Pavement Coral Reef Coral Reef Coral Reef
Rhodolith Reef
Montastraea faveolata
0.06
Mycetophyllia aliciae 0.02 0.05 0.15 0.19 Mycetophyllia ferox
0.04
0.17
Orbicella franksi 1.58 23.05 0.65 15.47 0.36 Porites astreoides 0.42 0.81 0.46 0.43 0.09 Porites divaricata
0.09
Porites furcata
1.68 0.12 2.88 Porites porites
0.01
0.17
Siderastrea siderea 0.35 0.17 0.17 0.50 0.11 Stephanocoenia intersepta 0.02 0.04 0.04
0.14
Total hard coral 3.64 29.00 2.71 23.65 1.15
Octocorals Antillogorgia spp. 0.11 0.04 0.26
Briareum sp.
0.20 0.08 Erythropodium
caribaeorum 0.09 0.39
0.06 Eunicea spp. 1.27 0.07 0.48 0.17 0.28
Gorgonian spp. 0.04 0.02 Muriceopsis spp. 0.06
Plexaura spp. 0.35 0.02
0.34 0.04 Plexaurella spp. 0.07 0.02
Pseudoplexaura spp. 0.45 0.02 0.08 0.17 0.04 Pterogorgia spp. 0.08
Total octocoral 2.51 0.76 0.91 0.68 0.42
Sponges Agelas citrina 0.10
0.04 0.50
Agelas clathrodes 0.12 0.42 0.22 0.17 Agelas conifera 0.51 0.50 0.28
0.22
Agelas dispar
0.02 0.04 0.17 Agelas tubulata 0.05 0.06 0.08 0.33 Aiolochroia crassa 0.08 0.20 0.12 0.17 0.19
Amphimedon compressa 0.06 0.05 0.08 Aplysina archeri 0.08
Aplysina cauliformis 0.46 0.07 0.38
0.33 Aplysina fistularis 0.34 0.01 0.12
0.31
Aplysina insularis 0.04 0.02 Aplysina lacunosa 0.02 0.02 0.12
0.04
Black unknown sponge 0.02
0.07 Callyspongia armigera 0.02
Callyspongia plicifera
0.02

21
Benthic Habitats
Substrate categories Colonized Bank Patch Spur & Groove Colonized
Pavement Coral Reef Coral Reef Coral Reef
Rhodolith Reef
Chondrilla caribensis
0.11
Cinachyrella kuekenthali 0.24 0.02 0.04
0.04 Clathria schoenus 0.02 0.08 0.04 1.52 0.05
Cliona aprica
0.01 Cliona caribbaea 0.07 0.27
2.17 0.04 Cliona delitrix 0.03 0.01
0.04
Cribrochalina vasculum 0.02
0.03 Ectoplasia ferox 0.05 0.03
Erylus formosus
0.02
0.15 Geodia neptuni 0.34 0.85 0.17 0.69 0.40
Hyrtios cavernosus 0.14 0.20 0.12
0.16 Ircinia campana
0.04
Ircinia felix 0.03
0.07 Ircinia sp.
0.01 0.14
0.04
Ircinia spp. brown 0.03 Ircinia strobilina 0.07 0.01 0.08
0.11
Myrmekioderma gyroderma 0.02
Neopetrosia proxima 0.07 0.03 0.20 0.33 0.22 Niphates digitalis 0.21 0.06 0.07
0.05
Niphates erecta 0.02 Petrosia pellasarca 0.01
0.33 Plakortis angulospiculatus 0.16
0.08
0.26
Plakortis halichondrioides 0.19
0.11
0.19 Plaktoris spp. 0.04 0.02
0.17 0.04
Prosuberites laughlini 0.34 0.03 0.11
0.30 Ptilocaulis walpersi
0.18
Scopalina ruetzleri 0.06
0.17 0.08 Smenospongia conulosa 0.10 0.03 0.03
0.06
Spheciospongia vesparium 0.10
0.12 Spriastrella coccinea 0.18 0.01 0.04
0.23 Suberea sp.
0.03
Svenzea zeai 0.12 0.65 0.11 Topsentia aphirophidites
0.04
Unknown sponge 1.13 0.54 0.93 0.55 0.36 Verongula gigantea 0.03 0.01 0.03
0.09
Verongula reiswigi
0.04 Verongula rigida 0.13 0.01 0.39
0.16 Xestospongia muta 1.27 0.06 1.23
0.90
Total Sponges 7.09 4.36 6.23 6.94 5.28

22
for fish and invertebrate species, which is more consistent with their classification as small coral
reef habitats. Conversely, the CPV habitat present at the insular slope was mostly featureless
with very low density of corals and low topographic relief.
Octocorals (soft corals), represented by nine species were present from 22 transects at the
CPV. The main octocoral genera observed was Eunicea spp., followed by the encrusting soft
coral, Erythropodium caribaeorum. The larger gorgonians such as the Antillogorgia spp.
(formerly Pseudopterogorgia) also contributed to the reef topographic relief, serving as a
physical protective habitat for fishes.
A multidimensional scaling plot of Bray Curtis similarities of community structure within and
between the main sessile-benthic habitats surveyed at Lang Bank is shown in Figure 6.
Statistical analyses of similarities (ANOSIM) within and dissimilarities between benthic habitats
surveyed are included as Appendix 2. The CPV habitat was characterized by relatively low
affinity (high variability) on the relative composition of substrate categories within transects
surveyed (average: 71.3 %). High variability within transects was measured for basically all
substrate categories, but was extreme in the case of abiotic cover (range: 0 – 56.3 %), hard
corals (0 – 19.5 %) and octocorals (0 – 7.8 %). The CPV habitat was distributed throughout a
wide range of depths (30 – 50 m) and slopes (nearly 0 at the reef top to ca. 45 degrees at the
slope) at Lang Bank, which are factors that may influence the structure of benthic communities.
Still, high variability was also observed within transects surveyed at similar reef physiographic
zones, depths and inclinations within the CPV habitat, rendering the relationships between
community structure and depth statistically insignificant (ANOSIM; p > 0.05). Community
structure dissimilarity between CPV and other benthic habitats surveyed at Lang Bank was
highest and statistically significant compared to the bank coral reef (ANOSIM; p < 0.001).
Substrate cover by hard corals was the main contributor to the differences between the CPV
(mean: 3.6 %) and BCR (mean: 29.0 %) habitats (see Appendix 2). Statistically marginal
differences (ANOSIM; p = 0.029) were also evident between the CPV and colonized rhodolith
reef (CRR) habitats. In this case, it was abiotic cover the main contributor to the differences
between habitat types.

23
Figure 6. Multidimensional scaling plot (MDS) of Bray Curtis similarities of community structure within and between the main mesophotic (30 – 50 m) sessile-benthic habitats surveyed at Lang Bank, 2013.
Resemblance: S17 Bray Curtis similarity
HabitaCPV
BCR
PRF
CRR
SAG
SND40
3040
30
40
3040
30
40 4040
40
403030
30
30
40
40 40
3040 40
30
30
5050
40
30
40 30 40
30
40
40
50
40
30
30
40
30
30
30
50
50
40
40
40
40
3030
40
30
4030
50
40
4050
40
40
40
30
30
50
40
40
40
30 30
5050
30
40
30
30
40
40
40
40
40
4040
50
50
2D Stress: 0.14

24
Photo Album 1. Colonized Pavement

25

26

27
2.1.2 Bank Coral Reef (BCR)
Live scleractinian coral was the dominant sessile-benthic invertebrate in terms of
substrate cover at the bank coral reef habitat (Figure 7) with a total of 23 species present
within transects and an average reef substrate cover of 29.0% (range: 10.5 - 55.3%).
Transect specific data of percent substrate cover by benthic categories at the BCR
habitat are included in Appendix 3. The main reef builder and dominant coral species in
terms of substrate cover at the BCR was the boulder star coral, Orbicella franksi. The
mean cover by O. franski was 23.0 % representing 79.3 % of the total cover by
scleractinian corals at the BCR (Table 2). Orbicella franski was observed growing in
table-shaped colonies side by side, sometimes overlapping and producing impressive
continuous live mesophotic coral reef system resembling those described by Smith et al.
(2009) for the MCD Hind Bank in St. Thomas, USVI, and by García-Sais et al. (2011) for
El Seco in Vieques, Puerto Rico. Mustard hill and branched finger corals (Porites
astreoides. P. furcata), lettuce corals (Agaricia grahamae, A. lamarki), Massive starlet
coral (Siderastrea siderea), and great star coral (Montastraea cavernosa) were all
present in more than 10 out of the 33 transects surveyed and along with boulder star
coral represented the main coral assemblage at the BCR.
Figure 7. Mean percent composition of substrate categories from a total of 33 transects surveyed at the Bank Coral Reef habitat in Lang Bank, ST. Croix USVI.
0
10
20
30
40
50
60
70
80
Live Coral Octocoral Sponge Benthic algae Abiotic
Mea
n co
ver
(%)
Benthic categories

28
Sponges, represented by 33 species had a combined substrate cover of 5.1% (range: 0
– 13.8%) at the BCR (Table 2). The leathery barrel sponge, Geodia neptuni, with an
average 0.9% (range: 0 – 5.1%) was the dominant species in terms of reef substrate
cover and was present in 19 out of the 33 transects surveyed. Geodia neptuni, because
of its large size (up to > 1.0 m provides protective microhabitat to a wide variety of small
fishes and invertebrates and is an important food source for the green turtle (Chelonia
midas). In addition to G. neptuni, Svenzea zeai, Agelas conifera, A. clathrodes and an
unidentified brown sponge were present in at least 10 out of the 33 transects surveyed
and comprised the main sponge assemblage of the BCR habitat at Lang Bank (Table 2).
Octocorals (gorgonians) were present but with low substrate cover (mean: 0.8 %) at the
BCR (Table 2). Evidently, scleractinian corals exhibiting laminar growth outcompete the
vertically projected octocorals. The encrusting type, Erythropodium caribaeorum was the
dominant species in terms of reef substrate cover (mean: 0.4%) and was observed in 13
transects (Appendix 2). A total of eight gorgonian species were identified from the BCR.
Benthic algae were found in relatively high abundance, with an overall mean of 60.5%
(range: 30.7 – 80.9 %). The benthic algal assemblage included fleshy brown algae
(Phaeophyta), Lobophora variegata and Dictyota spp., crustose coralline algae
(Rhodophyta), turf (mixed assemblage), and Halimeda spp. Lobophora variegata was
the main component of the benthic algae in terms of reef substrate cover averaging
29.5%% (Table 2). Crustose coralline algae, which acts as a settlement cue for many
benthic organisms was present at all BCR stations, averaging 8.5%. Minor components
of the sessile-benthic community structure included the overgrowing mat tunicate,
Trididemnum solidum.
The MDS plot of Bray-Curtis similarities (Figure 6) showed a clear pattern of high within
station affinities for the BCR stations, with an average similarity of 78.3% (ANOSIM, see
Appendix 2) and separation from other benthic habitat types with exception of the spur
and groove reef. Fleshy macroalgae and hard corals were the main contributors to within
station similarity at the BCR. Statistically significant differences of sessile-benthic
community structure were observed between the BCR and all other benthic habitats
except the spur and groove reef formation (ANOSIM, p < 0.01). Substrate cover by hard
corals and crustose coralline algae were the main factors contributing to community
29
structure differences between benthic habitats. Differences between the BCR and the
PRF were strongly influenced by the higher abiotic cover at the PRF, in addition to the
lower cover of hard corals at the PRF compared to the BCR (Appendix 2).

30
Photo Album 2. Bank Coral Reef

31

32

33
2.1.3 Patch Coral Reef (PCR)
A total of 12 transects were surveyed at the Patch Coral Reef (PCR) habitat in Lang
Bank. The mean percent cover by substrate categories is shown in Figure 8. Species-
specific data for all transects is included as Appendix 4. Benthic algae were the
dominant benthic substrate category with an overall mean of 49.1% (range: 15.0 – 69.3
%). The encrusting fan alga, Lobophora variegata, was the main taxonomic component
averaging 30.3% or 61.7 % of the benthic algae assemblage (Table 2). Turf algae and
brown fleshy macroalgae (including Dictyota sp.) were present in at least 11 transects,
averaging a combined reef substrate cover of 18.5 %. Red crustose coralline algae were
also identified from the PCR habitat. Blue-green algae, or cyanobacterial films were
observed from 7 out of the 12 transects with a mean of 0.8%. Abiotic substrates,
particularly sand, were prominent in terms of percent substrate cover with a mean of
38.9% (range: 18.9 – 70.0%), the highest among benthic habitats at Lang Bank (Table
2). Live scleractinian corals were present in 11 out of the 12 PCR sites surveyed with a
total of 14 species within transects and a mean reef substrate cover of 2.7 % (range: 0 –
6.0%). Orbicella franksi and Porites astreoides with means of 0.6% and 0.5 % were the
dominant coral species in terms of reef substrate cover. Other species that were present
in at least 3 stations included Agaricia lamarcki (0.3%), Siderastrea siderea,
Montastraea cavernosa and Mycetophyllia aliciae.
Figure 8. Mean percent composition of substrate categories from a total of 12 transects surveyed at the Patch Coral Reef habitat in Lang Bank, ST. Croix USVI.
0
10
20
30
40
50
60
70
80
Live Coral Octocoral Sponge Benthic algae Abiotic
Mea
n co
ver
(%)
Benthic categories

34
Sponges, represented by 37 species and averaging a reef substrate cover of 6.2 % were
the dominant taxa among sessile-benthic invertebrates of the PCR habitat. The more
common sponges present were the barrel sponge, Xestospongia muta, and an unknown
brown encrusting sponge. These two species were present in at lest 10 out of the 12
transects surveyed at the PCR. Octocorals (gorgonians) were present at eight transects,
averaging a reef substrate cover of 0.9% (range: 0 – 3.1%) and. The main octocoral
genera observed was Eunicea spp., followed by the bushy soft coral, Antillogorgia spp.
The latter species usually grows in tall, feather-like plumes, and their structure
contributes to the reef topographic relief and complexity, serving as a protective habitat
for fishes.
Benthic community structure at PRF differed significantly from the BCR and the Spur
and Groove (SAG) habitats (Figure 6) (ANOSIM; p < 0.01; Appendix 2). Differences
were mostly related to the much higher proportion of abiotic cover (mostly sand) at the
PRF and the higher substrate cover by live hard corals at the BCR and the SAG. PRF
was more similar in terms of benthic community structure to CPV (colonized pavement)
and CRR (colonized rhodolith reef) (Figure 6). Similarities between these habitats were
largely driven by abiotic, turf algae and macroalgal benthic categories.

35
Photo Album 3. Patch Coral Reef

36

37

38
2.1.4 Spur & Groove (SAG) The spur and groove reef formation consisted of parallel ridges (spurs) running
perpendicular to the shelf-edge separated by sand channels (grooves) of variable
widths. This habitat type was observed to reach mesophotic depths (>30 m) at the
deepest end of its distribution at Lang Bank. Because of its largely neritic distribution
only three transects were surveyed in the vicinity of the red hind (Epinephelus guttatus)
spawning aggregation site. The mean composition (% substrate cover) of sessile-benthic
substrate categories at the spur and groove habitat is shown in Figure 9. Transect data
on percent substrate cover by benthic categories at the SAG habitat are presented in
Appendix 5.
Benthic algae were the dominant substrate category with an overall mean of 64.3 %
(range: 58.8 – 67.2%). A mixed assemblage of short filamentous algae, known as turf
algae was the main component of the benthic algal substrate cover at the SAG
averaging 41.0% (Table 2). The encrusting fan alga, Lobophora variegata, Y-branched
alga, Dictyota spp., unidentified macroalgae, and crustose coralline algae were also
present at all three transects surveyed. Abiotic substrates, particularly sand, was
relatively low in transects, averaging 4.7% (Table 2).
Figure 9. Mean percent composition of substrate categories from a total of 3 transects surveyed at the Spur and Groove Reef habitat in Lang Bank, ST. Croix USVI.
0
10
20
30
40
50
60
70
80
Live Coral Octocoral Sponge Benthic algae Abiotic
Mea
n co
ver
(%)
Benthic categories

39
Among sessile-benthic invertebrates, live scleractinian corals were the dominant
category, averaging 23.4% of the reef substrate cover and were observed in all
transects. A total of 12 species of corals were identified within transects at the spur and
groove habitat (Table 2). Boulder star coral, Orbicella franksi was the most abundant at
the SAG habitat, averaging a reef substrate cover of 15.5 %, or 65.5 % of the total cover
by corals. Other common corals present at the SAG habitat were Porites furcata,
Colpophyllia natans, and Montastraea cavernosa. Orbicella franksi was observed
growing in table-shaped laminar colonies, similar to its growth at the BCR. However,
many of the O. franksi colonies showed old mortality, especially around the border of the
colonies.
Sponges were represented within transects by 12 species, with an overall mean reef
substrate cover of 6.9 % (range: 2.3 – 11.5 %). Encrusting and lobate sponges were
more common at the SAG habitat. Cliona caribbaea was the most abundant species.
Clioniids are efficient excavators of calcareous material, such as corals. Their function
on the reef is important because they are competitors of hard corals for space.
Octocorals (soft corals) were represented by only three species with relatively low
substrate cover (mean: 0.7%). Plexaura spp., Eunicea spp. and Pseudoplexaura spp.
were identified from the SAG habitat.
Transects surveyed at the SAG habitat presented high affinity of benthic community
structure with an average similarity of 81.3%, the highest amongst habitats studied at
Lang Bank (Appendix 2). Compared to other benthic habitats, the SAG was not
significantly different than the BCR habitat (ANOSIM; p = 0.268; Figure 6), presenting
relatively high similarity throughout all major benthic categories. As in the case of BCR,
SAG benthic community was different to CCR (ANOSIM; p = 0.007), PRF (ANOSIM; p =
0.002) and CPV (ANOSIM; p = 0.036). The main contributors to the dissimilarity between
the SAG and other benthic habitats (other than BCR) at Lang Bank were the relatively
high composition of (live) hard coral and the relatively low cover by abiotic substrates.

40
2.1.5 Colonized Rhodolith Reef
Colonized rhodolith reef (CRR) habitats occupied a relatively low areal cover (14.9%)
within the 30 – 50 m mesophotic realm at Lang Bank. Mostly scattered and lightly
colonized rhodolith deposits were observed down the insular slope of the outer shelf
break, particularly along the northern section of the insular slope. This habitat consists of
crustose algal nodules of variable shapes and sizes deposited over an otherwise flat,
relatively homogeneous and gently sloping shelf. The mean substrate cover data for
sessile-benthic categories surveyed at 10 stations within the CRR habitat are presented
in Figure 10. Benthic algae were the dominant category in terms of substrate cover in
most transects with an average of 57.3% (range: 34.9 – 76.0%). Brown fleshy algae,
including the encrusting fan alga, Lobophora variegata, Y branched alga, Dictyota sp.
and turf algae were the main components of the benthic algal assemblage. Crustose
coralline algae were only present in two transects with a mean cover of 0.3% (Table 2).
Cyanobacteria growing over mostly abiotic substrate and macroalgae were present in
five transects, with mean cover ranging from 0.4% to 3.5%. Abiotic substrates ranked
second in terms of reef substrate cover at CRR habitat with an average of 31.0 %.
Extensive and widespread coralline sand pockets interspersed within the rhodolith
Figure 10. Mean percent composition of substrate categories from a total of 10 transects surveyed at the Colonized Rhodolith Reef habitat in Lang Bank, ST. Croix USVI.
0
10
20
30
40
50
60
70
80
Live Coral Octocoral Sponge Benthic algae Abiotic
Mea
n co
ver
(%)
Benthic categories

41
deposits were the main contributor to abiotic cover at the CRR, representing 83.0 % of
the total with a mean cover of 25.8 % (range: 0.9 – 46.9 %). Specific transect data is
included as Appendix 6.
Barrel, branching, and encrusting sponges were present in all 10 transects surveyed at
the CRR. A total of 29 species were identified within photo-transects with a mean reef
substrate cover of 5.3% (range: 1.5 – 13.8%). The giant barrel sponge, Xestospongia
muta was the most prominent species, followed by the leathery barrel sponge, Geodia
neptuni (Table 2). Both barrel sponges were observed in large sizes and contributed to
the overall topographic relief and habitat complexity in an otherwise flat, homogeneous
and structurally featureless habitat. The larger branching and barrel sponges appeared
to be attached to the primary hard ground, not to rhodoliths.
Scleractinian coral richness and cover was low at the CRR, with nine species averaging
1.2% (Table 2). Orbicella franksi, a sister species of the boulder star coral, was the most
prominent species of the assemblage (mean: 0.4%), followed by lettuce coral, Agaricia
lamarcki (mean: 0.2%). Scleractinian corals grew mostly attached to the algal nodules
and were generally of small to very small sizes, contributing very little to the topographic
relief. Octocorals were present in very low abundance and diversity. The overall mean
cover of octocoral at rhodolith reefs was 0.4%. Eunicea spp. and the encrusting
octocoral, Erythropodium caribaeorum, were the most prominent octocorals at this
habitat.
In terms of sessile-benthic community structure, the CRR habitat exhibited relatively high
affinity within transects with an average similarity of 79.7 % (Figure 6; Appendix 2).
Similarity within CRR sampling stations was mostly influenced by the consistently high
substrate cover of fleshy macroalgae and abiotic categories. Conversely, the highest
dissimilarities of the CRR were associated with the BCR and the SAG habitats, where
substrate cover by hard corals was relatively high and abiotic cover was relatively low.

42
Photo Album 4. Colonized Rhodolith Reef
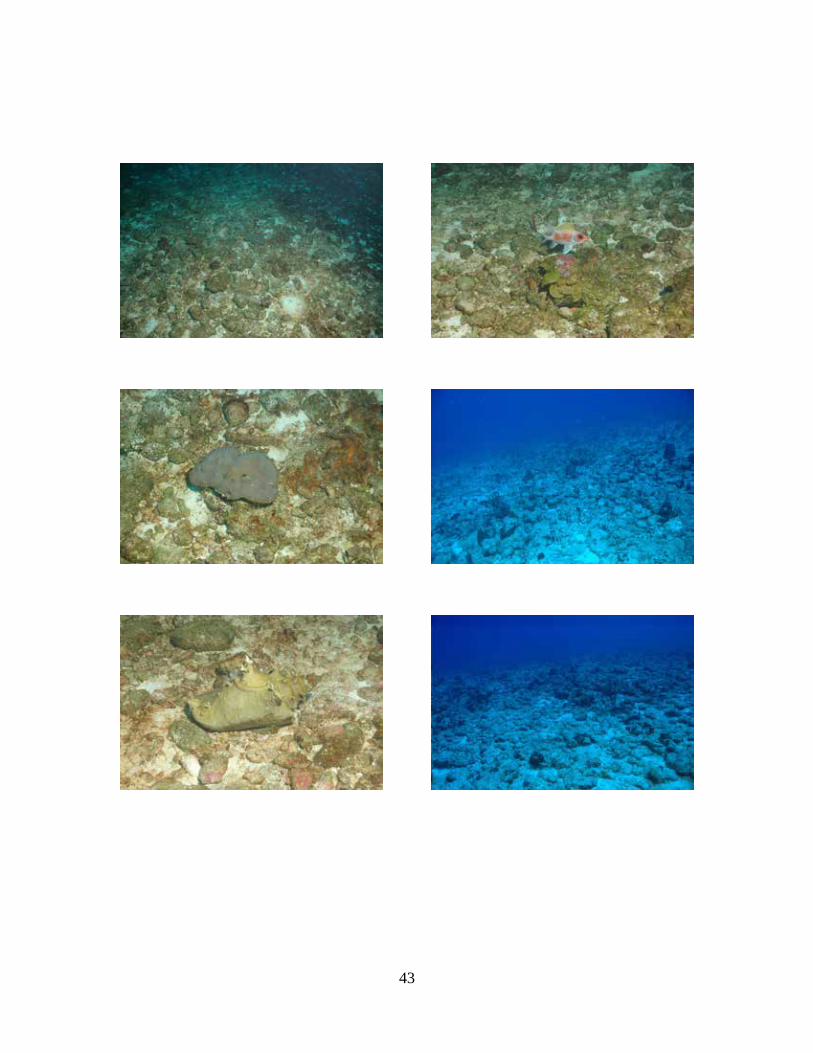
43
44

45
2.2.0 Fish and Shellfish Communities
2.2.1 Colonized Pavement Habitat (CPV)
A total of 50 fish species were identified from the CPV habitat, including 38 within belt-
transects (Table 3). Mean fish density was 23.8 Ind/30 m2. The combined abundance of
seven species represented 73.9 % of the total abundance within transects. The main
fish assemblage included (in descending abundance order) the bicolor damselfish
(Stegastes partitus), Blue and Yellowhead Wrasses (Thalassoma bifasciatum,
Halichoeres garnoti), Blue Chromis (Chromis cyanea), Cherubfish (Centropyge argi)
Princess Parrotfish (Scarus taeniopterus) and the doctorfish (Acanthurus chirurgus).
Species of commercial value included the hogfish (Lachnolaimus maximus), mutton
snapper (Lutjanus analis), yellowfin, Nassau and red hind groupers (Mycteroperca
venenosa, Epinephelus striatus, E. guttatus), great barracuda (Sphyraena barracuda),
lionfish (Pterois sp.) and rainbow parrotfish (Scarus guacamaia).
The top five fish species in terms of abundance were also the most common within the
CPV habitat as they were present in at least 50 % of the transects surveyed (Appendix
7) and along with the Coney (Epinephelus fulva) and the squirrelfish (Holocentrus rufus)
were the main contributors to the within station fish community structure similarity at the
CPV habitat. The aforementioned fish assemblage were also the main contributors to
dissimilarities with the BCR habitat (Figure 10; Appendix 8). The CPV habitat was
characterized by relatively high variability in terms of fish community structure and
statistically significant differences (ANOSIM; p < 0.1) were only found between the CPV
and the BCR habitats (Figure 10). Aside form the sharp differences of community
structure associated with the most abundant fish assemblage, differences were also
influenced by the absence of hamlet species (Hypoplectrus spp) at the CPV habitat and
overall lower densities of masked and peppermint gobies (Coryphopterus personatus, C.
lipernes), graysbe (Epinephelus cruentatus), Spanish hogfish (Bodianus rufus) and
black-bar Soldierfish (Myripristis jacobus) relative to the BCR habitat (Appendix 8).

46
Table 3. Mean abundance of fishes identified within belt-transects from the main benthic habitat types at Lang Bank. 2012-13
SPECIES Common Name CPV BCR CRR Stegastes partitus Bicolor Damselfish 6.35 4.73 9.8
Thalassoma bifasciatum Bluehead Wrasse 4.58 1.79 2.3
Halichoeres garnoti Yellowhead Wrasse 2.08 1.67 1.5 Chromis cyanea Blue Chromis 1.62 5.70 1.1
Centropyge argi Cherubfish 1.08 0.03 2.1
Scarus taeniopterus Princess Parrotfish 0.96 4.88 0.3 Acanthurus chirurgus Doctorfish 0.92 0.33
Epinephelus fulva Coney 0.69 0.21 0.6
Haemulon flavolineatum French Grunt 0.58 0.27 Scarus iserti Stripped Parrotfish 0.50 0.70 Caranx ruber Bar Jack 0.50
Haemulon melanorum Cottonwick 0.46 0.06 0.4 Holocentrus rufus Squirrelfish 0.46 0.30 0.1
Chromis insolata Sunshine Chromis 0.38
0.6
Sparisoma aurofrenatum Redband Parrotfish 0.38 0.85 Elacatinus evelynae Sharknose Goby 0.27 0.73 Halichoeres maculipinna Clown Wrasse 0.23
0.1
Acanthurus coeruleus Blue Tang 0.23 0.24 Serranus tigrinus Harlequin Bass 0.19 0.06 0.3
Sparisoma radians Bucktooth Parrotfish 0.19 0.06 Coryphopterus lipernes Peppermint Goby 0.12 3.09 Acanthurus bahianus Ocean Surgeon 0.08 0.18 0.4
Pomacanthus paru French Angelfish 0.08 0.03 0.3
Canthigaster rostrata Caribbean Puffer 0.08 0.27 0.1 Xanthichthys ringens Sargassum Triggerfish 0.08 0.03 0.1
Chaetodon capistratus Four-eye Butterflyfish 0.08 0.48 Paranthias furcifer Creole Fish 0.08 0.12 Chaetodon striatus Banded Butterflyfish 0.08 0.06 Amblycirrhitus pinos Redspotted Hawkfish 0.08
Chaetodon sedentarius Reef Butterflyfish 0.08 Dasyatis americana Southern Stingray 0.08 Balistes vetula Queen Triggerfish 0.04 X X
Coryphopterus glaucophraenum Bridled Goby 0.04 0.03 0.2 Pomacanthus arcuatus Gray Angelfish 0.04 0.03 0.1
Epinephelus cruentatus Graysbe 0.04 0.24
47
Sparisoma viride Stoplight Parrotfish 0.04 0.24 Chaetodon aculeatus Longsnout Butterflyfish 0.04 0.15 Holacanthus tricolor Rock Beauty 0.04 0.09 Sargocentron coruscus Reef Squirrelfish 0.04
Pterois volitans Lionfish
0.12 X Serranus tabacarius Tobacco Fish
0.03 0.3
Lutjanus buccanella Blackfin Snapper
0.2
Serranus tortugarum Chalk Bass
0.06 0.1 Malacanthus plumieri Sand Tilefish
0.1
Coryphopterus personatus Masked Goby
6.97 Clepticus parrae Creole Wrasse
5.52
Myripristis jacobus Black-bar Soldierfish
0.36 Hypoplectrus puella Barred Hamlet
0.30
Gramma loreto Fairy Basslet
0.30 Melichthys niger Black Durgon
0.27
Mulloidichthys martinicus Yellow Goatfish
0.27 Hypoplectrus chlorurus Yellowtail Hamlet
0.24
Bodianus rufus Spanish Hogfish
0.18 Flammeo marianus Longspine Squirrelfish
0.12
Microspathodon chrysurus Yellowtail Damselfish
0.09 Scarus vetula Queen Parrotfish
0.06
Haemulon sciurus Bluestriped Grunt
0.03 Equetus lanceolatus Jacknife Fish
0.03
Diodon hystrix Porcupinefish
0.03 Holacanthus ciliaris Queen Angelfish
0.03
Lutjanus apodus Schoolmaster Snapper
0.03 Liopropoma rubre Swissguard Basslet
0.03
Sparisoma atomarium
0.03 Lachnolaimus maximus Hogfish X X X
Lutjanus analis Mutton Snapper X X X
Lutjanus mahogany Mahogany Snapper
X Epinephelus striatus Nassau Grouper X X Epinephelus guttatus Red Hind
X X
Elagatis bipinnulata Rainbow Runner
X
Mycteroperca venenosa Yellowfin Grouper X
X Scarus guacamaia Rainbow Parrotfish X
Sphyraena barracuda Great Barracuda X X Pterois sp. Lionfish X X Caranx lugubris Black Jack
X

48
Caranx bartholomaei Yellow Jack
X
Chromis multilineata Yellow-edge Chromis Coryphopterus glaucofraenum Bridled Goby Haemulon sciurus Bluestriped Grunt
X Holacanthus tricolor Rock Beauty
X
Anisotremus virginicus Porkfish
X Malacanthus plumieri Sand Tilefish
X
Seriola rivoliana Almaco Jack
X Scomberomorus regalis Cero Mackerel
X
Ginglymostoma cirratum Nurse Shark
X Invertebrates
Panulirus argus Spiny Lobster X X Strombus gigas Queen Conch X X
Mean Abundance (Ind/30 m2) 23.85 42.79 21.10
Figure 10. Non-dimensional multi-scaling plot (nMDS) of Bray Curtis similarities of fish community structure at the main benthic habitats of Lang Bank, St. Croix, USVI. 2012-13
Transform: Log(X+1)Standardise Variables by MaximumStandardise Samples by TotalResemblance: S17 Bray Curtis similarity
HabitatBCRCPVPRFCRRSAG
3D Stress: 0.18

49
A total of 10 spiny lobsters and 13 queen conch individuals were observed at the CPV
habitat. Spiny lobsters were mostly observed at the outer shelf-edge ridge associated
with small coral heads and aggregated within rocky ledges and crevices. Queen conch
were present at the upper section of the insular slope over mostly abiotic substrates at
depths within the 30 – 40 m range.
2.2.2 Bank Coral Reef (BCR) A total of 70 fish species were identified from the BCR habitat at Lang Bank within the 30
– 50 m depth range, including 53 within belt-transects (Table 3). The mean fish density
was 42.8 Ind/30 m2, the highest among the three main benthic habitats surveyed. The
combined abundance of six species represented 72.2 % of the total individuals within
transects. The main fish assemblage included (in decreasing rank order of abundance)
the masked goby (Coryphopterus personatus), blue chromis (Chromis cyanea), creole
wrasse (Clepticus parrae), princess parrotfish (Scarus taeniopterus), bicolor damselfish
(Stegastes partitus) and peppermint goby (Coryphopterus lipernes). The masked goby is
a small schooling species that was present in small to moderate aggregations of 5 - 50
individuals usually below coral ledges in 12 stations out of the 26 stations surveyed.
Likewise, the creole wrasse was also present in aggregations of up to 100 individuals,
but was only observed in nine stations within belt-transects at the BCR habitat (Appendix
9). Adult creole wrasses formed streaming aggregations swimming over the reef,
whereas juvenile formed combined aggregations with blue chromis within the reef
structure. Bluehead and Yellowhead wrasses (Thalassoma bifasciatum and Halichoeres
garnoti) were both present in 23 out of the 26 stations surveyed.
Fish community structure at the BCR was characterized by relatively high within habitat
affinity with an average similarity of 31.4 %. Within habitat similarity was strongly
influenced by the relatively uniform density of bicolor damselfish, blue chromis,
yellowhead wrasse and princess parrotfish across the 26 sampling stations (see
Appendix 7). Statistically significant differences (ANOSIM; p < 0.1) were found between
the relative abundances of the BCR and all other habitats surveyed at Lang Bank,
except the SAG (spur and groove), where only a few transects were surveyed (Figure
10). The highest dissimilarity was between the BCR and the CRR (colonized rhodolith
reef) at 80.8 %. The fish community at the BCR was more specious than the CRR and

50
other habitats surveyed at Lang Bank. Thus, the occurrence of these species at the BCR
and not at other habitats (e.g. Hypoplectrus spp., Chaetodon spp., Sparisoma spp.,
Clepticus parrae, Holacanthus spp) introduced substantial dissimilarity relative to other
habitats. Conversely, the BCR exhibited lower densities and lower relative abundance of
species that typically occupy small microhabitats in the CRR and PRF habitats, such as
the cherubfish (Centropyge argi), bridled goby (Coryphopterus glaucofraenum) and the
tobacco fish (Serranus tabacarius) (see Appendix 7).
Fish species of commercial value at the BCR habitat included the hogfish (Lachnolaimus
maximus), Mutton and mahogany snappers (Lutjanus analis, L. mahogoni), lionfish
(Pterois sp), Nassau and red hind groupers (Epinephelus striatus, E. guttatus) and the
nurse shark (Ginglymostoma cirratum). The latter species appears to be one of the top
predators of the BCR habitat. Large pelagic piscivores such as the great barracuda
(Sphyraena barracuda), Cero Mackerel (Scomberomorus regalis) and the almaco jack
(Seriola rivoliana) were present at the BCR. Adult spiny lobsters (Panulirus argus) and
queen conch (Strombus gigas) were also observed within the 40 – 50 m depth range at
the BCR.
2.2.3 Colonized Rhodolith Reef (CRR) A total of 30 fish species were identified from the CRR habitat, including 22 within belt-
transects (Table 2). Mean fish density was 21.1 Ind/30m2, the lowest among benthic
habitats at Lang Bank. The bicolor damselfish (Stegastes partitus) was the numerically
dominant species within transects with a mean density of 9.8 Ind/30 m2, representative
of 46.4 % of the total fish density and was present in all 10 transects. Fish survey data
for all transects surveyed at the CRR habitat are included as Appendix 10. The
yellowhead and bluehead wrasses and blue chromis were all present in at least five
transects and along with the bicolor damselfish comprised the main residential fish
assemblage at the CRR. The relatively depauperate fish community at the CRR habitat
is related to the virtual absence of protective structures, such as coral reefs, rock
outcrops, holes, crevices or ledges.
The CRR provides microhabitats associated with the deposit of crustose algal nodules
suited for small fishes, such as bicolor damselfish, cherubfish, and small wrasses and

51
gobies. Fish community structure tends to increase in CRR habitats in relation to the
magnitude of colonization of rhodoliths by hard coral and erect sponges. Higher fish
densities and more biodiverse fish communities associated with CRR habitats have
been previously reported for Desecheo Island (Garcia-Sais et al., 2005), Bajo de Sico
(Garcia-Sais et al., 2007) and Abrir la Sierra (Garcia-Sais et al., 2009), where heavy
colonization by corals, sponges and algal growth has been noted. CRR habitats at Lang
Bank were observed to be lightly colonized, mostly by fleshy algae and small sponges,
with relatively higher substrate cover by abiotic categories, mostly sand.
Fish community structure at the CRR habitat was characterized by low affinity within
sampling stations (Figure 10). Average similarity of fish community (26.1 %) was the
lowest among benthic habitats studied at Lang Bank. This is different from the pattern
previously reported for Desecheo (Des), Bajo de Sico (BDS) and Abrir la Sierra (ALS)
(Garcia-Sais et al., 2005, 2007, 2009) where the CRR habitat has been described as
one of the most uniform within the mesophotic realm in the 30 – 50 m depth range. At
Lang Bank, high variability of the physical habitat was associated with the magnitude of
abiotic cover (mostly sand) and colonization by biota contributing topographic relief.
Because of the high within station variability, differences of fish community structure with
other benthic habitats was only significant relative to the BCR, where the highest cover
by corals and lowest cover by abiotic categories was measured. Even though the
absolute densities by most of the numerically dominant fish species at the CRR habitat
were lower than at the BCR, the relative composition of these species were much higher
at the CRR, thereby contributing substantially to between station dissimilarities (see
Appendix 7). Important exceptions were the higher absolute densities of cherubfish
(Centropyge argi), tobacco fish (Serranus tabacarius) and blackfin snapper (Lutjanus
buccanella) at the CRR relative to the BCR. Considering the consistently high
prevalence of the cherubfish on CRR habitats from Des, BDS and ALS (Garcia-Sais et
al., 2005, 2007, 2009) it can be established that CRR represent a preferred habitat for
this species. The tobacco fish tends to hover over mounds of sand and rubble that were
more common at the CRR that at the BCR, which may have influenced its higher
densities on the former. Occurrence of blackfin snapper at CRR habitats was associated
with several rhodolith deposits found down the insular slope at a depth of 50 m. Small
schools of this insular slope fish penetrated transect areas rising from deeper sections of
the slope, perhaps attracted to diver survey activities.

52
Several demersal fish species of commercial value were present at the CRR habitat.
These included the queen triggerfish (Balistes vetula), mutton and blackfin snappers
(Lutjanus analis, L. buccanella), red hind (Epinephelus guttatus) and yellowfin grouper
(Mycteroperca venenosa). Spiny lobsters (Panulirus argus) and queen conch (Strombus
gigas) were observed at the CRR habitat of Lang Bank. An adult, reproductively active
queen conch population was reported by Garcia-Sais et al. (2009) from CRR habitats at
Abrir La Sierra.
2.3.0 Fishery Independent Surveys A total of 283 fish individuals distributed into 22 species and 77 shellfish individuals
distributed into two species were included in the fishery independent surveys performed
at Lang Bank. The total area surveyed was 13, 200 m2, including the area covered by
the 20 m x 3 m belt-transects and the drift dives performed at each benthic habitat.
Surveys at the CPV and BCR habitats represented approximately 78 % of the total area
surveyed. The complete list of fish/shellfish species reported per benthic habitat, area
surveyed and fish/shellfish size distributions are included as Appendix 11. Only two
shellfish species, the spiny lobster (Panulirus argus) and the queen conch (Strombus
gigas), and four species of fish were represented by more than 15 individuals in fishery
independent surveys at Lang Bank. Fish species represented by more than 15
individuals included the red hind (Epinephelus guttatus), lionfish (Pterois spp), mutton
snapper (Lutjanus analis) and the queen triggerfish (Balistes vetula).
Large groupers and snappers were observed in very low numbers at Lang Bank. Only
one Nassau and two yellowfin groupers were observed from almost 100 stations
surveyed. Cubera and dog snappers (Lutjanus cyanopterus, L. jocu), previously
observed in high densities at El Seco Reef in Vieques and Tourmaline Reef, off
Mayaguez (Garcia-Sais et al., 2009, 2011) were rare at Lang Bank. Tiger groupers
(Mycteroperca tigris), common at El Seco and at BDS (Garcia-Sais et al. 2007, 2009)
were not observed at Lang Bank. It is possible that the high availability of protective
structures at the BCR may have influenced underestimates of large grouper/snapper
densities and sightings, but CPV and CRR habitats at Lang Bank were mostly devoid of
such protective structures. The physical habitat of the outer shelf slope and of rhodolith
reef deposits within the 30 – 50 m depth range were essentially featureless with respect
53
to bottom topography and depauperate with regards to biological substrate colonization.
The lack of physical and biological complexity at these habitats may limit the occurrence
of large demersal fishes because of the virtual absence of prey items and residential
structures. Large parrotfishes included two (2) rainbow parrotfishes (Scarus guacamaia)
observed from the BCR at a depth of 40 m.
Nurse sharks (Ginglymostoma cirratum) were the largest top predators observed from
mesophotic habitats at Lang Bank, consistent with previous reports for El Seco in
Vieques (Garcia-Sais et al., 2010). Nurse sharks were observed from all benthic
habitats, but were more common at the BCR. Great barracudas were the only large
pelagic reef predator observed to be common from mesophotic habitats at Lang Bank.
Also present were low numbers of yellow and bar jacks (Caranx bartholomaei, C. ruber),
blue and rainbow runners (Carangoides crysos, Elagatis bipinnulata) and almaco jack
(Seriola rivoliana).
2.3.1 Lionfish (Pterois sp.) The lionfish, an invasive fish of potential commercial value as food was the most
abundant fish larger than 25 cm (TL) observed within mesophotic habitats at Lang Bank.
It was present in higher densities at the CPV habitat, but was sighted also at the SAG
and BCR habitats (Figure 11). Lionfishes were observed solitary, as pairs and
aggregated in small schools within crevices, gaps, holes, under ledges and essentially
associated with any type of physical structure that could serve as refuge from the
prevailing water current at the CPV habitat. Lionfishes occurred within the entire
mesophotic depth range studied at Lang Bank, but were more common at the upper
insular slope (35 – 40m) close to the shelf-edge and associated with rocky outcrops,
crevices and coral heads. Mostly adult individuals were present, with a strong mode at
30 cm, maximum length at 40 cm, and minimum length at 15 cm (Figure 12). Juvenile
lionfishes were not observed from any mesophotic habitat. The size-frequency
distribution suggests that mostly adult lionfishes inhabit the mesophotic habitats of Lang
Bank, but it may also reflect the fact that there has been low recruitment, or recruitment
failure during the last couple of years for this species in the eastern St. Croix outer shelf
and perhaps elsewhere in the USVI. The present stock appears to be comprised by
large adults individuals remaining from a previously successful year class. A progression
of lionfish size classes appears to be evident from previous surveys of mesophotic

54
Figure 11. Density distribution of lionfish (Pterois sp.) at the various mesophotic benthic habitats surveyed from Lang Bank, St. Croix, USVI. 2012-13
Figure 12. Size frequency distribution of lionfish (Pterois sp.) from all mesophotic benthic habitats surveyed at Lang Bank, St. Croix, USVI. 2012-13

55
habitats at Isla Desecheo (Garcia-Sais et al, 2005), Bajo de Sico (Garcia-Sais et al,
2005) and Abrir la Sierra (Garcia-Sais et al, 2010).
2.3.2 Red hind (Epinephelus guttatus ) Red hinds were observed to be part of the residential fish assemblage at the BCR, SAG
and CPV mesophotic habitats of Lang Bank, with higher densities surveyed from the
BCR (Figure 13). Densities of red hind at Lang Bank are within the range estimated from
visual surveys at other mesophotic habitats within the US Caribbean EEZ (Garcia-Sais
et al, 2012). The size frequency distribution of red hind was strongly skewed to the larger
size classes (Figure 14), suggesting that mostly an adult population was present at
mesophotic habitats of Lang Bank. The mode length at 35 cm, stands as the largest
among mesophotic habitats previously studied (Garcia-Sais et al, 2012). Maximum size
was estimated at 40 cm. Consistent with previous reports of mesophotic habitats,
juvenile red hinds in the 10 – 15 cm (TL) size range were observed from the CRR habitat
at Lang Bank. It is possible that CRR function as recruitment habitats of red hind.
One day before and during the full moon of February, dives were performed at two
different locations where spawning aggregations of red hind had been reported within
the SAG coral reef habitat of Lang Bank at depths of 27 – 30 m. At one of these sites,
ADCP current meter deployment structures were in place, indicative that this site had
been previously monitored, presumably by personnel from the University of the U. S.
Virgin Islands. Red hinds were observed from both of these sites, but aggregations were
not present. Thus, it is possible that spawning occurred at the previous full moons of
December and/or January. The few red hinds observed during February at the SAG
habitat were relatively small and appeared to be spent.
2.3.3 Mutton Snapper (Lutjanus analis) Mutton snapper was the most abundant commercially important snapper observed from
mesophotic habitats at Lang Bank. Higher densities were surveyed from the BCR, but
were present from all benthic habitats studied (Figure 15). Mutton snappers were
typically observed in small schools, but large adult solitary specimens were also present.
Mutton snapper appeared to be one of the top demersal predators at the CRR habitat,

56
Figure 13. Density distribution of red hind (Epinephelus guttatus) at the mesophotic benthic habitats surveyed from Lang Bank, St. Croix, USVI. 2012-13
Figure 14. Size frequency distribution of red hind (Epinephelus guttatus) from mesophotic habitats surveyed at Lang Bank, St. Croix, USVI. 2012-13

57
where it may be feeding from small fishes and invertebrates. Compared to other
mesophotic habitats surveyed from the US Caribbean EEZ (e.g. Bajo de Sico, Isla
Desecheo, Abrir la Sierra, El Seco Reef), densities of mutton snapper at Lang Bank rank
as the highest. Healthy mutton snapper populations appear to need direct physical
connectivity with coastal-neritic recruitment and nursery habitats. It was present in very
low abundance or absent from surveys conducted at oceanic islands, such as Isla
Desecheo and Mona, and present at Abrir la Sierra, El Seco and Lang Bank where
connectivity with coastal habitats such as seagrass beds and mangroves are available
(Garcia-Sais et al, 2012).
The size frequency distribution of mutton snapper from mesophotic habitats at Lang
Bank was skewed towards the large, adult size classes (Figure 16). The mode, at 50 cm
was well over the length at first reproduction, reported as 41 cm TL (Froese and Pauly,
2005). Juvenile mutton snappers were uncommon from any mesophotic habitat and the
minimum size at 30 cm represent specimens that are approaching sexual maturity.
Despite being a fish of high commercial value in Puerto Rico, mutton snapper is not
regarded as a high value fish in the USVI because it is associated with ciguatera
poisoning.
2.3.4 Queen Triggerfish (Balistes vetula) Queen triggerfishes were observed from all mesophotic habitats at Lang Bank, but were
observed in higher densities at the CRR (Figure 17). This is consistent with all previous
surveys (Garcia-Sais et al., 2012 and references therein) that have established that
queen triggerfish is a prominent component of the fish community structure at the CRR
habitat, as it occupies one of the top predator roles. Queen triggerfish may be feeding
on small benthic invertebrates and small fishes that occupy the small microhabitats
present at the CRR. It was observed in lowest densities at the BCR, where it may be
outcompeted by larger groupers, snappers and nurse sharks.
The size frequency distribution of queen triggerfish at mesophotic habitats from Lang
Bank is indicative that these habitats are largely inhabited by the large adult population.
Length at first reproduction of queen triggerfish has been reported at 23 cm (Froese and
Pauly, 2005). The size range of queen triggerfish in this survey was from 25 – 50 cm,

58
Figure 15. Density distribution of mutton snapper (Lutjanus analis) at the mesophotic benthic habitats surveyed from Lang Bank, St. Croix, USVI. 2012-13
Figure 16. Size frequency distribution of mutton snapper (Lutjanus analis) from mesophotic habitats surveyed at Lang Bank, St. Croix, USVI. 2012-13

59
Figure 17. Density distribution of queen triggerfish (Balistes vetula) at the mesophotic benthic habitats surveyed from Lang Bank, St. Croix, USVI. 2012-13
Figure 18. Size frequency distribution of queen triggerfish (Balistes vetula) from mesophotic habitats surveyed at Lang Bank, St. Croix, USVI. 2012-13

60
with a mode at 35 cm (Figure 18). Also, the maximum size reported for this study
approached the maximum size reported for queen triggerfish from the Caribbean Antilles
at 54 cm (Froese and Pauly, 2005), suggesting that the queen triggerfish population at
mesophotic habitats from Lang Bank are not severely overfished.
2.3.5 Queen Conch (Strombus gigas) Queen conch were mostly concentrated on CRR habitats (Figure 19), which have
relatively limited distribution within the 30 – 50 m mesophotic depth range in Lang Bank.
Few individuals were also sighted in the CPV and SAG benthic habitats. Mean density of
queen conch within the CRR habitat at Lang Bank was of approximately 50 Ind/1000m2,
which is higher than previously reported for CRR habitats at Abrir la Sierra during peak
reproductive season (Garcia-Sais et al., 2012). CRR has been shown to be the preferred
habitat of queen conch at mesophotic depths within the 30 – 50 m depth range, and
there is evidence that a reproductively active population exists at depths of 40 m at Abrir
la Sierra (Garcia-Sais et al., 2012). The deep outer shelf basin of Lang Bank has
extensive sections deeper than 50 m and these areas were not surveyed. It is possible
that if CRR habitats prevail in these deep sections, queen conch may be found there.
Otherwise, the low prevalence of queen conch at other mesophotic habitats other than
the CRR appear to constrain their population to a habitat with limited geographical
extension within the 30 – 50 m depth range in Lang Bank.
The size frequency distribution of queen conch in mesophotic habitats of Lang Bank is
skewed towards the (large) adult size ranges, with a minimum size at 21 cm, a strong
mode at 25 cm and maximum length at 27 cm (Figure 20). The size range and mode of
queen conch at Lang Bank is similar to that reported for the CRR mesophotic habitat of
Abrir la Sierra (Garcia-Sais et al., 2012).
2.3.6 Spiny Lobster (Panulirus argus) A total of 31 spiny lobsters were sighted from mesophotic habitats surveyed at Lang
Bank. Densities were highest at the SAG habitat (5 Ind/1000m2), but 71 % of the
individuals were observed at the CPV habitat (Figure 21). Spiny lobsters were mostly
concentrated at the outer shelf-edge ridge at depths of 33 – 38 m associated with coral
heads and crevices in a relatively flat pavement colonized by sponges, gorgonians and

61
Figure 19. Density distribution of queen conch (Strombus gigas) at the mesophotic benthic habitats surveyed from Lang Bank, St. Croix, USVI. 2012-13
Figure 20. Size frequency distribution of queen conch (Strombus gigas) from mesophotic habitats surveyed at Lang Bank, St. Croix, USVI. 2012-13

62
isolated coral heads. Only a couple of spiny lobsters were present at the CPV of the
insular slope at depths below 40m, and none were observed from the CRR. At both of
these sites physical protective microhabitats were mostly lacking. Only one spiny lobster
was observed at the BCR. It is possible that these were not detected due to their cryptic
behavior and the high structural complexity of the BCR system, but high predation
pressure by nurse sharks and/or other large predators may be important.
Overall, density of spiny lobsters at Lang Bank was much higher than any other
mesophotic reef sites previously studied (Garcia-Sais et al., 2005, 2007, 2010, 2012).
Fishing effort at Lang Bank was observed to be relatively low and may be allowing
accumulation of spiny lobsters to a higher concentration than at other mesophotic sites
with similar benthic habitat types. Only a few dozen fish traps were observed within the
entire mesophotic shelf at Lang Bank and diver spear fishermen were not detected. The
physical continuity of mesophotic habitats at Lang Bank with nursery habitats of the
neritic shelf may be influencing the higher density of adult lobsters compared to other
oceanic sites, but more research needs to be addressed to the spiny lobster population
dynamics and the role of mesophotic reef habitats in their life cycles.
The size-frequency distribution of spiny lobster from mesophotic habitats of Lang Bank is
presented in Figure 22. Mostly large juveniles and adults were present. Cephalothorax
length ranged between 16 – 20 cm, with a mode at 18 cm. Several lobster aggregations
were detected and mostly comprised by large juveniles and small adults in the 16 – 18
cm size range, whereas solitary specimens were typically adults of moderate and large
sizes of up to 20 cm cephalothorax length.

63
Figure 21. Density distribution of spiny lobster (Panulirus argus) at the mesophotic benthic habitats surveyed from Lang Bank, St. Croix, USVI. 2012-13
Figure 22. Size frequency distribution of spiny lobster (Panulirus argus) from mesophotic habitats surveyed at Lang Bank, St. Croix, USVI. 2012-13

64
Photo Album 5. Fish and Shellfish Community

65
66
VII. Conclusions Five main benthic habitat types were discovered within the 30 – 50 m depth range at Lang Bank, these include a Bank Coral Reef system (BCR), Colonized Pavement (CPV), Colonized Rhodolith Reef (CRR), Spur and Groove Reef (SAG), and Patch Reef (PRF). The BCR habitat occupied an estimated area of 1.97 km2, or 32 % of the total area surveyed. It is an impressive continuous formation of scleractinian corals, particularly boulder star coral, Orbicella franksi growing at depths of 30 m to at least 50 m (100 – 165’) throughout the deep outer shelf basin of Lang Bank with an average live coral cover of 29.0 %. The most extensive habitat surveyed within the 30 – 50 m depth range corresponded to CPV, with a total area of 2.5 km2, or 41 % of the total area surveyed. Continuous sections of CPV habitat were found associated with the reef tops of the inner and outer shelf edge, and down the outer shelf insular slope. The SAG was observed to be largely a neritic habitat that extended just to the shallow margin of the mesophotic realm at a depth of 30 m in some of its deepest sections and thus, not properly addressed by this study. It is the habitat where spawning aggregations of red hind (Epinephelus guttatus) had been reported. PRFs were mostly found near the boundaries of the BCR at the deep basin walls. These were more common at the inner slope of the outer shelf break and covered a total estimated area of 0.57 km2, or 9.3 % of the total area surveyed. CRR habitats were observed mostly down the insular slope of the outer shelf break. A few patches were observed as well near the edges of the deep basin and in small sections of the BCR. The areal extension of CRR habitat was estimated as 0.9 km2, or 14.9 % of the surveyed area. Based on its relatively high composition of live coral cover and high within habitat affinity or similarity, the BCR was statistically different in terms of sessile-benthic community structure to all other mesophotic habitat types at Lang Bank within the 30 – 50 m depth range. The CPV, PRF and CRR benthic habitats were characterized by relatively low affinity (high variability) on the relative composition of substrate categories within stations. High variability within transects was measured for abiotic cover, live corals and octocorals. The CPV and CRR habitats were distributed throughout a wide range of depths (30 – 50 m) and slopes, factors that may have influenced benthic community structure. The sessile-benthic invertebrate community observed from mesophotic habitats at Lang Bank included altogether, a total of 26 spp of hard corals, 10 genera of octocorals, and at least 53 sponge spp. identified. The reef fish community was comprised by at least 87 spp, distributed into 25 families. The highest densities (42.8 Ind/30 m2) and species richness (70 spp) were surveyed from the BCR.

67
Fish community structure at the BCR was characterized by relatively high within habitat affinity with an average similarity of 31.4 %. Within habitat similarity was strongly influenced by the relatively uniform density of bicolor damselfish (Stegastes partitus), blue chromis (Chromis cyanea), yellowhead wrasse (Halichoeres garnoti) and princess parrotfish (Scarus taeniopterus). Statistically significant differences were found between the relative abundances of fishes at the BCR and all other habitats surveyed at Lang Bank. The highest dissimilarity resulted between the BCR and the CRR (colonized rhodolith reef) at 80.8 %. The fish community at the BCR was more specious than the CRR and other habitats surveyed at Lang Bank. The higher densities and species richness at the BCR appear to be associated with the higher benthic habitat complexity and rugosity. Fish community structure at the CPV, PRF, and CRR habitats were characterized by relatively low affinity (high variability) within sampling stations, influenced by the high variability of reef physiographic conditions in terms of depth, topographic relief and slope. A total of 283 fish individuals distributed into 22 species and 77 shellfish individuals distributed into two species were included in the fishery independent surveys performed at Lang Bank. The total area surveyed was 13, 200 m2. Surveys at the CPV and BCR habitats represented approximately 78 % of the total area surveyed. Large groupers and snappers were observed in very low numbers at Lang Bank. It is possible that the high availability of protective structures at the BCR may have influenced underestimates of large grouper/snapper densities and sightings, but CPV and CRR habitats at Lang Bank were mostly devoid of such protective structures. The lack of physical and biological complexity at these habitats may limit the occurrence of large demersal fishes because of the virtual absence of prey items and residential structures. Nurse sharks (Ginglymostoma cirratum) were the largest top predators observed from mesophotic habitats at Lang Bank. The lionfish (Pterois sp), an invasive fish of potential commercial value as food was the most abundant fish larger than 25 cm. Lionfishes (Pterois sp) occurred within the entire mesophotic depth range studied at Lang Bank, but were more common at the upper insular slope (35 – 40m) close to the shelf-edge, and associated with rocky outcrops, crevices and coral heads. Red hinds were observed to be part of the residential fish assemblage at the BCR, SAG and CPV mesophotic habitats of Lang Bank, with higher densities surveyed from the BCR. Densities of red hind at Lang Bank are within the range estimated from visual surveys at other mesophotic habitats within the US Caribbean EEZ. Mutton snapper (Lutjanus analis) was the most abundant commercially important snapper observed from mesophotic habitats at Lang Bank. Higher densities were surveyed from the BCR, but were present from all benthic habitats studied. Queen conch (Strombus gigas) were observed in very high concentrations (up 50 Ind/1000m2), but mostly concentrated on CRR habitats, which have relatively limited distribution within the 30 – 50 m mesophotic depth range in Lang Bank. The size frequency distribution was strongly skewed towards the larger size classes, indicative

68
that mesophotic habitats at Lang Bank, particularly the CRR functions as an important habitat for adult queen conch. Spiny lobsters (Panulirus argus) were highly abundant at Lang Bank, particularly at the CPV habitat, where densities of up to 5 Ind/1000m2 were surveyed. Spiny lobsters were mostly concentrated at the outer shelf-edge ridge at depths of 33 – 38 m associated with coral heads and crevices in a relatively flat pavement colonized by sponges, gorgonians and isolated coral heads.
VIII. Literature Cited Armstrong, R., H. Singh, J. Torres, R. Nemeth, A. Can, C. Roman, R. Justice, L. Riggs, and G.
García-Moliner. (2006). Characterizing the deep insular shelf coral reef habitat of the Hind Bank Marine Conservation District (US Virgin Islands) using the SeaBED Autonomous Underwater Vehicle. Continental Shelf Research 26: 194-205
Beets, J. and A. Friedlander. 1997. Evaluation of the spawning aggregation closure for red hind
(Epinephelus guttatus), St. Thomas, US Virgin Islands. Report to the Caribbean Fishery Management Council, San Juan, P. R., 17 p.
Colin, P. L. 1974. Observation and collection of deep reef fishes off the coasts of Jamaica and
Honduras. Marine Biology 24 (1): 29-38 Colin, P. L. 1976. Observation of deep reef fishes in the Tongue-of-the-Ocean, Bahamas. Bull.
Mar. Sci. 26: 603-605 García-Sais, J. R., J. Sabater, R. Esteves and M. Carlo. 2012. Fishery independent survey of
commercially exploited fish and shellfish populations from mesophotic reefs within the Puertorrican EEZ. Final Report submitted to the CFMC/NOAA. 88 pp
García-Sais, JR. 2010. Reef habitats and associated sessile-benthic and fish assemblages
across a euphotic-mesophotic depth gradient in Isla Desecheo, Puerto Rico, Coral reefs 29: 277-288.
García-Sais, J. R., J. Sabater-Clavell, R. Esteves and M. Carlo. 2012. Fishery Independent
survey of commercially exploited fish and shellfish populations from mesophotic reefs within the Puertorrican EEZ. Final Report submitted to the CFMC/NOAA. 93 p.
García-Sais, J. R., J. Sabater-Clavell, R. Esteves, J. Capella and M. Carlo. 2011.
Characterization of benthic habitats and associated coral reef communities at El Seco, southeast Vieques, Puerto Rico. Final Report submitted to the CFMC/NOAA. 102 p.
García-Sais, J. R., R. Castro, J. Sabater, S. Williams and M. Carlo. 2010. Characterization of
benthic habitats and associated reef communities at Abrir La Sierra, Puerto Rico. Final Report submitted to the CFMC/NOAA. 115 p.
García-Sais, J. R., R. Castro, J. Sabater and M. Carlo. 2007. Characterization of benthic habitats
and associated reef communities at Bajo de Sico Seamount, Mona Passage, Puerto Rico. Final Report submitted to the CFMC/NOAA. 91 p.

69
García-Sais, J. R., R. Castro, J. Sabater and M. Carlo. 2005 b. Inventory and atlas of corals and coral reefs from the U. S. Caribbean EEZ (Puerto Rico and the United States Virgin
Islands). Final Report submitted to the CFMC/NOAA. 215 p. Menza, C., M. Kendall, C. Rogers, and J. Miller. 2007. A deep reef in deep trouble. Continental
Shelf Research. 27: 2224-2230. Nelson, W. R. and R. S. Appeldoorn. 1985. Cruise Report R/V Seward Johnson. A submersible
survey of the continental slope of Puerto Rico and the U. S. Virgin Islands. Report submitted to NOAA, NMFS, SEFC, Mississippi Laboratories. University of Puerto Rico, Department of Marine Sciences. 76 p.
Nemeth, R. S., T. B. Smith, J. Blondeau, S. Herzlieb, and E. Kadison. 2007. Spatial and temporal
patterns of movement and migration at spawning aggregations of red hind, Epinephelus guttatus, in the U. S. Virgin Islands. Environ. Biol. Fishes, 78: 365-381.
Nemeth, R. S., T. B. Smith, J. Blondeau, E. Kadison, J. M. Calnan, and J. Gass. 2008.
Characterization of deep water reef communities within the Marine Conservation District, St. Thomas, U. S. Virgin Islands. Final Report submitted to the Caribbean Fishery Management Council, (CFMC), San Juan, Puerto Rico.
Nemeth, R. S., S. Herzlieb, and J. Blondeau. 2006. Comparison of two seasonal closures for
protecting red hind spawning aggregations in the U. S. Virgin Islands. Proc. 10th Int Coral Reef Conf. 4: 1306-1313
Nemeth, R. S. 2005. Population characteristics of a recovering US Virgin Islands red hind
spawning aggregation following protection. Mar. Ecol. Progr. Ser., 286: 81-97 Prada, M. 2003. Delineation of benthic habitats from side scan sonar mosaics from the marine
conservation district St. Thomas, Lang Bank and mutton snapper closed area in St. Croix, US Virgin Islands. Geophysique GPR International, Inc. Report to the CFMC. San Juan. 19 pp.
Singh, H., R. Armstrong, F. Gilbes, R. Eustice, C. Roman, O. Pizarro and J. Torres. 2004.
Imaging coral I: Imaging coral habitats with the Seabed AUV. Subsurface Sensing Technologies and Applications. 5 (1): 25-42
Smith, T. B., J. Blondeau, R. S. Nemeth, S. J. Pitman, J. M. Calnan, E. Kadison, J. Gass. 2010.
Benthic structure and cryptic mortality in a Caribbean mesophotic coral reef bank system, the Hind Bank Marine Conservation District, U.S. Virgin Islands. Coral Reefs, 29:
Tobias, W., Toller, W., Ventura, W. and Rivera, H. 2002. SEAMAP – C USVI. St. Croix fisheries
independent trap and line survey. Caribbean/NMFS Cooperative SEAMAP Program. April 1, 2000 – August 31, 2002. NAO7FS0100-1. Division of Fish and Wildlife, Department of Natural Resources, USVI. 12 pp.
70
IX. Appendices
Appendix 1. Percent substrate cover by sessile-benthic categories from stations/transects surveyed at the Colonized Pavement Habitat in Lang Bank. 2012-13
Substrate categories
Spawn 2 IW48 IW47 IW49 IW50 DB13-
30m DB13-30m DB18 DB15 844 OW77
Abiotic
Sand 18.22 32.57 24.29 48.72 13.64 13.73 3.45 32.89 14.23 4.88 43.87
Pavement
1.5
11.54
3.48
13.52 5.78 0.4
Rubble 0.89 3.43 0.5 7.42 1.28
0.9 6.67 0.44 0.89 2.43
Dead coral
1.15
0.11 0.33
1.79 0.55 Total abiotic 19.11 37.15 26.29 56.25 26.81 13.73 7.9 41.34 28.74 11.55 46.7
Rhodolith
7.22
Benthic algae Lobophora spp. 64 21.71 43.51 2.24 47.41 55.29 65.05 45.78 42.59 57.25 3.85
Turf 1.78 7.43 1.5 0.67 1.2 5.58 4.57 2.22 2.67 6.22 Macroalgae 1.33 19.43 8.6 8.67 2.2 3.56
4 0.44 0.44 4.8
Dictyota spp.
1.14 7.58 5.42 1.52
0.57 0.44
0.44 1.2 Crustose
coralline algae 1.78
1
1.56 0.57
0.89 0.44
Halimeda spp.
1.71 0.5 0.67 0.5 Stypopodium
spp. Total benthic
algae 68.89 51.42 62.69 35.67 52.47 65.99 70.76 52.44 46.59 64.79 36.85
Cyanobacteria 0.89 3.43 1.5 2.69 3.2 1 2.29 0.44 1.35 1.35 1.2
Hard corals Orbicella franksi 1.33
1.5
4.54 3.43
4.19 2.22
Porites astreoides
0.5 1.53 0.57 0.44 2.74
0.4
Siderastrea siderea 0.44 0.57
1.5
0.44 0.89 1.35
Montastraea cavernosa 0.89
0.53
0.44 0.44 0.44
Agaricia lamarcki
0.6
Madracis decactis
1.28
1.33 0.44
Agaricia grahamae 0.44 1.14
0.5 0.57
Millepora alcicornis
0.5
0.89
Diploria strigosa
0.5
0.89 Meandrina
meandrites
0.44

71
Agaricia agaricites
0.44
Coral spp. 0.44 0.57 Diploria
labyrinthiformis
0.89
Eusmilia strigosa
Mycetophyllia aliciae
0.46
Manicina areolata
Stephanocoenia intersepta
Total hard coral 3.56 2.29 2 2.42 8.56 5.17 2.22 9.85 7.13 0.4
Octocoral Eunicea spp. 0.44
1.36 3.42 1.53 3.48
2.26 0.44
Pseudoplexaura spp.
2.28 1.5
1.78 2.28
Plexaura spp. 0.89 1.14
1.36 0.5 0.54 Antillogorgia
spp.
0.5
Erythropodium caribaeorum 0.44
1
0.54
0.44
Pterogorgia spp.
0.5 Plexaurella spp. 0.44
Muriceopsis spp.
0.5
0.53
Gorgonian spp.
0.67 Total octocoral 2.22 1.14 1.5 3.39 7.83 4.18 3.48 4.48 2.72
Sponge Xestospongia
muta 0.89 1.14
1.5 0.5 1.71 0.89
2.22 2.42
Unknown sponge 0.89 0.57 0.5 1.33 2 3.16 1.14 0.44 1.81
0.8
Agelas conifera
2.95
0.46 2.67 Aplysina
cauliformis 0.44
1
1.33
Prosuberites laughlini
0.57
0.67
0.4
Geodia neptuni
0.5 1.14 0.44
0.46 Aplysina
fistularis
1 0.5
0.44 2.17
Cinachyrella kuekenthali 1.33 0.57
0.4
Niphates digitalis
0.57
1.5
Plakortis halichondrioides
0.5
1.8 1.33 0.4
Spriastrella coccinea
1.28
Plakortis angulospiculatus
1
1.76
0.44
Hyrtios cavernosus
0.4
Verongula rigida
2.5 Agelas
clathrodes 1.33
0.44 0.44
Svenzea zeai

72
Smenospongia conulosa 0.44
0.53
Spheciospongia vesparium
0.89 0.89
Agelas citrina
0.89 Aiolochroia
crassa
0.57
0.46
Aplysina archeri
1
0.53
0.44 Neopetrosia
proxima
0.53
0.89
Ircinia strobilina
0.57
0.44 0.89 Cliona
caribbaea
0.5
1.33
Amphimedon compressa
0.44
Scopalina ruetzleri
Agelas tubulata
0.5
0.8
Ectoplasia ferox Plaktoris spp.
0.53
0.57 Aplysina
insularis Cliona delitrix
0.44 Ircinia felix
0.44
Verongula gigantea
Ircinia spp. brown
Aplysina lacunosa
0.57
Cribrochalina vasculum
0.57
Callyspongia armigera
0.44
Clathria schoenus
0.44
Myrmekioderma gyroderma
Black unknown sponge
Niphates erecta Petrosia
pellasarca Total sponges 5.33 4.57 6.03 2 8.87 6.66 10.42 3.56 8.98 12.46 7.78
Abiotic
Sand 0.5
0.8
2.4 7.27
0.4
3.5 6.67
Pavement Rubble
0.44
Dead coral Total abiotic 0.5
0.8
2.4 7.27
0.4
3.5 7.11
Rhodolith
0.8
1.33
Benthic algae

73
Lobophora spp. 63 75.11 12 24 32.8 5.55 56 7 58.67 48.5 1.22
Turf 5 14.67 7.4 71 54 32.3
6 31.6 18 27.33 42.5 65.33
Macroalgae
0.73
0.4 Dictyota spp.
0.5
Crustose coralline algae 3.5
0.73
0.5 Halimeda spp.
Stypopodium spp.
0.36
Total benthic algae 71.5
89.78 82.4 95 86.8 84.7
3 87.6 88.4 86 92 75.56
Cyanobacteria
Hard corals Orbicella franksi 14.
5 0.44 3.2
0.8
Porites astreoides
1.2
0.89
Siderastrea siderea
0.4
0.8
1.33
Montastraea cavernosa 1
0.4
0.5 Agaricia lamarcki 3.5
0.5
0.8
Madracis decactis
0.44 Agaricia grahamae 0.5
Millepora alcicornis
0.8
0.4
0.44
Diploria strigosa
0.8 Meandrina meandrites
1.33
Agaricia agaricites
0.44
0.89
Coral spp. Diploria labyrinthiformis Eusmilia strigosa
0.4
0.33 Mycetophyllia aliciae
Manicina areolata
0.44
Stephanocoenia intersepta
0.4
Total hard coral 19.5 1.33 6 0.5 0.8 2.4 1.2 0.33 0.5 5.33
Octocoral
Eunicea spp.
0.4
1.45 3.6 0.8 3.33 0.5 0.44
Pseudoplexaura spp.
0.8
0.4 1
0.89
Plexaura spp.
0.4 0.5 0.8
0.89
Antillogorgia spp.
0.44 Erythropodium
caribaeorum

74
Pterogorgia spp.
0.4
0.67
0.44
Plexaurella spp.
0.5 Muriceopsis spp.
0.4
Gorgonian spp.
0.4 Total octocoral 2 0.5 1.2 1.45 4 1.2 5 1 3.11
Sponge Xestospongia muta
4 1.6 1 2.4 1.45
0.4 2.33 0.5 2.67
Unknown sponge
0.89 1.6
2 1.45 0.8 4.4 0.33 Agelas conifera
1.33 0.8
0.8 0.36 0.8 0.4
Aplysina cauliformis
0.4 1 0.4
0.4 0.4 0.67
0.89
Prosuberites laughlini
0.4
1.2 0.4 3.33 1 0.44
Geodia neptuni 2
0.4
0.4 0.36 0.8 Aplysina fistularis
0.89
1 0.8
0.67
0.44
Cinachyrella kuekenthali
1.33
0.4 0.8 Niphates digitalis
0.4 1
0.36
0.4
0.44
Plakortis halichondrioides
0.4 Spirastrella coccinea
0.4
0.67 0.5 0.89
Plakortis angulospiculatus
0.4
0.44
Hyrtios cavernosus 2
0.67 Verongula rigida
0.8
Agelas clathrodes 0.5
0.44
Svenzea zeai 2
0.4
0.73 Smenospongia conulosa 0.5
0.8
Spheciospongia vesparium
0.4 Agelas citrina 0.5
0.8
0.36
Aiolochroia crassa 0.5
0.44
Aplysina archeri Neopetrosia proxima 0.5
Ircinia strobilina Cliona caribbaea Amphimedon compressa
0.4
0.4
0.44
Scopalina ruetzleri Agelas tubulata Ectoplasia ferox
1.2 Plaktoris spp.
Aplysina insularis
1 Cliona delitrix
0.4
Ircinia felix
0.36 Verongula gigantea
0.4
Ircinia spp. brown
0.73 Aplysina lacunosa

75
Cribrochalina vasculum Callyspongia armigera Clathria schoenus Myrmekioderma
gyroderma
0.44
Black unknown sponge Niphates erecta
0.4 Petrosia pellasarca
0.36
Total sponges 8.5 8.89 8.8 4 8 6.55 6 8.8 8.67 3 7.56
Substrate categories DB
4 OW51 OW52 OW5
3 OW5
4 OW5
6 OW5
7 OW5
9 OW6
0 OW63 OW55
Abiotic
Sand 0.5
0.8
2.4 7.27
0.4
3.5 6.67
Pavement Rubble
0.44
Dead coral Total abiotic 0.5
0.8
2.4 7.27
0.4
3.5 7.11
Rhodolith
0.8
1.33
Benthic algae Lobophora spp. 63 75.1
1 12 24 32.8 5.55 56 7 58.67 48.5 1.22
Turf 5 14.67 7.4 71 54 32.3
6 31.6 18 27.33 42.5 65.33
Macroalgae
0.73
0.4 Dictyota spp.
0.5
Crustose coralline algae 3.5
0.73
0.5 Halimeda spp.
Stypopodium spp.
0.36
Total benthic algae 71.5
89.78 82.4 95 86.8 84.7
3 87.6 88.4 86 92 75.56
Cyanobacteria
Hard corals Orbicella franksi 14.
5 0.44 3.2
0.8
Porites astreoides
1.2
0.89
Siderastrea siderea
0.4
0.8
1.33
Montastraea cavernosa 1
0.4
0.5 Agaricia lamarcki 3.5
0.5
0.8
Madracis decactis
0.44 Agaricia grahamae 0.5

76
Millepora alcicornis
0.8
0.4
0.44
Diploria strigosa
0.8 Meandrina meandrites
1.33
Agaricia agaricites
0.44
0.89
Coral spp. Diploria labyrinthiformis Eusmilia strigosa
0.4
0.33 Mycetophyllia aliciae
Manicina areolata
0.44
Stephanocoenia intersepta
0.4
Total hard coral 19.5 1.33 6 0.5 0.8 2.4 1.2 0.33 0.5 5.33
Octocoral
Eunicea spp.
0.4
1.45 3.6 0.8 3.33 0.5 0.44
Pseudoplexaura spp.
0.8
0.4 1
0.89
Plexaura spp.
0.4 0.5 0.8
0.89
Antillogorgia spp.
0.44 Erythropodium
caribaeorum Pterogorgia spp.
0.4
0.67
0.44
Plexaurella spp.
0.5 Muriceopsis spp.
0.4
Gorgonian spp.
0.4 Total octocoral 2 0.5 1.2 1.45 4 1.2 5 1 3.11
Sponge Xestospongia muta
4 1.6 1 2.4 1.45
0.4 2.33 0.5 2.67
Unknown sponge
0.89 1.6
2 1.45 0.8 4.4 0.33 Agelas conifera
1.33 0.8
0.8 0.36 0.8 0.4
Aplysina cauliformis
0.4 1 0.4
0.4 0.4 0.67
0.89
Prosuberites laughlini
0.4
1.2 0.4 3.33 1 0.44
Geodia neptuni 2
0.4
0.4 0.36 0.8 Aplysina fistularis
0.89
1 0.8
0.67
0.44
Cinachyrella kuekenthali
1.33
0.4 0.8 Niphates digitalis
0.4 1
0.36
0.4
0.44
Plakortis halichondrioides
0.4 Spriastrella coccinea
0.4
0.67 0.5 0.89
Plakortis angulospiculatus
0.4
0.44
Hyrtios cavernosus 2
0.67

77
Verongula rigida
0.8 Agelas clathrodes 0.5
0.44
Svenzea zeai 2
0.4
0.73 Smenospongia conulosa 0.5
0.8
Spheciospongia vesparium
0.4 Agelas citrina 0.5
0.8
0.36
Aiolochroia crassa 0.5
0.44
Aplysina archeri Neopetrosia proxima 0.5
Ircinia strobilina Cliona caribbaea Amphimedon compressa
0.4
0.4
0.44
Scopalina ruetzleri Agelas tubulata Ectoplasia ferox
1.2 Plaktoris spp.
Aplysina insularis
1 Cliona delitrix
0.4
Ircinia felix
0.36 Verongula gigantea
0.4
Ircinia spp. brown
0.73 Aplysina lacunosa
Cribrochalina vasculum Callyspongia armigera Clathria schoenus Myrmekioderma
gyroderma
0.44
Black unknown sponge Niphates erecta
0.4 Petrosia pellasarca
0.36
Total sponges 8.5 8.89 8.8 4 8 6.55 6 8.8 8.67 3 7.56

78
Substrate categories OW58 OW61 OW64 OW67 Mean
Abiotic
Sand 1.2 2 3.5 13.2 11.228
Pavement
1.393
Rubble
0.8 1.003
Dead coral
0.151
Total abiotic 1.2 2 3.5 14 13.779
Rhodolith
0.360
Benthic algae
Lobophora spp. 9.2 5 21 2 33.451
Turf 68 33.5 61.5 72.8 24.570
Macroalgae
2.100
Dictyota spp.
1.5
0.781
Crustose coralline algae 1.2
0.468
Halimeda spp.
0.130
Stypopodium spp.
1.5
0.072
Total benthic algae 78.4 86.5 82.5 74.8 71.943
Cyanobacteria
0.744
Hard corals
Orbicella franksi
4.5 0.5
1.583
Porites astreoides 0.8 0.5 0.5 0.8 0.418
Siderastrea siderea 0.8
0.5
0.347
Montastraea cavernosa 1.2
0.225
Agaricia lamarcki
0.208
Madracis decactis 0.8
0.165
Agaricia grahamae
0.121
Millepora alcicornis
0.117
Diploria strigosa
0.8 0.115
Meandrina meandrites 0.4
0.083
Agaricia agaricites
0.4 0.083
Coral spp.
0.5
0.058
Diploria labyrinthiformis
0.034
Eusmilia strigosa
0.028
Mycetophyllia aliciae
0.018
Manicina areolata
0.017
Stephanocoenia intersepta
0.015
Total hard coral 4 5 2 2 3.634

79
Octocoral
Eunicea spp. 3.6 1 4.5 0.4 1.267
Pseudoplexaura spp. 0.4
0.4 0.451
Plexaura spp. 1.2
0.8 0.347
Antillogorgia spp. 0.8 0.5 0.5
0.105
Erythropodium caribaeorum
0.093
Pterogorgia spp.
0.077
Plexaurella spp. 0.4 0.5
0.071
Muriceopsis spp.
0.055
Gorgonian spp.
0.041
Total octocoral 6.4 2 5 1.6 2.515
Sponge
Xestospongia muta
1 2 2.4 1.270
Unknown sponge 2.4 0.5
2.4 1.131
Agelas conifera 2
0.8 0.514
Aplysina cauliformis 2.4
2.5
0.455
Prosuberites laughlini
0.5
0.343
Geodia neptuni
1 0.5 0.8 0.338
Aplysina fistularis 0.4
0.5
0.339
Cinachyrella kuekenthali 0.8 0.5
0.236
Niphates digitalis 0.4
0.4 0.210
Plakortis halichondrioides 0.4
0.186
Spirastrella coccinea 0.4 0.5
0.178
Plakortis angulospiculatus
0.155
Hyrtios cavernosus
0.5
0.137
Verongula rigida
0.127
Agelas clathrodes
0.121
Svenzea zeai
0.120
Smenospongia conulosa 0.4
0.103
Spheciospongia vesparium 0.4
0.099
Agelas citrina
0.098
Aiolochroia crassa
0.076
Aplysina archeri
0.076
Neopetrosia proxima
0.074
Ircinia strobilina
0.073
Cliona caribbaea
0.070
Amphimedon compressa
0.065
Scopalina ruetzleri
0.5 1
0.058
Agelas tubulata
0.050
Ectoplasia ferox
0.046
Plaktoris spp.
0.042

80
Aplysina insularis
0.038
Cliona delitrix
0.032
Ircinia felix
0.031
Verongula gigantea
0.4 0.031
Ircinia spp. brown
0.028
Aplysina lacunosa
0.022
Cribrochalina vasculum
0.022
Callyspongia armigera
0.017
Clathria schoenus
0.017
Myrmekioderma gyroderma
0.017
Black unknown sponge
0.4 0.015
Niphates erecta
0.015
Petrosia pellasarca
0.014
Total sponges 10 4.5 7 7.6 7.097

81
Appendix 2 Results from Analysis of Similarities (ANOSIM) one-way analysis comparing the sessile-
benthic categories among habitats. CPV= colonized pavement, BCR= bank coral reef,
PRF= patch coral reef, SAG= spur and groove, and CRR= rhodolith reef. Habitat R Statistic p value
CPV, BCR 0.574 0.001
CPV, PRF 0.093 0.077
CPV, SAG 0.263 0.036
CPV, CRR 0.083 0.101
BCR, PRF 0.798 0.001
BCR, SAG 0.085 0.268
BCR, CRR 0.839 0.001
PRF, SAG 0.808 0.002
PRF, CRR -0.022 0.588
SAG, CRR 0.854 0.007
Global R 0.493
2.2 Results from the SIMPER test. Contributions to similarity percentages by substrate
categories within benthic habitats surveyed at Lang Bank, St. Croix, USVI.
Benthic Habitats Av.Abund Av.Sim Sim/SD Contrib% Cum.%
Colonized pavement (Average similarity: 71.3) Macroalgae 6.41 27.41 2.75 38.47 38.47
Turf 4.36 13.64 1.22 19.14 57.6
Sponge 2.62 11.84 5.18 16.62 74.23
Abiotic 2.92 7.85 0.96 11.02 85.24
Coral 1.63 5.3 1.64 7.44 92.68
Bank coral reef (Average similarity: 78.3) Macroalgae 5.5 21.57 3.73 27.56 27.56
Coral 5.25 20.93 4.62 26.74 54.29
Turf 4.14 14.72 3.16 18.81 73.1
CCA 2.64 8.96 2.32 11.45 84.55
Sponge 2.08 7.1 2.14 9.07 93.62
Patch coral reef (Average similarity: 78.7) Abiotic 6.13 27.81 5.5 35.36 35.36
Macroalgae 5.93 25.74 3.23 32.73 68.09
Sponge 2.37 10.33 5.25 13.14 81.23
Turf 2.77 7.65 1.32 9.73 90.96

82
Spur and groove (Average similarity: 81.3) Turf 6.25 23.56 3.44 28.97 28.97
Coral 4.83 21.4 700.31 26.32 55.29
Macroalgae 4.15 13.24 52.93 16.29 71.58
Sponge 2.58 8.78 2.55 10.8 82.38
Abiotic 2.1 7.42 4.08 9.13 91.51
Rhodolith reef (Average similarity: 79.7) Macroalgae 6.76 33.41 8.83 41.92 41.92
Abiotic 5.39 24.78 3.03 31.1 73.02
Sponge 2.2 9.6 4.42 12.05 85.07
Turf 2.7 8.47 1.19 10.63 95.7
2.3 Results from the SIMPER test. Contributions to dissimilarity percentages by
substrate categories between benthic habitats surveyed at Lang Bank, St. Croix, USVI.
CPV= colonized pavement, BCR= bank coral reef, PRF= patch coral reef, SAG= spur
and groove, and CRR= rhodolith reef.
Substrate Categories Av.Abund Av.Abund Av.Diss Diss/SD Contrib% Cum.% Groups CPV & BCR (Average dissimilarity = 36.3)
Group CPV Group BCR
Coral 1.63 5.25 8.87 2.25 24.42 24.42
Turf 4.36 4.14 6.7 1.53 18.44 42.86
Abiotic 2.92 1.57 5.73 1.24 15.79 58.66
CCA 0.4 2.64 5.49 1.71 15.13 73.79
Macroalgae 6.41 5.5 4.89 1.42 13.48 87.27
Octocoral 1.38 0.66 2.36 1.45 6.49 93.76
Groups CPV & PRF (Average dissimilarity = 29.6)
Group CPV Group PRF
Abiotic 2.92 6.13 9.03 1.57 30.52 30.52
Turf 4.36 2.77 7.96 1.32 26.9 57.42
Macroalgae 6.41 5.93 4.84 1.24 16.34 73.76
Coral 1.63 1.46 2.52 1.28 8.53 82.29
Octocoral 1.38 0.75 2.39 1.37 8.08 90.37
83
Groups BCR & PRF (Average dissimilarity = 39.8)
Group BCR Group PRF
Abiotic 1.57 6.13 11.13 2.39 27.95 27.95
Coral 5.25 1.46 9.21 2.53 23.14 51.08
Turf 4.14 2.77 5.94 1.37 14.92 66.01
CCA 2.64 0.27 5.79 1.84 14.52 80.53
Macroalgae 5.5 5.93 4.07 1.35 10.21 90.74
Groups CPV & SAG (Average dissimilarity = 34.1)
Group CPV Group SAG
Coral 1.63 4.83 7.71 2.99 22.65 22.65
Turf 4.36 6.25 7.37 1.53 21.66 44.3
Macroalgae 6.41 4.15 6.84 1.6 20.09 64.4
Abiotic 2.92 2.1 4.87 1.33 14.31 78.71
CCA 0.4 1.68 3.15 1.84 9.25 87.96
Octocoral 1.38 0.65 2.28 1.46 6.69 94.65
Groups BCR & SAG (Average dissimilarity = 22.7)
Group BCR Group SAG
Turf 4.14 6.25 5.75 1.52 25.36 25.36
Macroalgae 5.5 4.15 4.85 1.52 21.37 46.73
Abiotic 1.57 2.1 3.02 1.6 13.34 60.07
CCA 2.64 1.68 2.89 1.22 12.73 72.8
Sponge 2.08 2.58 2.42 1.44 10.68 83.48
Coral 5.25 4.83 2.38 1.4 10.49 93.97
Groups PRF & SAG (Average dissimilarity = 39.4)
Group PRF Group SAG
Abiotic 6.13 2.1 9.69 2.92 24.58 24.58
Turf 2.77 6.25 9.13 1.79 23.14 47.72
Coral 1.46 4.83 8.08 4.03 20.5 68.22
Macroalgae 5.93 4.15 5.71 1.44 14.47 82.69
CCA 0.27 1.68 3.38 1.99 8.58 91.27
Groups CPV & CRR (Average dissimilarity = 29.3)
Group CPV Group CRR
Abiotic 2.92 5.39 8.13 1.54 27.72 27.72
Turf 4.36 2.7 7.95 1.37 27.1 54.82
Macroalgae 6.41 6.76 4.24 1.19 14.46 69.28

84
Coral 1.63 0.85 2.87 1.29 9.78 79.06
Octocoral 1.38 0.44 2.85 1.56 9.7 88.76
Sponge 2.62 2.2 2.05 1.48 6.97 95.73
Groups BCR & CRR (Average dissimilarity = 40.1)
Group BCR Group CRR
Coral 5.25 0.85 10.94 3.08 27.28 27.28
Abiotic 1.57 5.39 9.75 2.17 24.3 51.59
CCA 2.64 0.23 6.02 1.88 15 66.59
Turf 4.14 2.7 5.66 1.35 14.11 80.7
Macroalgae 5.5 6.76 4.03 1.21 10.04 90.73
Groups PRF & CRR (Average dissimilarity = 20.8)
Group PRF Group CRR
Turf 2.77 2.7 5.8 1.39 27.98 27.98
Macroalgae 5.93 6.76 4.01 1.22 19.32 47.3
Abiotic 6.13 5.39 3.83 1.05 18.45 65.75
Coral 1.46 0.85 2.53 1.45 12.21 77.95
Sponge 2.37 2.2 1.86 1.3 8.97 86.92
Octocoral 0.75 0.44 1.69 1.3 8.14 95.06
Groups SAG & CRR (Average dissimilarity = 41.2)
Group SAG Group CRR
Coral 4.83 0.85 9.76 5.84 23.68 23.68
Turf 6.25 2.7 9.03 1.75 21.89 45.56
Abiotic 2.1 5.39 8.28 2.57 20.07 65.63
Macroalgae 4.15 6.76 6.9 1.66 16.73 82.37
CCA 1.68 0.23 3.56 2.07 8.62 90.99

85
Appendix 3. Percent substrate cover by sessile-benthic categories from stations/transects surveyed
at the Bank Coral Reef Habitat in Lang Bank. 2012-13
BANK CORAL REEF Spawn Substrate category Site 2 IW42 DB26 816 DB28 DB27 819 DB14-
30 823 IW35 IW35
Abiotic
Sand 17.5 8.44
7.48 17 0.53 12.13 1.54 14.11
Dead coral
0.39
0.58
Rubble
0.5
Total abiotic 17.5 8 7.87 17 1.11 12.13 2.04 14.11
Benthic algae
Lobophora spp. 39.5 44.64 32.01 24 41.99 53.64 35.57 30.47 40.2 36.76 26.9
Turf 11 9.35 4.15 4 5.87 6.31 8 13.54 5.93 18.01 11.78
Crustose coralline algae 0.5 3.59 7.28 4 6.3 1.14 6.29 8.54 4.1 10.2 11.48
Dictyota spp.
6.31 0.91 2.67 1.78
0.57
3.09 9.14
Macroalgae
3.11
0.57
1.02 7.6
Halimeda spp.
Total benthic algae 51 67 44.35 34.67 55.94 61.09 51 52.55 50.23 69.08 66.9
Cyanobacteria
1.33 0.45 0.57
1.09
Hard corals
Orbicella franksi 9 16.04 29.53 26 31.83 10.3 15.43 33.23 16.33 23.76 14.97
Porites furcata 3.5
2.26 27.33 1.33
Porites astreoides 1.5 1.81 1.33
5.89
1.14 3.56 0.44 1.02
Colpophyllia natans
1.89
Agaricia grahamae 2 0.44 0.48 1.33
1.71
0.5 0.93 0.53
Diploria strigosa
11.19
2.39
2.5
Agaricia lamarcki
0.67
1.17 0.57
Montastraea cavernosa
0.89
0.93 2.3 0.57 0.53
0.57
Siderastrea siderea 0.5 0.44 0.44
0.46
0.57

86
Madracis decactis 1
0.46
Porites divaricata
Montastraea faveolata
1.93
Eusmilia strigosa
0.46
0.57
Mycetophyllia aliciae
Agaricia agaricites
Leptoseris cucullata
0.48
0.5
Mycetophyllia ferox
Stephanocoenia intersepta
Meandrina meandrites
0.57
Coral spp.
Millepora alcicornis
0.57
Diploria labyrinthiformis
Porites porites
Total hard coral 17.5 18.74 46.61 55.33 40.44 18.44 18.29 40.82 22.45 25.31 16.68
Octocoral
Erythropodium caribaeorum 0.5 0.93
2
0.57
0.97
Briareum sp.
1.33
0.48 1.5
Eunicea spp. 0.5
Antillogorgia spp.
Gorgonian spp.
Plexaura spp. 0.5
Plexaurella spp. 0.5
Pseudoplexaura spp.
Total octocoral 2 2.26 2 0.57 1.45 1.5
Sponge
Geodia neptuni
1.83
5.14 1.71 1.5 1.78
Svenzea zeai 2.5 0.89 0.44 2 0.44
0.57 1
Unknown sponge 0.5 0.89 2.26
0.44 0.6 0.57 0.5 1.37
Agelas conifera 0.5 0.44 2.74 0.67 1.39 1.14 0.57
0.97
Agelas clathrodes 1
0.57 0.57 0.53 4.97
1.14

87
Cliona caribbaea 2
0.44
0.57
Plakortis halichondrioides 0.5 0.89 0.46
1.14 2.86
Agelas citrina
0.89
0.5 1.89
Hyrtios cavernosus
0.97 0.5 0.57
Aiolochroia crassa 1
0.67 0.44 0.57 1.14
Clathria schoenus
0.57
0.62
Spheciospongia vesparium 0.5
0.57
0.5
Plakortis angulospiculatus
0.57
0.46
Clathria spp.
Aplysina cauliformis 0.5 0.44
0.5
Xestospongia muta 0.5
0.57
0.57
Niphates digitalis
0.57 0.5 0.97
Agelas tubulata 1.5
Amphimedon compressa 0.5 0.44
0.57
Neopetrosia proxima
0.57 0.57
Prosuberites laughlini
0.5
Ectoplasia ferox
Smenospongia conulosa
Agelas dispar
Plaktoris spp.
0.6
Aplysina insularis
0.57
Aplysina lacunosa
0.57
Callyspongia plicifera
0.57
Erylus formosus
0.57
Cinachyrella kuekenthali 0.5
Aplysina fistularis
Cliona delitrix
Ircinia spp. brown
Ircinia strobilina
Spriastrella coccinea
0.44
Verongula gigantea
Verongula rigida
Cliona aprica

88
Total sponges 12 4 9.04 3.33 2.72 12.05 13.14 5.53 13.82 1 2.91
Substrate category IW37 IW38 IW39 IW36 IW36 DB2 DB3 DB21 DB21 DB22 DB22
Abiotic
Sand 3.5 1.14 2.22 4 13.5 0.75 0.36 0.12
Dead coral 3 0.19 3.19 3.5 0.5 0.44
Rubble 0.6 3.56 0.5 0.46
Total abiotic 3.5 3 1.93 8.96 3.5 4 14.5 0.75 0.36 0.12 0.93
Benthic algae
Lobophora spp. 35.5 37 22.81 7.98 22.17 34.32 51 32.09 28.2 36.33 51.41
Turf 11 20.5 20.3 56.19 48.71 22.83 16.5 8.93 12.85 4.44 7.15
Crustose coralline algae 6.5 10.5 9.86 1.35 1 5.35 1 0.89 3.3 4 4.46
Dictyota spp. 0.5 1 2.9 1.33 2 0.46 1.5 0.89 0.36
Macroalgae 1 3.43 3.13 7 4.52 1.5 0.91 0.73
Halimeda spp. 1.02
Total benthic algae 54.5 69 59.3 69.98 80.88 67.48 71.5 44.73 45.44 44.77 63.02
Cyanobacteria 1 0.89 2 0.36 1.33
Hard corals
Orbicella franksi 39 20 33.57 8.96 8.13 17.78 7.5 44.25 37.39 22.22 18.69
Porites furcata 0.5 4.07 0.5 2.18 5.78 4.89
Porites astreoides 0.5 0.97 1 0.5 0.73 1.33 0.44
Colpophyllia natans 2.26 0.5 13.78 2.67
Agaricia grahamae 0.44 3.64 4.89 0.46
Diploria strigosa 1
Agaricia lamarcki 1.83 1.5 0.44
Montastraea cavernosa 0.46 0.5 1.33 1
Siderastrea siderea 0.89 0.97 0.44
Madracis decactis 0.5 0.5 0.73
Porites divaricata 1.78
89
Montastraea faveolata
Eusmilia strigosa 0.5
Mycetophyllia aliciae 1.5
Agaricia agaricites
Leptoseris cucullata 0.36
Mycetophyllia ferox Stephanocoenia
intersepta
Meandrina meandrites 0.44
Coral spp.
Millepora alcicornis
Diploria labyrinthiformis
Porites porites 0.44
Total hard coral 39.5 22.5 37.64 13.99 12.63 22.36 10.5 46.91 45.03 48 27.59
Octocorals Erythropodium
caribaeorum 0.44 2.26 2.2 0.89
Briareum sp. 0.57 0.46
Eunicea spp. 0.5 0.44
Antillogorgia spp.
Gorgonian spp. 0.5
Plexaura spp.
Plexaurella spp.
Pseudoplexaura spp. 0.5
Total octocoral 0.5 0.5 0.57 1.35 0.5 2.26 2.2 0.89
Sponges
Geodia neptuni 1 0.5 1.5 1.33 2.22 2.21 1.33
Svenzea zeai 1.78 0.5 0.73 1.33 0.89
Unknown sponge 0.44 0.44 0.5 0.74 0.44
Agelas conifera 0.44 0.44 0.38 0.89 0.89
Agelas clathrodes 0.89 0.5 0.73
Cliona caribbaea 0.5 0.6 2.22

90
Plakortis halichondrioides 0.44 0.46 0.97
Agelas citrina 1.33 0.5 0.44
Hyrtios cavernosus 0.5 0.5 3.56
Aiolochroia crassa 0.36 0.44 0.46
Clathria schoenus 0.5 1.78 0.36 Spheciospongia
vesparium Plakortis
angulospiculatus 0.89
Clathria spp. 0.5 2
Aplysina cauliformis 0.44
Xestospongia muta 0.44
Niphates digitalis
Agelas tubulata 0.5 Amphimedon
compressa
Neopetrosia proxima
Prosuberites laughlini 0.44
Ectoplasia ferox
Smenospongia conulosa 0.44
Agelas dispar 0.73
Plaktoris spp.
Aplysina insularis
Aplysina lacunosa
Callyspongia plicifera
Erylus formosus
Cinachyrella kuekenthali
Aplysina fistularis 0.44
Cliona delitrix 0.44
Ircinia spp. brown
Ircinia strobilina
Spriastrella coccinea
Verongula gigantea
Verongula rigida 0.44

91
Cliona aprica 0.36
Total sponges 2 4 0.6 5.78 2.5 5.33 1.5 5.35 6.61 5.78 7.6
Substrate category IW31 IW32 IW33 IW34 WP878 DB6 LB2 LB10 LB8 LB6 LB7 Mean
Abiotic
Sand
4
8.46 0.89
3.81
3.65
3.792
Dead coral
0.357
Rubble
0.170
Total abiotic 4 8.46 0.89 3.81 3.65 4.307
Benthic algae
Lobophora spp. 6.22 7.56 9.33 7.56 38.85 56.17 11.64 23.17 22.27 9.89 15.31 29.468
Turf 53.33 58.22 52 49.33 15.59 18.72 20.4 15.88 12.19 18.08 15.63 19.900
Crustose coralline algae 12 7.11 8.89 7.56 6.3 5.43 32.35 25.67 24.17 25.94 12.48 8.471
Dictyota spp.
2.22 0.89 6.67
0.73
0.36
1.402
Macroalgae 0.44 0.89 0.89 2.22
1.181
Halimeda spp.
0.44
0.044
Total benthic algae 72 76 72.44 73.33 60.74 80.31 64.39 65.46 58.63 54.28 43.43 60.467
Cyanobacteria
0.273
Hard corals
Orbicella franksi 23.56 17.33 19.56 14.22 14.31 6.69 27 29.34 40.2 39.53 44.93 23.048
Porites furcata
1.33
0.57 1.09
1.677
Porites astreoides 0.44 1.33 0.89 0.44 0.44
0.5
0.44 0.807
Colpophyllia natans
0.44 0.653
Agaricia grahamae
1.33 0.44 1.64
0.73
0.651
Diploria strigosa
0.62
0.536
Agaricia lamarcki 0.44
2.78 1
3.56 0.423
Montastraea cavernosa 0.44
1.33 2.22 0.5 0.36
0.422

92
Siderastrea siderea 0.44
0.44
0.169
Madracis decactis
0.44
0.110
Porites divaricata
1.33
0.094
Montastraea faveolata
0.058
Eusmilia strigosa
0.046
Mycetophyllia aliciae
0.045
Agaricia agaricites
0.44 0.44 0.46
0.041
Leptoseris cucullata
0.041
Mycetophyllia ferox
1.33 0.040
Stephanocoenia intersepta
1.33
0.040
Meandrina meandrites
0.031
Coral spp.
0.44
0.44
0.027
Millepora alcicornis
0.017
Diploria labyrinthiformis
0.44
0.013
Porites porites
0.013
Total hard coral 25.33 19.11 21.33 18.67 19.22 12.57 30.64 29.7 41.39 41.35 50.7 29.008
Octocoral
Erythropodium caribaeorum 0.89
0.5
0.36 0.46 0.393
Briareum sp.
0.89
1.33
0.199
Eunicea spp.
0.44 0.44
0.070
Antillogorgia spp.
1.33
0.040
Gorgonian spp.
0.015
Plexaura spp.
0.015
Plexaurella spp.
0.015
Pseudoplexaura spp.
0.015
Total octocoral 0.89 1.33 0.44 2.67 0.5 0.36 0.46 0.764
Sponge
Geodia neptuni
0.89
0.89
0.44 1 0.74
0.36 1.78 0.853

93
Svenzea zeai
0.44 0.44
5.78 1.78
0.652
Unknown sponge 0.44 0.44 0.44
0.44 3.56 2
0.97 0.545
Agelas conifera
1.78
1.78 0.44
0.5
0.44 0.497
Agelas clathrodes
1.78
1.33 0.425
Cliona caribbaea 0.89
0.5
1.33 0.274
Plakortis halichondrioides
0.234
Agelas citrina
0.44 0.89
0.208
Hyrtios cavernosus
0.200
Aiolochroia crassa
0.46
0.57 0.36
0.196
Clathria schoenus
0.116
Spheciospongia vesparium
1.78
0.102
Plakortis angulospiculatus
0.44 0.44
0.085
Clathria spp.
0.076
Aplysina cauliformis
0.44
0.070
Xestospongia muta
0.063
Niphates digitalis
0.062
Agelas tubulata
0.061
Amphimedon compressa
0.046
Neopetrosia proxima
0.035
Prosuberites laughlini
0.028
Ectoplasia ferox 0.44
0.44
0.027
Smenospongia conulosa
0.44
0.027
Agelas dispar
0.022
Plaktoris spp.
0.018
Aplysina insularis
0.017
Aplysina lacunosa
0.017
Callyspongia plicifera
0.017
Erylus formosus
0.017
Cinachyrella kuekenthali
0.015
Aplysina fistularis
0.013

94
Cliona delitrix
0.013
Ircinia spp. brown
0.44
0.013
Ircinia strobilina
0.44
0.013
Spriastrella coccinea
0.013
Verongula gigantea
0.44
0.013
Verongula rigida
0.013
Cliona aprica
0.011
Total sponges 1.78 3.56 1.78 5.33 11.57 6.22 4.57 1.11 0.36 5.86 5.113

95
Appendix 4. Percent substrate cover by sessile-benthic categories from stations/transects surveyed
at the Patch Coral Reef Habitat in Lang Bank. 2012-13
Substrate category IW41 DB19 DB19 DB18 DB1 DB1 844 OW70 846 DB20 OW65 LB4 Mean
Abiotic
Sand 3 22.22 23.11 34.86 27.5 21.6 33.78 28 25.6 25 36.4 18.19 24.938
Pavement
32.5 36.4
5.742
Rubble 2 1.67 4.44 8.57 4.5 2.4 6.22 9.5 1.2 4.5
3.750
Dead coral
3.12 0.89 1.72 2.5
4.9
4.8
1.494
Total abiotic 32 36.1 28.45 45.15 34.5 24 44.9 70 68 29.5 36.4 18.19 38.933
Rhodolith
2.5 8
0.875
Benthic algae
Lobophora variegata 24.5 49.78 35.56 45.71 47.5 43.2 36.89 1 16 6 34.8 22.28 30.268
Turf 0.5 0.89 12.89 2.29 5 11.6 5.33 3.5
51 7.6 45.63 12.186
Macroalgae 19.5 6.22 7.11 1.71 4 5.2 0.44 1 0.4 1.5 4
4.257
Dictyota spp. 9.5 0.44 2.22 0.57 0.5 1.6 3.11 0.5 1.6 3 0.4 0.5 1.995 Crustose
coralline algae 1.5
0.57
1.53 0.300
Stypopodium spp.
1.2
0.100
Halimeda spp. 1
0.083
Total benthic algae 56.5 57.33 57.78 50.85 57 61.6 45.77 15 18 61.5 48 69.29 49.885
Cyanobacteria 1 1.33 1.78 1.14 0.5 1.2 2.22
0.764
Hard corals
Orbicella franksi 2 0.89
1 2
0.5 0.4 0.5
0.5 0.649 Porites
astreoides
0.44 0.44
1.2
0.5 2.4
0.5 0.457
Agaricia lamarcki
0.89 0.44
1.5
0.5 0.278
Agaricia grahamae 1.5
0.5
0.5 0.208
Siderastrea siderea
0.4 0.44
1.2
0.170
Diploria strigosa 2
0.167 Mycetophyllia
aliciae
0.44
1 0.4
0.153
Porites furcata
0.89
0.5
0.116

96
Montastraea cavernosa 0.5 0.44
0.4
0.112
Millepora alcicornis
0.5 0.8
0.108
Coral spp.
0.8
0.4
0.100 Agaricia
agaricites
0.4
0.5 0.075
Madracis decactis
0.5 0.4
0.075
Stephanocoenia intersepta
0.44
0.037
Total hard coral 6 3.11 2.22 4 4.8 0.44 2.5 6 0.5 0.4 2.5 2.706
Octocoral
Eunicea spp. 1
2.22
0.8 0.44
0.8
0.53 0.483 Antillogorgia
spp.
0.89
0.4
0.5 0.8 0.5
0.258
Briareum sp.
1 0.083 Pseudoplexaura
spp. 0.5
0.5
0.083
Total octocoral 1.5 3.11 1.2 0.44 0.5 1.6 1 1.53 0.907
Sponge
Xestospongia
muta
0.89 0.44
3 1.2 0.44 3.5 0.4 1 2.4 1.5 1.231
Unknown sponge 0.5 0.44 0.89 0.57 0.5 1.2
2 0.4 1 1.2 2.5 0.933
Verongula rigida
0.44 0.57
0.44 2 1.2
0.388
Aplysina cauliformis
1.2 0.89 0.5 1.6
0.4
0.383
Agelas conifera 0.5
0.8
2 0.275
Agelas clathrodes
0.44
1.2 0.44 0.5
0.215
Neopetrosia proxima 0.5
0.57
0.44 0.5 0.4
0.201
Geodia neptuni
0.44 1.14
0.44
0.168 Ircinia spp.
brown
0.5 0.4
0.8
0.142
Aplysina fistularis
0.44
1
0.120
Aiolochroia crassa
0.4 0.5
0.5 0.117
Aplysina lacunosa
1 0.4
0.117
Hyrtios cavernosus
0.4
1
0.117
Spheciospongia vesparium
0.4
1
0.117
Plakortis halichondrioides
0.44
0.4
0.5 0.112
Chondrilla caribensis
1.33
0.111

97
Svenzea zeai
0.89
0.4
0.108
Prosuberites laughlini
0.44
0.44
0.4
0.107
Agelas tubulata 0.5
0.5
0.083 Plakortis
angulospiculatus 1
0.083
Amphimedon compressa
0.44
0.5 0.078
Ircinia strobilina
0.44
0.5 0.078
Ircinia felix
0.89
0.074 Brown
encrusting sponge
0.4
0.4
0.067
Niphates digitalis
0.4
0.4
0.067
Cinachyrella kuekenthali
0.5 0.042
Ircinia campana
0.5
0.042 Spriastrella
coccinea
0.5
0.042
Agelas citrina
0.44
0.037
Agelas dispar
0.44
0.037
Clathria schoenus
0.44
0.037
Verongula reiswigi
0.44
0.037
Cribrochalina vasculum
0.4
0.033
Smenospongia conulosa
0.4
0.033
Suberea sp.
0.4
0.033 Verongula
gigantea
0.4
0.033
Total sponges 3 2.22 6.22 2.86 4 7.2 6.22 12 6.4 5 7.2 8.5 5.902

98
Appendix 5. Percent substrate cover by sessile-benthic categories from stations/transects surveyed
at the Spur and Groove Habitat in Lang Bank. 2012-13
Substrate category IW39 IW40 IW40 Mean
Abiotic
Sand 7.43 1.47 0.5 3.13
Dead coral 0.14 2.53 1.5 1.39
Rubble
0.53
0.18
Total abiotic 7.57 4.52 2 4.7
Benthic algae Turf 19.2 48.77 55 40.99
Lobophora variegata 35.58 4.5 5.5 15.19
Crustose coralline algae 5.71 1.52 2 3.08
Dictyota spp. 2.86 3.5 2.5 2.95
Macroalgae 4.7 0.5 1 2.07
Total benthic algae 67.24 58.79 66 64.01
Hard corals Orbicella franksi 22.33 12.58 11.5 15.47
Porites furcata
4.63 4 2.88
Colpophyllia natans
4 3 2.33
Montastraea cavernosa
1 1 0.67
Madracis decactis
1 0.5 0.5
Siderastrea siderea
1.5 0.5
Porites astreoides
1.28
0.43
Mycetophyllia aliciae 0.57
0.19
Agaricia agaricites
0.5 0.17
Millepora alcicornis
0.5 0.17
Mycetophyllia ferox
0.5
0.17
Porites porites
0.5
0.17
Total hard coral 22.95 24.67 22.5 23.37
Octocoral Plexaura spp.
0.53 0.5 0.34
Eunicea spp.
0.5 0.17
Pseudoplexaura spp.
0.5 0.17
Total octocoral 0.53 1.5 0.68

99
Sponge Cliona caribbaea
3 3.5 2.17
Clathria schoenus 0.57 3 1 1.52
Geodia neptuni 0.57 1.5
0.69
Unknown sponge 1.14
0.5 0.55
Agelas citrina
0.5 1 0.5
Agelas tubulata
1 0.33
Neopetrosia proxima
0.5 0.5 0.33
Petrosia pellasarca
1
0.33
Agelas clathrodes
0.5
0.17
Agelas dispar
0.5
0.17
Aiolochroia crassa
0.5 0.17
Plaktoris spp.
0.5
0.17
Scopalina ruetzleri
0.5
0.17
Total sponges 2.29 11.5 8 7.26

100
Appendix 6. Percent substrate cover by sessile-benthic categories from stations/transects surveyed at the
Colonized Rhodolith Reef Habitat in Lang Bank. 2012-13
COLONIZED RHODOLITH REEF Substrate category DB1 DB1 OW68 OW68 OW76 OW62 OW66 DB17 LB9 LB15 Mean
Abiotic
Sand 34.65 28.5 3.95 0.89 46.86 21.78 24.36 23.6 34 39.27 25.79
Rubble 1.9 11
4 1.78
0.8
1.95
Pavement
2.22 2.29
0.45
Dead coral 0.42
0.57
1.15
0.21
Total abiotic 36.15 39.5 31.52 3.11 54.3 23.56 24.36 24.4 34 39.27 31.02
Rhodolith
1.33 8 1.6 18 9.82 3.88
Benthic algae
Lobophora variegata 45.27 33.5 43.1 76 3.29 29.78 29.45 45.6 36.5 34 37.65
Turf 1 4.5 1.14
1.71 26.22 27.64 17.6 9 15.27 10.41
Dictyota spp. 6.2 9 12.19
1.71 3.11 4.73 7.6 0.5
4.5
Macroalgae 3.5 3 1.74
1.33 0.73
1.03
Stypopodium spp.
7.11
0.71
Crustose coralline algae 1.52
1.14
0.27
Halimeda spp. 1.4 0.5
0.19
Total benthic algae 58.35 50.5 58.17 76 34.85 67.56 62.55 70.8 46 48.36 57.31
Cyanobacteria 2 3.5 2.88 0.44 0.57
0.94
Hard corals
Orbicella franksi
0.5
1.78 0.57
0.4
0.36 0.36
Agaricia lamarcki
1.14
0.36
0.15
Stephanocoenia intersepta
0.89
0.5
0.14
Siderastrea siderea
1.14
0.11
Madracis decactis
0.89
0.09
Porites astreoides
0.89
0.09
Agaricia grahamae
0.57
0.06
Coral spp.
0.57
0.06
Meandrina meandrites
0.5
0.05
Diploria strigosa
0.44
0.04
Total hard coral 1 1.14 4.89 2.86 0.36 0.4 0.5 0.36 1.15
Octocoral

101
Eunicea spp.
0.57 1.78
0.44
0.28
Erythropodium caribaeorum
0.57
0.06
Pseudoplexaura spp.
0.44
0.04
Plexaura spp.
0.36
0.04
Total octocoral 0.57 1.78 0.57 0.89 0.36 0.42
Sponge
Xestospongia muta
0.5 1.14 1.78 1.14 2.22 2.18
0.9
Geodia neptuni 0.5 0.5
0.44
1.6 1
0.4
Unknown sponge 0.5
0.57 0.44
1.33
0.8
0.36
Aplysina cauliformis
0.5
1.14 1.33 0.36
0.33
Aplysina fistularis
1
0.89
0.44
0.73 0.31
Prosuberites laughlini 1 0.5 0.57 0.89
0.3
Plakortis angulospiculatus 0.5 0.5 0.57
0.57 0.44
0.26
Spriastrella coccinea
1.33 0.57
0.36 0.23
Neopetrosia proxima
2.22
0.22
Agelas conifera
0.89
0.44 0.36
0.5
0.22
Plakortis halichondrioides 0.5
0.44 0.57
0.36
0.19
Aiolochroia crassa
1.14
0.73 0.19
Ptilocaulis walpersi
1.78
0.18
Hyrtios cavernosus
0.5
1.14
0.16
Verongula rigida 0.5
1.14
0.16
Erylus formosus
0.57 0.89
0.15
Ircinia strobilina
0.5
0.57
0.11
Verongula gigantea
0.57
0.36
0.09
Scopalina ruetzleri
0.36 0.4
0.08
Smenospongia conulosa
0.57
0.06
Clathria schoenus
0.5
0.05
Niphates digitalis
0.5
0.05
Cinachyrella kuekenthali
0.44
0.04
Cliona caribbaea
0.44
0.04
Cliona delitrix
0.44
0.04
Ircinia spp. brown
0.44
0.04
Plaktoris spp.
0.44
0.04
Aplysina lacunosa
0.36 0.04
Topsentia ophiraphidites
0.36
0.04
Total sponges 3.5 5.5 5.71 13.78 6.86 6.67 4.36 2.8 1.5 2.18 5.29
102
Appendix 7 Results from Analysis of Similarities (ANOSIM) one-way analysis comparing the
structure of fish communities among habitats. CPV= colonized pavement, BCR= bank
coral reef, PRF= patch coral reef, SAG= spur and groove, and CRR= rhodolith reef.
Global Test Sample statistic (Global R): 0.301 Significance level of sample statistic: 0.1% Number of permutations: 999 (Random sample from a large number) Number of permuted statistics greater than or equal to Global R: 0 Pairwise Tests R Significance Possible Actual Number >= Groups Statistic Level % Permutations Permutations Observed BCR, CPV 0.319 0.1 Very large 999 0 BCR, PRF 0.545 0.1 Very large 999 0 BCR, CRR 0.594 0.1 Very large 999 0 BCR, SAG 0.071 30.7 7770 999 306 CPV, PRF -0.016 55.2 854992152 999 551 CPV, CRR 0.102 12.1 254186856 999 120 CPV, SAG 0.088 29.2 3654 999 291 PRF, CRR 0.019 34.1 352716 999 340 PRF, SAG 0.437 2.7 364 364 10 CRR, SAG 0.232 14.7 286 286 42 Group BCR Average similarity: 31.37 Species Av.Abund Av.Sim Sim/SD Contrib% Cum.% Stegastes partitus 6.65 4.82 1.82 15.37 15.37 Chromis cyanea 6.34 4.33 1.57 13.81 29.17 Halichoeres garnoti 6.54 4.27 1.43 13.61 42.78 Scarus taeniopterus 5.46 3.39 1.26 10.81 53.58 Sparisoma aurofrenatum 4.60 2.11 0.71 6.72 60.31 Thalassoma bifasciatum 4.16 1.96 0.83 6.24 66.54 Hypoplectrus puella 4.65 1.23 0.35 3.94 70.48 Chaetodon capistratus 3.75 0.87 0.35 2.78 73.26 Epinephelus cruentatus 2.76 0.65 0.32 2.08 75.34 Coryphopterus personatus 2.76 0.65 0.34 2.06 77.41 Epinephelus guttatus 2.53 0.64 0.32 2.06 79.46 Acanthurus coeruleus 2.16 0.60 0.39 1.91 81.37 Coryphopterus lipernes 2.50 0.59 0.34 1.89 83.26 Hypoplectrus chlorurus 2.93 0.47 0.22 1.49 84.74 Holocentrus rufus 2.11 0.46 0.26 1.46 86.20 Acanthurus chirurgus 1.68 0.45 0.36 1.43 87.63 Myripristis jacobus 2.04 0.39 0.25 1.24 88.87 Gramma loreto 1.80 0.37 0.28 1.18 90.05 Group CPV Average similarity: 28.35 Species Av.Abund Av.Sim Sim/SD Contrib% Cum.% Stegastes partitus 11.90 8.24 2.16 29.07 29.07 Thalassoma bifasciatum 11.25 5.74 0.92 20.25 49.32 Halichoeres garnoti 8.79 4.21 0.77 14.87 64.18
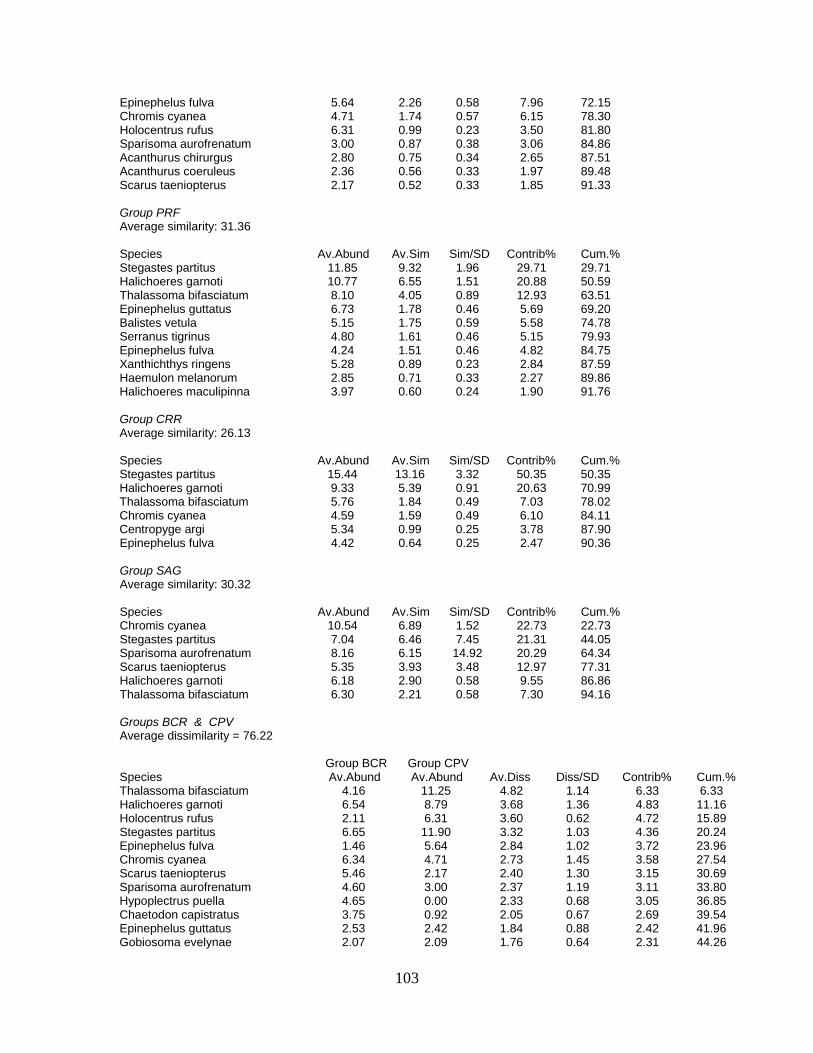
103
Epinephelus fulva 5.64 2.26 0.58 7.96 72.15 Chromis cyanea 4.71 1.74 0.57 6.15 78.30 Holocentrus rufus 6.31 0.99 0.23 3.50 81.80 Sparisoma aurofrenatum 3.00 0.87 0.38 3.06 84.86 Acanthurus chirurgus 2.80 0.75 0.34 2.65 87.51 Acanthurus coeruleus 2.36 0.56 0.33 1.97 89.48 Scarus taeniopterus 2.17 0.52 0.33 1.85 91.33 Group PRF Average similarity: 31.36 Species Av.Abund Av.Sim Sim/SD Contrib% Cum.% Stegastes partitus 11.85 9.32 1.96 29.71 29.71 Halichoeres garnoti 10.77 6.55 1.51 20.88 50.59 Thalassoma bifasciatum 8.10 4.05 0.89 12.93 63.51 Epinephelus guttatus 6.73 1.78 0.46 5.69 69.20 Balistes vetula 5.15 1.75 0.59 5.58 74.78 Serranus tigrinus 4.80 1.61 0.46 5.15 79.93 Epinephelus fulva 4.24 1.51 0.46 4.82 84.75 Xanthichthys ringens 5.28 0.89 0.23 2.84 87.59 Haemulon melanorum 2.85 0.71 0.33 2.27 89.86 Halichoeres maculipinna 3.97 0.60 0.24 1.90 91.76 Group CRR Average similarity: 26.13 Species Av.Abund Av.Sim Sim/SD Contrib% Cum.% Stegastes partitus 15.44 13.16 3.32 50.35 50.35 Halichoeres garnoti 9.33 5.39 0.91 20.63 70.99 Thalassoma bifasciatum 5.76 1.84 0.49 7.03 78.02 Chromis cyanea 4.59 1.59 0.49 6.10 84.11 Centropyge argi 5.34 0.99 0.25 3.78 87.90 Epinephelus fulva 4.42 0.64 0.25 2.47 90.36 Group SAG Average similarity: 30.32 Species Av.Abund Av.Sim Sim/SD Contrib% Cum.% Chromis cyanea 10.54 6.89 1.52 22.73 22.73 Stegastes partitus 7.04 6.46 7.45 21.31 44.05 Sparisoma aurofrenatum 8.16 6.15 14.92 20.29 64.34 Scarus taeniopterus 5.35 3.93 3.48 12.97 77.31 Halichoeres garnoti 6.18 2.90 0.58 9.55 86.86 Thalassoma bifasciatum 6.30 2.21 0.58 7.30 94.16 Groups BCR & CPV Average dissimilarity = 76.22 Group BCR Group CPV Species Av.Abund Av.Abund Av.Diss Diss/SD Contrib% Cum.% Thalassoma bifasciatum 4.16 11.25 4.82 1.14 6.33 6.33 Halichoeres garnoti 6.54 8.79 3.68 1.36 4.83 11.16 Holocentrus rufus 2.11 6.31 3.60 0.62 4.72 15.89 Stegastes partitus 6.65 11.90 3.32 1.03 4.36 20.24 Epinephelus fulva 1.46 5.64 2.84 1.02 3.72 23.96 Chromis cyanea 6.34 4.71 2.73 1.45 3.58 27.54 Scarus taeniopterus 5.46 2.17 2.40 1.30 3.15 30.69 Sparisoma aurofrenatum 4.60 3.00 2.37 1.19 3.11 33.80 Hypoplectrus puella 4.65 0.00 2.33 0.68 3.05 36.85 Chaetodon capistratus 3.75 0.92 2.05 0.67 2.69 39.54 Epinephelus guttatus 2.53 2.42 1.84 0.88 2.42 41.96 Gobiosoma evelynae 2.07 2.09 1.76 0.64 2.31 44.26

104
Acanthurus chirurgus 1.68 2.80 1.68 0.95 2.20 46.46 Acanthurus coeruleus 2.16 2.36 1.64 0.93 2.15 48.61 Serranus tigrinus 0.83 2.59 1.61 0.37 2.12 50.73 Hypoplectrus chlorurus 2.93 0.00 1.46 0.50 1.92 52.64 Epinephelus cruentatus 2.76 0.21 1.42 0.65 1.86 54.50 Coryphopterus personatus 2.76 0.17 1.41 0.64 1.85 56.35 Centropyge argi 0.10 2.69 1.38 0.37 1.81 58.15 Pterois volitans 1.21 1.84 1.34 0.56 1.76 59.92 Haemulon melanorum 0.20 2.48 1.28 0.59 1.69 61.60 Coryphopterus lipernes 2.50 0.15 1.27 0.64 1.67 63.27 Acanthurus bahianus 1.83 0.90 1.23 0.61 1.61 64.88 Chaetodon aculeatus 1.69 0.91 1.19 0.51 1.56 66.44 Canthigaster rostrata 1.88 0.60 1.11 0.60 1.46 67.90 Sparisoma viride 1.58 0.74 1.10 0.48 1.44 69.34 Myripristis jacobus 2.04 0.00 1.02 0.55 1.34 70.68 Gramma loreto 1.80 0.31 0.99 0.61 1.30 71.98 Clepticus parrae 1.57 0.44 0.95 0.57 1.24 73.22 Sphyraena barracuda 0.79 1.18 0.93 0.36 1.23 74.44 Holacanthus tricolor 1.52 0.36 0.89 0.45 1.17 75.62 Scarus iserti 0.82 1.11 0.89 0.44 1.16 76.78 Chaetodon sedentarius 0.00 1.71 0.85 0.33 1.12 77.90 Chromis insolata 0.00 1.67 0.83 0.28 1.10 78.99 Balistes vetula 0.36 1.43 0.83 0.46 1.08 80.08 Haemulon flavolineatum 0.81 0.83 0.75 0.50 0.99 81.07 Lutjanus analis 0.76 0.66 0.65 0.46 0.85 81.92 Ginglymostoma cirratum 0.29 1.05 0.65 0.32 0.85 82.77 Bodianus rufus 1.27 0.00 0.64 0.39 0.83 83.61 Caranx ruber 0.00 1.24 0.62 0.23 0.82 84.42 Xanthichthys ringens 0.00 1.24 0.62 0.29 0.81 85.23 Amblycirrhitus pinos 0.00 1.23 0.62 0.26 0.81 86.04 Lutjanus apodus 1.19 0.00 0.60 0.36 0.78 86.82 Chaetodon striatus 0.46 0.68 0.55 0.26 0.73 87.55 Sparisoma radians 0.44 0.71 0.54 0.37 0.71 88.26 Lachnolaimus maximus 0.00 1.05 0.53 0.29 0.69 88.95 Holacanthus ciliaris 1.00 0.00 0.50 0.31 0.65 89.61 Mulloidichthys martinicus 0.86 0.00 0.43 0.37 0.56 90.17 Groups BCR & PRF Average dissimilarity = 78.97 Group BCR Group PRF Species Av.Abund Av.Abund Av.Diss Diss/SD Contrib% Cum.% Epinephelus guttatus 2.53 6.73 3.51 0.85 4.45 4.45 Halichoeres garnoti 6.54 10.77 3.46 1.16 4.38 8.83 Thalassoma bifasciatum 4.16 8.10 3.43 1.30 4.34 13.16 Stegastes partitus 6.65 11.85 3.29 1.74 4.16 17.33 Xanthichthys ringens 0.00 5.28 2.64 0.60 3.34 20.67 Chromis cyanea 6.34 1.72 2.60 1.48 3.30 23.97 Balistes vetula 0.36 5.15 2.56 0.86 3.24 27.21 Serranus tigrinus 0.83 4.80 2.46 0.91 3.12 30.33 Scarus taeniopterus 5.46 1.54 2.37 1.27 3.00 33.33 Hypoplectrus puella 4.65 0.00 2.33 0.68 2.95 36.27 Sparisoma aurofrenatum 4.60 0.00 2.30 1.05 2.91 39.18 Epinephelus fulva 1.46 4.24 2.24 1.00 2.84 42.02 Halichoeres maculipinna 0.00 3.97 1.98 0.57 2.51 44.53 Chaetodon capistratus 3.75 0.00 1.88 0.60 2.37 46.91 Centropyge argi 0.10 3.34 1.69 0.51 2.14 49.05 Pterois volitans 1.21 2.71 1.67 0.66 2.11 51.17 Holocentrus rufus 2.11 2.28 1.65 0.83 2.08 53.25 Epinephelus cruentatus 2.76 0.97 1.63 0.70 2.07 55.32 Acanthurus coeruleus 2.16 1.46 1.61 0.70 2.04 57.36
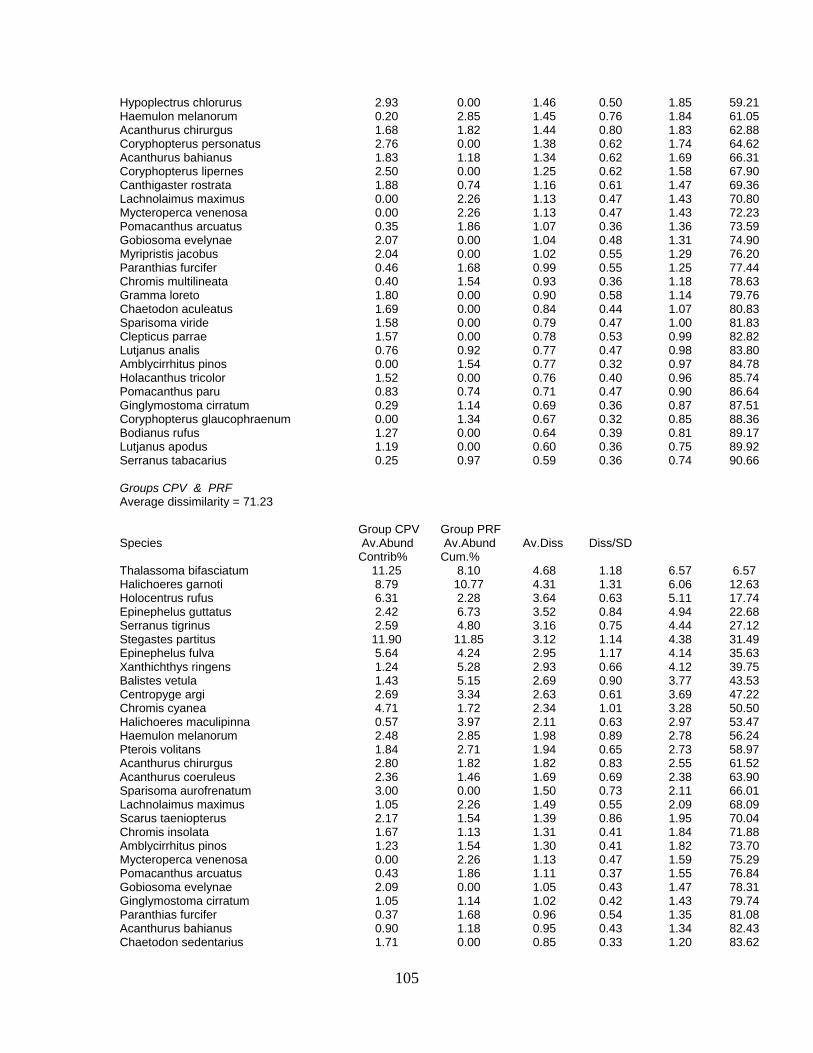
105
Hypoplectrus chlorurus 2.93 0.00 1.46 0.50 1.85 59.21 Haemulon melanorum 0.20 2.85 1.45 0.76 1.84 61.05 Acanthurus chirurgus 1.68 1.82 1.44 0.80 1.83 62.88 Coryphopterus personatus 2.76 0.00 1.38 0.62 1.74 64.62 Acanthurus bahianus 1.83 1.18 1.34 0.62 1.69 66.31 Coryphopterus lipernes 2.50 0.00 1.25 0.62 1.58 67.90 Canthigaster rostrata 1.88 0.74 1.16 0.61 1.47 69.36 Lachnolaimus maximus 0.00 2.26 1.13 0.47 1.43 70.80 Mycteroperca venenosa 0.00 2.26 1.13 0.47 1.43 72.23 Pomacanthus arcuatus 0.35 1.86 1.07 0.36 1.36 73.59 Gobiosoma evelynae 2.07 0.00 1.04 0.48 1.31 74.90 Myripristis jacobus 2.04 0.00 1.02 0.55 1.29 76.20 Paranthias furcifer 0.46 1.68 0.99 0.55 1.25 77.44 Chromis multilineata 0.40 1.54 0.93 0.36 1.18 78.63 Gramma loreto 1.80 0.00 0.90 0.58 1.14 79.76 Chaetodon aculeatus 1.69 0.00 0.84 0.44 1.07 80.83 Sparisoma viride 1.58 0.00 0.79 0.47 1.00 81.83 Clepticus parrae 1.57 0.00 0.78 0.53 0.99 82.82 Lutjanus analis 0.76 0.92 0.77 0.47 0.98 83.80 Amblycirrhitus pinos 0.00 1.54 0.77 0.32 0.97 84.78 Holacanthus tricolor 1.52 0.00 0.76 0.40 0.96 85.74 Pomacanthus paru 0.83 0.74 0.71 0.47 0.90 86.64 Ginglymostoma cirratum 0.29 1.14 0.69 0.36 0.87 87.51 Coryphopterus glaucophraenum 0.00 1.34 0.67 0.32 0.85 88.36 Bodianus rufus 1.27 0.00 0.64 0.39 0.81 89.17 Lutjanus apodus 1.19 0.00 0.60 0.36 0.75 89.92 Serranus tabacarius 0.25 0.97 0.59 0.36 0.74 90.66 Groups CPV & PRF Average dissimilarity = 71.23 Group CPV Group PRF Species Av.Abund Av.Abund Av.Diss Diss/SD Contrib% Cum.% Thalassoma bifasciatum 11.25 8.10 4.68 1.18 6.57 6.57 Halichoeres garnoti 8.79 10.77 4.31 1.31 6.06 12.63 Holocentrus rufus 6.31 2.28 3.64 0.63 5.11 17.74 Epinephelus guttatus 2.42 6.73 3.52 0.84 4.94 22.68 Serranus tigrinus 2.59 4.80 3.16 0.75 4.44 27.12 Stegastes partitus 11.90 11.85 3.12 1.14 4.38 31.49 Epinephelus fulva 5.64 4.24 2.95 1.17 4.14 35.63 Xanthichthys ringens 1.24 5.28 2.93 0.66 4.12 39.75 Balistes vetula 1.43 5.15 2.69 0.90 3.77 43.53 Centropyge argi 2.69 3.34 2.63 0.61 3.69 47.22 Chromis cyanea 4.71 1.72 2.34 1.01 3.28 50.50 Halichoeres maculipinna 0.57 3.97 2.11 0.63 2.97 53.47 Haemulon melanorum 2.48 2.85 1.98 0.89 2.78 56.24 Pterois volitans 1.84 2.71 1.94 0.65 2.73 58.97 Acanthurus chirurgus 2.80 1.82 1.82 0.83 2.55 61.52 Acanthurus coeruleus 2.36 1.46 1.69 0.69 2.38 63.90 Sparisoma aurofrenatum 3.00 0.00 1.50 0.73 2.11 66.01 Lachnolaimus maximus 1.05 2.26 1.49 0.55 2.09 68.09 Scarus taeniopterus 2.17 1.54 1.39 0.86 1.95 70.04 Chromis insolata 1.67 1.13 1.31 0.41 1.84 71.88 Amblycirrhitus pinos 1.23 1.54 1.30 0.41 1.82 73.70 Mycteroperca venenosa 0.00 2.26 1.13 0.47 1.59 75.29 Pomacanthus arcuatus 0.43 1.86 1.11 0.37 1.55 76.84 Gobiosoma evelynae 2.09 0.00 1.05 0.43 1.47 78.31 Ginglymostoma cirratum 1.05 1.14 1.02 0.42 1.43 79.74 Paranthias furcifer 0.37 1.68 0.96 0.54 1.35 81.08 Acanthurus bahianus 0.90 1.18 0.95 0.43 1.34 82.43 Chaetodon sedentarius 1.71 0.00 0.85 0.33 1.20 83.62

106
Coryphopterus glaucophraenum 0.41 1.34 0.84 0.37 1.18 84.80 Chromis multilineata 0.00 1.54 0.77 0.32 1.08 85.88 Lutjanus analis 0.66 0.92 0.73 0.43 1.02 86.90 Caranx ruber 1.24 0.00 0.62 0.23 0.87 87.78 Canthigaster rostrata 0.60 0.74 0.61 0.43 0.86 88.64 Sphyraena barracuda 1.18 0.00 0.59 0.27 0.83 89.47 Epinephelus cruentatus 0.21 0.97 0.57 0.36 0.80 90.27 Groups BCR & CRR Average dissimilarity = 80.78 Group BCR Group CRR Species Av.Abund Av.Abund Av.Diss Diss/SD Contrib% Cum.% Stegastes partitus 6.65 15.44 4.49 1.93 5.56 5.56 Halichoeres garnoti 6.54 9.33 3.48 1.63 4.31 9.87 Thalassoma bifasciatum 4.16 5.76 3.08 1.23 3.81 13.68 Chromis cyanea 6.34 4.59 2.69 1.57 3.33 17.01 Centropyge argi 0.10 5.34 2.69 0.64 3.33 20.35 Epinephelus fulva 1.46 4.42 2.52 0.71 3.12 23.47 Scarus taeniopterus 5.46 1.11 2.52 1.35 3.12 26.59 Serranus tabacarius 0.25 4.67 2.41 0.51 2.98 29.57 Hypoplectrus puella 4.65 0.00 2.33 0.68 2.88 32.45 Sparisoma aurofrenatum 4.60 0.49 2.25 1.07 2.79 35.24 Pomacanthus paru 0.83 3.74 2.12 0.57 2.62 37.86 Epinephelus guttatus 2.53 1.78 1.91 0.70 2.36 40.22 Chaetodon capistratus 3.75 0.00 1.88 0.60 2.32 42.54 Pomacanthus arcuatus 0.35 3.53 1.87 0.52 2.32 44.86 Serranus tortugarum 0.24 3.36 1.75 0.51 2.17 47.02 Lutjanus buccanella 0.00 3.42 1.71 0.49 2.12 49.14 Holocentrus rufus 2.11 2.05 1.66 0.77 2.06 51.20 Coryphopterus glaucophraenum 0.00 3.15 1.57 0.33 1.95 53.15 Malacanthus plumieri 0.24 2.92 1.55 0.36 1.92 55.07 Lutjanus analis 0.76 2.62 1.54 0.60 1.90 56.98 Acanthurus chirurgus 1.68 1.68 1.51 0.64 1.87 58.85 Hypoplectrus chlorurus 2.93 0.00 1.46 0.50 1.81 60.66 Epinephelus cruentatus 2.76 0.00 1.38 0.62 1.71 62.37 Haemulon melanorum 0.20 2.63 1.38 0.47 1.71 64.07 Coryphopterus personatus 2.76 0.00 1.38 0.62 1.71 65.78 Chromis insolata 0.00 2.63 1.31 0.45 1.63 67.41 Gramma loreto 1.80 1.15 1.29 0.66 1.60 69.00 Coryphopterus lipernes 2.50 0.00 1.25 0.62 1.55 70.55 Acanthurus bahianus 1.83 0.98 1.24 0.64 1.53 72.08 Gobiosoma evelynae 2.07 0.56 1.19 0.56 1.48 73.56 Balistes vetula 0.36 1.93 1.11 0.39 1.37 74.93 Holocentrus adcensionis 0.00 2.17 1.08 0.33 1.34 76.27 Acanthurus coeruleus 2.16 0.00 1.08 0.69 1.34 77.61 Elagatis bipinnulata 0.00 2.09 1.05 0.33 1.29 78.90 Myripristis jacobus 2.04 0.00 1.02 0.55 1.26 80.17 Serranus tigrinus 0.83 1.37 1.01 0.45 1.26 81.42 Canthigaster rostrata 1.88 0.00 0.94 0.53 1.16 82.59 Chaetodon aculeatus 1.69 0.00 0.84 0.44 1.04 83.63 Sparisoma viride 1.58 0.00 0.79 0.47 0.98 84.61 Clepticus parrae 1.57 0.00 0.78 0.53 0.97 85.58 Holacanthus tricolor 1.52 0.00 0.76 0.40 0.94 86.52 Paranthias furcifer 0.46 1.15 0.76 0.43 0.94 87.46 Seriola rivoliana 0.37 1.15 0.72 0.38 0.89 88.35 Xanthichthys ringens 0.00 1.44 0.72 0.33 0.89 89.25 Halichoeres maculipinna 0.00 1.36 0.68 0.33 0.84 90.09 Groups CPV & CRR Average dissimilarity = 74.16

107
Group CPV Group CRR Species Av.Abund Av.Abund Av.Diss Diss/SD Contrib% Cum.% Thalassoma bifasciatum 11.25 5.76 4.94 1.15 6.66 6.66 Halichoeres garnoti 8.79 9.33 4.11 1.30 5.54 12.20 Holocentrus rufus 6.31 2.05 3.64 0.62 4.91 17.11 Stegastes partitus 11.90 15.44 3.60 1.48 4.86 21.97 Epinephelus fulva 5.64 4.42 3.55 1.07 4.79 26.75 Centropyge argi 2.69 5.34 3.43 0.73 4.62 31.37 Chromis cyanea 4.71 4.59 2.81 1.18 3.78 35.16 Serranus tabacarius 0.00 4.67 2.33 0.49 3.15 38.31 Haemulon melanorum 2.48 2.63 2.13 0.70 2.87 41.18 Acanthurus chirurgus 2.80 1.68 1.96 0.75 2.64 43.82 Chromis insolata 1.67 2.63 1.95 0.53 2.63 46.45 Lutjanus buccanella 0.65 3.42 1.91 0.53 2.58 49.03 Pomacanthus arcuatus 0.43 3.53 1.89 0.53 2.56 51.59 Pomacanthus paru 0.00 3.74 1.87 0.48 2.52 54.11 Epinephelus guttatus 2.42 1.78 1.86 0.66 2.51 56.62 Serranus tigrinus 2.59 1.37 1.83 0.41 2.47 59.09 Coryphopterus glaucophraenum 0.41 3.15 1.74 0.37 2.34 61.43 Serranus tortugarum 0.00 3.36 1.68 0.49 2.26 63.70 Malacanthus plumieri 0.36 2.92 1.60 0.37 2.16 65.86 Sparisoma aurofrenatum 3.00 0.49 1.56 0.79 2.11 67.97 Balistes vetula 1.43 1.93 1.54 0.50 2.08 70.04 Lutjanus analis 0.66 2.62 1.51 0.57 2.03 72.07 Scarus taeniopterus 2.17 1.11 1.33 0.79 1.79 73.86 Xanthichthys ringens 1.24 1.44 1.23 0.44 1.66 75.52 Gobiosoma evelynae 2.09 0.56 1.21 0.51 1.63 77.15 Elagatis bipinnulata 0.35 2.09 1.18 0.37 1.60 78.75 Acanthurus coeruleus 2.36 0.00 1.18 0.64 1.59 80.34 Holocentrus adcensionis 0.00 2.17 1.08 0.33 1.46 81.80 Pterois volitans 1.84 0.00 0.92 0.39 1.24 83.04 Halichoeres maculipinna 0.57 1.36 0.91 0.43 1.22 84.26 Acanthurus bahianus 0.90 0.98 0.86 0.44 1.17 85.43 Chaetodon sedentarius 1.71 0.00 0.85 0.33 1.15 86.58 Paranthias furcifer 0.37 1.15 0.72 0.42 0.97 87.55 Gramma loreto 0.31 1.15 0.70 0.39 0.94 88.49 Caranx ruber 1.24 0.00 0.62 0.23 0.84 89.33 Amblycirrhitus pinos 1.23 0.00 0.62 0.26 0.83 90.16 Groups PRF & CRR Average dissimilarity = 71.92 Group PRF Group CRR Species Av.Abund Av.Abund Av.Diss Diss/SD Contrib% Cum.% Halichoeres garnoti 10.77 9.33 3.93 1.34 5.47 5.47 Thalassoma bifasciatum 8.10 5.76 3.82 1.31 5.31 10.78 Epinephelus guttatus 6.73 1.78 3.70 0.81 5.14 15.92 Centropyge argi 3.34 5.34 3.48 0.81 4.83 20.75 Epinephelus fulva 4.24 4.42 3.15 0.99 4.38 25.14 Balistes vetula 5.15 1.93 3.04 0.91 4.23 29.37 Xanthichthys ringens 5.28 1.44 2.97 0.68 4.13 33.50 Stegastes partitus 11.85 15.44 2.75 1.29 3.82 37.32 Serranus tabacarius 0.97 4.67 2.62 0.56 3.65 40.97 Serranus tigrinus 4.80 1.37 2.61 0.92 3.63 44.59 Pomacanthus arcuatus 1.86 3.53 2.38 0.58 3.31 47.90 Halichoeres maculipinna 3.97 1.36 2.33 0.66 3.24 51.15 Chromis cyanea 1.72 4.59 2.32 1.10 3.23 54.37 Haemulon melanorum 2.85 2.63 2.22 0.79 3.09 57.46 Coryphopterus glaucophraenum 1.34 3.15 2.11 0.44 2.94 60.39

108
Pomacanthus paru 0.74 3.74 2.09 0.55 2.91 63.31 Lutjanus buccanella 0.00 3.42 1.71 0.49 2.38 65.68 Holocentrus rufus 2.28 2.05 1.71 0.77 2.38 68.06 Chromis insolata 1.13 2.63 1.70 0.55 2.36 70.42 Serranus tortugarum 0.00 3.36 1.68 0.49 2.33 72.76 Lutjanus analis 0.92 2.62 1.58 0.58 2.20 74.96 Acanthurus chirurgus 1.82 1.68 1.57 0.56 2.18 77.14 Malacanthus plumieri 0.00 2.92 1.46 0.33 2.03 79.16 Pterois volitans 2.71 0.00 1.36 0.52 1.89 81.05 Paranthias furcifer 1.68 1.15 1.24 0.57 1.73 82.78 Lachnolaimus maximus 2.26 0.00 1.13 0.47 1.57 84.35 Mycteroperca venenosa 2.26 0.00 1.13 0.47 1.57 85.93 Holocentrus adcensionis 0.00 2.17 1.08 0.33 1.51 87.43 Scarus taeniopterus 1.54 1.11 1.08 0.77 1.50 88.93 Elagatis bipinnulata 0.00 2.09 1.05 0.33 1.45 90.39 Groups BCR & SAG Average dissimilarity = 68.78 Group BCR Group SAG Species Av.Abund Av.Abund Av.Diss Diss/SD Contrib% Cum.% Hypoplectrus puella 4.65 9.23 5.39 0.97 7.84 7.84 Chaetodon aculeatus 1.69 5.82 3.19 0.83 4.64 12.48 Chromis cyanea 6.34 10.54 3.06 1.63 4.44 16.92 Holacanthus tricolor 1.52 5.13 2.82 0.81 4.10 21.02 Thalassoma bifasciatum 4.16 6.30 2.76 1.38 4.01 25.03 Sparisoma aurofrenatum 4.60 8.16 2.57 1.45 3.74 28.77 Halichoeres garnoti 6.54 6.18 2.43 1.45 3.54 32.31 Acanthurus chirurgus 1.68 4.92 2.23 1.30 3.24 35.55 Chaetodon capistratus 3.75 0.00 1.88 0.60 2.73 38.28 Epinephelus cruentatus 2.76 1.82 1.70 0.87 2.48 40.75 Epinephelus fulva 1.46 2.57 1.58 0.83 2.30 43.06 Scarus taeniopterus 5.46 5.35 1.58 1.14 2.29 45.35 Equetus lanceolatus 0.33 2.89 1.52 0.72 2.21 47.56 Holocentrus rufus 2.11 1.82 1.48 0.90 2.15 49.72 Hypoplectrus chlorurus 2.93 0.00 1.46 0.50 2.13 51.84 Apogon maculatus 0.00 2.89 1.44 0.70 2.10 53.94 Halichoeres cyanocephalus 0.00 2.89 1.44 0.70 2.10 56.04 Hypoplectrus unicolor 0.00 2.89 1.44 0.70 2.10 58.14 Lactophrys trigonus 0.00 2.89 1.44 0.70 2.10 60.24 Sparisoma radians 0.44 2.57 1.39 0.74 2.02 62.26 Coryphopterus personatus 2.76 0.00 1.38 0.62 2.00 64.26 Sparisoma viride 1.58 1.82 1.34 0.81 1.95 66.21 Stegastes partitus 6.65 7.04 1.30 1.30 1.90 68.11 Epinephelus guttatus 2.53 0.00 1.27 0.66 1.84 69.95 Coryphopterus lipernes 2.50 0.00 1.25 0.61 1.82 71.77 Serranus tigrinus 0.83 1.82 1.16 0.76 1.69 73.46 Chaetodon striatus 0.46 1.82 1.09 0.66 1.58 75.04 Acanthurus coeruleus 2.16 0.00 1.08 0.69 1.57 76.61 Gobiosoma evelynae 2.07 0.00 1.04 0.48 1.51 78.12 Melichthys niger 0.77 1.62 1.03 0.70 1.50 79.62 Myripristis jacobus 2.04 0.00 1.02 0.55 1.49 81.11 Canthigaster rostrata 1.88 0.00 0.94 0.52 1.37 82.47 Acanthurus bahianus 1.83 0.00 0.91 0.53 1.33 83.80 Gramma loreto 1.80 0.00 0.90 0.57 1.31 85.11 Mulloidichthys martinicus 0.86 1.03 0.80 0.72 1.16 86.27 Clepticus parrae 1.57 0.00 0.78 0.53 1.14 87.41 Bodianus rufus 1.27 0.00 0.64 0.39 0.93 88.33 Pterois volitans 1.21 0.00 0.61 0.44 0.88 89.22 Lutjanus apodus 1.19 0.00 0.60 0.35 0.87 90.08 Groups CPV & SAG

109
Average dissimilarity = 73.20 Group CPV Group SAG Species Av.Abund Av.Abund Av.Diss Diss/SD Contrib% Cum.% Hypoplectrus puella 0.00 9.23 4.61 0.70 6.30 6.30 Thalassoma bifasciatum 11.25 6.30 4.55 1.13 6.22 12.52 Chromis cyanea 4.71 10.54 3.90 1.62 5.33 17.85 Halichoeres garnoti 8.79 6.18 3.68 1.23 5.03 22.89 Holocentrus rufus 6.31 1.82 3.51 0.60 4.79 27.68 Sparisoma aurofrenatum 3.00 8.16 3.07 1.70 4.19 31.87 Chaetodon aculeatus 0.91 5.82 3.06 0.75 4.18 36.05 Stegastes partitus 11.90 7.04 2.90 0.93 3.96 40.02 Epinephelus fulva 5.64 2.57 2.81 1.08 3.84 43.85 Holacanthus tricolor 0.36 5.13 2.63 0.73 3.59 47.44 Acanthurus chirurgus 2.80 4.92 2.35 1.26 3.20 50.65 Scarus taeniopterus 2.17 5.35 2.19 1.92 3.00 53.64 Serranus tigrinus 2.59 1.82 2.00 0.49 2.73 56.37 Apogon maculatus 0.00 2.89 1.44 0.70 1.97 58.34 Equetus lanceolatus 0.00 2.89 1.44 0.70 1.97 60.31 Halichoeres cyanocephalus 0.00 2.89 1.44 0.70 1.97 62.29 Hypoplectrus unicolor 0.00 2.89 1.44 0.70 1.97 64.26 Lactophrys trigonus 0.00 2.89 1.44 0.70 1.97 66.23 Sparisoma radians 0.71 2.57 1.44 0.75 1.96 68.20 Centropyge argi 2.69 0.00 1.35 0.35 1.84 70.04 Haemulon melanorum 2.48 0.00 1.24 0.55 1.69 71.73 Epinephelus guttatus 2.42 0.00 1.21 0.59 1.66 73.38 Sparisoma viride 0.74 1.82 1.21 0.61 1.65 75.03 Chaetodon striatus 0.68 1.82 1.18 0.63 1.61 76.65 Acanthurus coeruleus 2.36 0.00 1.18 0.64 1.61 78.26 Gobiosoma evelynae 2.09 0.00 1.05 0.43 1.43 79.69 Epinephelus cruentatus 0.21 1.82 0.95 0.72 1.29 80.98 Pterois volitans 1.84 0.00 0.92 0.39 1.25 82.23 Chaetodon sedentarius 1.71 0.00 0.85 0.33 1.17 83.40 Chromis insolata 1.67 0.00 0.83 0.28 1.14 84.54 Melichthys niger 0.00 1.62 0.81 0.70 1.11 85.65 Balistes vetula 1.43 0.00 0.72 0.40 0.98 86.63 Caranx ruber 1.24 0.00 0.62 0.23 0.85 87.48 Xanthichthys ringens 1.24 0.00 0.62 0.29 0.85 88.32 Amblycirrhitus pinos 1.23 0.00 0.62 0.26 0.84 89.16 Sphyraena barracuda 1.18 0.00 0.59 0.27 0.81 89.97 Scarus iserti 1.11 0.00 0.56 0.30 0.76 90.73 Groups PRF & SAG Average dissimilarity = 78.54 Group PRF Group SAG Species Av.Abund Av.Abund Av.Diss Diss/SD Contrib% Cum.% Hypoplectrus puella 0.00 9.23 4.61 0.70 5.88 5.88 Chromis cyanea 1.72 10.54 4.51 1.84 5.75 11.62 Sparisoma aurofrenatum 0.00 8.16 4.08 3.00 5.19 16.81 Halichoeres garnoti 10.77 6.18 3.64 1.17 4.64 21.45 Thalassoma bifasciatum 8.10 6.30 3.37 1.31 4.30 25.74 Epinephelus guttatus 6.73 0.00 3.36 0.72 4.28 30.03 Stegastes partitus 11.85 7.04 3.05 2.27 3.88 33.91 Chaetodon aculeatus 0.00 5.82 2.91 0.70 3.71 37.61 Xanthichthys ringens 5.28 0.00 2.64 0.59 3.36 40.97 Balistes vetula 5.15 0.00 2.58 0.83 3.28 44.26 Holacanthus tricolor 0.00 5.13 2.57 0.70 3.27 47.52 Acanthurus chirurgus 1.82 4.92 2.49 1.28 3.18 50.70 Serranus tigrinus 4.80 1.82 2.49 1.06 3.16 53.86 Epinephelus fulva 4.24 2.57 2.25 1.04 2.87 56.73 Scarus taeniopterus 1.54 5.35 2.17 1.90 2.77 59.50

110
Halichoeres maculipinna 3.97 0.00 1.98 0.56 2.53 62.03 Centropyge argi 3.34 0.00 1.67 0.49 2.13 64.15 Holocentrus rufus 2.28 1.82 1.55 0.92 1.98 66.13 Apogon maculatus 0.00 2.89 1.44 0.70 1.84 67.97 Equetus lanceolatus 0.00 2.89 1.44 0.70 1.84 69.81 Halichoeres cyanocephalus 0.00 2.89 1.44 0.70 1.84 71.65 Hypoplectrus unicolor 0.00 2.89 1.44 0.70 1.84 73.49 Lactophrys trigonus 0.00 2.89 1.44 0.70 1.84 75.32 Haemulon melanorum 2.85 0.00 1.42 0.71 1.81 77.14 Pterois volitans 2.71 0.00 1.36 0.51 1.73 78.86 Sparisoma radians 0.00 2.57 1.28 0.70 1.63 80.50 Epinephelus cruentatus 0.97 1.82 1.23 0.74 1.57 82.06 Lachnolaimus maximus 2.26 0.00 1.13 0.46 1.44 83.50 Mycteroperca venenosa 2.26 0.00 1.13 0.46 1.44 84.94 Pomacanthus arcuatus 1.86 0.00 0.93 0.31 1.19 86.13 Chaetodon striatus 0.00 1.82 0.91 0.70 1.16 87.29 Sparisoma viride 0.00 1.82 0.91 0.70 1.16 88.45 Paranthias furcifer 1.68 0.00 0.84 0.46 1.07 89.52 Melichthys niger 0.00 1.62 0.81 0.70 1.03 90.55 Groups CRR & SAG Average dissimilarity = 79.02 Group CRR Group SAG Species Av.Abund Av.Abund Av.Diss Diss/SD Contrib% Cum.% Hypoplectrus puella 0.00 9.23 4.61 0.70 5.84 5.84 Stegastes partitus 15.44 7.04 4.20 2.09 5.32 11.16 Sparisoma aurofrenatum 0.49 8.16 3.83 2.46 4.85 16.00 Chromis cyanea 4.59 10.54 3.82 1.54 4.83 20.83 Halichoeres garnoti 9.33 6.18 3.43 1.32 4.34 25.17 Thalassoma bifasciatum 5.76 6.30 3.32 1.31 4.21 29.38 Chaetodon aculeatus 0.00 5.82 2.91 0.70 3.68 33.06 Acanthurus chirurgus 1.68 4.92 2.81 1.26 3.55 36.61 Epinephelus fulva 4.42 2.57 2.74 0.81 3.47 40.08 Centropyge argi 5.34 0.00 2.67 0.62 3.38 43.46 Holacanthus tricolor 0.00 5.13 2.57 0.70 3.25 46.71 Scarus taeniopterus 1.11 5.35 2.36 2.16 2.98 49.69 Serranus tabacarius 4.67 0.00 2.33 0.48 2.95 52.64 Pomacanthus paru 3.74 0.00 1.87 0.48 2.37 55.01 Pomacanthus arcuatus 3.53 0.00 1.77 0.48 2.24 57.25 Lutjanus buccanella 3.42 0.00 1.71 0.48 2.16 59.41 Serranus tortugarum 3.36 0.00 1.68 0.48 2.12 61.53 Coryphopterus glaucophraenum 3.15 0.00 1.57 0.33 1.99 63.53 Holocentrus rufus 2.05 1.82 1.57 0.83 1.99 65.52 Malacanthus plumieri 2.92 0.00 1.46 0.33 1.85 67.36 Apogon maculatus 0.00 2.89 1.44 0.70 1.83 69.19 Equetus lanceolatus 0.00 2.89 1.44 0.70 1.83 71.02 Halichoeres cyanocephalus 0.00 2.89 1.44 0.70 1.83 72.85 Hypoplectrus unicolor 0.00 2.89 1.44 0.70 1.83 74.67 Lactophrys trigonus 0.00 2.89 1.44 0.70 1.83 76.50 Serranus tigrinus 1.37 1.82 1.41 0.70 1.79 78.29 Haemulon melanorum 2.63 0.00 1.32 0.44 1.67 79.96 Chromis insolata 2.63 0.00 1.31 0.44 1.66 81.62 Lutjanus analis 2.62 0.00 1.31 0.49 1.66 83.28 Sparisoma radians 0.00 2.57 1.28 0.70 1.62 84.90 Holocentrus adcensionis 2.17 0.00 1.08 0.33 1.37 86.27 Elagatis bipinnulata 2.09 0.00 1.05 0.33 1.32 87.60 Balistes vetula 1.93 0.00 0.97 0.33 1.22 88.82 Chaetodon striatus 0.00 1.82 0.91 0.70 1.15 89.97 Epinephelus cruentatus 0.00 1.82 0.91 0.70 1.15 91.12

111
Appendix 8 Densities of fish species surveyed from belt-transects at the CPV habitat in Lang Bank, 2012-13.
Stations SPA
W IW4
8 IW4
7 IW4
9 IW5
0 DB1
3 DB1
3 DB1
8 DB1
5 844
OW77
DB4
Depth (ft) 135 137 100 135 100 100 100 100 116 100 156 165
Species
Stegastes partitus 8 6 18 5 1 15 9 7 9 16 7 5
Thalassoma bifasciatum 5 4 0 0 0 1 8 17 3 14 0 1
Scarus taeniopterus 1 2 0 0 0 1 6 0 3 4 0 38
Chromis cyanea 0 3 0 1 0 3 1 3 2 0 0 8
Halichoeres garnoti 1 2 4 0 0 3 5 0 0 0 0 4
Centropyge argi 0 0 1 0 0 0 0 0 0 0 0 0
Clepticus parrae 0 0 0 0 0 0 0 0 0 0 0 25
Acanthurus chirurgus 0 0 2 5 0 2 3 0 1 2 0 0
Epinephelus fulva 0 0 1 1 0 3 1 0 0 3 2 0
Sparisoma aurofrenatum 0 1 0 1 0 2 1 2 2 1 0 4
Haemulon flavolineatum 0 0 0 0 0 0 0 0 11 0 0 0
Scarus iserti 0 0 0 3 0 0 0 0 0 0 0 0
Cottonwick 0 3 1 5 0 0 0 0 0 2 1 0
Caranx ruber 0 0 0 0 0 0 0 0 0 0 0 0
Holocentrus rufus 0 0 1 2 1 1 0 0 1 0 0 0
Acanthurus coeruleus 1 1 0 1 0 1 1 2 1 0 0 0
Chromis insolata 0 0 0 0 0 0 0 0 0 0 0 0
Gobiosoma evelynae 0 0 0 0 0 0 1 0 1 0 0 0
Halichoeres maculipinna 0 0 0 0 0 0 0 0 0 0 0 0
Sparisoma radians 0 0 0 0 0 0 2 0 0 0 0 0
Serranus tigrinus 0 1 2 0 1 0 0 0 0 0 0 0
Coryphopterus lipernes 0 0 0 0 0 3 0 0 0 0 0 0
Acanthurus bahianus 1 0 0 0 0 0 0 0 0 2 0 0
Chaetodon aculeatus 0 0 0 0 0 0 0 0 1 0 0 0
Chaetodon capistratus 0 0 0 0 0 0 0 0 0 1 0 0
Chaetodon sedentarius 0 0 1 1 0 0 0 0 0 0 0 0
Chaetodon striatus 0 0 0 0 0 0 0 0 0 0 0 0 Coryphopterus
personatus 0 0 0 0 0 0 0 0 0 0 0 0
Dasyatis americana 0 0 0 0 0 0 0 0 0 0 0 0
Amblycirrhitus pinos 0 0 0 0 0 0 0 0 0 0 0 0
Canthigaster rostrata 0 0 0 0 0 0 1 0 1 0 0 0
Paranthias furcifer 0 0 0 0 0 0 1 0 0 0 0 0
Xanthichthys ringens 0 0 0 0 0 0 0 1 0 0 1 0 Acanthostracion
quadricomis 0 0 0 1 0 0 0 0 0 0 0 0

112
Canthidermis sufflamen 0 0 0 0 0 1 0 0 0 0 0 0 Coryphopterus
glaucophraenum 0 0 0 0 0 0 0 0 0 0 1 0
Epinephelus cruentatus 0 0 0 0 0 0 0 0 0 0 0 0
Gramma loreto 0 0 0 0 0 0 0 0 0 0 0 0
Holacanthus tricolor 0 0 0 0 0 1 0 0 0 0 0 0
Malacanthus plumieri 0 0 0 1 0 0 0 0 0 0 0 0
Pomacanthus arcuatus 0 0 1 0 0 0 0 0 0 0 0 0
Sargocentron coruscus 0 0 0 0 0 0 0 0 1 0 0 0
Sparisoma atomarium 0 0 0 0 0 0 0 0 0 0 0 1
Sparisoma viride 1 0 0 0 0 0 0 0 0 0 0 0
Total Individuals 18 23 32 27 3 37 40 32 37 45 12 86
Total Species 7 9 10 12 3 13 13 6 13 9 5 8
Stations OW51 OW52 OW53 OW53 OW56 OW57 OW63 OW59 OW60 OW55
Depth (ft) 135 100 155 135 135 155 135 165 135 110
Species
Stegastes partitus 4 6 4 7 3 2 6 2 0 6
Thalassoma bifasciatum 5 12 2 1 0 3 3 7 8 0
Scarus taeniopterus 0 0 0 0 0 0 0 0 0 0
Chromis cyanea 0 4 0 2 6 0 4 7 0 1
Halichoeres garnoti 0 1 2 0 4 3 3 2 0 5
Centropyge argi 0 0 0 5 16 0 4 0 0 0
Clepticus parrae 0 0 0 0 0 0 0 0 0 0
Acanthurus chirurgus 0 0 0 0 0 1 0 0 0 0
Epinephelus fulva 1 1 0 0 2 1 0 1 0 0
Sparisoma aurofrenatum 0 0 0 0 0 0 0 0 0 0
Haemulon flavolineatum 0 0 0 0 0 0 0 0 0 0
Scarus iserti 0 10 0 0 0 0 0 0 0 0
Cottonwick 0 0 0 0 0 1 1 0 0 0
Caranx ruber 0 0 0 0 0 0 0 0 0 1
Holocentrus rufus 2 0 0 0 2 0 0 0 1 0
Acanthurus coeruleus 0 0 0 0 0 0 0 1 0 0
Chromis insolata 0 0 2 0 8 0 0 0 0 0
Gobiosoma evelynae 0 0 0 0 0 1 0 0 1 0
Halichoeres maculipinna 0 0 0 0 0 0 0 0 0 0
Sparisoma radians 0 0 0 0 0 0 0 0 0 0
Serranus tigrinus 0 0 0 0 0 0 0 0 0 0
Coryphopterus lipernes 0 0 0 0 0 0 0 0 0 0
Acanthurus bahianus 0 0 0 0 0 0 0 0 0 0
Chaetodon aculeatus 0 0 0 0 0 0 0 0 0 0
Chaetodon capistratus 0 0 0 0 0 0 0 0 0 0

113
Chaetodon sedentarius 0 0 0 0 0 1 0 0 0 0
Chaetodon striatus 0 0 0 0 0 0 0 0 0 2
Coryphopterus personatus 0 0 0 0 0 0 0 0 0 0
Dasyatis americana 0 0 0 0 0 0 0 0 0 2
Amblycirrhitus pinos 0 0 0 0 0 0 1 0 0 0
Canthigaster rostrata 0 0 0 0 0 0 0 0 0 0
Paranthias furcifer 0 0 0 0 0 0 0 0 0 0
Xanthichthys ringens 0 0 0 0 0 0 0 0 0 0
Acanthostracion quadricomis 0 0 0 0 0 0 0 0 0 0
Canthidermis sufflamen 0 0 0 0 0 0 0 0 0 0 Coryphopterus
glaucophraenum 0 0 0 0 0 0 0 0 0 0
Epinephelus cruentatus 0 0 0 0 0 0 0 0 0 0
Gramma loreto 0 0 0 0 0 0 0 0 0 0
Holacanthus tricolor 0 0 0 0 0 0 0 0 0 0
Malacanthus plumieri 0 0 0 0 0 0 0 0 0 0
Pomacanthus arcuatus 0 0 0 0 0 0 0 0 0 0
Sargocentron coruscus 0 0 0 0 0 0 0 0 0 0
Sparisoma atomarium 0 0 0 0 0 0 0 0 0 0
Sparisoma viride 0 0 0 0 0 0 0 0 0 0
Total Individuals 12 34 10 15 41 13 22 20 10 17
Total Species 4 6 4 4 7 8 7 6 3 6
Stations OW58 OW64 OW67 lb3
Depth (ft) 110 135 100 135 MEANS
Species
Stegastes partitus 8 5 10 2 6.6
Thalassoma bifasciatum 14 11 14 3 5.2
Scarus taeniopterus 7 0 0 5 2.6
Chromis cyanea 7 0 0 6 2.2
Halichoeres garnoti 6 4 1 6 2.2
Centropyge argi 1 0 0 0 1.0
Clepticus parrae 0 0 0 0 1.0
Acanthurus chirurgus 3 0 3 0 0.8
Epinephelus fulva 3 0 1 1 0.8
Sparisoma aurofrenatum 2 0 2 0 0.7
Haemulon flavolineatum 0 0 4 0 0.6

114
Scarus iserti 0 0 0 2 0.6
Cottonwick 0 0 0 0 0.5
Caranx ruber 0 12 0 0 0.5
Holocentrus rufus 0 0 0 0 0.4
Acanthurus coeruleus 2 0 0 0 0.4
Chromis insolata 0 0 0 0 0.4
Gobiosoma evelynae 1 1 0 0 0.2
Halichoeres maculipinna 4 0 1 0 0.2
Sparisoma radians 3 0 0 0 0.2
Serranus tigrinus 0 0 0 0 0.2
Coryphopterus lipernes 0 0 0 0 0.1
Acanthurus bahianus 0 0 0 0 0.1
Chaetodon aculeatus 0 0 0 2 0.1
Chaetodon capistratus 1 0 1 0 0.1
Chaetodon sedentarius 0 0 0 0 0.1
Chaetodon striatus 0 0 0 0 0.1
Coryphopterus personatus 0 0 0 2 0.1
Dasyatis americana 0 0 0 0 0.1
Amblycirrhitus pinos 1 0 0 0 0.1
Canthigaster rostrata 0 0 0 0 0.1
Paranthias furcifer 0 0 1 0 0.1
Xanthichthys ringens 0 0 0 0 0.1
Acanthostracion quadricomis 0 0 0 0 0.04
Canthidermis sufflamen 0 0 0 0 0.04
Coryphopterus glaucophraenum 0 0 0 0 0.04
Epinephelus cruentatus 1 0 0 0 0.04
Gramma loreto 0 0 0 1 0.04
Holacanthus tricolor 0 0 0 0 0.04
Malacanthus plumieri 0 0 0 0 0.04
Pomacanthus arcuatus 0 0 0 0 0.04
Sargocentron coruscus 0 0 0 0 0.04
Sparisoma atomarium 0 0 0 0 0.04
Sparisoma viride 0 0 0 0 0.04

115
Total Individuals 64 33 38 30 28.9
Total Species 16 5 10 10 7.8
Appendix 9 Densities of fish species surveyed from belt-transects at the BCR habitat in Lang Bank, 2012-13.
Stations SPAW IW42 DB26 816 DB28 DB27 819 DB14 823 IW35 IW35 IW37 IW38 IW39
Depth (ft) 100 100 142 140 135 135 132 100 100 135 140 132 115 130
Species Coryphopterus
personatus 0 0 0 11 2 14 10 0 0 0 0 0 0 0 Chromis cyanea 5 2 11 11 2 8 10 5 10 1 1 3 2 0 Clepticus parrae 0 0 4 2 0 0 5 0 0 0 0 0 0 0
Stegastes partitus 10 5 10 4 8 1 8 5 8 1 5 1 3 0 Scarus
taeniopterus 1 0 6 4 4 5 10 5 9 5 3 6 3 1 Coryphopterus
lipernes 0 0 0 0 3 5 5 0 0 0 0 0 0 0 Thalassoma bifasciatum 3 0 1 0 1 2 3 0 15 1 0 1 4 0 Halichoeres
garnoti 3 1 0 3 1 1 5 2 1 1 1 1 1 2 Sparisoma
aurofrenatum 0 0 1 0 1 1 0 0 0 3 2 1 1 1 Scarus iserti 0 4 1 0 0 0 0 0 0 0 0 0 0 0 Gobiosoma
evelynae 0 0 0 0 2 0 0 0 1 0 0 0 0 0 Chaetodon capistratus 0 2 0 1 2 0 0 0 1 0 0 0 0 1
Gramma loreto 0 1 1 0 1 2 1 0 0 0 0 0 0 0 Acanthurus
chirurgus 0 1 1 1 3 0 1 0 0 0 0 1 0 0 Acanthurus
coeruleus 1 1 1 1 0 0 0 0 0 1 0 0 0 1 Myripristis
jacobus 0 0 2 1 1 1 2 0 0 0 0 0 0 0 Hypoplectrus
puella 0 0 1 0 0 0 1 0 0 1 0 0 1 0 Melichthys niger 0 0 0 0 0 0 0 0 0 0 0 0 0 0
Haemulon flavolineatum 0 1 0 0 1 0 1 1 4 1 0 0 0 0 Epinephelus
cruentatus 1 1 1 0 0 0 0 0 0 0 0 0 0 1 Mulloidichthys
martinicus 0 0 0 0 1 0 0 0 0 0 1 0 0 1 Canthigaster
rostrata 0 0 0 0 1 0 0 0 0 1 0 0 0 0 Holocentrus
rufus 0 2 0 0 0 0 0 0 0 1 0 0 0 0 Acanthurus
bahianus 1 0 0 0 0 1 0 1 0 0 0 0 0 0

116
Sparisoma viride 0 1 0 1 1 0 0 2 1 0 0 0 0 0 Hypoplectrus
chlorurus 0 1 0 0 0 0 1 0 0 0 1 1 0 0 Bodianus rufus 1 0 0 0 2 0 0 0 0 0 0 0 1 0
Chaetodon aculeatus 0 0 0 0 0 0 0 0 0 1 0 1 0 0
Epinephelus fulva 0 0 0 0 0 0 0 1 0 0 0 0 0 1
Flammeo marianus 0 2 1 0 0 0 0 0 0 0 0 0 0 0
Holacanthus tricolor 0 1 0 0 0 0 0 0 0 0 0 0 0 0
Paranthias furcifer 0 0 0 2 0 0 0 0 0 0 0 0 0 0
Pomacanthus paru 0 0 0 0 1 1 0 1 0 0 0 0 0 0
Microspathodon chrysurus 0 2 0 0 0 0 0 0 0 0 0 0 0 0
Holacanthus ciliaris 0 0 0 0 0 0 1 1 0 0 0 0 0 0
Chaetodon striatus 2 0 0 0 0 0 0 0 0 0 0 0 0 0
Serranus tortugarum 0 0 0 0 0 0 0 0 0 0 0 0 0 0
Scarus vetula 0 0 0 0 0 0 0 0 0 0 0 0 0 0 Cottonwick 0 0 0 0 1 0 0 0 0 0 0 0 0 0
Serranus tigrinus 1 0 0 0 0 0 0 0 0 0 0 0 0 0 Anisotremus
virginicus 0 0 0 0 0 0 0 0 0 0 0 0 0 0 Caranx crysos 0 0 0 0 0 0 0 0 0 0 0 0 0 0
Caranx lugubris 0 1 0 0 0 0 0 0 0 0 0 0 0 0 Centropyge argi 0 0 0 0 0 0 0 0 0 0 0 0 0 0
Chromis multilineata 0 0 0 0 0 0 0 0 0 0 0 0 0 0
Diodon histrix 0 0 0 0 0 0 0 1 0 0 0 0 0 0 Equetus
lanceolatus 0 0 0 0 0 1 0 0 0 0 0 0 0 0 Haemulon
sciurus 0 0 0 0 0 0 0 0 0 0 0 0 0 0 Lutjanus
mahogany 0 0 0 0 1 0 0 0 0 0 0 0 0 0 Liopropoma
rubre 0 0 0 0 0 0 0 0 0 0 0 0 0 0 Malacanthus
plumieri 0 0 0 0 0 0 0 0 0 0 0 0 0 0 Pomacanthus
arcuatus 0 0 0 0 0 0 0 0 1 0 0 0 0 0 Seriola rivoliana 0 0 0 0 0 0 0 1 0 0 0 0 0 0
Serranus tabacarius 0 0 0 0 0 0 0 0 0 0 0 0 0 0
Total Individuals 29 29 42 42 40 43 64 26 51 18 14 16 16 9
Total Species 11 17 14 12 21 13 15 12 10 12 7 9 8 8

117
Stations IW36 IW36 DB2 DB3 DB21 DB21 DB22 DB22 IW33 IW34 DB7 DB6 lb2 lb10
Depth (ft) 100 100 165 165 135 131 135 135 135 135 155 165 150 151
Species Coryphopterus
personatus 0 0 10 0 0 0 0 0 44 6 0 0 1 36 Chromis cyanea 1 8 4 3 16 10 2 9 4 1 12 4 0 3 Clepticus parrae 0 1 0 0 0 0 0 0 0 0 100 1 0 7
Stegastes partitus 4 6 5 4 2 2 6 6 3 5 0 5 2 3 Scarus taeniopterus 2 0 6 6 5 2 5 5 0 6 0 4 11 0
Coryphopterus lipernes 0 0 0 0 3 1 0 0 30 10 0 5 0 7
Thalassoma bifasciatum 5 5 0 0 1 3 2 2 0 1 0 1 1 2
Halichoeres garnoti 1 1 2 1 1 0 3 5 2 1 2 1 1 3 Sparisoma
aurofrenatum 0 1 0 1 1 0 1 2 0 1 0 1 1 2 Scarus iserti 0 0 0 0 0 0 0 0 0 0 16 1 0 0 Gobiosoma
evelynae 0 0 0 0 1 0 0 0 5 5 0 0 0 2 Chaetodon capistratus 0 0 2 0 0 0 0 0 0 0 0 0 2 1
Gramma loreto 0 0 1 0 0 0 1 0 0 0 3 0 0 0 Acanthurus
chirurgus 0 0 1 1 0 0 0 0 0 1 0 0 0 0 Acanthurus
coeruleus 1 1 0 0 0 1 0 0 0 0 0 1 0 0 Myripristis jacobus 0 0 0 0 0 0 0 0 0 1 1 0 0 1
Hypoplectrus puella 0 0 1 1 1 0 1 1 0 0 0 1 0 0 Melichthys niger 0 0 0 1 0 0 0 1 0 0 0 0 0 0
Haemulon flavolineatum 0 0 1 1 0 0 0 0 0 0 0 0 0 0 Epinephelus
cruentatus 0 1 0 1 0 1 0 0 0 0 2 0 0 0 Mulloidichthys
martinicus 0 0 0 0 0 0 0 0 0 0 0 0 0 6 Canthigaster
rostrata 0 0 0 0 0 1 0 0 0 1 0 0 0 1 Holocentrus rufus 0 0 0 1 0 0 0 0 0 1 1 1 0 2
Acanthurus bahianus 1 1 0 0 0 0 0 0 0 0 0 1 1 1
Sparisoma viride 0 0 0 0 0 0 0 0 1 0 1 0 0 0 Hypoplectrus
chlorurus 0 0 1 1 0 0 0 0 0 0 0 0 0 0 Bodianus rufus 0 0 0 1 0 0 0 0 0 0 1 0 0 0
Chaetodon aculeatus 0 0 0 1 0 1 0 0 1 0 0 0 0 0
Epinephelus fulva 0 1 0 0 0 0 0 0 0 1 1 0 0 1 Flammeo marianus 0 0 1 0 0 0 0 0 0 0 0 1 0 0
Holacanthus tricolor 0 1 1 1 0 0 0 0 0 1 0 0 0 0 Paranthias furcifer 0 0 0 1 1 0 0 0 0 0 0 0 0 0
Pomacanthus paru 0 1 0 0 0 0 0 0 0 0 0 0 0 0 Microspathodon
chrysurus 1 0 0 0 0 0 0 0 0 0 0 0 0 0 Holacanthus ciliaris 0 0 0 0 0 1 0 0 0 0 0 0 0 0 Chaetodon striatus 0 0 0 0 0 0 0 0 0 0 0 0 0 0

118
Serranus tortugarum 0 0 2 0 0 0 0 0 0 0 0 0 0 0 Scarus vetula 0 0 0 0 0 0 0 0 0 0 0 0 0 2
Cottonwick 0 0 0 0 0 0 0 0 0 0 1 0 0 0 Serranus tigrinus 0 1 0 0 0 0 0 0 0 0 0 0 0 0
Anisotremus virginicus 0 0 0 0 0 0 0 1 0 0 0 0 0 0
Caranx crysos 0 0 0 0 0 0 1 0 0 0 0 0 0 0 Caranx lugubris 0 0 0 0 0 0 0 0 0 0 0 0 0 0 Centropyge argi 0 0 0 0 0 0 0 0 0 0 0 1 0 0
Chromis multilineata 0 0 0 0 0 0 0 1 0 0 0 0 0 0 Diodon histrix 0 0 0 0 0 0 0 0 0 0 0 0 0 0
Equetus lanceolatus 0 0 0 0 0 0 0 0 0 0 0 0 0 0 Haemulon sciurus 0 0 0 0 0 0 0 0 0 0 0 0 0 0
Lutjanus mahogany 0 0 0 0 0 0 0 0 0 0 0 0 0 0 Liopropoma rubre 0 0 0 0 0 0 0 0 0 0 0 0 0 1
Malacanthus plumieri 0 0 1 0 0 0 0 0 0 0 0 0 0 0
Pomacanthus arcuatus 0 0 0 0 0 0 0 0 0 0 0 0 0 0
Seriola rivoliana 0 0 0 0 0 0 0 0 0 0 0 0 0 0 Serranus tabacarius 0 0 0 0 0 0 0 0 0 0 0 1 0 0
Total Individuals 16 29 39 26 32 23 22 33 90 42 141 30 20 81
Total Species 8 13 15 16 10 10 9 11 7 15 12 16 8 18
Stations lb8 lb7 lb6 IW31 IW32
Depth (ft) 150 145 140 138 110
Species MEANS Coryphopterus personatus 30 18 0 48 0 7.0
Chromis cyanea 2 10 0 7 25 5.8 Clepticus parrae 2 6 30 0 0 4.8
Stegastes partitus 4 9 8 1 8 4.6 Scarus taeniopterus 1 0 2 8 6 4.0
Coryphopterus lipernes 0 11 0 14 9 3.1 Thalassoma bifasciatum 2 1 3 3 1 1.9
Halichoeres garnoti 1 0 0 3 3 1.6 Sparisoma aurofrenatum 0 1 1 2 0 0.8
Scarus iserti 2 0 0 0 0 0.7 Gobiosoma evelynae 0 0 0 4 4 0.7
Chaetodon capistratus 1 1 2 0 0 0.5 Gramma loreto 0 0 0 1 1 0.4
Acanthurus chirurgus 1 0 0 0 1 0.4 Acanthurus coeruleus 0 1 0 1 1 0.4
Myripristis jacobus 0 0 2 0 0 0.4 Hypoplectrus puella 0 1 0 1 0 0.4

119
Melichthys niger 0 0 8 0 1 0.3 Haemulon flavolineatum 0 0 0 0 0 0.3 Epinephelus cruentatus 0 1 0 1 0 0.3
Mulloidichthys martinicus 0 0 0 1 0 0.3 Canthigaster rostrata 0 2 0 2 1 0.3
Holocentrus rufus 0 1 0 0 0 0.3 Acanthurus bahianus 0 0 0 0 1 0.3
Sparisoma viride 0 0 0 0 0 0.2 Hypoplectrus chlorurus 0 0 1 1 0 0.2
Bodianus rufus 0 0 0 0 0 0.2 Chaetodon aculeatus 0 1 0 0 0 0.2
Epinephelus fulva 0 0 0 0 0 0.2 Flammeo marianus 0 0 0 0 0 0.2
Holacanthus tricolor 0 0 0 0 0 0.2 Paranthias furcifer 0 0 0 0 0 0.1
Pomacanthus paru 0 0 0 0 0 0.1 Microspathodon chrysurus 0 0 0 0 0 0.1
Holacanthus ciliaris 0 0 0 0 0 0.1 Chaetodon striatus 0 0 0 0 0 0.1
Serranus tortugarum 0 0 0 0 0 0.1 Scarus vetula 0 0 0 0 0 0.1
Cottonwick 0 0 0 0 0 0.1 Serranus tigrinus 0 0 0 0 0 0.1
Anisotremus virginicus 0 0 0 0 0 0.03 Caranx crysos 0 0 0 0 0 0.03
Caranx lugubris 0 0 0 0 0 0.03 Centropyge argi 0 0 0 0 0 0.03
Chromis multilineata 0 0 0 0 0 0.03 Diodon histrix 0 0 0 0 0 0.03
Equetus lanceolatus 0 0 0 0 0 0.03 Haemulon sciurus 1 0 0 0 0 0.03
Lutjanus mahogany 0 0 0 0 0 0.03 Liopropoma rubre 0 0 0 0 0 0.03
Malacanthus plumieri 0 0 0 0 0 0.03 Pomacanthus arcuatus 0 0 0 0 0 0.03
Seriola rivoliana 0 0 0 0 0 0.03 Serranus tabacarius 0 0 0 0 0 0.03
Total Individuals 47 64 57 98 62 42.2
Total Species 11 14 9 16 13 12.1

120
Appendix 10 Densities of fish species surveyed from belt-transects at the CRR habitat in Lang Bank, 2012-13.
Stations OW68 OW68 OW76 DB15 OW62 OW66 DB17 lb9 lb15 OW76 Depth (ft) 165 130 100 131 165 135 135 145 160 140
Species MEANS Stegastes partitus 14 16 7 11 12 5 6 4 3 9 8.7
Centropyge argi 0 4 0 0 12 5 0 0 0 0 2.1 Halichoeres garnoti 4 2 0 2 3 1 1 0 0 6 1.9
Chromis cyanea 5 1 0 0 0 2 2 0 0 8 1.8 Thalassoma bifasciatum 5 4 4 1 0 4 0 0 0 0 1.8
Scarus taeniopterus 0 0 6 0 0 0 0 0 0 2 0.8 Paranthias furcifer 0 0 0 0 0 0 0 0 0 6 0.6
Chromis insolata 5 0 0 0 1 0 0 0 0 0 0.6 Haemulon
melanorum 0 0 0 0 0 0 0 2 0 2 0.4 Pomacanthus paru 0 0 2 0 2 0 0 0 0 0 0.4 Epinephelus fulva 0 0 1 0 0 0 1 0 2 0 0.4
Acanthurus chirurgus 0 0 0 3 0 0 0 0 0 0 0.3 Gramma loreto 0 0 0 0 0 0 0 0 0 3 0.3
Holocentrus rufus 0 0 1 0 0 0 0 0 0 2 0.3 Serranus tabacarius 0 0 0 0 0 0 1 0 2 0 0.3
Acanthurus bahianus 0 0 2 0 0 0 0 0 0 0 0.2 Coryphopterus
glaucophraenum 0 0 0 0 0 0 0 2 0 0 0.2 Pomacanthus
arcuatus 0 1 1 0 0 0 0 0 0 0 0.2 Serranus tortugarum 0 0 0 1 0 0 0 1 0 0 0.2 Gobiosoma evelynae 0 0 1 0 0 0 0 0 0 0 0.1
Halichoeres maculipinna 0 0 0 0 0 0 0 1 0 0 0.1 Holocentrus adcensionis 0 0 0 1 0 0 0 0 0 0 0.1
Malacanthus plumieri 0 0 0 0 0 0 1 0 0 0 0.1 Serranus tigrinus 0 0 0 1 0 0 0 0 0 0 0.1
Sparisoma aurofrenatum 0 0 0 0 0 0 0 0 0 1 0.1
Xanthichthys ringens 0 0 1 0 0 0 0 0 0 0 0.1 Total Individuals 33 28 26 20 30 17 12 10 7 39 22.2
Total Species 5 6 10 7 5 5 6 5 3 9 6.1

121
Appendix 11.
Size-frequency distribution of fish and shellfish species of commercial
value from mesophotic (30-50 m) benthic habitats surveyed at Lang Bank,
St. Croix, USVI during 2012-13
Lang Bank 2/22/2013 - 10/5/2013
Bank Coral Reef Colonized Pavement
Colonized Rhodolith Reef
Spur and Groove
135-165ft 100-165ft 135-165ft 100-115ft
Area (m2) 3,600 6,800 1,200 1,600 Distance (m) 900 1700 300 400 Species Name
Epinephelus guttatus 2 - 20cm 1 - 15cm
2 - 27cm
1 - 25cm 2 - 27cm
1 - 30cm
4 - 30cm 1 - 33cm
5 - 33cm 1 - 35cm
4 - 35cm 1 - 40cm
3 - 38cm 1 - 43cm
1 - 40cm
Pterois volitans 3 - 25cm 15 - 20cm
1 - 15cm
3 - 30cm 10 - 25cm
2 - 20cm
4 - 40cm 4 - 27cm
4 - 25cm
3 - 43cm 28 - 30cm
5 - 30cm
2 - 33cm
5 - 35cm
Lutjanus analis 2 - 30cm 1 - 45cm 2 - 50cm 1 - 55cm
2 - 40cm 1 - 50cm
2 - 45cm
3 - 50cm
2 - 55cm
Lutjanus apodus 1 - 20cm 1 - 25cm
1 - 35cm
1 - 30cm 2 - 38cm
1 - 35cm 1 - 40cm
1 - 38cm
1 - 40cm
1 - 60cm
Lachnolaimus maximus 1 - 60cm 1 - 76cm
1 - 48cm

122
1 - 71cm
1 - 60cm
Balistes vetula 1 - 35cm 1 - 25cm 3 - 38cm 1 - 36cm
3 - 30cm 1 - 45cm 3 - 38cm
2 - 33cm 3 - 50cm 1 - 43cm
12 - 35cm
2 - 40cm
1 - 45cm
Mycteroperca venenosa 1 - 25cm 1 - 91cm
Panulirus argus 1 - 20cm 5 - 15cm
5 - 25cm
4 - 17cm
3 - 30cm
11 - 20cm
2 - 23cm
Ginglymostoma cirratum 1 - 140cm 1 - 155cm 1 - 186cm 1 - 90cm
1 - 185cm
1 - 200cm
2 - 200cm
Seriola rivoliana 1 - 30cm 1 - 30cm
1 - 35cm
Sparisoma guacamaia
2 - 76cm
Caranx lugubris
2 - 38cm
Caranx bartholomaei
3 - 30cm
4 - 35cm
Caranx ruber
50 - 25cm
Elagatis bipinnulata
1 - 50cm
Epinephelus striatus
1 - 71cm
Lutjanus cyanopterus
1 - 100cm
Lutjanus jocu
1 - 40cm

123
Ocyurus chrysurus
1 - 38cm
1 - 35cm
Acanthostracion quadricomis
2 - 15cm
Caranx crysos
2 - 40cm
1 - 45cm
Sphyraena barracuda
1 - 30cm
1 - 55cm
3 - 40cm
1 - 76cm
2 - 50cm
1 - 60cm
2 - 71cm
2 - 76cm
1 - 91cm
Strombus gigas
16 - 23cm 3 - 21cm
15 - 24cm
12 - 25cm
Caranx latus
2 - 60cm
Appendix 12. Length-density distribution of the numerically prominent fish and shellfish species
surveyed from mesophotic (30 – 50 m) habitats at Lang Bank. 2012-13.
Length (cm)
Strombus gigas
Panulirus argus
Epinephelus guttatus
Pterois spp.
Lutjanus analis
Balistes vetula
N=46 N=31 N=30 N=89 N=16 N=31 10
0.0758
15
0.7576 0.1515 0.0758 17
0.3030
20
1.1364 0.0758 1.2879 21 0.2273
22 0.1515 23 1.2121 0.1515
24 1.1364 25 3.0303
0.6061 1.2879
0.0758 26 0.0758
27 0.0758
124
30
0.9091 3.0303 0.1515 0.2273 35
0.4545 0.5303
1.2879
40
0.5303 0.1515 0.6061 45
0.2273 0.2273
50
0.4545 0.2273 55
0.2273