Embed Size (px)
Citation preview

ww.sciencedirect.com
i n t e rn a t i o n a l j o u r n a l o f h y d r o g e n en e r g y 3 8 ( 2 0 1 3 ) 4 1 1 6e4 1 2 3
Available online at w
journal homepage: www.elsevier .com/locate/he
Mesoporous carbon supported PtRu as anodecatalyst for direct methanol fuel cell: Polarizationmeasurements and electrochemical impedanceanalysis of mass transport
Mariano M. Bruno a,b, M. Agustina Petruccelli a, Federico A. Viva a,*, Horacio R. Corti a,c
aGrupo Celdas de Combustible, Departamento de Fısica de la Materia Condensada, Centro Atomico Constituyentes, Comision Nacional de
Energıa Atomica (CNEA), Av General Paz 1499 (1650), San Martın, Buenos Aires, ArgentinabEscuela de Ciencia y Tecnologıa, Universidad de Gral, San Martın, Martin de Irigoyen 3100 (1650), San Martın, Buenos Aires, Argentinac Instituto de Quımica Fısica de los Materiales, Medio Ambiente y Energıa (INQUIMAE), Facultad de Ciencia Exactas y Naturales, Universidad
de Buenos Aires, Intendente Guiraldes 2160 (1428), Ciudad Universitaria, Buenos Aires, Argentina
a r t i c l e i n f o
Article history:
Received 6 November 2012
Received in revised form
3 January 2013
Accepted 4 January 2013
Available online 13 February 2013
Keywords:
PtRu catalyst
Mesoporous carbon
Direct methanol fuel cell
Electrochemical impedance
spectroscopy
Mass transport
* Corresponding author. Tel.: þ54 11 6772 76E-mail address: [email protected]
0360-3199/$ e see front matter Copyright ªhttp://dx.doi.org/10.1016/j.ijhydene.2013.01.0
a b s t r a c t
The performance of membrane electrode assembly (MEA) prepared with PtRu nano-
particles supported on a mesoporous carbon as anode catalyst are presented and com-
pared against PtRu synthesized over Vulcan carbon. Polarization and power curves were
obtained using 1 M methanol aqueous solution at the anode and O2 at the cathode. The
mesoporous carbon supported catalyst shows peak power of 40 mW cm�2 and 67 mW cm�2
at 30 �C and 60 �C respectively, that is, 15e30% higher than the Vulcan supported catalyst,
and exhibits a wider range of operating current. Moreover, an improvement in the mass
transport is observed for the catalyst supported on mesoporous carbon, yielding a lower
voltage drop at high current density. This behavior was confirmed by electrochemical
impedance spectroscopy (EIS), where an increases of the Warburg coefficient value by
a factor 3e4 for the catalyst supported on mesoporous carbon as compared with that
supported on Vulcan, would indicate a more facile diffusion of methanol through the
mesoporous carbon.
Copyright ª 2013, Hydrogen Energy Publications, LLC. Published by Elsevier Ltd. All rights
reserved.
1. Introduction ease of handling as a liquid at ambient conditions [1], and also
Continuous efforts for improving the performance of Fuel Cell
(FC) are of great interest because they hold the promise of
a convenient energy source for portable applications, in par-
ticular of thePolymer ElectrolyteMembrane (PEM) type.Among
those type of fuel cells the direct methanol fuel cell (DMFC) has
attracted a great deal of attention, partly because ofmethanol’s
favorable properties such as high volumetric energy density,
76; fax: þ54 11 6772 7121.(F.A. Viva).2013, Hydrogen Energy P26
because of the availability of an efficient bimetallic catalyst for
methanol oxidation (e.g. PtRu) [2e4]. Nevertheless, noble
metals catalysts are required in high loadings to sustain rea-
sonable power densities in DMFC [5,6], not only due to the ox-
ygen reduction reaction on the cathode but also due to
methanol oxidation, much more sluggish than H2 oxidation.
Thecatalystmetalnanoparticlesare commonly supportedover
carbonparticles in order tohave a gooddispersion, increase the
ublications, LLC. Published by Elsevier Ltd. All rights reserved.

Nomenclature
CAdl Double layer capacitance (F cm�2)
CPE Constant phase element (U cm2)
j Current density (mA cm�2)
Lk Relaxation inductance (H cm�2)
Lw Wiring inductance (H cm�2)
nCPE CPE exponential factor
P Power density (W cm�2)
RAct Anode charge transfer resistance (U cm2)
Rc Cell resistance (U cm2)
RCct Cathode charge transfer resistance (U cm2)
Rk Relaxation resistance (U cm2)
W Warburg impedance (U cm2)
Y0 CPE CPE coefficient (S sn cm�2)
Y0 W Warburg coefficient (S s0.5 cm�2)
u Frequency (Hz)
i n t e r n a t i o n a l j o u r n a l o f h y d r o g e n en e r g y 3 8 ( 2 0 1 3 ) 4 1 1 6e4 1 2 3 4117
surface area and reduce the metal loading as described by
numerous reports and reviews on the preparation and char-
acterization on supported catalyst [7e9]. The carbon support
also provides the electrical connectivity between the metal
particlesand the gasdiffusion layer or current collector. Carbon
blacks, such as Vulcan XC-72, are widely used as catalyst sup-
port due to the high electrical conductivity and the surface
structure and composition [10e12]. Recently, evidence has
demonstrated that the nature of the support and the inter-
action between support and metal particles affects the mor-
phology, dispersion and stability of the later [13,14] influencing
the catalytic activity [9,11,15e20]. Figueiredo et al. [13] observed
that thedensity of oxygen-containing surface groupson carbon
supports increased thecatalytic activity. Raoet al. [18] analyzed
the effect of carbon porosity on the specific activity of the PtRu/
C catalyst for methanol oxidation. They found that carbon
supports with pores smaller than 20 nm showed poor contact
between the metal nanoparticles and Nafion ionomer due to
the lack of the ionomer penetration, resulting in a lower
methanol oxidation activity.
Over the past few years, mesoporous carbon (MC) with
tailored structurehasbeenusedas support for fuel cell catalyst
exhibiting promising activities both in half cell or single cell
configuration [15,21e28]. Joo et al. [21] prepared Pt nano-
particles supported on different ordered mesoporous carbons
for fuel cell cathodes and they observed the best catalytic ac-
tivity for those with small pore size (5 nm). Liu et al. [24] found
better electrochemical activity for methanol oxidation, in half
cell configuration, by supporting PtRuondifferentmesoporous
carbon as compared to commercial catalyst. Similarly, Arbiz-
zani et al. [15] showed a better performance in a fuel cell
configuration of PtRu supported on a mesoporous carbon,
obtained by a cryogel method, as compared to the catalyst
supported on Vulcan. Controlling the structural parameters,
such as surface area, pore size and particle morphology, pro-
vides extra fine tuning of the catalyst electroactivity
[8,10,11,29].Moreover, porouscarbonshave shown toallow the
preparation of highly dispersed catalytic nanoparticles,
exhibiting good diffusion properties for reactants and by-
products [8,30e32]. In contrast, carbon powders like Vulcan
XC-72with amuch simple particle structure and lower surface
area might not provide the best substrate for metal particles.
Recently we reported the electrochemical characterization
of PtRu nanoparticles deposited on mesoporous carbon (PtRu/
MC) [33,34]. The electrochemical measurements showed that
the PtRu/MC presented a 25% increase of the methanol oxi-
dation current compared to the PtRu supported on carbon
Vulcan. In cyclic voltammetry experiments a lower onset po-
tential for the oxidation of methanol was observed for PtRu/
MC, and a lower poisoning rate was also confirmed from the
chronoamperometry analysis. Differential electrochemical
mass spectroscopy (DEMS) showed a methanol to CO2 current
efficiency conversion for PtRu/MC 8% higher as compared to
the Vulcan supported catalyst (PtRu/C).
Electrochemical impedance spectroscopy (EIS) has been
demonstrated to be a powerful technique for the analysis of
the several physicochemical processes taking place inside
a PEMFC [35e38]. The EIS analysis of PEMFC, presented com-
monly as a Nyquist plot (real impedance vs. imaginary
impedance), could exhibit up to three arcs depending on the
measurements conditions [35,39e41]. The system is usually
modeled through an equivalent circuit composed by a combi-
nation of electrical elements, allowing the description of the
different processes taking place inside the fuel cell [42,43].
In the present work we describe the fuel cell character-
ization of the aforementioned PtRu catalyst, prepared by the
impregnation-reduction method, supported on a high surface
area mesoporous carbon [33]. Fuel cell measurements were
performed on a single MEA cell having 5 cm2 active area with
1 M methanol used as anode fuel and dry O2 on the cathode.
Electrochemical impedance spectroscopy was performed on
working fuel cell at different cell voltages focusing on the
mass transport properties of the mesoporous carbon sup-
ported catalyst. The EIS response was fitted with an equiv-
alent circuit with the aim to assess the characteristics of the
methanol diffusion in the fuel cell.
2. Experimental
2.1. Mesoporous carbon and catalyst supportedpreparation
Mesoporous carbon support was obtained using the method
previouslydescribed[44,45].Briefly,aprecursorwaspreparedby
polymerization of resorcinol (Fluka) and formaldehyde (Cicar-
elli, 37wt%). SodiumAcetate (Cicarelli) wasused as catalyst and
a cationic polyelectrolyte (polydilayl- dimethylammonium
chloride, PDADMAC, SigmaeAldrich) was used as a structuring
agent. The carbonized material at 1000 �C was grinded and
passed through a mesh with a pore size of 40 mm. The meso-
porous carbon had a surface area of 580 m2 g�1 as obtained by
BET, and the pore size distribution shows a peak at 20 nm.
The preparation and characterization of PtRu nano-
particles on MC and Vulcan was described elsewhere [33].
Briefly, adequate amounts of solutions of themetal precursors
H2PtCl6$6H2O (Tetrahedron) and RuCl3$3XH2O (Aldrich) were
added to a slurry of the carbon support while stirring. The pH
i n t e rn a t i o n a l j o u r n a l o f h y d r o g e n en e r g y 3 8 ( 2 0 1 3 ) 4 1 1 6e4 1 2 34118
was adjusted to 8 with 1 M NaOH (Pro Analysis, Merck)
aqueous solution and heated to 80 �C NaBH4 (granular 98%,
SigmaeAldrich) was added in a molar ratio of 3:1 (NaBH4 to
metal salt) to the suspensionwhile heating for 2 h, followed by
stirring for 12 h at room temperature. The liquid was centri-
fuged and the solid was separated, washed and dried on
a vacuum oven at 60 �C overnight. The obtained PtRu/MC had
a 62%metal loadingwith 4.0 nmmean particle diameter while
for PtRu/C the values were 58% and 5.0 nm, respectively, as
obtained by thermogravimetric analysis (TG), X-ray dif-
fraction (XRD), energy dispersive X-ray spectroscopy (EDS)
and transmission electron microscopy (TEM) [33].
2.2. MEA preparation and fuel cell testing
PtRu/MC and PtRu/C were used as anode catalyst while Pt/C
60% (Fuel Cell Store) was used as cathode catalyst. The catalyst
suspension was prepared by mixing the catalyst with milli-Q
water and Nafion ionomer solution (5%, Ion Power) in a 1:3:1
proportionbyweight, andspreadonone side of a 5 cm2TorayC
paper TGPeH 60 10% PTFE coated (Fuel Cell Technologies), for
a final electrode loading ca. 3mg cm�2. ANafion212membrane
(Ion Power) was placed in between the electrodes and hot
pressed at 150 �C and 40 bar for 25min. The Nafionmembrane
was previously treated by boiling in H2O2 3% (H2O2 30%, Bio-
pack) followed by H2SO4 3% (95e97%, Merck). The MEAs were
mounted in a standard single cell housing with pin-type flow
fields (Fuel Cell Technologies, Inc.). Proper Teflon gasket films
(50e150 um) were inserted and the cell uniformly bolted with
a torque of 2.3 Nm. After assembly of the cell, theMEAwas re-
humidify by circulating water overnight at 80 �C. Galvanody-namic polarization test was performed at two different tem-
peratures (30 �C and 60 �C) from the open circuit voltage (OCV)
to a voltage close of short circuit (0.05 V) while circulating 1 M
methanol (Merk,HPLCgrade) through theanodeanddryO2 (RG
4.8, Indura) through the cathode. A Gilson Minipuls 3 peri-
staltic pump was used to circulate the methanol solution and
a digital mass flow meter MC 200 from Alicat Scientific to
control the O2 flows. For all the measurements the methanol
flow was set to 2.0 ml min�1 while the O2 flow was 200 sccm
leading a methanol to O2 stoichiometry ratio of 1:4.
Electrochemical impedance spectroscopy measurements
were performed on the FC in the working mode. The working
(WE) and sensing electrode (SE) leads were connected to the
fuel cell anode and those corresponding to the counter (CE)
a reference electrode (RE) to the cathode [40]. The measure-
ments were performed at three different voltages (0.20 V,
0.15 V and 0.10 V) chosen so that the cell operates in the high
current density zone, at 60 �C. Frequencies were swept from
100 kHz to 100 mHz with 10 mV amplitude.
All measurements were performed with an Autolab
PGSTAT302N potentiostat equipped with a 20 A booster.
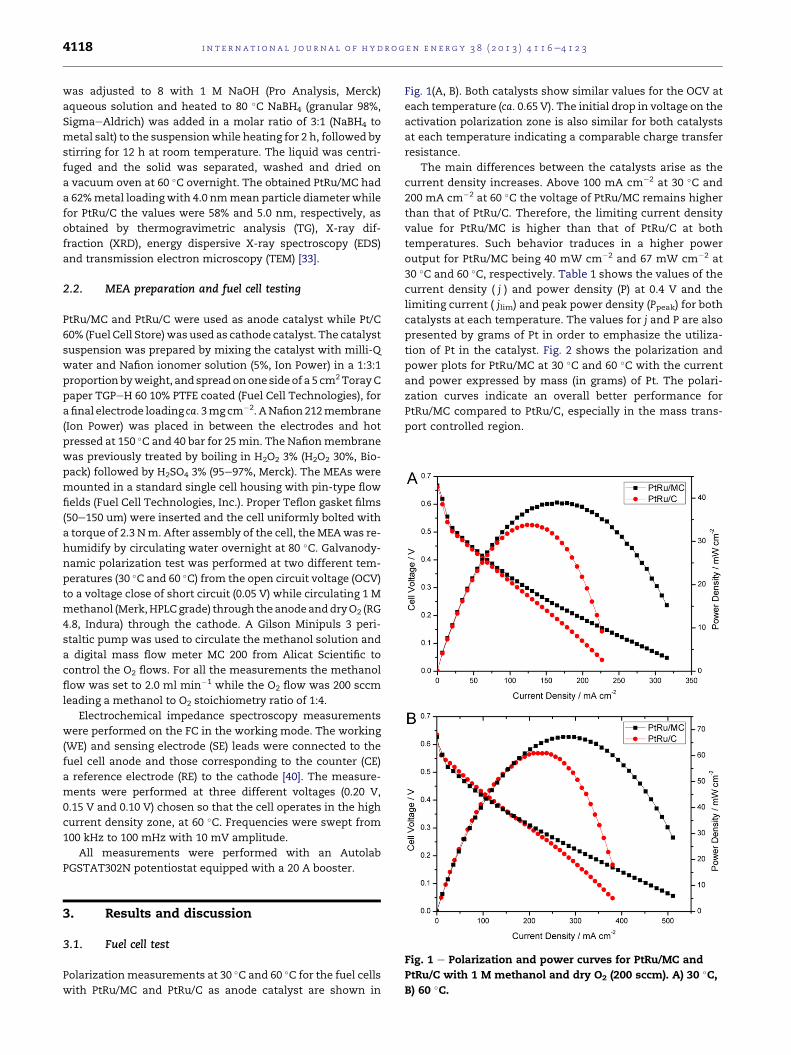
Fig. 1 e Polarization and power curves for PtRu/MC and
PtRu/C with 1 M methanol and dry O2 (200 sccm). A) 30 �C,B) 60 �C.
3. Results and discussion
3.1. Fuel cell test
Polarizationmeasurements at 30 �C and 60 �C for the fuel cells
with PtRu/MC and PtRu/C as anode catalyst are shown in
Fig. 1(A, B). Both catalysts show similar values for the OCV at
each temperature (ca. 0.65 V). The initial drop in voltage on the
activation polarization zone is also similar for both catalysts
at each temperature indicating a comparable charge transfer
resistance.
The main differences between the catalysts arise as the
current density increases. Above 100 mA cm�2 at 30 �C and
200 mA cm�2 at 60 �C the voltage of PtRu/MC remains higher
than that of PtRu/C. Therefore, the limiting current density
value for PtRu/MC is higher than that of PtRu/C at both
temperatures. Such behavior traduces in a higher power
output for PtRu/MC being 40 mW cm�2 and 67 mW cm�2 at
30 �C and 60 �C, respectively. Table 1 shows the values of the
current density ( j ) and power density (P) at 0.4 V and the
limiting current ( jlim) and peak power density (Ppeak) for both
catalysts at each temperature. The values for j and P are also
presented by grams of Pt in order to emphasize the utiliza-
tion of Pt in the catalyst. Fig. 2 shows the polarization and
power plots for PtRu/MC at 30 �C and 60 �C with the current
and power expressed by mass (in grams) of Pt. The polari-
zation curves indicate an overall better performance for
PtRu/MC compared to PtRu/C, especially in the mass trans-
port controlled region.

Fig. 3 e Theoretical form of the fuel cell polarization plot.
Zone 1: Activation polarization. Zone 2: Ohmic
polarization. Zone 3: Mass transport polarization. Inset:
Derivative of the voltage vs. the current.
Table 1e Current density and power density per area andper gram of Pt at 0.4 V, and at the characteristic limitingcurrent ( jlim) and peak power (Ppeak).
PtRu/C PtRu/MC
30 �C 60 �C 30 �C 60 �C
j (mA cm�2) 62 117 65 111
j (A gPt�1) 41 60 46 74
P (mW cm�2) 25 47 26 44
P (W gPt�1) 16 24 18 30
jlim (mA cm�2) 230 380 320 510
jlim (A gPt�1) 150 190 210 340
Ppeak (mW cm�2) 34 61 39 67
Ppeak (W gPt�1) 17 31 26 45
i n t e r n a t i o n a l j o u r n a l o f h y d r o g e n en e r g y 3 8 ( 2 0 1 3 ) 4 1 1 6e4 1 2 3 4119
3.2. Fuel cells EIS measurements
A typical FC polarization curve presents three well defined
zones [46]. Fig. 3 shows the shape of the polarization curve
obtained from a semi-empirical equation describing the well
known zones, activation polarization (zone 1), ohmic polari-
zation (zone 2) and mass transport polarization (zone 3) [47].
The polarization plots (Fig. 1A and B) obtained for both
catalysts exhibit the shape of the theoretical curve shown in
Fig. 3, with differences at high current density, where the
system is under mass transport control. While PtRu/C shows
the characteristic decrease in voltage, the PtRu/MC maintains
the j vs. V slope of the ohmic polarization zone, indicating
better methanol diffusion at both temperatures. In order to
show more clearly this behavior, the derivative of the polari-
zation for both fuel cells at 60 �C are presented in Fig. 4, which
can be compared to the derivative of the theoretical polari-
zation plot, presented in Fig. 3 inset. Both catalysts exhibit, in
the zone 1 and 2, a response similar to the theoretical graph.
However, for j above 200 mA cm�2, the observed voltage de-
rivative decline for PtRu/C, probably because of a deficient
methanol mass transport as compared to the PtRu/MC, which
maintains the slope value.
Fig. 2 e Polarization and power curves for PtRu/MC with
1 M methanol and dry O2 (200 sccm) at 30 �C and 60 �C with
the current and power expressed by gram of Pt.
We proposed in a previous work that the mesoporous
carbon is a better support for the PtRu catalyst because it
enhances the mass transport processes as was observed by
the electrochemical analysis [33]. In order to further analyze
the behavior observed in the polarization curves, EIS experi-
ments were conducted in the working fuel cell at voltages
corresponding to high current densities. Fig. 5(A, B) shows the
Nyquist plots for both catalyst at three different voltages,
corresponding to the mass transport zone. The lines repre-
senting the fits were obtained with the equivalent circuit
shown in Fig. 6. This circuit was used by Wagner and co-
workers to explain the CO anode poisoning effect in PEMFC
[48,49]. That circuit provided the best fit of the impedance
spectra in comparison to other circuits used for DMFC [36,39],
as can be observed by the good correlation between the data
and the fitted curves, and supported by the low value obtained
Fig. 4 e Derivative of the polarization plot for PtRu/MC and
PtRu/C at 60 �C.

Fig. 5 e Nyquist plot at three different voltages for the fuel
cell at 60 �C. A) PtRu/MC, B) PtRu/C. The lines correspond to
the fit by the equivalent circuit.
i n t e rn a t i o n a l j o u r n a l o f h y d r o g e n en e r g y 3 8 ( 2 0 1 3 ) 4 1 1 6e4 1 2 34120
for the statistical dispersion. A possible explanation for the
optimal fit obtained with the mentioned circuit might be due
to the high amount of CO formed at high current densities,
which presents a significant poisoning effect. The equivalent
Fig. 6 e Equivalent circuit used to
circuit shows the common elements found for a fuel cell [37],
namely, the cell resistance (Rc), the charge transfer resistance
for the anode (RAct) and the cathode (RCct) and the anode
double layer capacitance (CAdl). In series with the cell resist-
ance a parasitic wiring inductance (Lw) related to the mutual
induction effect of the cell and the connectionwires is present
[37,50]. The inductance fits the observed positive Zim at very
high current density in both graphs. In the anode side, the
circuit presents a relaxation resistance (Rk) in series with
a relaxation inductance (Lk), which constitutes a surface
relaxation impedance [48,49] describing relaxation processes
at the electrode interface and used to fit the pseudo-inductive
behavior observed at low frequencies. Such impedance may
be originated from the catalyst CO poisoning due to methanol
incomplete oxidation in DMFC [39,51], vide infra. In series with
the anode charge transfer resistance there is a Warburg
impedance (W) describing the mass transport processes. In
the cathode side of the circuit, RCct is in parallel with a con-
stant phase element (CPE) that fits the double layer capaci-
tance of the cathode better than the simple capacitor model
[37,39].
Table 2 shows the results for the different elements com-
posing the equivalent circuit obtained by fitting the EIS data.
The cell resistance values are quite similar for both cells. This
indicates the reproducibility of the MEAs preparation method
in terms of the ink formulation and hot-pressing conditions.
Moreover, Lw has similar values for both cells, consistent with
the fact that the same system, including the cell, was used in
all measurements. RAct and RCct also show similar values for
each catalyst, as expected from the similar initial drop in the
polarization curves. CAdl for PtRu/MC is almost twice to the
one observed for PtRu/C, a result also expected since the MC
surface area is more than double than that of carbon Vulcan.
The values of Rk and Lk reported in Table 2 for the PtRu/C
indicate a higher value for the relaxation time constant sk (Lk/
Rk) [48,49], as observed by the inductive loop at the low fre-
quency end of the Nyquist plot (Fig. 5B). As mentioned above,
the use of Rk and Lk was carried out byWagner and co-workers
to explain the CO poisoning effects in PEMFC anodes. These
authors concluded that a higher value of the relaxation time
constant indicated a higher CO poisoning [48,49]. In the pre-
sent work the use of the Rk and Lk was necessary to fit the
pseudo-inductive behavior observed at low frequencies.
A plausible explanation in a DMFC could be the presence of CO
fit the DMFC Nyquist plots.

Table 2 e Values for the equivalent circuit elements obtained by fitting the Nyquist plots at 60 �C.
Voltage V Rk
U cm2Lk
H cm�2RAct
U cm2Y0 W
S s0.5 cm�2CAdl
F cm�2Rc
U cm2Lw
H cm�2RCct
U cm2Y0 CPE
S sn cm�2nCPE
0.20 PtRu/MC 1.74 4.16E-08 0.433 96.2 0.089 0.654 1.93E-08 1.23 7.4 0.552
PtRu/C 0.50 4.36E-08 0.272 31.0 0.059 0.54 2.82E-08 0.83 21.65 0.528
0.15 PtRu/MC 1.38 4.00E-08 0.416 110.0 0.092 0.654 1.93E-08 1.17 7.2 0.558
PtRu/C 0.38 4.60E-08 0.287 31.6 0.075 0.54 2.82E-08 0.74 20.1 0.541
0.10 PtRu/MC 1.32 3.83E-08 0.416 114.0 0.090 0.654 1.93E-08 1.05 7.1 0.555
PtRu/C 0.16 5.06E-08 0.265 30.4 0.051 0.54 2.82E-08 0.64 16.95 0.559
i n t e r n a t i o n a l j o u r n a l o f h y d r o g e n en e r g y 3 8 ( 2 0 1 3 ) 4 1 1 6e4 1 2 3 4121
due to incomplete methanol oxidation. As it is well known,
PtRu is the best catalyst for methanol oxidation due to the so
called bifunctional mechanism, where Pt oxidizes methanol
to CO, and OH groups adsorbed on a neighboring Ru site oxi-
dizes the CO to CO2 [52]. However, not all nanoparticles pos-
sess the same PtRu atomic ratio, therefore could be Pt sites
without a neighboring Ru sites resulting in the catalyst partial
poisoning by CO [52]. Such behavior will be more noticeable at
high current densities where the oxidation rate is higher. As
was shown previously by DEMS analysis [33], the PtRu/MC
catalyst has a higher rate of methanol oxidation to CO2 than
PtRu/C and therefore lower poisoning rate which results in
a lower sk as compared to PtRu/C.
The depression of the semicircle at the high frequency end
in the Nyquist plot was attributed by several authors as
a coupling of interfacial and diffusional impedance [35,36,39],
and also to the roughness of highly dispersed electrodes sur-
faces [53]. The use of the Warburg element in the circuit of
Fig. 6 was essential to fit the semicircle depression, which is
more noticeable in the case of PtRu/C (Fig. 5B). Table 2 shows
the Warburg coefficient (Y0 W) [43] values for both catalyst at
the different voltages. This coefficient is three to four times
higher for PtRu/MC than for PtRu/C, indicating that the
impedance is higher for the later at each individual frequency,
as can be deduced from eq. (1).
W ¼ 1
Y0 W
ffiffiffiffiffiju
p (1)
As it was mentioned in Section 2.2, the stoichiometry
conditions of the measurements were set in order that the
cathode reaction would not provide a limiting factor.
Therefore, the variation in mass transport behavior be-
tween the two cells can be assigned to the carbon support.
The difference in the Y0 W values for both catalysts is an
indication of faster methanol diffusion in PtRu/MC com-
pared to PtRu/C. On the other hand, the mass transport
phenomena also affects the low frequency semicircle [36].
For PtRu/MC the impedance in the Nyquist plot at low fre-
quency is higher than for PtRu/C. A plausible explanation is
that the cathode impedance plays a predominant role in the
MC supported catalyst, since a higher amount of methanol
is being oxidized at the measured potentials (Fig. 1). Nev-
ertheless, the semicircle depression is highly noticeable in
the PtRu/C and the value of Y0 W obtained for PtRu/MC is
indicative of a less hindered mass transport, agreeing with
the behavior presented in the polarization curve, and also
with the electrochemical measurements previously repor-
ted [33].
4. Conclusions
The characterization of a PtRu catalyst supported on a meso-
porous carbon in a fuel cell and the comparisonwith the same
catalyst supported on carbon Vulcan was performed. Polari-
zation and power curves indicate a better performance of the
mesoporous supported catalyst at 30 �C and 60 �C as compared
to the one supported on Vulcan, yielding a peak power of
67 mW cm�2 or 45 W grPt�1 at 60 �C. Moreover, it was observed
that the methanol mass transport at high current densities,
where themass transport dominates the polarization curve, is
less restricted in the cell with PtRu/MC than in the PtRu/C cell.
Such behavior was further analyzed by EISwhere theWarburg
coefficients indicated a better mass transport in the meso-
porous carbon as compared to Vulcan. These results, together
with the ones showed in our previous report, indicate that the
MC due to its morphology is a better support for PtRu than
Vulcan in terms of catalyst performance and mass transport
as shown by the polarization plots and EIS results.
The low frequency semicircle for PtRu/MC in the Nyquist
plot showed a behavior that will be the subject of a future
study.
Acknowledgments
The authors thank financial support fromAgencia Nacional de
Promocion Cientıfica y Tecnologica (ANPCyT) (PICT 0008-2009
PRH 200-4, PICT 2097), CONICET (PIP 00095) and UNSAM SJ10/
04. MMB, FAV and HRC are permanent research fellows of
CONICET.
r e f e r e n c e s
[1] Edlund D. Methanol fuel cell systems: advancing towardscommercialization. 1st ed. Pan Stanford Publishing; 2011.
[2] Jansen MMP, Moolhuysen J. Binary systems of platinum anda second metal as oxidation catalysts for methanol fuel cells.Electrochim Acta 1976;21(1):869e78.
[3] Surampudi S, Narayanan SR, Vamos E, Frank H, Halpert G,Laconti A, et al. Advances in direct oxidation methanol fuel-cells. J Power Sources 1994;47(3):377e85.
[4] Watanabe M, Uchida M, Motoo S. Preparation of highlydispersed Pt þ Ru alloy clusters and the activity for theelectrooxidation of methanol. J Electroanal Chem 1987;229(1e2):395e406.
[5] Carrette L, Friedrich KA, Stimming U. Fuel cells: principles,types, fuels, andapplications.ChemPhysChem2000;1:162e93.

i n t e rn a t i o n a l j o u r n a l o f h y d r o g e n en e r g y 3 8 ( 2 0 1 3 ) 4 1 1 6e4 1 2 34122
[6] Arico AS, Baglio V, Antonucci V. Direct methanol fuel cells.Energy science, engineering and technology series. NewYork: Nova Science Publishers, Inc; 2010.
[7] Lizcano Valbuena WH, de Azevedo DC, Gonzalez ER.Supported metal nanoparticles as electrocatalysts for low-temperature fuel cells. Electrochim Acta 2004;49(8):1289e95.
[8] Liu H, Song C, Zhang L, Zhang J, Wang H, Wilkinson D.A review of anode catalysis in the direct methanol fuel cell.J Power Sources 2006;155:95e110.
[9] Cui Z, Liu C, Liao J, Xing W. Highly active PtRu catalystssupported on carbon nanotubes prepared by modifiedimpregnation method for methanol electro-oxidation.Electrochim Acta 2008;53(27):7807e11.
[10] Auer E, Freund A, Pietsch J, Tacke T. Carbons as supports forindustrial precious metal catalysts. Appl Catal A 1998;173:259e71.
[11] Pantea D, Darmstadt H, Kaliaguine S, Roy C. Electricalconductivity of conductive carbon blacks: influence ofsurface chemistry and topology. Appl Surf Sci 2003;271:181e93.
[12] Pantea D, Darmstadt H, Kaliaguine S, Summchen L, Roy C.Electrical conductivity of thermal carbon blacks: influence ofsurface chemistry. Carbon 2001;39:1147e58.
[13] Figueiredo J, Pereira M, Serp P, Kalck P, Samant P,Fernandes J. Development of carbon nanotube and carbonxerogel supported catalysts for the electro-oxidation ofmethanol in fuel cells. Carbon 2006;44(12):2516e22.
[14] Zhou WJ, Li WZ, Song SQ, Zhou ZH, Jiang LH, Sun GQ, et al.Bi- and tri-metallic Pt-based anode catalysts for directethanol fuel cells. J Power Sources 2004;131(1e2):217e23.
[15] Arbizzani C, Beninati S, Soavi F, Varzi A, Mastragostino M.Supported PtRu on mesoporous carbons for direct methanolfuel cells. J Power Sources 2008;185(2):615e20.
[16] Gomez de la Fuente JL, Martinez Huerta MV, Rojas S,Terreros P, Fierro JLG, Pena MA. Methanol electrooxidationon PtRu nanoparticles supported on functionalised carbonblack. Catal Today 2006;116:422e32.
[17] Kim H, You D, Yoon H, Joo S, Pak C, Chang H, et al. Cathodecatalyst layer using supported Pt catalyst on orderedmesoporous carbon for direct methanol fuel cell. J PowerSources 2008;180(2):724e32.
[18] Rao V, Simonov P, Savinova E, Plaksin G, Cherepanova S,Kryukova G, et al. The influence of carbon support porosityon the activity of PtRu/Sibunit anode catalysts for methanoloxidation. J Power Sources 2005;145:178e87.
[19] Uchida M, Fukuoka Y, Sugawara Y, Eda N, Ohta A. Effects ofmicrostructure of carbon support in the catalyst layer on theperformance of polymer-electrolyte fuel cells. J ElectrochemSoc 1996;143(7):2245e52.
[20] Uchida M, Fukuoka Y, Sugawara Y, Ohara H, Ohta A.Improved preparation process of very-low-platinum-loadingelectrodes for polymer electrolyte fuel cells. J ElectrochemSoc 1998;145(11):3708e13.
[21] Joo SH, Lee HI, You DJ, Kwon K, Kim JH, Choi YS, et al.Ordered mesoporous carbons with controlled particle sizesas catalyst supports for direct methanol fuel cell cathodes.Carbon 2008;46:2034e45.
[22] Joo SH, Pak C, You DJ, Lee S-A, Lee HI, Kim JM, et al. Orderedmesoporous carbons (OMC) as supports of electrocatalystsfor direct methanol fuel cells (DMFC): effect of carbonprecursors of OMC on DMFC performances. Electrochim Acta2006;52:1618e26.
[23] Lei Z, Bai S, Xiao Y, Dang L, An L, Zhang G, et al. CMK-5mesoporous carbon synthesized via chemical vapordeposition of ferrocene as catalyst support for methanoloxidation. J Phys Chem C 2008;112:722e31.
[24] Liu SH, Yu WY, Chen CH, Lo AY, Hwang BJ, Chien SH, et al.Fabrication and characterization of well-dispersed and
highly stable PtRu nanoparticles on carbon mesoporousmaterial for applications in direct methanol fuel cell. ChemMater 2008;20:1622e8.
[25] Zhou JH, He JP, Ji YJ, Dang WJ, Liu XL, Zhao GW, et al. CTABassisted microwave synthesis of ordered mesoporous carbonsupported Pt nanoparticles for hydrogen electro-oxidation.Electrochem Solid State Lett 2007;10:B191e5.
[26] Ding J, Chana KY, Rena J, Xiao FS. Platinum andplatinumeruthenium nanoparticles supported on orderedmesoporous carbon and their electrocatalytic performancefor fuel cell reactions. Electrochim Acta 2005;50:3131e41.
[27] Ambrosio EP, Dumitrescu MA, Francia C, Gerbaldi C,Spinelli P. Ordered mesoporous carbons as catalyst supportfor PEM fuel cells. Fuel Cells 2009;9(3):197e200.
[28] Wikander K, Ekstrom H, Palmqvist AEC, Lundblad A,Holmberg K, Lindbergh G. Alternative catalysts and carbonsupport material for PEMFC. Fuel Cells 2006;6(1):21e5.
[29] Bruno MM, Cotella NG, Miras MC, Koch T, Seidler S,Barbero C. Characterization of monolithic porous carbonprepared from resorcinol/formaldehyde gels with cationicsurfactant. Colloids Surf A 2010;358:13e20.
[30] Sahu AK, Sridhar P, Pitchumani S. Mesoporous carbon forpolymer electrolyte fuel cell electrodes. J Indian Inst Sci 2009;89:437e45.
[31] Bruno MM, Franceschini EA, Planes GA, Corti HR.Electrodeposited platinum catalysts over hierarchical carbonmonolithic support. J Appl Electrochem 2010;40(2):257e63.
[32] Bruno MM, Corti HR, Balach J, Cotella GN, Barbero CA.Hierarchical porous materials: capillaries in nanoporouscarbon. Funct Mat Lett 2009;2:135e8.
[33] Viva FA, Bruno MM, Jobbagy M, Corti HR. Electrochemicalcharacterization of PtRu nanoparticles supported onmesoporous carbon for methanol electrooxidation. J PhysChem C 2012;116:4097e104.
[34] Viva FA, Bruno MM, Corti HR. Mesoporous carbon as supportfor PtRu catalyst. Electrochemical and fuel cellcharacterization. ECS Trans 2011;41:1121e30.
[35] Mueller JT, Urban PM. Characterization of direct methanolfuel cells by ac impedance spectroscopy. J Power Sources1998;75:139e43.
[36] Mueller JT, Urban PM, Holderich WF. Impedance studies ondirect methanol fuel cell anodes. J Power Sources1999:157e60.
[37] Wagner N. Fuel cells. In: Barsoukov E, Macdonald JR, editors.Impedance spectroscopy: theory, experiment, andapplications. New Jersey: Wiley; 2005. p. 497e530.
[38] Yuan X, Wang H, Colinsun J, Zhang J. AC impedancetechnique in PEM fuel cell diagnosisda review. Int JHydrogen Energ 2007;32(17):4365e80.
[39] Hsu NY, Yen SC, Jeng KT, Chien CC. Impedance studies andmodeling of direct methanol fuel cell anode with interfaceand porous structure perspectives. J Power Sources 2006;161(1):232e9.
[40] Yang SH, Chen CY, Wang WJ. An impedance study of anoperating direct methanol fuel cell. J Power Sources 2010;195(8):2319e30.
[41] Xue X, Bock C, Birry L, MacDougall BR. The influence of Ptloading, support and Nafion content on the performance ofdirect methanol fuel cells: examined on the example of thecathode. Fuel Cells 2011;11(2):286e300.
[42] Macdonald JR, Johnson WB. Fundamentals of impedancespectroscopy. In: Barsoukov E, Macdonald JR, editors.Impedance spectroscopy: theory, experiment, andapplications. New Jersey: Wiley; 2005. p. 1e20.
[43] Orazem ME, Tribollet B. Electrochemical impedancespectroscopy. New Jersey: John Wiley & Sons; 2008.
[44] Bruno MM, Cotella Nelson G, Miras MC, Barbero C. A novelway to maintain resorcinoleformaldehyde porosity during

i n t e r n a t i o n a l j o u r n a l o f h y d r o g e n en e r g y 3 8 ( 2 0 1 3 ) 4 1 1 6e4 1 2 3 4123
drying: stabilization of the solegel nanostructure usinga cationic polyelectrolyte. Colloids Surf A 2010;362:28e32.
[45] Ramos-Sanchez G, Bruno MM, Thomas YRJ, Corti HR,Solorza-Feria O. Mesoporous carbon supportednanoparticulated PdNi2: a methanol tolerant oxygenreduction electrocatalyst. Int J Hydrogen Energ 2012;37(1):31e40.
[46] Barbir F. PEM fuel cells: theory and practice. 1st ed. AcademicPress; 2005.
[47] Yuan XZ, Wang H. In: Zhang J, editor. PEM fuel cellelectrocatalysts and catalyst layers. London: Springer; 2008.p. 1e79.
[48] Wagner N, Gulzow E. Change of electrochemical impedancespectra (EIS) with time during CO-poisoning of the Pt-anodein a membrane fuel cell. J Power Sources 2004;127(1e2):341e7.
[49] Wagner N, Schulze M. Change of electrochemical impedancespectra during CO poisoning of the Pt and Pt/Ru anodes ina membrane fuel cell (PEFC). Electrochim Acta 2003;48(25e26):3899e907.
[50] Danzer MA, Hofer EP. Analysis of the electrochemicalbehaviour of polymer electrolyte fuel cells using simpleimpedance models. J Power Sources 2009;190(1):25e33.
[51] Schulz T, Weinmuller C, Nabavi M, Poulikakos D.Electrochemical impedance spectroscopy analysis of a thinpolymer film-based micro-direct methanol fuel cell. J PowerSources 2010;195(22):7548e58.
[52] Markovic NM, Ross PN. Surface science studies of model fuelcell electrocatalysts. Surf Sci Rep 2002;45(4e6):121e229.
[53] Maritan A, Toigo F. On skewed ARC plots of impedance ofelectrodes with an irreversible electrode process.Electrochim Acta 1990;35(1):141e5.