Embed Size (px)
Citation preview

The MessengerNo. 123 – March 2006
First Light of the VLT Laser Guide Star Facility. See article on page 16. P
ho
to: G
. Hü
dep
oh
l, E
SO

�The Messenger 123 – March 2006
Spain to Join ESO
On 1� February, at a ceremony in Madrid, an agreement was signed by the Spanish Minister of Education and Science, Mrs. María Jesús San Segundo, and the ESO Director General, Dr. Catherine Cesarsky, affirming their commitment to securing Spanish membership of ESO.
Following approval by the Spanish Coun-cil of Ministers and the ratification by the Spanish Parliament of the ESO Con-vention and the associated protocols, Spain will become ESO’s twelfth member state on 1 July 2006.
“Since long Spain was aware that en- tering ESO was a logical decision and it was even necessary for a country like Spain because Spain is ranked eighth in astrophysical research”, said Mrs. María Jesús San Segundo. “The large scienti- fic installations are not only necessary for research in different fields but are also partners and customers for high-tech companies, helping to increase the fund-ing of R&D.”
“Spanish Astronomy has made tremen-dous strides forward and we are delight-ed to welcome Spain as a new member of ESO. We very much look forward to working together with our excellent Span- ish colleagues”, said Dr. Cesarsky. “For ESO, the Spanish accession means that we can draw on the scientific and tech-nological competences, some of them unique in Europe, that have been devel-oped in Spain and, of course, for Europe the Spanish membership of ESO is an important milestone in the construction of the European Research Area.”
Indeed, Spain is an important member of the European astronomical com- munity and has developed impressively over the last three decades, reaching maturity with major contributions in virtu-ally all areas of astronomy. In addition, Spain hosts, operates or owns a number of competitive facilities dedicated to foster astronomical research, among which is the Observatorio del Roque de los Muchachos at La Palma, certainly the premier optical/infrared astronomical observing site in Europe and site of the Spanish 10-m GranTeCan telescope now nearing completion.
With the high quality of Spanish astronom-ical research as well as the technologi- cal competence of Spanish industry, it is only fitting that Spain should join ESO. Through ESO Spain will enjoy full access to all of ESO’s current facilities and un-restricted participation in the projects that ESO is planning for the future. Spain is already an active partner of the Atacama Large Millimeter Array (ALMA), whose construction and operations are led by ESO on behalf of Europe.
ESO’s Council approved the admission of Spain at its 107th meeting held in Garching on 7 and 8 December 2005.
(Based on ESO Press Release 05/06)
The Spanish Minister of Education and Science, Mrs. María Jesús San Segundo, (left) and the ESO Director General, Dr. Catherine Cesarsky (right) signing the agreement.
� The Messenger 123 – March 2006
Telescopes and Instrumentation
Status of the European ELT
Guy Monnet, Roberto Gilmozzi (ESO)
In December 2004 the ESO Council defined as ESO’s highest priority strate-gic goal the retention of European astronomical leadership and excellence into the era of ELTs, asking that the construction of an ELT on a competitive time scale be addressed by radical strategic planning. Therefore the ESO activities towards the future European ELT underwent a major ‘phase tran- sition’ during 2005, with the completion of the exploration of the OWL concept and its comprehensive review by an international panel, followed by the start, with an extensive ESO Community involvement, of the iterative process that should lead quickly to the definition of the ELT it needs and wants.
The OWL conceptual study
Since 1998 ESO has been pursuing a conceptual study for a giant optical-infrared telescope with a primary mirror diameter D up to 100 metre, dubbed OWL for the eponymous bird keen night vision and for being OverWhelmingly Large. What started at first as a low-key evaluation of the main promises and challenges associated with such a daring endeavour picked up considerable mo-mentum over the last four years. Follow-ing the December 200� Council reso-lution, it was decided to complete rapidly the study and proceed to a thorough review by an international panel by the end of 2005.
The OWL Study has largely been an ESO internal effort, but with essential feed-back from industry and with community involvement in two critical areas. The first of these was the building over the last five years of a thorough science case for a 50–100-m ELT by a large segment of the community under the aegis of the European Commission (EC) FP5 and FP6 OPTICON programme (see its executive summary at: http://www.astro-opticon.org/ ). The second was the preliminary de-finition and analysis of a potential OWL instrument suite that could cover its sci-ence case, and which has been accom-plished over the last 12 months through
an ESO-coordinated intense community effort.
Construction of any ELT – especially if up to 100-m diameter – requires securing new enabling technologies through an ex- tensive R&D programme. Early collabo-ration with industry has led to much pro-gress in a number of crucial telescope design areas such as serial production of (spherical) mirror segments either in glass or SiC, cheap yet high performance position actuators, large deformable mirrors, etc. These developments give a strong basis to break the classical (and potentially lethal) D2.6 cost law. A much more shallow law (~ D1.�) has been estab-lished instead, owing in particular to serial production of identical mirror segments, standardised mechanical parts and actu- ators. The launch four years ago of sec-ond-generation VLT instruments has led to the development, largely by the ESO community, of a number of ELT ‘pathfind-ers’, in particular KMOS, Planet Finder, MUSE and the VLT Adaptive Optics (AO) Facility (for more information, see http://www.eso.org/instruments/ and http://www.eso.org/projects/aot/ ). A significant part of the R&D associated with this effort is being conducted through OPTICON.
The OWL review The OWL Conceptual Study was com-pleted and its results collated in early Oc- tober 2005 in the ‘Blue Book’ report (http://www.eso.org/projects/owl/Phase_ A_Review.html ). A comprehensive review was conducted by an international panel on 2–5 November 2005. Members were: Roger Davies, Oxford University (Chair); Jean-Gabriel Cuby, LAM-Marseille; Brent Ellerbroek, Thirty-Metre Telescope Project Office; Daniel Enard, formerly VIRGO; Reinhard Genzel, MPE-Garching; Jim Oschmann, Ball Aerospace; Roberto Ragazzoni, INAF-Arcetri; Larry Ramsay, Hobby-Eberly Telescope; Stephen Shect-man, Carnegie Observatories; and Larry Stepp, Thirty-Metre Telescope Project Of- fice.
The first objective of the review was to as- sess whether, or to what extent, the proposed technical solutions were rea- sonable, i.e. judge the strengths and weaknesses of the OWL approach, ana-
lyse feasibility issues, evaluate cost and schedule estimates, and identify the main risks of the project and areas to be further explored. The second was to recommend whether and how to proceed to a next phase of the project.
The panel praised the OWL team for an extensive and largely successful feasibil-ity study for a 100-m ELT. A strong tech-nical point stressed by the panel was the integrated approach chosen for the OWL active/adaptive optics system, with in particular at least one large adaptive mir-ror as an integral part of the telescope.
Substantial technical risks were however identified, associated with OWL’s double segmentation (M1 and M2), the highly aspherical M� mirror and the telescope size that makes it Laser Guide Star ‘un- friendly’. In view of these risks, but also of a consolidated cost (~ 1.2 G€) larger than the likely available ESO resources in the 2008–2020 time frame, the panel recom- mended to consider a smaller diame-ter, less complex and less risky ELT. It emphasised that most of the OWL design effort and virtually all technological devel-opments started so far were directly useful for this new phase. In addition the panel recommended to strongly involve the ESO community in all aspects of the project and to speed up the currently running ELT site selection programme, with additional attention given to start-ing government level negotiations for site access as soon as possible. The panel concluded recommending “that the pro- ject proceed to Phase B, and begin with a new examination of the balance be-tween science return, competitiveness, AO performance, instrumentation, risk and final performance within an afford-able cost.” It noted that the time to carry out such a re-evaluation was already in the plans proposed in the Blue Book.
The ELT design study
ELT-related R&D efforts are now acceler-ating, with a five-year programme started by European astronomical institutes and industries through the ESO-coordi-nated FP6 ELT design study. With a con- solidated �0.5 M€ budget (including 8.� M€ from the EC), it is aimed at estab-lishing generic technologies critically
5The Messenger 123 – March 2006
required for any ELT through the devel-opment of new concepts, advanced components, realistic simulations, bread-boards and prototypes.
Towards the European ELT
Following the review, the already planned two-year consolidation phase towards the final project has started as advocated by the review panel. As it noted, most of the building blocks developed for OWL remain valid for a smaller-size telescope and we expect to develop a basic refer-ence design for what is now the Europe-an ELT project by the end of 2006. Our basic goal is to define the best afford-able ELT that can be built on a competi-tive time scale and with acceptable risks. While the project is open to internation- al collaboration, we definitely need to get a baseline design that could be handled within Europe alone, should no other ma-jor partner be found.
The process of definition of the E-ELT has been kick-started by mixed communi- ty-ESO ELT Working Groups (a.k.a. ELT- WGs) set up by ESO’s Director General at the end of December, one for each of main ELT areas, namely (a) its Science case, (b) an Instrument suite, (c) the asso- ciated Adaptive Optics systems, (d) the Telescope and Observatory Design and (e) potential Sites evaluation. Their respec-
tive chairpersons are: Marijn Franx, Leiden (Science); Colin Cunningham, UKATC (Instrumentation); Gérard Rousset, Obser- vatoire de Paris (Adaptive Optics); Daniel Enard, formerly VIRGO (Telescope De- sign); and Roland Gredel, Calar Alto (Site). Amazingly – a clear mark of the deep interest and commitment of the commu-nity – of the more than 90 WG members (60 % external, �0 % ESO) contacted on 22 December, only two were not able to join at such short notice, due to press-ing ESO-related tasks. The brief of the five ELT-WGs called for a two-month burst of activity in January–February 2006 to pro-duce an initial input to the ESO Team in the form of ‘toolboxes’, synthesising and collating ELT-related present and pro-jected capabilities in their respective topic areas, as well as a first cut at a prioriti- sation of the requirements. This effort has just ended with all contributions received in time and with the proper content.
Present efforts by the former OWL team – soon to be expanded and restructured as the ELT project office – are primarily focussed at producing the ELT reference design, with as few remaining open op-tions as possible by the end of the year. This involves a multiple iteration process between the main ELT ingredients listed above. Continuing with a strong com- munity involvement during this critical step is essential. To that effect, the ELT Science and Engineering external Work-
ing Group (ESE) suggested by the OWL review panel, or rather a ‘core’ version of it, has been created to consolidate the reports of the five working groups into a recommendation to ESO (by May 2006). This ‘core’ ESE is composed of the ELT-WG chairs and co-chairs while the other members of the ELT-WGs will act as ad-hoc experts for ESE until at least the end of 2006. The ESE proper will be set up by STC in the spring to help and advise the ESO ELT project office in the complex iteration loops ahead, hopefully weaving successfully Science, AO, Instruments, Telescope Design and Site requirements to define the basic choices and produce a coherent and powerful ELT project for Europe by the end of the year. To en- sure an even wider interaction with the community, the project draft basic refer- ence design will be presented and dis-cussed at a topical workshop in mid-No- vember 2006 in Marseille (France), in time for a final ‘loop’ before presenting a defi-nite plan to the ESO Council in December 2006.
Acknowledgements
The OWL study has been the combined effort of many people, both inside and outside ESO, over many years and we want to thank them all. We are also very grateful to the Review Panel members for their timely and highly constructive criticisms. Fi- nally, we thank both the external and internal mem-bers of the ELT working groups for agreeing to help at remarkably short notice.
Vis
ualis
atio
n: H
. Zod
et, E
SO
6 The Messenger 123 – March 2006
Telescopes and Instrumentation
The VLT Adaptive Optics Facility Project: Telescope Systems
Robin Arsenault1
Norbert Hubin1
Stefan Stroebele1
Enrico Fedrigo1
Sylvain Oberti1
Markus Kissler-Patig1
Roland Bacon6
Richard McDermid7
Domenico Bonaccini-Calia1
Roberto Biasi�
Daniele Gallieni�
Armando Riccardi 5
Rob Donaldson1
Miska Lelouarn1
Wolfgang Hackenberg1
Ralf Conzelman1
Bernard Delabre1
Remko Stuik7
Jerome Paufique1
Markus Kasper1
Elise Vernet1
Mark Downing1
Simone Esposito 5
Michel Duchateau1
Marijn Franx7
Richard Myers 2
Steven Goodsell 2
1 ESO2 University of Durham, United Kingdom� MicroGate� ADS International5 INAF – Osservatorio Astrofisico di
Arcetri, Italy6 CRAL, Observatoire de Lyon, France7 Leiden University, the Netherlands
The Adaptive Optics Facility is a project to convert UT4 into a specialised Adap-tive Telescope. The present second- ary mirror (M2) will be replaced by a new M2-Unit hosting a 1170-actua-tor deformable mirror. The three focal stations will be equipped with instru-ments adapted to the new capability of this UT. Two instruments have been identified for the two Nasmyth foci: Hawk-I with its AO module GRAAL al-lowing a Ground Layer Adaptive Optics correction and MUSE with GALACSI for GLAO correction and Laser Tomog-raphy Adaptive Optics correction. A future instrument still needs to be de-fined for the Cassegrain focus. Several guide stars are required for the type of adaptive corrections needed and a Four Laser Guide Star Facility (4LGSF) is being developed in the scope of the AO Facility. Convex mirrors like the VLT M2 represent a major challenge for testing and a substantial effort is dedi-cated to this. ASSIST, is a test bench that will allow testing of the Deform- able Secondary Mirror and both instru-ments with simulated turbulence. This article focusses on the telescope systems (Adaptive Secondary, Four Laser Guide Star Facility, RTC platform and ASSIST Test Bench). The follow-ing article describes the AO Modules GALACSI and GRAAL.
History of the project
Pioneering efforts were made at the MMT to equip the 6-m telescope with a Deformable Secondary Mirror (DSM). The system was designed and fabricated by an Italian consortium composed of MicroGate, ADS Intl and the Osservatorio Astrofisico di Arcetri. The same consor-tium is now involved in the development of the two DSM’s for the Large Binocu- lar Telescope (Mount Graham). The tech- nology has matured substantially and it seemed appropriate to investigate whether this technology was promising for the VLT.
A feasibility study was launched in June 200� with MicroGate as the main con-tractor (including also ADS and OAA). The goal was to demonstrate the feasibil-ity of such a design for one of the VLT 8-m telescopes. The study came to a
positive conclusion in August 2005 and a corresponding data package was delivered covering all main aspects of the design.
In the course of the feasibility study, it became obvious that the scope of the project needed to be broadened in order to answer some basic questions: What are the scientific advantages of such an improvement to the UT? What are the implications on the various systems for the UT and its operation?
A conceptual design review took place in September 2005 to address these questions; it involved several ESO staffs and a few external review board mem-bers. The conclusion was positive and it was later endorsed by ESO management as a high priority project and by the STC in October. In December, ESO Council also approved the AOF which is the final approval and gave the green light for the project.
Strategy rationale
There are fundamental advantages to have one mirror of the telescope train being adaptive. The whole telescope then becomes an adaptive optical system offering fast wavefront correction with- out the addition of supplementary optics or mechanics. Moreover, with the two Nasmyth and Cassegrain foci this gain is threefold. The system gives better throughput to science instruments, lower emissivity for thermal IR instruments, large field of view accessible to all instru-ments and less complexity/crowding at the focal planes.
The alternative to a DSM is a ‘post-focal’ AO system (à la NAOS) which involves an optical train of five to six supplemen- tary warm mirrors at the image focal plane. Table 1 provides a trade-off analy-sis that justifies the choice of a DSM, although there are other drivers for this choice.
During the elaboration of the AO Facil-ity design it became clear that such a combination of several complex systems raises important questions particularly in term of AIT, commissioning and control strategy. Such questions, typical of
7The Messenger 123 – March 2006
any telescope design including several deformable mirrors (ELTs), and their cor- responding answers would benefit tre-mendously from a hands-on experience gained on a VLT “prototype”. In this per-spective the AO Facility becomes a highly relevant pathfinder for any ELT design. This argument became an important mo-tivation for ESO management to pursue the AOF concept with a DSM. The list below illustrates common issues between AO Facility and an ELT:– Develop a high-order adaptive tele-
scope at the diffraction limit– Secure and improve current large DM
with �0 mm spacing (~ M6 for OWL)– Secure manufacturing and handling of
large thin shells– Develop and monitor robust Laser and
CCD technologies– Provide large computing power for AOF
~ 1 kHz (factor 200 w/r NAOS)– Develop, operate and master Laser
Tomography AO and Ground Layer AO systems
– Elaborate and control a detailed error budget to reach the Strehl ratios re-quired
– Master interaction matrix measurement strategies (in-lab and on-sky)
– Manage multiple interlaced control loops and offloading processes
– Develop extensive DSM testing proce-dures in the laboratory
– Manage efficient commissioning of such a complex facility
Facility description
The following systems/projects are being conducted in the context of the AO Facil-ity: – A new-generation M2-Unit hosting a
1170-actuator deformable mirror– A four-Laser Guide Star Facility using
fiber lasers and four Launch Telescopes on the UT centrepiece
– SPARTA: a flexible Real Time Computer Platform to perform the AO correction of the AO modules (and others)
– GRAAL: the AO module allowing wavefront sensing and Ground Layer AO correction for Hawk-I
– GALACSI: the AO module allowing wavefront sensing and GLAO and Laser Tomography correction for MUSE
– ASSIST: a complete test facility allow- ing complete testing and characterisa-tion of the AO Facility in Europe
– A dedicated effort to address AO cal- ibration issues for the various AO mod-ules
Second-generation M2-Unit
The concept of thin shell and force actua-tors is one of the most promising in the field of large deformable mirrors; the larg-est deformable mirrors have been built / designed with this technology. A 6�2 mm diameter convex secondary mirror with ��6 actuators has been developed and is being used by the MMT (Mount Hopkins, Arizona), while the two 911 mm diame-
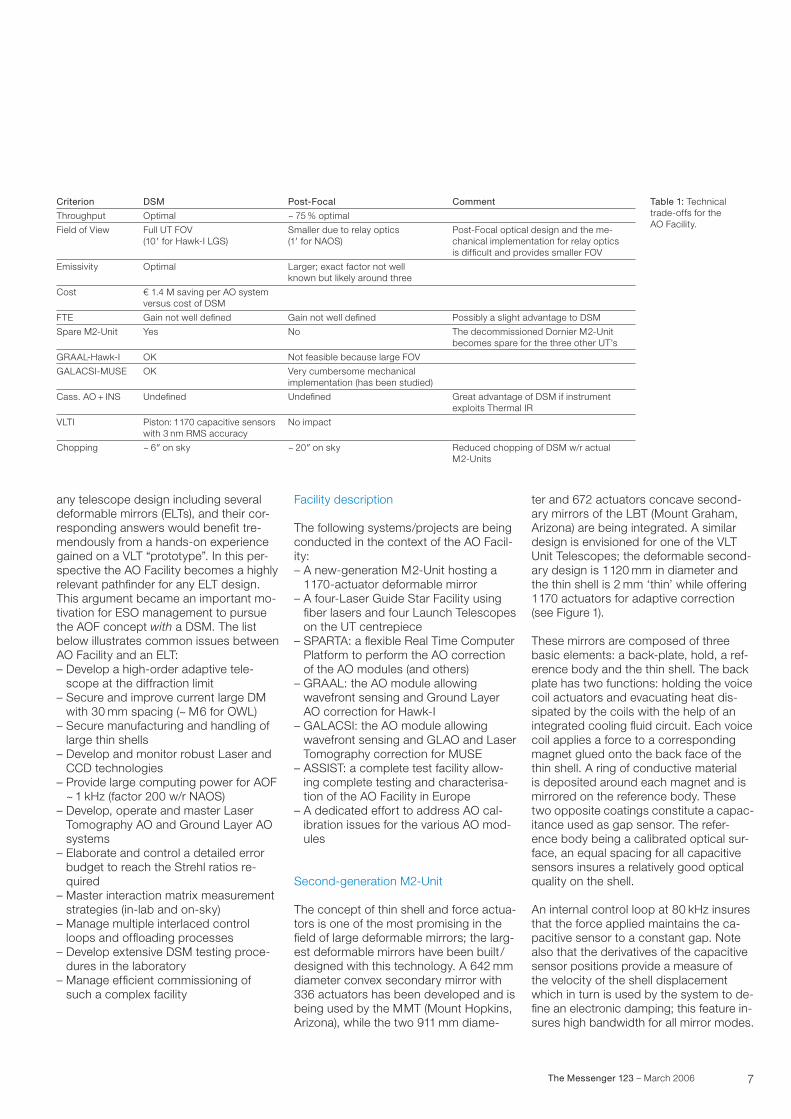
ter and 672 actuators concave second-ary mirrors of the LBT (Mount Graham, Arizona) are being integrated. A similar design is envisioned for one of the VLT Unit Telescopes; the deformable second-ary design is 1120 mm in diameter and the thin shell is 2 mm ‘thin’ while offering 1170 actuators for adaptive correction (see Figure 1).
These mirrors are composed of three basic elements: a back-plate, hold, a ref- erence body and the thin shell. The back plate has two functions: holding the voice coil actuators and evacuating heat dis-sipated by the coils with the help of an integrated cooling fluid circuit. Each voice coil applies a force to a corresponding magnet glued onto the back face of the thin shell. A ring of conductive material is deposited around each magnet and is mirrored on the reference body. These two opposite coatings constitute a capac-itance used as gap sensor. The refer- ence body being a calibrated optical sur-face, an equal spacing for all capacitive sensors insures a relatively good optical quality on the shell.
An internal control loop at 80 kHz insures that the force applied maintains the ca-pacitive sensor to a constant gap. Note also that the derivatives of the capacitive sensor positions provide a measure of the velocity of the shell displacement which in turn is used by the system to de- fine an electronic damping; this feature in-sures high bandwidth for all mirror modes.
Criterion
Throughput
Field of View
Emissivity
Cost
FTE
Spare M2-Unit
GRAAL-Hawk-I
GALACSI-MUSE
Cass. AO + INS
VLTI
Chopping
DSM
Optimal
Full UT FOV (10; for Hawk-I LGS)
Optimal
€ 1.� M saving per AO system versus cost of DSM
Gain not well defined
Yes
OK
OK
Undefined
Piston: 1170 capacitive sensors with � nm RMS accuracy
~ 6? on sky
Post-Focal
~ 75 % optimal
Smaller due to relay optics (1; for NAOS)
Larger; exact factor not well known but likely around three
Gain not well defined
No
Not feasible because large FOV
Very cumbersome mechanical implementation (has been studied)
Undefined
No impact
~ 20? on sky
Comment
Post-Focal optical design and the me-chanical implementation for relay optics is difficult and provides smaller FOV
Possibly a slight advantage to DSM
The decommissioned Dornier M2-Unitbecomes spare for the three other UT’s
Great advantage of DSM if instrumentexploits Thermal IR
Reduced chopping of DSM w/r actualM2-Units
Table 1: Technical trade-offs for the AO Facility.
8 The Messenger 123 – March 2006
Telescopes and Instrumentation Arsenault R. et al., The VLT Adaptive Optics Facility Project: Telescope Systems
to be demonstrated that the accuracy of the models (DM and WFS) can be high enough to ensure the expected perfor-mance. Regarding the experimental es- timation of the IM, novel techniques are investigated in order to deal with the new issues that we have to face: There is turbulent noise either because the cali-bration is performed on sky or because of the telescope internal turbulence. The calibration time might dramatically increase because of the larger number of degrees of freedom. Several methods are being investigated through simula-tions and laboratory tests as well as on sky tests when possible. The different schemes aim at minimising the noise and bias on the measurement in order to opti-mise the quality of the reconstructor.
Using various modal bases (zonal, Hadamard, system modes/mirror modes,
Zernike or Karhuenen-Loeve), several techniques are foreseen and being com-pared: (1) Open loop fast DM actuation, which allows freezing the disturbances between modal push and pull and thus minimise turbulent noise as well as any low-frequency effect. (2) Open-loop DM modulation and demodulation by FFT detection. The stimulus power is concen-trated on a single frequency beyond the modal atmospheric bandwidth. Low- frequency effects are cancelled out and it allows for multiplexing. This way, sev- eral modes can be measured simultane-ously, reducing the total calibration time. (�) Closed-loop calibration. Dynamic bias is applied as offset on the WFS sig-nal. The DM command is measured as a response to this bias and therefore the reconstruction matrix (or control matrix) is measured directly.
The reference body is a conventional, thick, Zerodur optical component, with the exception of the numerous cylin- drical openings allowing passage for the actuators. The VLT design explored a light-weighting scheme (50–60 % light-weighted Zerodur or SiC) to reduce the weight of the complete assembly (rea-listic without being a huge cost driver). SiC offers the added advantage of being extremely rigid compared to Zerodur. This is important since the rigidity of the reference body insures a reliable shell figure.
The thin shell provides, at rest, the same optical properties as the actual Beryllium mirrors of the VLT M2. The optical sur-face is thus convex and the optimal shell thickness has been defined as 2 mm thin. To remain within a known field of exper- tise, the shell is manufactured from a thick Zerodur blank, and is therefore a costly and delicate component. Note that other avenues are explored for thin shell manu-facturing in the context of large DM for ELTs (i.e. slumping).
Detailed simulations show that the resid-ual error with all modes corrected is 62.5 nm rms, fulfilling the specifications (see Table 2).
Calibration requirements
A fundamental limitation of AO systems based on an adaptive secondary mir-ror like the VLT M2 is that there is no intermediate focus before the deformable mirror. Therefore, it is not possible to install an artificial calibration source, seen by the DM and the Interaction Matrix (IM) measurement in a conventional way is not possible. An extensive program has been initiated at ESO to study this limita-tion and explore alternatives.
Several solutions are being envisioned for the IM measurement. First, Synthetic (simulated) IM using measured influence functions of the DSM in the laboratory and calibration of the WFS optical path, and second, several different methods of performing on-sky IM measurements.
Even if the synthetic IM is the most se-ductive solution (noiseless, simplicity, no calibration time required), it still has
Parameter
Median seeing at �0 deg: r0 (0.5 µm)
Specified fitting error
Fitting error (all modes) 1170
Zernike modes fitting error
1170 KL modes fitting error
max PtV actuator displacement
max rms actuator displacement
max peak force
max rms actuator force
rms force
Value
12.1 cm (0.85? at 500 nm)
78 nm rms
62.5 nm rms
70.0 nm rms
60.2 nm rms
1�.6 µm
1.66 µm rms
0.82 N
0.17 N rms
0.157 N rms
Table 2: Summary of the simulation results in the median seeing case. Results of fitting 10 000 uncorrelated wavefronts (this represents the ca-pability of the DSM to fit a turbulent wavefront. It does not take into ac-count the time delay of the AO control loop).
Figure 1: Conceptual design for the 1120 mm diameter, 1170 actuator VLT deformable secondary mirror. The M2-Unit contains the electronics (top), Hexapod for centring and focusing (middle) and the deformable thin shell (bottom).
Hexapod for centring and fine focusing
Cold Plate; heat evacuation and actuator attachment
Reference body
Thin shell
9The Messenger 123 – March 2006
Furthermore, there is a key issue related to calibration. A pupil offset may have a strong impact on the system perform-ance and must be addressed properly. Indeed, for high-order AO systems such as VLT with DSM, the tolerance is very tight. Dynamical pupil alignment is envi-sioned to minimise this effect. The sever- al investigated techniques appear prom-ising and have convinced the AO Facility review board of our sound approach.
Therefore, in terms of simplicity and time consumption the most attractive choice is to simulate the IM. A few more aspects of this method need to be secured, and in particular the AO Department will as-sess the impact of the model errors on the system performance and robustness.
Four Laser Guide Star Facility
Four Laser Guide Stars are required for the type of corrections needed; it is envi-sioned to perform Ground Layer Adap- tive Optics for Hawk-I and MUSE involv-ing averaging turbulence measurements in four different directions around the field of view.
The choice of four launch telescopes on the centrepiece is preferred in order to avoid the so-called ‘fratricide’ effect. This degrades the wavefront sensor measure-ments when, for instance, four beams are launched from behind M2; inevitably, the beams cross the path of the neigh-bour sensors and ‘pollute’ some subap-ertures increasing the background light level and therefore noise. This effect is re-duced if lasers are launched from outside the telescope pupil (centrepiece).
The upgrade of the LGSF to four LGSF takes full advantage of the existing Laser Clean Room. As much as possible, the electronics cabinets are in the LCR, the interlock panel and the fibre laser sources are in the LCR, and most of the heating/cooling is confined to this space. The easy access to LCR helps in serv-icing and maintenance, and the numer-ous safety issues become more man-ageable. The existing LCR was already dimensioned to host multiple lasers, in the LGSF project. Moreover, with fibre lasers the power consumption is much reduced. Hence very little modifications
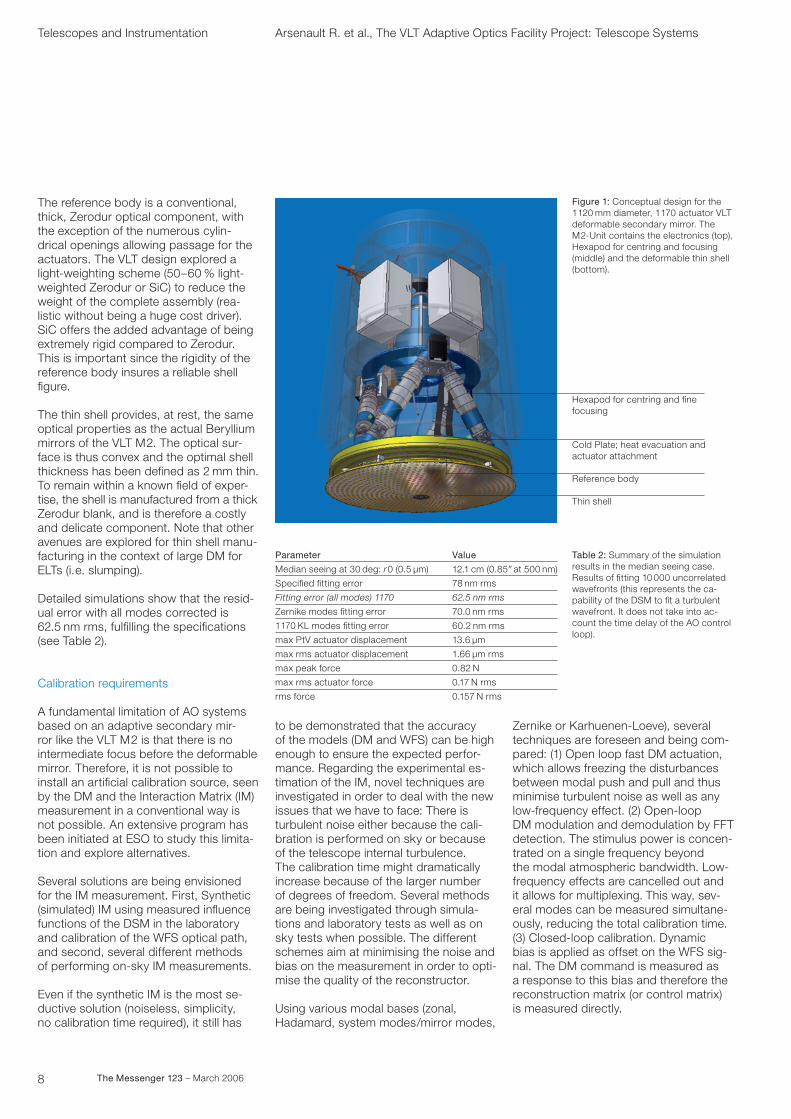
optical train and calls for the maximum simplification possible. Care has to be applied for optics working at high power densities. This requirement coupled with the flexibility to point the LGS at 0, 60 or ��0 arcsec off-axis, as required by MUSE and Hawk-I, has driven the choice of the Launch Telescope optics toward a refractive, single-lens f/5 design, with the fibre laser output at its focal plane. The first Eigenfrequency of the LTS has to be > 60 Hz, in order to avoid LGS wander-ing and unwanted jitters. This imposes strict choices on the mechanical support structure of the LTS, which is in CFRP to ensure stiffness and reduce weight.
Above the Launch telescope, there is a movable shutter curtain to protect the lens when it is not in use, and a long baffle to avoid as much as possible scat-tering light in the telescope environment. In operation the diagnostic system can be in or not. A motorised flipper mirror can optionally send the output beam to a Coherent LM-�5 calibrated power-metre, to measure the output beam power.
ASSIST
A complete testing of the ‘AO system’ as done for conventional ones (NAOS and such) is not possible without the tele-scope, or a sophisticated facility repro-ducing the opto-mechanical interfaces. In the present case there is the additional complexity of testing a large convex op-tical component.
are required to the Laser Clean Room for the upgrade to �LGSF. Other systems from the existing LGSF are being re-used, such as the Aircraft Avoidance System.
The baseline lasers are 1178 nm fibre Raman lasers, which are frequency doubled to 589 nm. The fibre delivers 20+ W CW at 1178 nm, 1 GHz line- width. The frequency doubling is done via a single pass on PPSLT, a non-linear crystal. The fibre laser is an on-going development at ESO, together with the companies IPF Technology Ltd (UK), Toptica (D) and the Russian branch of the company Volius. ESO has so far reached 2.9 W CW at 589 nm in its lab, aiming to reach full power in the second half of 2006.
The polarisation maintaining single- mode fibre will directly reach the Launch telescopes using a fireproof fibre cable and going through the altitude cable wrap up to the UT� centrepiece. At each launch telescope, a small box contains the frequency doubling PPSLT crystal, its temperature controller and the frequen- cy feedback control sensor. The frequen-cy doubling unit is located at the Launch Telescope.
The four Launch Telescopes located on the centrepiece (Figure 2) have demand-ing requirements. The projected laser beam quality has to be diffraction limited to guarantee the minimum LGS angu- lar size, which imposes constraints on the
Figure 2: The four Launch telescopes of the �LGSF baseline design are mounted on the UT� centrepiece. The singlet large BK7 lenses are sup-ported by a carbon fibre cone-shaped shell, which gives high rigidity and stability. The fibre laser output goes directly at the focal plane of the f/5, 500 mm diameter lens. Note the long baffles necessary to avoid light scattering in the UT� dome volume.
Extension ducts
Connection devices
10 The Messenger 123 – March 2006
Telescopes and Instrumentation Arsenault R. et al., The VLT Adaptive Optics Facility Project: Telescope Systems
The Test Facility described below is in itself a complex and relatively costly sys- tem; think only of the 1.65 m concave mirror required. However, one must not neglect the usefulness of investing in a versatile and complete test facility in order to characterise and understand these systems. It will allow the designer team to gain sufficient confidence and invaluable experience with the adaptive optics systems before re-assembly and integration on the telescope. In the end this will save valuable telescope time by minimising commissioning time.
This facility will not only allow testing of the DSM itself, but it will also provide a turbulence generator to simulate AO correction in realistic conditions and VLT standard opto-mechanical inter-faces to the AO pre-stages GRAAL and GALACSI for the instruments Hawk-I and MUSE respectively.
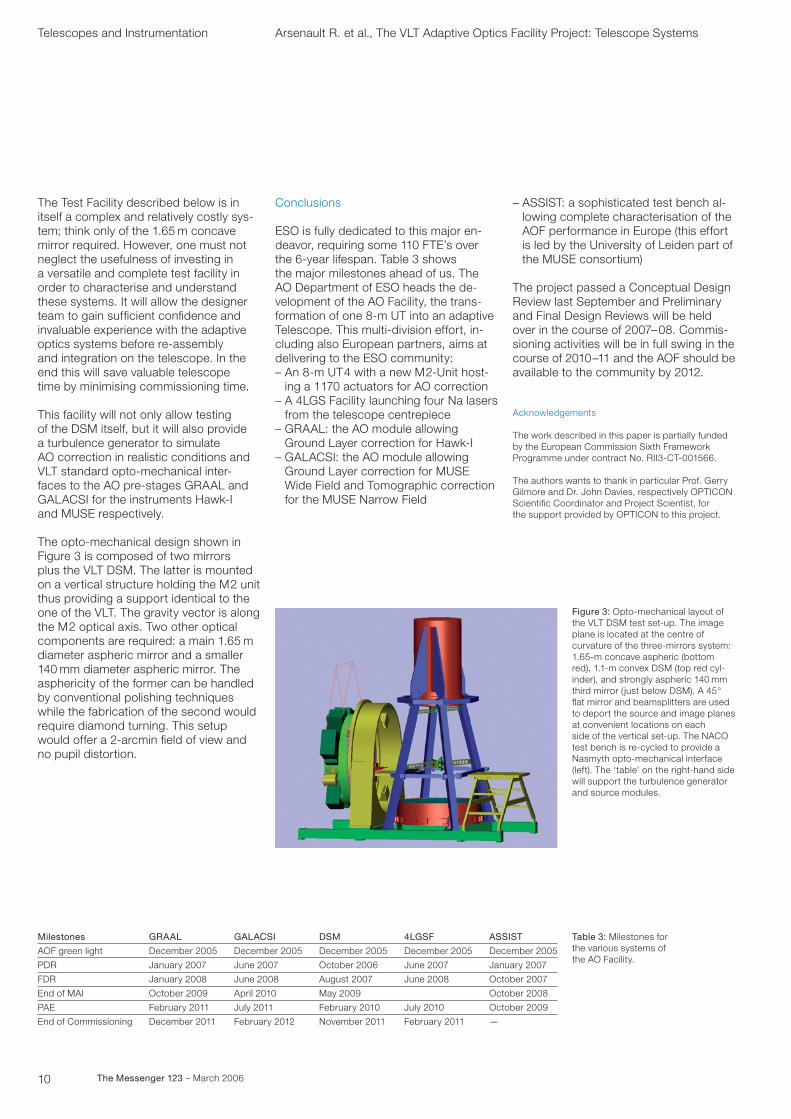
The opto-mechanical design shown in Figure � is composed of two mirrors plus the VLT DSM. The latter is mounted on a vertical structure holding the M2 unit thus providing a support identical to the one of the VLT. The gravity vector is along the M2 optical axis. Two other optical components are required: a main 1.65 m diameter aspheric mirror and a smaller 1�0 mm diameter aspheric mirror. The asphericity of the former can be handled by conventional polishing techniques while the fabrication of the second would require diamond turning. This setup would offer a 2-arcmin field of view and no pupil distortion.
Conclusions
ESO is fully dedicated to this major en-deavor, requiring some 110 FTE’s over the 6-year lifespan. Table � shows the major milestones ahead of us. The AO Department of ESO heads the de-velopment of the AO Facility, the trans-formation of one 8-m UT into an adaptive Telescope. This multi-division effort, in- cluding also European partners, aims at delivering to the ESO community:– An 8-m UT� with a new M2-Unit host-
ing a 1170 actuators for AO correction– A �LGS Facility launching four Na lasers
from the telescope centrepiece– GRAAL: the AO module allowing
Ground Layer correction for Hawk-I– GALACSI: the AO module allowing
Ground Layer correction for MUSE Wide Field and Tomographic correction for the MUSE Narrow Field
– ASSIST: a sophisticated test bench al-lowing complete characterisation of the AOF performance in Europe (this effort is led by the University of Leiden part of the MUSE consortium)
The project passed a Conceptual Design Review last September and Preliminary and Final Design Reviews will be held over in the course of 2007–08. Commis-sioning activities will be in full swing in the course of 2010–11 and the AOF should be available to the community by 2012.
Acknowledgements
The work described in this paper is partially funded by the European Commission Sixth Framework Programme under contract No. RII�-CT-001566.
The authors wants to thank in particular Prof. Gerry Gilmore and Dr. John Davies, respectively OPTICON Scientific Coordinator and Project Scientist, for the support provided by OPTICON to this project.
Figure 3: Opto-mechanical layout of the VLT DSM test set-up. The image plane is located at the centre of curvature of the three-mirrors system: 1.65-m concave aspheric (bottom red), 1.1-m convex DSM (top red cyl-inder), and strongly aspheric 1�0 mm third mirror ( just below DSM). A �5° flat mirror and beamsplitters are used to deport the source and image planes at convenient locations on each side of the vertical set-up. The NACO test bench is re-cycled to provide a Nasmyth opto-mechanical interface (left). The ‘table’ on the right-hand side will support the turbulence generator and source modules.
Milestones
AOF green light
PDR
FDR
End of MAI
PAE
End of Commissioning
GRAAL
December 2005
January 2007
January 2008
October 2009
February 2011
December 2011
GALACSI
December 2005
June 2007
June 2008
April 2010
July 2011
February 2012
DSM
December 2005
October 2006
August 2007
May 2009
February 2010
November 2011
4LGSF
December 2005
June 2007
June 2008
July 2010
February 2011
ASSIST
December 2005
January 2007
October 2007
October 2008
October 2009
—
Table 3: Milestones for the various systems of the AO Facility.
11The Messenger 123 – March 2006
Telescopes and Instrumentation
The VLT Adaptive Optics Facility Project: Adaptive Optics Modules
Robin Arsenault1
Norbert Hubin1
Stefan Stroebele1
Enrico Fedrigo1
Sylvain Oberti1
Markus Kissler-Patig1
Roland Bacon6
Richard McDermid7
Domenico Bonaccini-Calia1
Roberto Biasi�
Daniele Gallieni�
Armando Riccardi 5
Rob Donaldson1
Miska Lelouarn1
Wolfgang Hackenberg1
Ralf Conzelman1
Bernard Delabre1
Remko Stuik7
Jerome Paufique1
Markus Kasper1
Elise Vernet1
Mark Downing1
Simone Esposito 5
Michel Duchateau1
Marijn Franx7
Richard Myers 2
Steven Goodsell 2
1 ESO2 University of Durham, United Kingdom� MicroGate� ADS International5 INAF – Osservatorio Astrofisico di
Arcetri, Italy6 CRAL, Observatoire de Lyon, France7 Leiden University, the Netherlands
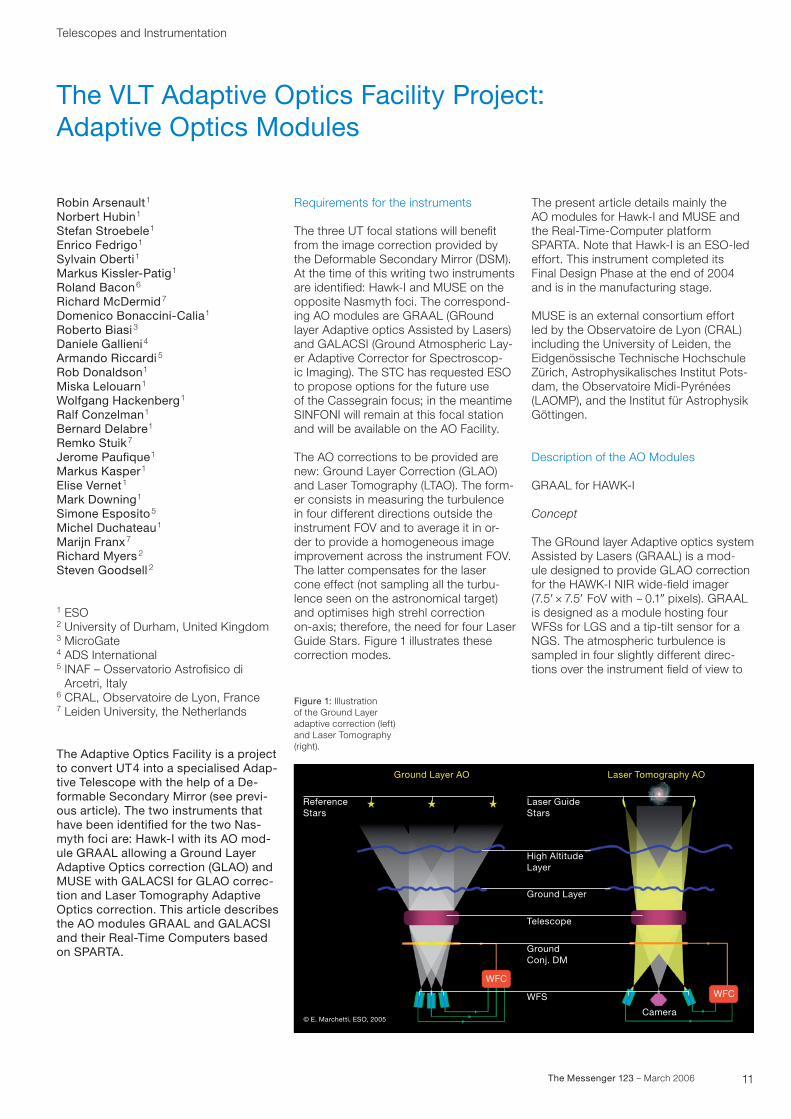
The Adaptive Optics Facility is a project to convert UT4 into a specialised Adap- tive Telescope with the help of a De- formable Secondary Mirror (see previ-ous article). The two instruments that have been identified for the two Nas-myth foci are: Hawk-I with its AO mod-ule GRAAL allowing a Ground Layer Adaptive Optics correction (GLAO) and MUSE with GALACSI for GLAO correc-tion and Laser Tomography Adaptive Optics correction. This article describes the AO modules GRAAL and GALACSI and their Real-Time Computers based on SPARTA.
Requirements for the instruments
The three UT focal stations will benefit from the image correction provided by the Deformable Secondary Mirror (DSM). At the time of this writing two instruments are identified: Hawk-I and MUSE on the opposite Nasmyth foci. The correspond-ing AO modules are GRAAL (GRound layer Adaptive optics Assisted by Lasers) and GALACSI (Ground Atmospheric Lay- er Adaptive Corrector for Spectroscop- ic Imaging). The STC has requested ESO to propose options for the future use of the Cassegrain focus; in the meantime SINFONI will remain at this focal station and will be available on the AO Facility.
The AO corrections to be provided are new: Ground Layer Correction (GLAO) and Laser Tomography (LTAO). The form-er consists in measuring the turbulence in four different directions outside the instrument FOV and to average it in or-der to provide a homogeneous image improvement across the instrument FOV. The latter compensates for the laser cone effect (not sampling all the turbu-lence seen on the astronomical target) and optimises high strehl correction on-axis; therefore, the need for four Laser Guide Stars. Figure 1 illustrates these correction modes.
The present article details mainly the AO modules for Hawk-I and MUSE and the Real-Time-Computer platform SPARTA. Note that Hawk-I is an ESO-led effort. This instrument completed its Final Design Phase at the end of 200� and is in the manufacturing stage.
MUSE is an external consortium effort led by the Observatoire de Lyon (CRAL) including the University of Leiden, the Eidgenössische Technische Hochschule Zürich, Astrophysikalisches Institut Pots-dam, the Observatoire Midi-Pyrénées (LAOMP), and the Institut für Astrophysik Göttingen.
Description of the AO Modules
GRAAL for HAWK-I
Concept
The GRound layer Adaptive optics system Assisted by Lasers (GRAAL) is a mod- ule designed to provide GLAO correction for the HAWK-I NIR wide-field imager (7.5;× 7.5; FoV with ~ 0.1? pixels). GRAAL is designed as a module hosting four WFSs for LGS and a tip-tilt sensor for a NGS. The atmospheric turbulence is sampled in four slightly different direc-tions over the instrument field of view to
Figure 1: Illustration of the Ground Layer adaptive correction (left) and Laser Tomography (right).
Reference Stars
Laser Guide Stars
High AltitudeLayer
Ground Layer
Ground Conj. DM
WFC
Camera
Ground Layer AO Laser Tomography AO
Telescope
© E. Marchetti, ESO, 2005
WFS WFC
12 The Messenger 123 – March 2006
send an average correction, homoge-neous over the scientific field of view, to the DSM. The improvement provided by GRAAL can be summarised in saying that it will allow HAWK-I to work most of the time under better than median see-ing conditions (e.g. the FWHM of the PSF will be reduced from 0.9�? to 0.7�?). Even under most conditions (1? seeing in the visible), the 50 % encircled energy diameter will be reduced by 15 % in the Y and �0 % in the Ks over the entire field of view.
The system will use the Deformable Secondary Mirror (DSM) having enough stroke and degrees of freedom to cor-rect for the atmospheric seeing (up to 2? seeing) including the atmospheric tip-tilt and for VLT field stabilisation. Four Sodium Laser Guide Stars emitted from four 50-cm laser projectors located on the VLT centrepiece will be sensed by four �0 × �0 Wave-Front Sensors (WFS). These wavefront sensors must rotate to compensate for the pupil rotation at the Nasmyth focus and they must acquire and track the focus of the corresponding laser spots.
As baseline a visible tip-tilt sensor has been considered. To avoid obscuration of the HAWK-I FoV the visible NGS will be acquired outside the HAWK-I FoV. As an alternative an IR Natural Guide star could
be used to sense tip-tilt aberrations. The IR NGS will be selected inside the HAWK-I FoV. The sensing would then be performed using the guide mode of the HAWK-I Hawaii2RG infrared detectors: a small window (16 ×16 pixels) around the IR NGS will be read out at high frequency to sense tip-tilt.
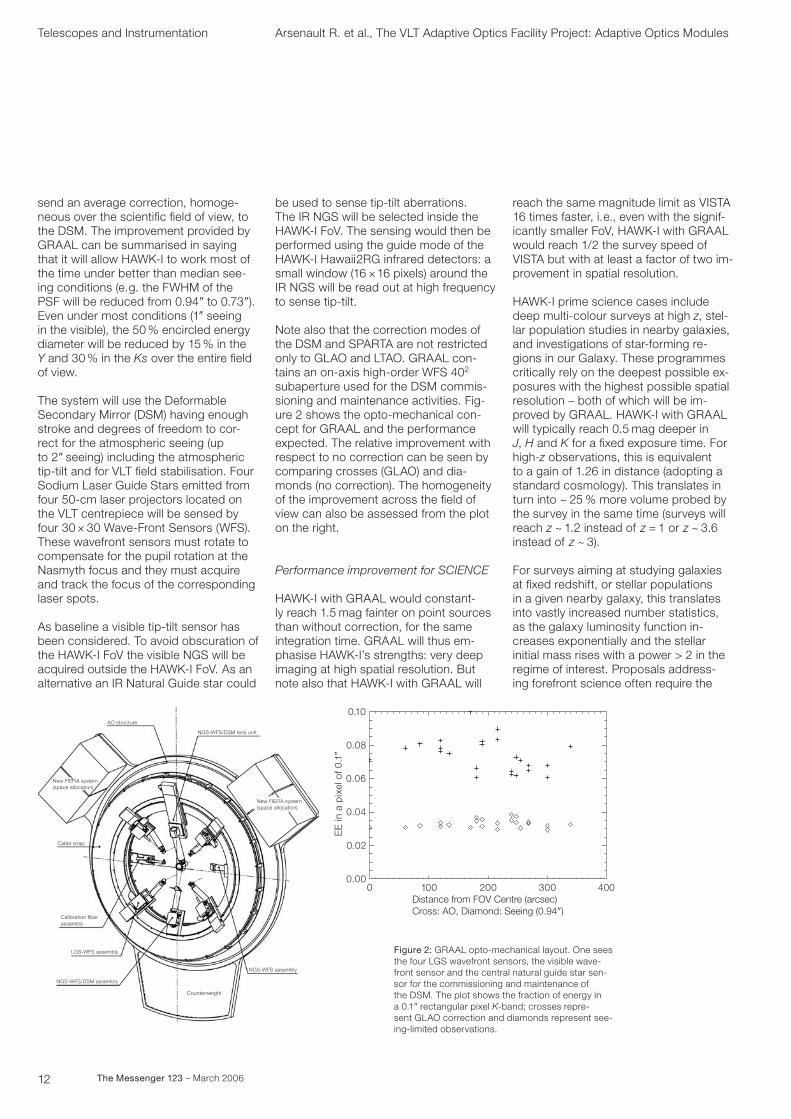
Note also that the correction modes of the DSM and SPARTA are not restricted only to GLAO and LTAO. GRAAL con-tains an on-axis high-order WFS �02 subaperture used for the DSM commis-sioning and maintenance activities. Fig- ure 2 shows the opto-mechanical con-cept for GRAAL and the performance expected. The relative improvement with respect to no correction can be seen by comparing crosses (GLAO) and dia-monds (no correction). The homogeneity of the improvement across the field of view can also be assessed from the plot on the right.
Performance improvement for SCIENCE
HAWK-I with GRAAL would constant- ly reach 1.5 mag fainter on point sources than without correction, for the same integration time. GRAAL will thus em-phasise HAWK-I’s strengths: very deep imaging at high spatial resolution. But note also that HAWK-I with GRAAL will
reach the same magnitude limit as VISTA 16 times faster, i.e., even with the signif-icantly smaller FoV, HAWK-I with GRAAL would reach 1/2 the survey speed of VISTA but with at least a factor of two im-provement in spatial resolution.
HAWK-I prime science cases include deep multi-colour surveys at high z, stel-lar population studies in nearby galaxies, and investigations of star-forming re-gions in our Galaxy. These programmes critically rely on the deepest possible ex-posures with the highest possible spatial resolution – both of which will be im-proved by GRAAL. HAWK-I with GRAAL will typically reach 0.5 mag deeper in J, H and K for a fixed exposure time. For high-z observations, this is equivalent to a gain of 1.26 in distance (adopting a standard cosmology). This translates in turn into ~ 25 % more volume probed by the survey in the same time (surveys will reach z ~ 1.2 instead of z = 1 or z ~ �.6 instead of z ~ �).
For surveys aiming at studying galaxies at fixed redshift, or stellar populations in a given nearby galaxy, this translates into vastly increased number statistics, as the galaxy luminosity function in-creases exponentially and the stellar initial mass rises with a power > 2 in the regime of interest. Proposals address- ing forefront science often require the
AO structure
New FIERA system(space allocation)
New FIERA system(space allocation)
NGS-WFS/DSM lens unit
Cable wrap
Counterweight
NGS-WFS/DSM assembly
LGS-WFS assembly
Calibration fiberassembly
NGS-WFS assembly
0 100 200 300 400Distance from FOV Centre (arcsec)Cross: AO, Diamond: Seeing (0.94�)
0.00
0.02
0.04
0.06
0.08
0.10
EE
in a
pix
el o
f 0.1
�
Figure 2: GRAAL opto-mechanical layout. One sees the four LGS wavefront sensors, the visible wave-front sensor and the central natural guide star sen- sor for the commissioning and maintenance of the DSM. The plot shows the fraction of energy in a 0.1? rectangular pixel K-band; crosses repre- sent GLAO correction and diamonds represent see-ing-limited observations.
Telescopes and Instrumentation Arsenault R. et al., The VLT Adaptive Optics Facility Project: Adaptive Optics Modules
1�The Messenger 123 – March 2006
best seeing conditions. Currently, the nat-ural seeing in the K-band is better than 0.�? only 20 % of the time. With GRAAL, an image quality in the K-band below 0.�? will be achieved ~ 80 % of the time. GRAAL will provide a fourfold increase in time for the most challenging proposals.
GALACSI
Concept
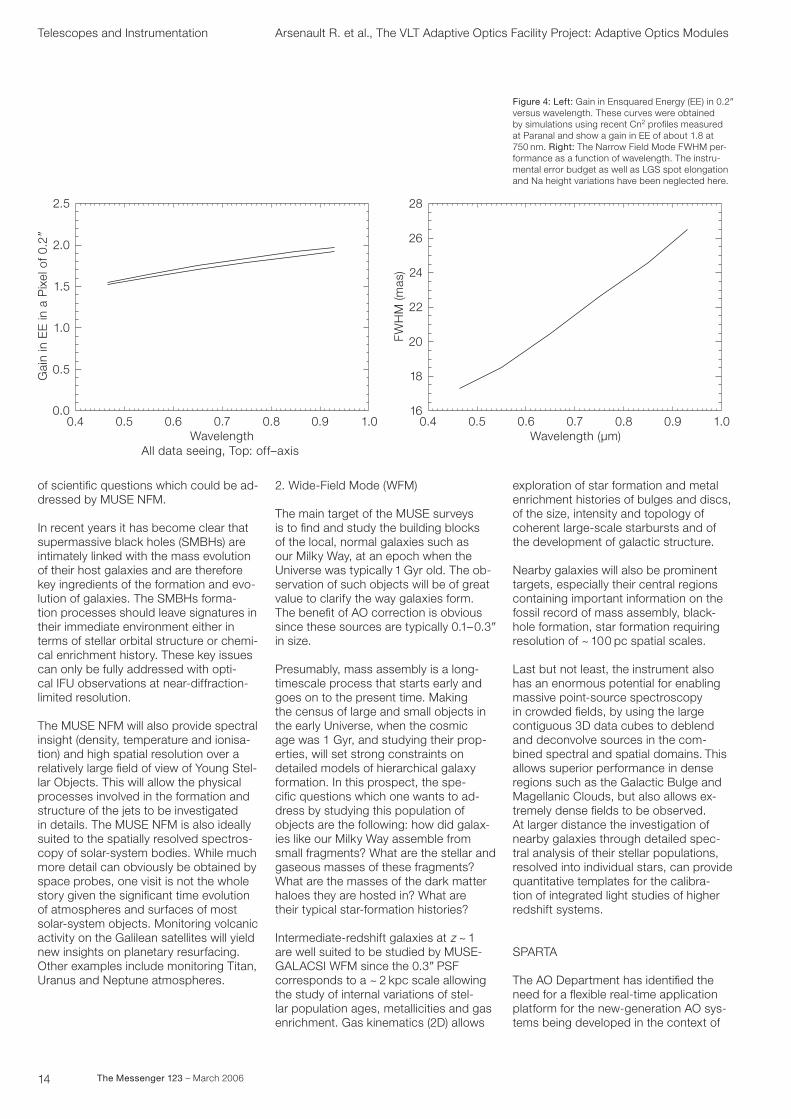
GALACSI is a module very similar to GRAAL. It will include four LGS WFS and one tip-tilt natural star sensor. It will of- fer a correction mode identical to GRAAL GLAO (laser stars closer since FoV smaller), that is seeing improver, except for a smaller field of view called Wide Field Mode (1 arcmin). Although the field of view is smaller, the gain in ensquared energy gain is similar to GRAAL since the wavelength is shorter (750 nm). The Nar-row Field Mode is the real challenge since it aims at a strehl ratio of some 10 % a 650 nm in a 7.5? field of view. Laser To-mography means that the WFS data are used to assess the altitude distribution of turbulence, compensated for the laser cone effect, in order to provide a correc-tion vector to the DSM optimised to allow high strehl ratio on-axis.
It will serve MUSE, a visible spectrograph (0.�6–0.9� µm) sitting on the Nasmyth platform and composed of 2� identical Integral Field Units. MUSE will obtain 90 000 spectra (�70 ×106 pixels) with a resolution of � 000 in a single exposure.
Since the DSM is attached to the tele-scope structure, its actuator geome-try will rotate like the pupil at the Nasmyth focal plane of the VLT. To maintain the matching between the WFS and DSM pattern the WFSs must rotate like the telescope pupil. This corresponds to a co-rotation of the WFSs with the Tele-scope altitude axis. The same applies for the field position of the LGSs. The rota-tion is done by co-rotating GALACSI with the Nasmyth rotator. The field de-rotation for MUSE is done inside MUSE.
The visible tip-tilt natural guide star sen-sor for the Wide Field Mode is expected to have a limiting magnitude around Mv ~17.5. Natural tip-tilt star will be ac- quired within a �; technical FOV but out-side the 1; square scientific FOV to prevent occultation of the scientific FOV. An IR on-axis tip-tilt natural guide star sensor will be used for the 7.5? Narrow Field Mode. Light separation will be done with a VIS/IR dichroic located after the Adaptive Optics focal plane. Figure �
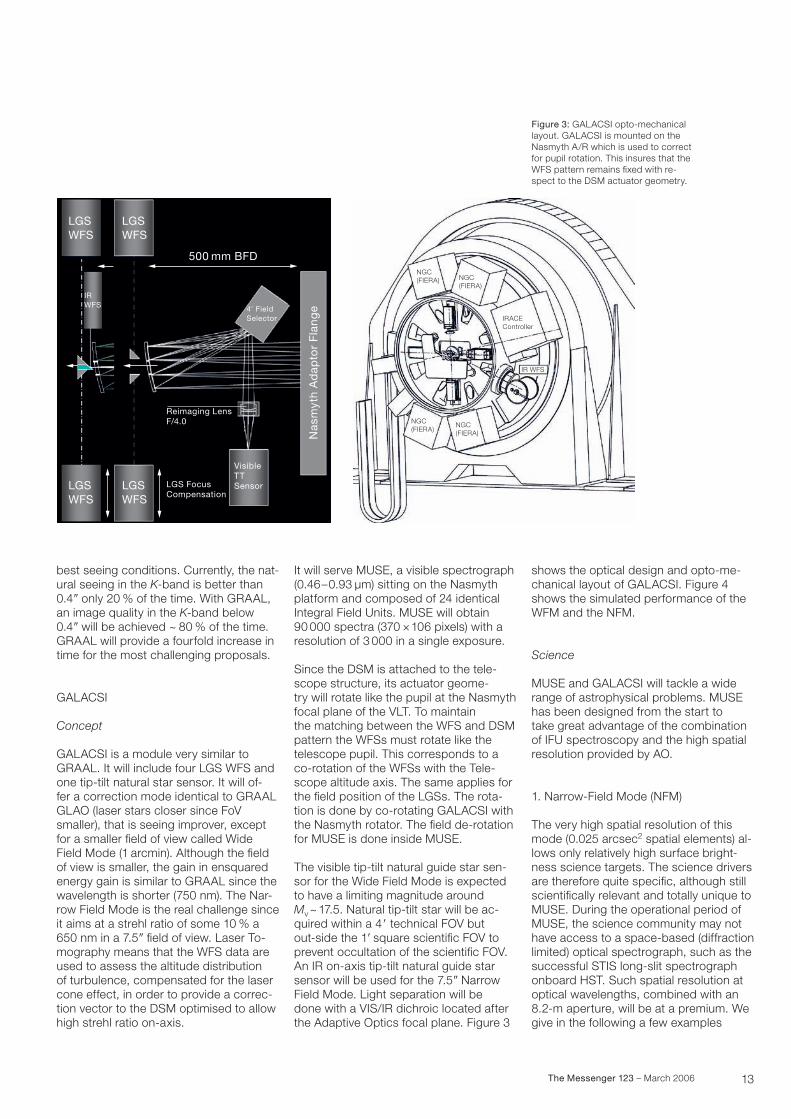
shows the optical design and opto-me-chanical layout of GALACSI. Figure � shows the simulated performance of the WFM and the NFM.
Science
MUSE and GALACSI will tackle a wide range of astrophysical problems. MUSE has been designed from the start to take great advantage of the combination of IFU spectroscopy and the high spatial resolution provided by AO.
1. Narrow-Field Mode (NFM)
The very high spatial resolution of this mode (0.025 arcsec2 spatial elements) al- lows only relatively high surface bright-ness science targets. The science drivers are therefore quite specific, although still scientifically relevant and totally unique to MUSE. During the operational period of MUSE, the science community may not have access to a space-based (diffraction limited) optical spectrograph, such as the successful STIS long-slit spectrograph onboard HST. Such spatial resolution at optical wavelengths, combined with an 8.2-m aperture, will be at a premium. We give in the following a few examples
Figure 3: GALACSI opto-mechanical layout. GALACSI is mounted on the Nasmyth A/R which is used to correct for pupil rotation. This insures that the WFS pattern remains fixed with re-spect to the DSM actuator geometry.
500 mm BFD
Nas
myt
h A
dap
tor
Fla
ng
e
LGSWFS
LGSWFS
LGSWFS
LGS FocusCompensation
Reimaging LensF/4.0
LGSWFS
IRWFS 4� Field
Selector
Visible TTSensor
NGC(FIERA)
NGC(FIERA)
NGC(FIERA)
NGC(FIERA)
IR WFS
IRACEController
1� The Messenger 123 – March 2006
of scientific questions which could be ad-dressed by MUSE NFM.
In recent years it has become clear that supermassive black holes (SMBHs) are intimately linked with the mass evolution of their host galaxies and are therefore key ingredients of the formation and evo-lution of galaxies. The SMBHs forma- tion processes should leave signatures in their immediate environment either in terms of stellar orbital structure or chemi-cal enrichment history. These key issues can only be fully addressed with opti- cal IFU observations at near-diffraction-limited resolution.
The MUSE NFM will also provide spectral insight (density, temperature and ionisa-tion) and high spatial resolution over a relatively large field of view of Young Stel-lar Objects. This will allow the physical processes involved in the formation and structure of the jets to be investigated in details. The MUSE NFM is also ideally suited to the spatially resolved spectros-copy of solar-system bodies. While much more detail can obviously be obtained by space probes, one visit is not the whole story given the significant time evolution of atmospheres and surfaces of most solar-system objects. Monitoring volcanic activity on the Galilean satellites will yield new insights on planetary resurfacing. Other examples include monitoring Titan, Uranus and Neptune atmospheres.
2. Wide-Field Mode (WFM)
The main target of the MUSE surveys is to find and study the building blocks of the local, normal galaxies such as our Milky Way, at an epoch when the Universe was typically 1 Gyr old. The ob-servation of such objects will be of great value to clarify the way galaxies form. The benefit of AO correction is obvious since these sources are typically 0.1–0.�? in size.
Presumably, mass assembly is a long-timescale process that starts early and goes on to the present time. Making the census of large and small objects in the early Universe, when the cosmic age was 1 Gyr, and studying their prop-erties, will set strong constraints on detailed models of hierarchical galaxy formation. In this prospect, the spe- cific questions which one wants to ad-dress by studying this population of objects are the following: how did galax-ies like our Milky Way assemble from small fragments? What are the stellar and gaseous masses of these fragments? What are the masses of the dark matter haloes they are hosted in? What are their typical star-formation histories?
Intermediate-redshift galaxies at z ~ 1 are well suited to be studied by MUSE-GALACSI WFM since the 0.�? PSF corresponds to a ~ 2 kpc scale allowing the study of internal variations of stel- lar population ages, metallicities and gas enrichment. Gas kinematics (2D) allows
exploration of star formation and metal enrichment histories of bulges and discs, of the size, intensity and topology of coherent large-scale starbursts and of the development of galactic structure.
Nearby galaxies will also be prominent targets, especially their central regions containing important information on the fossil record of mass assembly, black- hole formation, star formation requiring resolution of ~ 100 pc spatial scales.
Last but not least, the instrument also has an enormous potential for enabling massive point-source spectroscopy in crowded fields, by using the large contiguous �D data cubes to deblend and deconvolve sources in the com-bined spectral and spatial domains. This allows superior performance in dense regions such as the Galactic Bulge and Magellanic Clouds, but also allows ex-tremely dense fields to be observed. At larger distance the investigation of nearby galaxies through detailed spec-tral analysis of their stellar populations, resolved into individual stars, can provide quantitative templates for the calibra-tion of integrated light studies of higher redshift systems.
SPARTA
The AO Department has identified the need for a flexible real-time application platform for the new-generation AO sys-tems being developed in the context of
Telescopes and Instrumentation Arsenault R. et al., The VLT Adaptive Optics Facility Project: Adaptive Optics Modules
Figure 4: Left: Gain in Ensquared Energy (EE) in 0.2? versus wavelength. These curves were obtained by simulations using recent Cn2 profiles measured at Paranal and show a gain in EE of about 1.8 at 750 nm. Right: The Narrow Field Mode FWHM per-formance as a function of wavelength. The instru-mental error budget as well as LGS spot elongation and Na height variations have been neglected here.
0.80.0
0.5
1.0
1.5
2.0
2.5
0.4 0.5 0.6 0.7 0.9 1.0Wavelength
All data seeing, Top: off–axis
Gai
n in
EE
in a
Pix
el o
f 0.2
�
0.816
18
20
22
24
26
28
FW
HM
(mas
)
0.4 0.5 0.6 0.7 0.9 1.0Wavelength (µm)
15The Messenger 123 – March 2006
the AO Facility. SPARTA (Standard Plat- form for Adaptive optics Real Time Ap-plications) is the answer to this need. The RTC’s of GRAAL and GALACSI will be based on SPARTA.
SPARTA is a project that starts from the OPTICON/JRA-1 framework to provide a solution to the challenge of building a real-time computer for high-order/high- bandwidth systems but at the same time using mainly Components Off-The-Shelf (COTS). SPARTA goals are to serve all the second-generation VLT instrumentation (AO Facility and the Planet Finder) and to create a basis for growth towards ELT-size AO systems.
The requirements for the new genera- tion of AO systems are beyond the cur-rent computational power of single board computers used today. For in-stance, the requirements for the Planet Finder is 200 times higher than the capacity of the NAOS RTC (plus keep-ing the latency very low). The latency is the major challenge of SPARTA: the RTC must not only compute the control commands fast enough to cope with the increased loop frequency, but it also has to complete the computation earlier to reduce time-related errors. This is equivalent to a system much faster than the nominal loop frequency. On the other hand, it is clear that the time required to develop an AO system is rather long and the final result consists primarily of infrastructure, data management and interface: the core real time application is a tiny portion of the whole AO RTC system. These are the main reasons to create a common platform to serve all these projects.
The complexity of the control software and the required flexibility would sug- gest the use of high-end CPUs, pro-grammable with standard programming languages (C/C++) with a relatively fast developing cycle. That was the natural choice for the first SPARTA prototype, based on multi-CPU board connected to-gether to achieve the required through-put. Unfortunately with such architecture the low latency requirements cannot be achieved due to structural problems of the CPU architecture.
To solve this problem one has to change the technology. This is where FPGAs come into play. An FPGA is a chip that provides millions of logical elements that can be connected by means of a pro-gramme to create any function that will then execute at the speed of the FPGA core clock. Moreover, many functions can be programmed, until all elements are used. All of these functions run in parallel and this is the great advantage of FPGAs. However FPGA programming is a difficult exercise; it uses the same language as for designing integrated cir-cuits and microprocessors.
Consequently the development cycle of an FPGA application is much slower and the debugging much more diffi- cult. Where the FPGA is unbeatable is the communication infrastructure: be- ing implemented in hardware, there is no additional latency. The perfect appli- cation for the FPGA is to manage all the critical communications of SPARTA so that data are routed within the system at the fastest possible speed and the lowest possible latency. Hence the collabora- tion between ESO and Durham, under the OPTICON/JRA-1 project. Durham is de- veloping an FPGA-based acquisition processor that receives the pixel stream and processes them up to the compu-tation of the gradients. The gradients will then be further processed by a DSP array.
A DSP is fundamentally a CPU, so it shares the same problems if used as a CPU. However a DSP is also equipped with fast communication ports and a big (� MB) on-chip memory. Using fast I/O and the internal memory a DSP can deliver a high throughput while signifi-cantly simplifying the development cycle being a CPU. A DSP can be programmed in C/C++. The market recently made available a board with several DSPs whose link ports are interfaced directly to FPGAs, a good match for our architec-ture. The I/O is managed by the FPGAs and the DSPs act as an array of co-proc-essors.
The GALACSI SPARTA has four Shack-Hartmann sensors providing four pixel streams coming from the NGCs. They are connected to a switch that converts the optical signals to electrical ones
and routes them to four independent front-end FPGAs, hosted in two boards. Each FPGA will run the Durham module that will produce the gradients. Each FPGA sends the gradient vector to a different DSP board equipped with eight DSPs. Each DSP board will process the related portion of the control matrix and then results are gathered on the back-end FPGA that will complete the processing with the time-domain filter, and finally results are sent to the correc-tive optics device. This architecture can run at 1 KHz with a latency of about 120 µs.
Conclusions
The AO Department of ESO is heading the development of the AO Facility, the transformation of one 8-m UT (pre-sumably UT�) into an adaptive Tele-scope. GRAAL and GALACSI, the AO modules for Hawk-I and MUSE respec-tively, are two major building blocks for this project. The corresponding sci-ence cases have convinced the CDR review boards of the scientific competi-tiveness of the AO Facility. A third in- strument and AO module is in the work for the Cassegrain station but has not been yet identified.
The project passed a Conceptual Design Review last September and Preliminary and Final Design Reviews will be com-pleted in the course of 2008. The com-missioning activities will be in full swing in the course of 2010–11 and the AOF should be available to the community by 2012.
Acknowledgements
The work described in this paper is partially funded by the European Commission Sixth Framework Programme under contract No. RII�-CT-001566.
The authors want to thank in particular Prof. Gerry Gilmore and Dr. John Davies, respectively OPTICON Scientific Coordinator and Project Scientist, for the support provided by OPTICON to this project.
16 The Messenger 123 – March 2006
Telescopes and Instrumentation
First Light for the VLT Laser Guide Star Facility
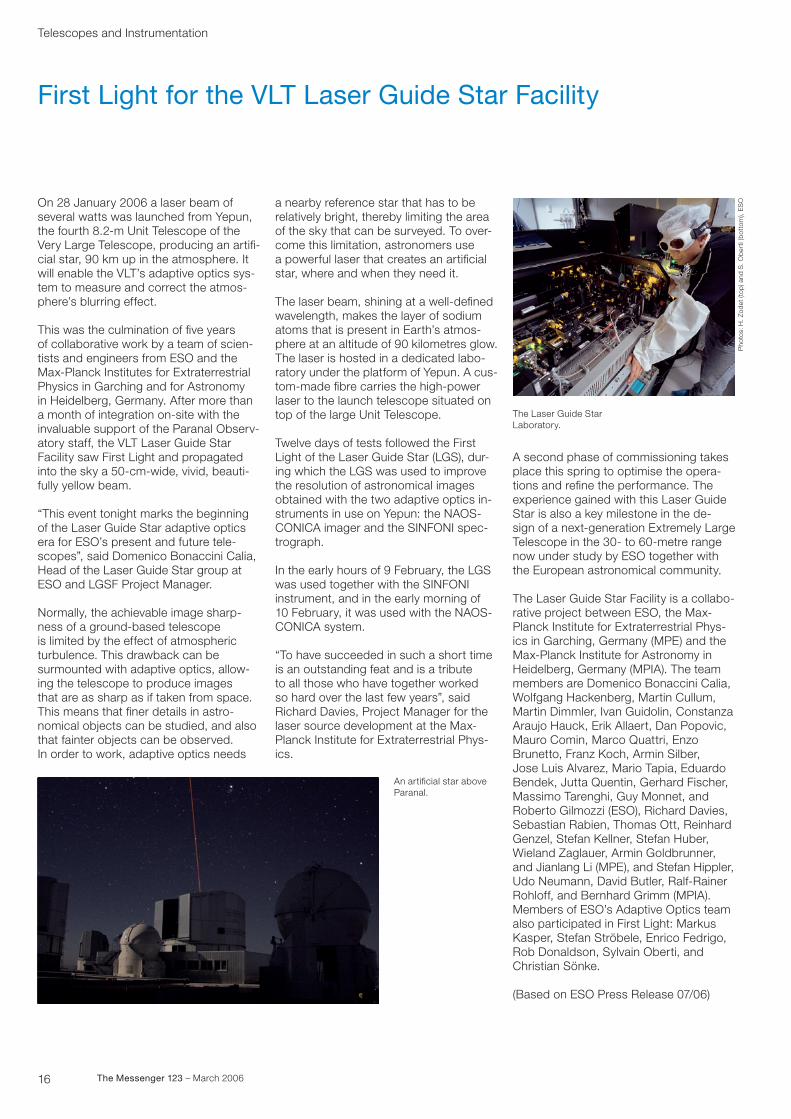
On 28 January 2006 a laser beam of several watts was launched from Yepun, the fourth 8.2-m Unit Telescope of the Very Large Telescope, producing an artifi- cial star, 90 km up in the atmosphere. It will enable the VLT’s adaptive optics sys-tem to measure and correct the atmos-phere’s blurring effect.
This was the culmination of five years of collaborative work by a team of scien-tists and engineers from ESO and the Max-Planck Institutes for Extraterrestrial Physics in Garching and for Astronomy in Heidelberg, Germany. After more than a month of integration on-site with the invaluable support of the Paranal Observ-atory staff, the VLT Laser Guide Star Facility saw First Light and propagated into the sky a 50-cm-wide, vivid, beauti-fully yellow beam.
“This event tonight marks the beginning of the Laser Guide Star adaptive optics era for ESO’s present and future tele-scopes”, said Domenico Bonaccini Calia, Head of the Laser Guide Star group at ESO and LGSF Project Manager.
Normally, the achievable image sharp-ness of a ground-based telescope is limited by the effect of atmospheric turbulence. This drawback can be surmounted with adaptive optics, allow-ing the telescope to produce images that are as sharp as if taken from space. This means that finer details in astro-nomical objects can be studied, and also that fainter objects can be observed. In order to work, adaptive optics needs
a nearby reference star that has to be relatively bright, thereby limiting the area of the sky that can be surveyed. To over-come this limitation, astronomers use a powerful laser that creates an artificial star, where and when they need it.
The laser beam, shining at a well-defined wavelength, makes the layer of sodium atoms that is present in Earth’s atmos-phere at an altitude of 90 kilometres glow. The laser is hosted in a dedicated labo- ratory under the platform of Yepun. A cus-tom-made fibre carries the high-power laser to the launch telescope situated on top of the large Unit Telescope.
Twelve days of tests followed the First Light of the Laser Guide Star (LGS), dur- ing which the LGS was used to improve the resolution of astronomical images obtained with the two adaptive optics in- struments in use on Yepun: the NAOS-CONICA imager and the SINFONI spec-trograph.
In the early hours of 9 February, the LGS was used together with the SINFONI instrument, and in the early morning of 10 February, it was used with the NAOS-CONICA system.
“To have succeeded in such a short time is an outstanding feat and is a tribute to all those who have together worked so hard over the last few years”, said Richard Davies, Project Manager for the laser source development at the Max- Planck Institute for Extraterrestrial Phys-ics.
A second phase of commissioning takes place this spring to optimise the opera-tions and refine the performance. The experience gained with this Laser Guide Star is also a key milestone in the de-sign of a next-generation Extremely Large Telescope in the �0- to 60-metre range now under study by ESO together with the European astronomical community.
The Laser Guide Star Facility is a collabo-rative project between ESO, the Max- Planck Institute for Extraterrestrial Phys-ics in Garching, Germany (MPE) and the Max-Planck Institute for Astronomy in Heidelberg, Germany (MPIA). The team members are Domenico Bonaccini Calia, Wolfgang Hackenberg, Martin Cullum, Martin Dimmler, Ivan Guidolin, Constanza Araujo Hauck, Erik Allaert, Dan Popovic, Mauro Comin, Marco Quattri, Enzo Brunetto, Franz Koch, Armin Silber, Jose Luis Alvarez, Mario Tapia, Eduardo Bendek, Jutta Quentin, Gerhard Fischer, Massimo Tarenghi, Guy Monnet, and Roberto Gilmozzi (ESO), Richard Davies, Sebastian Rabien, Thomas Ott, Reinhard Genzel, Stefan Kellner, Stefan Huber, Wieland Zaglauer, Armin Goldbrunner, and Jianlang Li (MPE), and Stefan Hippler, Udo Neumann, David Butler, Ralf-Rainer Rohloff, and Bernhard Grimm (MPIA). Members of ESO’s Adaptive Optics team also participated in First Light: Markus Kasper, Stefan Ströbele, Enrico Fedrigo, Rob Donaldson, Sylvain Oberti, and Christian Sönke.
(Based on ESO Press Release 07/06)
An artificial star above Paranal.
The Laser Guide Star Laboratory.
Pho
tos:
H. Z
odet
(to
p) a
nd S
. Ob
erti
(bot
tom
), E
SO
17The Messenger 123 – March 2006
Telescopes and Instrumentation
VLT-UVES Long-Slit Spectroscopy
Swetlana Hubrig, Gerardo Avila, Andreas Kaufer, Sandro D’Odorico, Hans Dekker, Ricardo Schmutzer, Massimiliano Marchesi, Burkhard Wolff, Linda Schmidtobreick (ESO)
In August 2005 we installed eight inter- ference filters in UVES to be used with the red arm in visitor mode. The pur-pose of these filters is to isolate certain echelle orders to allow the use of a max-imum slit length of 30) in UVES.
The UV Visual Echelle Spectrograph UVES (D’Odorico 1997), which has been offered to the astronomical com-munity at the VLT since 2000, is a two- arm cross-dispersed echelle spec-trograph covering the wavelength range �00–500 nm in the blue spectral region and �20–1100 nm in the red spectral region with the possibility to use dichro-ics. The nominal resolution is �0 000 for a 1? slit, and the maximum resolution that can be attained with a narrow slit
or image slicer is 110 000 in the red and 80 000 in the blue with two-pixel sam-pling.
The scientific aim of the installation of in-terference filters in UVES is to study faint extended objects, for example plan- etary nebulae (PNe) or H ii regions which are beyond the limit of a �-m-class tele-scope. NTT-EMMI long-slit spectroscopy has been succesfully carried out since the beginning of 1996 (e.g. Corradi et al. 1996), with the main goal to study the morphology of PNe. Since PNe are the result of asymptotic giant branch (AGB) mass loss and their birth rate is very like- ly a function of metallicity, they are im-portant tracers of intermediate-age stellar populations in galaxies. A spectroscopic study of the physical conditions and chemistry of PNe and H ii regions is cru-cial to understand the metal enrichment during the galaxy lifetime.
PNe are known to display a variety of morphological components, such as multiple shells, extended halos, knots,
bipolar lobes, jets and rings, and the detailed analysis of the structure of these components provides an important in-sight into the processes governing PNe formation and evolution. The most impor-tant parameter to describe the dynam- ics and various morphological compo-nents is the velocity field derived from spatially resolved PNe. Numerous recent studies of PNe are aimed especially at disentangling the full velocity fields by high-resolution spectroscopy. As an example, a study of the structures of faint extended ionised haloes of PNe which are believed to reflect the previous history of heavy mass loss on the AGB, requires the precise knowledge of internal veloci- ty fields. The availability of the high-resolu-tion UVES long-slit mode will give the opportunity to carry out an accurate kin-ematical analysis of faint halo structures and their puzzling mysterious systems of rings discovered in HST images (e.g., Terzian and Hajian 2000, Corradi et al. 200�). We note that at present, only very few other high-resolution spectrographs at 8–10-m class telescopes in the world
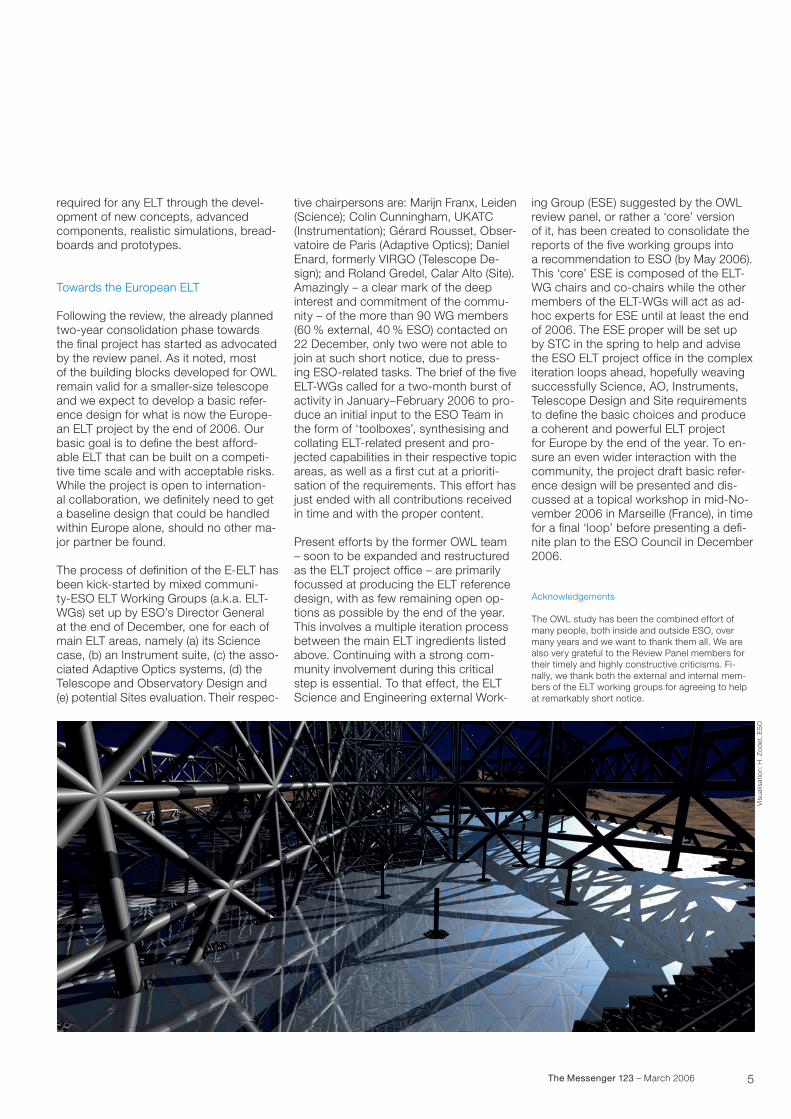
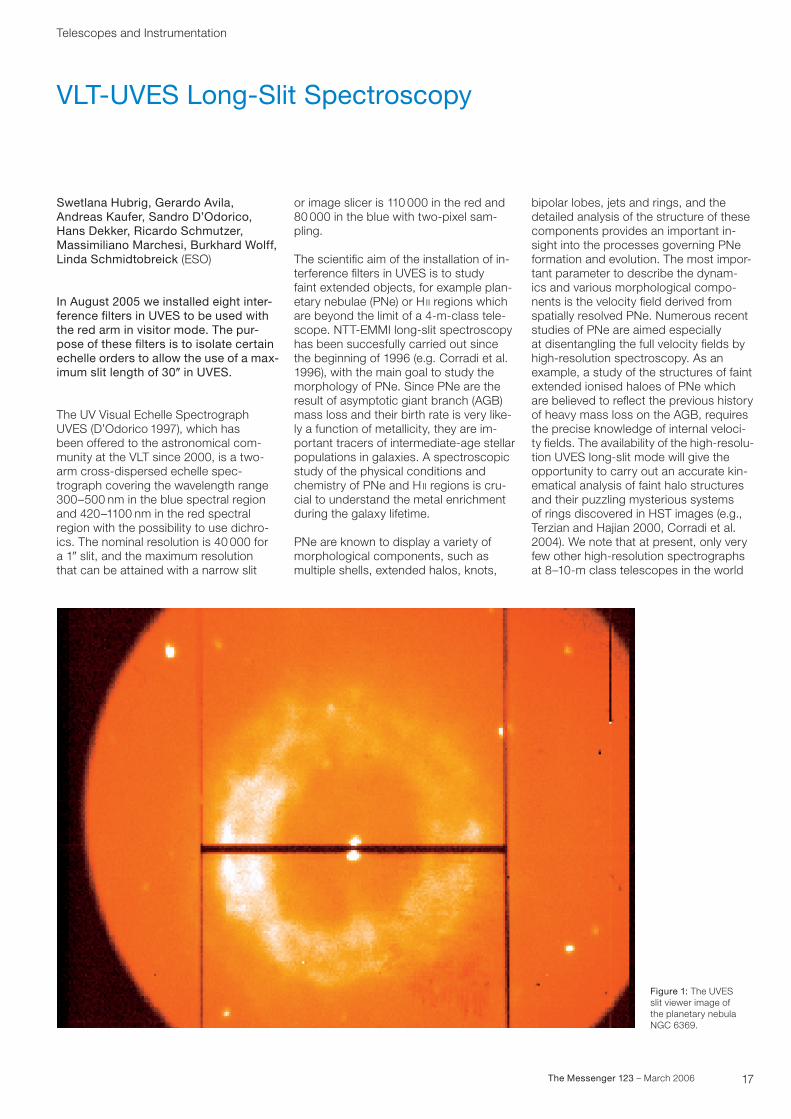
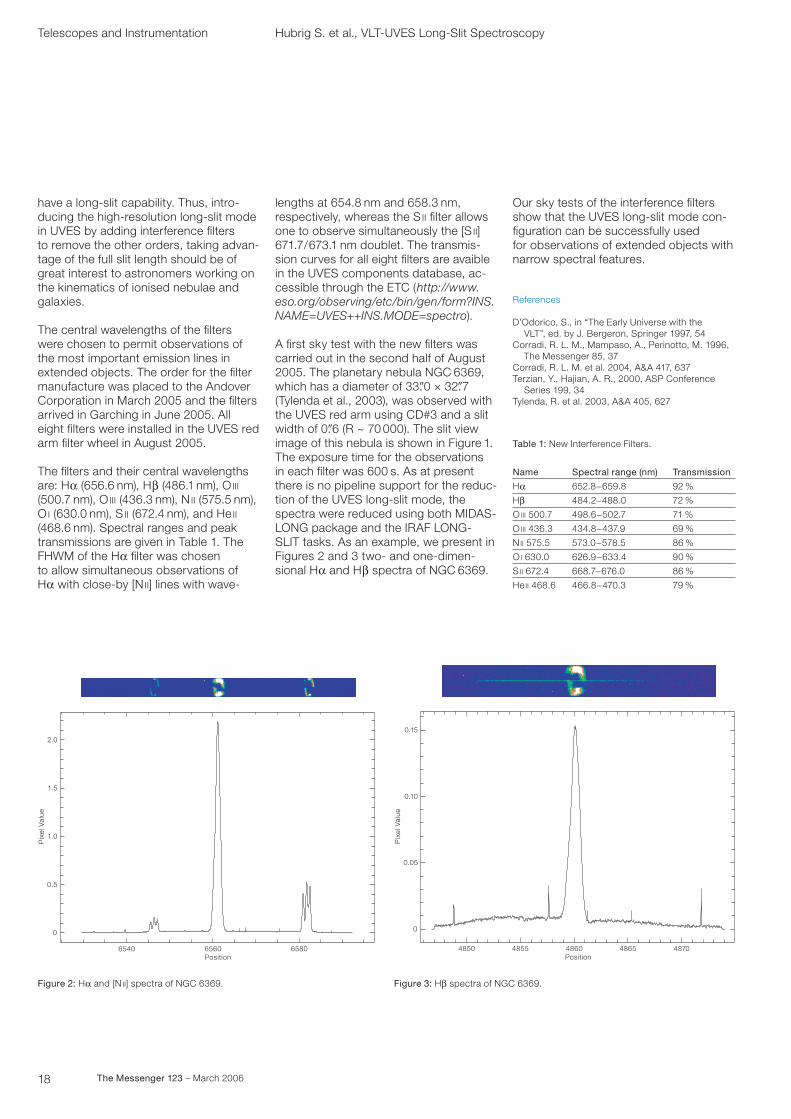
Figure 1: The UVES slit viewer image of the planetary nebula NGC 6�69.
18 The Messenger 123 – March 2006
Hubrig S. et al., VLT-UVES Long-Slit SpectroscopyTelescopes and Instrumentation
658065606540Position
0
0.5
1.5
2.0
Pix
el V
alue
1.0
0.15
0.10
0.05
0
Pix
el V
alue
4850 4855 4860 4865 4870Position
Figure 2: Ha and [N ii] spectra of NGC 6�69. Figure 3: Hb spectra of NGC 6�69.
have a long-slit capability. Thus, intro-ducing the high-resolution long-slit mode in UVES by adding interference filters to remove the other orders, taking advan-tage of the full slit length should be of great interest to astronomers working on the kinematics of ionised nebulae and galaxies.
The central wavelengths of the filters were chosen to permit observations of the most important emission lines in extended objects. The order for the filter manufacture was placed to the Andover Corporation in March 2005 and the filters arrived in Garching in June 2005. All eight filters were installed in the UVES red arm filter wheel in August 2005.
The filters and their central wavelengths are: Ha (656.6 nm), Hb (�86.1 nm), O iii (500.7 nm), O iii (��6.� nm), N ii (575.5 nm), O i (6�0.0 nm), S ii (672.� nm), and He ii (�68.6 nm). Spectral ranges and peak transmissions are given in Table 1. The FHWM of the Ha filter was chosen to allow simultaneous observations of Ha with close-by [N ii] lines with wave-
lengths at 65�.8 nm and 658.� nm, respectively, whereas the S ii filter allows one to observe simultaneously the [S ii] 671.7/67�.1 nm doublet. The transmis-sion curves for all eight filters are avaible in the UVES components database, ac-cessible through the ETC (http://www.eso.org/observing/etc/bin/gen/form?INS.NAME=UVES++INS.MODE=spectro).
A first sky test with the new filters was carried out in the second half of August 2005. The planetary nebula NGC 6�69, which has a diameter of ��.?0 × �2.?7 (Tylenda et al., 200�), was observed with the UVES red arm using CD#� and a slit width of 0.?6 (R ~ 70 000). The slit view image of this nebula is shown in Figure 1. The exposure time for the observations in each filter was 600 s. As at present there is no pipeline support for the reduc-tion of the UVES long-slit mode, the spectra were reduced using both MIDAS-LONG package and the IRAF LONG- SLIT tasks. As an example, we present in Figures 2 and � two- and one-dimen-sional Ha and Hb spectra of NGC 6�69.
Name
HaHbO iii 500.7
O iii ��6.�
N ii 575.5
O i 6�0.0
S ii 672.�
He ii �68.6
Spectral range (nm)
652.8−659.8
�8�.2−�88.0
�98.6−502.7
���.8−��7.9
57�.0−578.5
626.9−6��.�
668.7−676.0
�66.8−�70.�
Transmission
92 %
72 %
71 %
69 %
86 %
90 %
86 %
79 %
Table 1: New Interference Filters.
Our sky tests of the interference filters show that the UVES long-slit mode con-figuration can be successfully used for observations of extended objects with narrow spectral features.
References
D’Odorico, S., in “The Early Universe with the VLT”, ed. by J. Bergeron, Springer 1997, 5�Corradi, R. L. M., Mampaso, A., Perinotto, M. 1996, The Messenger 85, �7Corradi, R. L. M. et al. 200�, A&A �17, 6�7Terzian, Y., Hajian, A. R., 2000, ASP Conference Series 199, ��Tylenda, R. et al. 200�, A&A �05, 627
19The Messenger 123 – March 2006
Telescopes and Instrumentation
ALMA News
Tom Wilson (ESO)
In the last issue of The Messenger, there was an article about the signing at ESO of the European part of the ALMA an-tenna contract. Shortly after this, the con- tract for the antenna transporters was signed. A short description of the trans-porters and the contract is given below.
Antenna transporters
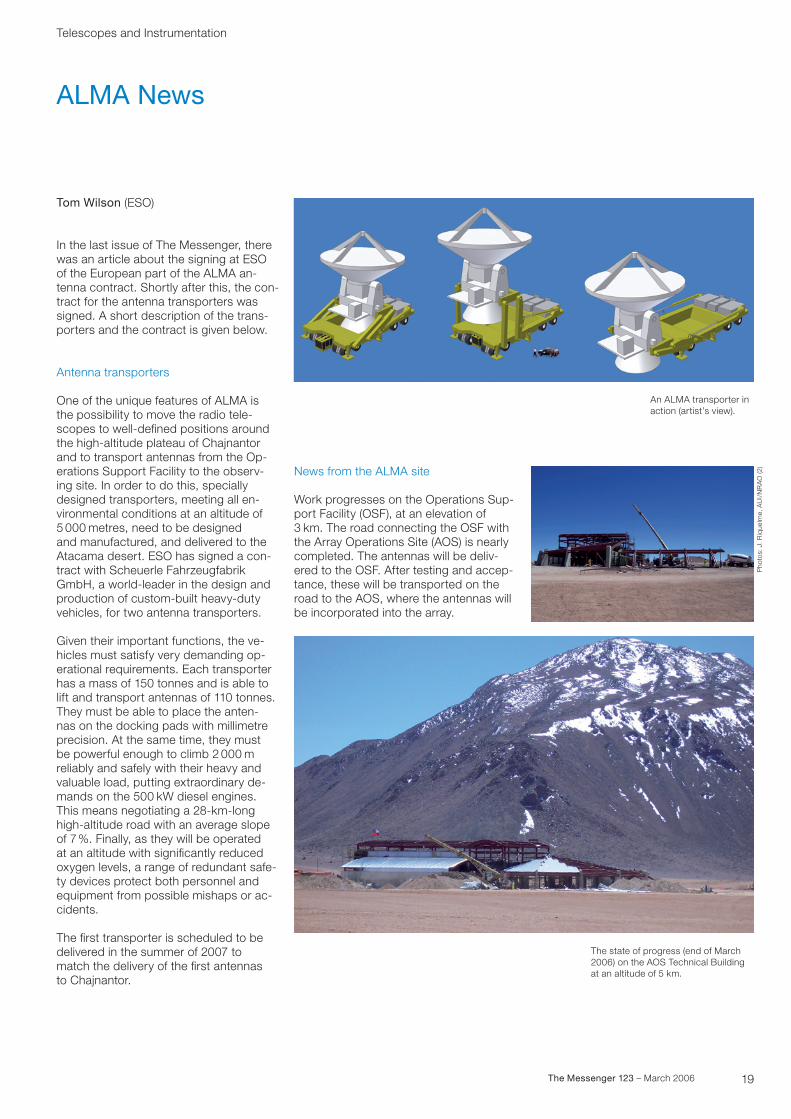
One of the unique features of ALMA is the possibility to move the radio tele-scopes to well-defined positions around the high-altitude plateau of Chajnantor and to transport antennas from the Op-erations Support Facility to the observ- ing site. In order to do this, specially designed transporters, meeting all en-vironmental conditions at an altitude of 5 000 metres, need to be designed and manufactured, and delivered to the Atacama desert. ESO has signed a con- tract with Scheuerle Fahrzeugfabrik GmbH, a world-leader in the design and production of custom-built heavy-duty vehicles, for two antenna transporters.
Given their important functions, the ve- hicles must satisfy very demanding op-erational requirements. Each transporter has a mass of 150 tonnes and is able to lift and transport antennas of 110 tonnes. They must be able to place the anten-nas on the docking pads with millimetre precision. At the same time, they must be powerful enough to climb 2 000 m reliably and safely with their heavy and valuable load, putting extraordinary de-mands on the 500 kW diesel engines. This means negotiating a 28-km-long high-altitude road with an average slope of 7%. Finally, as they will be operated at an altitude with significantly reduced oxygen levels, a range of redundant safe- ty devices protect both personnel and equipment from possible mishaps or ac-cidents.
The first transporter is scheduled to be delivered in the summer of 2007 to match the delivery of the first antennas to Chajnantor.
News from the ALMA site
Work progresses on the Operations Sup- port Facility (OSF), at an elevation of � km. The road connecting the OSF with the Array Operations Site (AOS) is nearly completed. The antennas will be deliv-ered to the OSF. After testing and accep-tance, these will be transported on the road to the AOS, where the antennas will be incorporated into the array.
An ALMA transporter in action (artist’s view).
The state of progress (end of March 2006) on the AOS Technical Building at an altitude of 5 km.
Pho
tos:
J. R
ique
lme,
AU
I/N
RA
O (2
)
20 The Messenger 123 – March 2006
Telescopes and Instrumentation
The ALMA Design Reference Science Plan (DRSP)
Michiel Hogerheijde (Leiden University, the Netherlands)
What is the Design Reference Science Plan?
The ALMA Design Reference Science Plan (DRSP) grew out of the need to have a detailed view of what the first �–� years of full ALMA operations will look like. Based on the projects that astronomers will want to carry out with high priority, ALMA’s development can be optimised. For example, ALMA’s specifications can be tested for realistic scenarios, or plans can be made regarding which configurations or frequency bands to commission with high priority. The DRSP can also be used to determine observing strategies, data rates, and use-cases. Finally, and most crucially, the impact on the science (and ALMA’s primary Science Drivers) from any changes in specifica-tions can be quantitatively assessed.
What the DRSP is not
The DRSP is not a set of observing pro-posals. Although they look like proposals, they will not form the basis of any kind of ALMA programme, and do not imply any claims on particular observations. The DRSP is also not set in stone. Sci-ence priorities will change over time, and
the DRSP is only the current reflection of what the community wants to do with ALMA.
The current DRSP
In total, by December 200� 128 DRSP projects were submitted for a total of ~ 25 000 hours, distributed over four main science areas: Galaxies and Cos-mology (�1 % of time), Star and Planet Formation (�5 %), Stars and their Evo-lution (10 %), and Solar System (1� %). These projects were written by more than 75 astronomers, and ‘peer reviewed’. The results are collated at a web site (see address below).
From the DRSP, one can, for example, learn that the foreseen use of receiver bands (�/6/7/9 = 20 %/�0 %/�7 %/1� %) is roughly consistent with expected weather statistics. While band 6 is heavily used for spectral-line work, bands 7 and 9 are the most requested for conti-nuum observations, especially for extra-galactic targets. Roughly 10 % of the proposals employ the total-power capa-bility of the array.
How to use the DRSP
The DRSP can be accessed at the web site given below. The individual projects can be downloaded together with their review reports. Spreadsheets are also available with overviews of all programme statistics. These have been used, e.g., to get estimates of the calibration require-ments, or to assess the impact of vari-ous re-baselining decisions. The DRSP is a valuable resource for anyone wishing to get a realistic and detailed view of ALMA’s capabilities and foreseen use.
The DRSP is a living document
The DRSP can only be an accurate re- flection of future ALMA use if it is con-tinuously updated. New projects can be added at all times, and existing pro-jects can be augmented as the science questions evolve or instrument specifica-tions change. This evolving aspect of the DRSP is crucial, because planning decisions are based on the DRSP.
The DRSP is being maintained for the ALMA Science IPT by Michiel Hoger-heijde, and suggestions for additional DRSP projects can be e-mailed to him at any time ([email protected] ).
For more information, go to http://www.strw.leidenuniv.nl /~alma/drsp.html
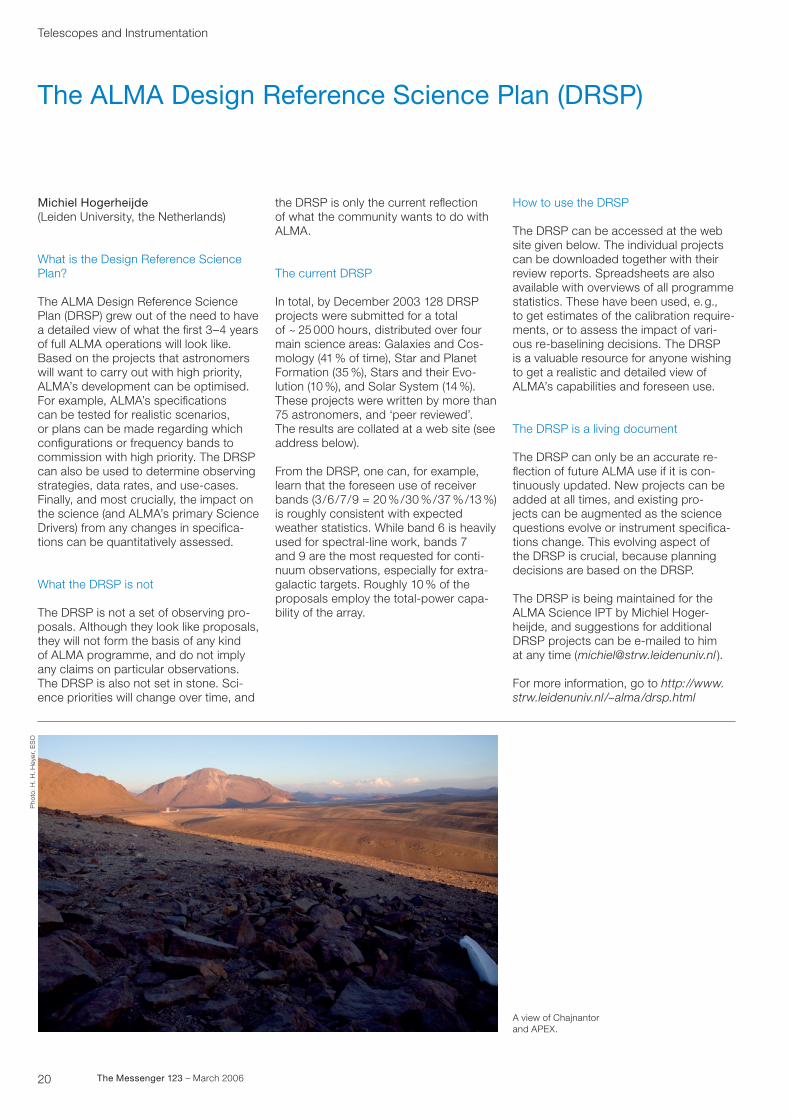
A view of Chajnantor and APEX.
Pho
to: H
. H. H
eyer
, ES
O
21The Messenger 123 – March 2006
Reports from Observers
In Search of Terrestrial Planets in the Habitable Zone of M Dwarfs
Martin Kürster1
Michael Endl 2
Florian Rodler1
1 Max-Planck-Institut für Astronomie, Heidelberg, Germany
2 McDonald Observatory, University of Texas at Austin, USA
After the availability of UVES at the VLT in 2000, we began a survey of M dwarf stars in order to find low-mass plan-etary companions. This ongoing survey, which currently enjoys ESO Large Pro-gramme status, provides a time base- line of up to six years. It is thus capa-ble of finding planets of just a few Earth masses in close-in orbits that corre-spond to the habitable zones around these stars.
Measurements of stellar radial velocities at very high precision (a few ms–1) have so far produced the majority of the dis-coveries of the more than 170 extrasolar planets found during the last ten years. Most of these planets are gas giants comparable to Jupiter, but with increas-ing measurement precision lower-mass planets have become accessible over time. The current record holder among the low-mass planets discovered by RVs (radial velocities) is the third planet in the Gl876 system found by Rivera et al. (2005). The discoverers estimate its most likely mass to be 7.5 M⊕ (Earth masses) with a minimum mass of 6 M⊕. This rec-ord has been rivalled by a very recent an- nouncement of a planet discovered with the microlensing technique (Beaulieu et al. 2006). The most likely mass of this ob-ject is 5.5 M⊕, but this value has a large uncertainty since the mass of the host star is not known.
Reaching this regime of low-mass planets with RV measurements is possible for close-in planets around low-mass stars due to the stronger associated radial- velocity signal. The low-mass planet in the Gl876 system fulfills both require-ments: it is in a short-period orbit with a period of just 1.9 day and it orbits a low-mass star with an estimated mass of 0.�2 MA. This leads to a semi-ampli-tude (half of the peak-to-valley variation)
of the radial-velocity signal of 6.5 ms–1, detectable with state-of-the-art measure-ment precision.
Studying low-mass planets near the limit of current detection thresholds is the goal of our RV search programme for planets around M dwarf stars using the UVES spectrograph at the VLT-UT2 Kueyen. This survey was begun in 2000, when UVES became available, and has recently received ESO Large Programme status for two years, of which the last semester of observations is currently un- derway. Still the amount of allocated observing time permitted only a moder-ate sample size, which we have recently increased from originally 20 stars to �7 stars. We selected our stars for moderate levels of stellar activity which could other-wise complicate the measurements.
Using UVES in the self-calibration mode provided by its iodine gas absorption cell we achieve a routine RV measure-ment precision of about 2.5 ms–1 for the brighter stars (see Figure 1). This cor-responds to spectral displacements of
20 4 6 8 10 12 14 16 18 20 22 >220
5
10
15
N
rms [m/s]mean error [m/s]
Figure 1: Comparison of the observed rms scatter and the mean error of the RV measurements for our �7 pro-gramme stars. In most cases we reach errors in the 2–� ms–1 bin; larger er- rors either correspond to fainter stars with lower signal-to-noise level or indicate (previously unknown) double-lined spectroscopic binaries such as those in the right-most bin that contains all values exceeding 22 ms–1. The rms peaks around 5 ms–1 indicating the presence of vari-ability either by the star itself or due to possible planets; rms values in the > 22 ms–1 bin belong to binaries.
Figure 2: Minimum planet masses m sin i for RV signals with different semi-amplitudes K as a function of orbital period or star-planet sepa- ration a (scale at top). This example is for a star with 0.12 MA, e.g. Proxima Centauri. Circular orbits were as-sumed. The habitable zone is located between the red vertical lines.
20
1 2 3 5 10 20 30 50 1000.2
0.3
0.5
2.0
3.0
5.0
10
0.5Period [day]
1.0m s
in i
[M⊕
]
Hab. Zone
M* = 0.12 M�
K
1 m/s
2 m/s
5 m/s
10 m/s
0.01 0.02 0.03 0.05 0.1 0.2Star-Planet Separation a [AU]
only about 1/500 of a CCD pixel in UVES, or about �0 nm, reliably recorded over several years. UVES therefore provides us with sufficient precision to find planets of a few Earth masses in close-in orbits around M dwarfs or, in the absence of a detectable RV signal, to exclude the pres-ence of such planets. This can be seen from Figure 2 which, for the example of our nearest neighbour, Proxima Centauri, relates the strength of the observable RV signal (its RV semi-amplitude) to the minimum mass of the planet as a function of orbital period or star-planet separation.
Apart from the better chance of finding low-mass planets with RVs, M dwarfs are interesting for two more reasons. First, they are the most numerous type of star – probably more than 70 % of all stars fall into this category. Therefore, any attempt to determine the frequency of planets in the galaxy must include M dwarfs in extrasolar planet searches.A few years ago this was difficult to do with RVs because of the absence of spectrograph/telescope combinations of sufficient efficiency. So early RV surveys
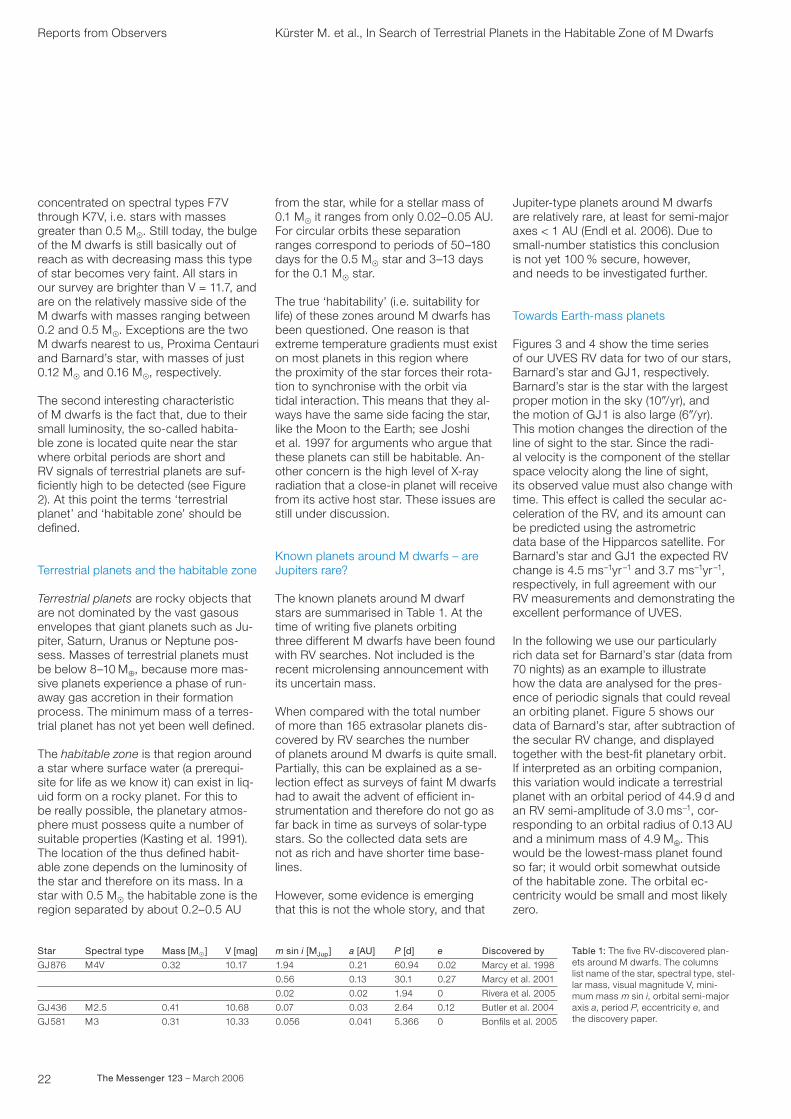
22 The Messenger 123 – March 2006
concentrated on spectral types F7V through K7V, i.e. stars with masses greater than 0.5 MA. Still today, the bulge of the M dwarfs is still basically out of reach as with decreasing mass this type of star becomes very faint. All stars in our survey are brighter than V = 11.7, and are on the relatively massive side of the M dwarfs with masses ranging between 0.2 and 0.5 MA. Exceptions are the two M dwarfs nearest to us, Proxima Centauri and Barnard’s star, with masses of just 0.12 MA and 0.16 MA, respectively.
The second interesting characteristic of M dwarfs is the fact that, due to their small luminosity, the so-called habita- ble zone is located quite near the star where orbital periods are short and RV signals of terrestrial planets are suf- ficiently high to be detected (see Figure 2). At this point the terms ‘terrestrial planet’ and ‘habitable zone’ should be defined.
Terrestrial planets and the habitable zone
Terrestrial planets are rocky objects that are not dominated by the vast gasous envelopes that giant planets such as Ju- piter, Saturn, Uranus or Neptune pos-sess. Masses of terrestrial planets must be below 8–10 M⊕, because more mas- sive planets experience a phase of run-away gas accretion in their formation process. The minimum mass of a terres-trial planet has not yet been well defined. The habitable zone is that region around a star where surface water (a prerequi-site for life as we know it) can exist in liq- uid form on a rocky planet. For this to be really possible, the planetary atmos-phere must possess quite a number of suitable properties (Kasting et al. 1991). The location of the thus defined habit-able zone depends on the luminosity of the star and therefore on its mass. In a star with 0.5 MA the habitable zone is the region separated by about 0.2–0.5 AU
Reports from Observers Kürster M. et al., In Search of Terrestrial Planets in the Habitable Zone of M Dwarfs
from the star, while for a stellar mass of 0.1 MA it ranges from only 0.02–0.05 AU. For circular orbits these separation ranges correspond to periods of 50–180 days for the 0.5 MA star and �–1� days for the 0.1 MA star.
The true ‘habitability’ (i.e. suitability for life) of these zones around M dwarfs has been questioned. One reason is that extreme temperature gradients must exist on most planets in this region where the proximity of the star forces their rota-tion to synchronise with the orbit via tidal interaction. This means that they al- ways have the same side facing the star, like the Moon to the Earth; see Joshi et al. 1997 for arguments who argue that these planets can still be habitable. An-other concern is the high level of X-ray radiation that a close-in planet will receive from its active host star. These issues are still under discussion.
Known planets around M dwarfs – are Jupiters rare?
The known planets around M dwarf stars are summarised in Table 1. At the time of writing five planets orbiting three different M dwarfs have been found with RV searches. Not included is the recent microlensing announcement with its uncertain mass.
When compared with the total number of more than 165 extrasolar planets dis-covered by RV searches the number of planets around M dwarfs is quite small. Partially, this can be explained as a se-lection effect as surveys of faint M dwarfs had to await the advent of efficient in- strumentation and therefore do not go as far back in time as surveys of solar-type stars. So the collected data sets are not as rich and have shorter time base-lines.
However, some evidence is emerging that this is not the whole story, and that
Table 1: The five RV-discovered plan-ets around M dwarfs. The columns list name of the star, spectral type, stel-lar mass, visual magnitude V, mini-mum mass m sin i, orbital semi-major axis a, period P, eccentricity e, and the discovery paper.
Jupiter-type planets around M dwarfs are relatively rare, at least for semi-major axes < 1 AU (Endl et al. 2006). Due to small-number statistics this conclusion is not yet 100 % secure, however, and needs to be investigated further.
Towards Earth-mass planets
Figures � and � show the time series of our UVES RV data for two of our stars, Barnard’s star and GJ1, respectively. Barnard’s star is the star with the largest proper motion in the sky (10?/yr), and the motion of GJ1 is also large (6?/yr). This motion changes the direction of the line of sight to the star. Since the radi- al velocity is the component of the stellar space velocity along the line of sight, its observed value must also change with time. This effect is called the secular ac-celeration of the RV, and its amount can be predicted using the astrometric data base of the Hipparcos satellite. For Barnard’s star and GJ1 the expected RV change is �.5 ms–1yr –1 and �.7 ms–1yr –1, respectively, in full agreement with our RV measurements and demonstrating the excellent performance of UVES.
In the following we use our particularly rich data set for Barnard’s star (data from 70 nights) as an example to illustrate how the data are analysed for the pres-ence of periodic signals that could reveal an orbiting planet. Figure 5 shows our data of Barnard’s star, after subtraction of the secular RV change, and displayed together with the best-fit planetary orbit. If interpreted as an orbiting companion, this variation would indicate a terrestrial planet with an orbital period of ��.9 d and an RV semi-amplitude of �.0 ms–1, cor-responding to an orbital radius of 0.1� AU and a minimum mass of �.9 M⊕. This would be the lowest-mass planet found so far; it would orbit somewhat outside of the habitable zone. The orbital ec-centricity would be small and most likely zero.
Star
GJ876
GJ��6
GJ581
Spectral type
M�V
M2.5
M�
Mass [MA]
0.�2
0.�1
0.�1
V [mag]
10.17
10.68
10.��
m sin i [MJup]
1.9�
0.56
0.02
0.07
0.056
a [AU]
0.21
0.1�
0.02
0.0�
0.0�1
P [d]
60.9�
�0.1
1.9�
2.6�
5.�66
e
0.02
0.27
0
0.12
0
Discovered by
Marcy et al. 1998
Marcy et al. 2001
Rivera et al. 2005
Butler et al. 200�
Bonfils et al. 2005
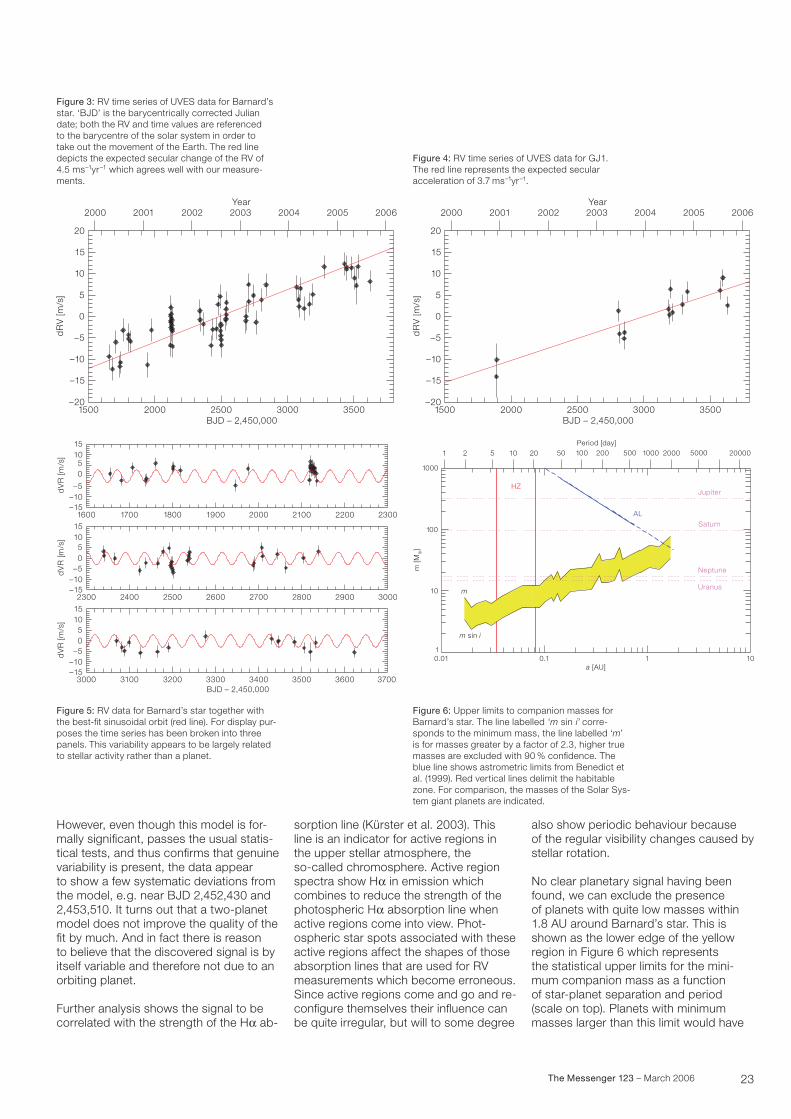
2�The Messenger 123 – March 2006
However, even though this model is for-mally significant, passes the usual statis-tical tests, and thus confirms that genuine variability is present, the data appear to show a few systematic deviations from the model, e.g. near BJD 2,�52,��0 and 2,�5�,510. It turns out that a two-planet model does not improve the quality of the fit by much. And in fact there is reason to believe that the discovered signal is by itself variable and therefore not due to an orbiting planet.
Further analysis shows the signal to be correlated with the strength of the Ha ab-
sorption line (Kürster et al. 200�). This line is an indicator for active regions in the upper stellar atmosphere, the so-called chromosphere. Active region spectra show Ha in emission which combines to reduce the strength of the photospheric Ha absorption line when active regions come into view. Phot-ospheric star spots associated with these active regions affect the shapes of those absorption lines that are used for RV measurements which become erroneous. Since active regions come and go and re-configure themselves their influence can be quite irregular, but will to some degree
also show periodic behaviour because of the regular visibility changes caused by stellar rotation.
No clear planetary signal having been found, we can exclude the presence of planets with quite low masses within 1.8 AU around Barnard’s star. This is shown as the lower edge of the yellow region in Figure 6 which represents the statistical upper limits for the mini-mum companion mass as a function of star-planet separation and period (scale on top). Planets with minimum masses larger than this limit would have
Figure 3: RV time series of UVES data for Barnard’s star. ‘BJD’ is the barycentrically corrected Julian date; both the RV and time values are referenced to the barycentre of the solar system in order to take out the movement of the Earth. The red line depicts the expected secular change of the RV of �.5 ms–1yr–1 which agrees well with our measure-ments.
Figure 4: RV time series of UVES data for GJ1. The red line represents the expected secular acceleration of �.7 ms–1yr–1.
Figure 5: RV data for Barnard’s star together with the best-fit sinusoidal orbit (red line). For display pur- poses the time series has been broken into three panels. This variability appears to be largely related to stellar activity rather than a planet.
Figure 6: Upper limits to companion masses for Barnard’s star. The line labelled ‘m sin i’ corre-sponds to the minimum mass, the line labelled ‘m’ is for masses greater by a factor of 2.�, higher true masses are excluded with 90 % confidence. The blue line shows astrometric limits from Benedict et al. (1999). Red vertical lines delimit the habitable zone. For comparison, the masses of the Solar Sys-tem giant planets are indicated.
3500300025001500 2000BJD – 2,450,000
2000 2001 2002 2003 2004 2005 2006Year
–20
–15
–10
–5
0
5
10
15
20
dR
V [m
/s]
3500300025001500 2000BJD – 2,450,000
2000 2001 2002 2003 2004 2005 2006Year
–20
–15
–10
–5
0
5
10
15
20
dR
V [m
/s]
3700 36003000 3100 3200 3300 3400 3500BJD – 2,450,000
dV
R [m
/s]
2300 2400 2500 2600 2700 2800 2900 3000
1600 1700 1800 1900 2000 2100 2200 2300
–15–10–5
05
1015
dV
R [m
/s]
–15–10–505
1015
dV
R [m
/s]
–15–10–5
05
1015
5 10 20 50 100 200 500 1000 2000 5000 200001 2
1010.10.01a [AU]
1
10
100
1000
m [M
⊕]
Period [day]
HZ
AL
m
m sin i
Jupiter
Saturn
Neptune
Uranus
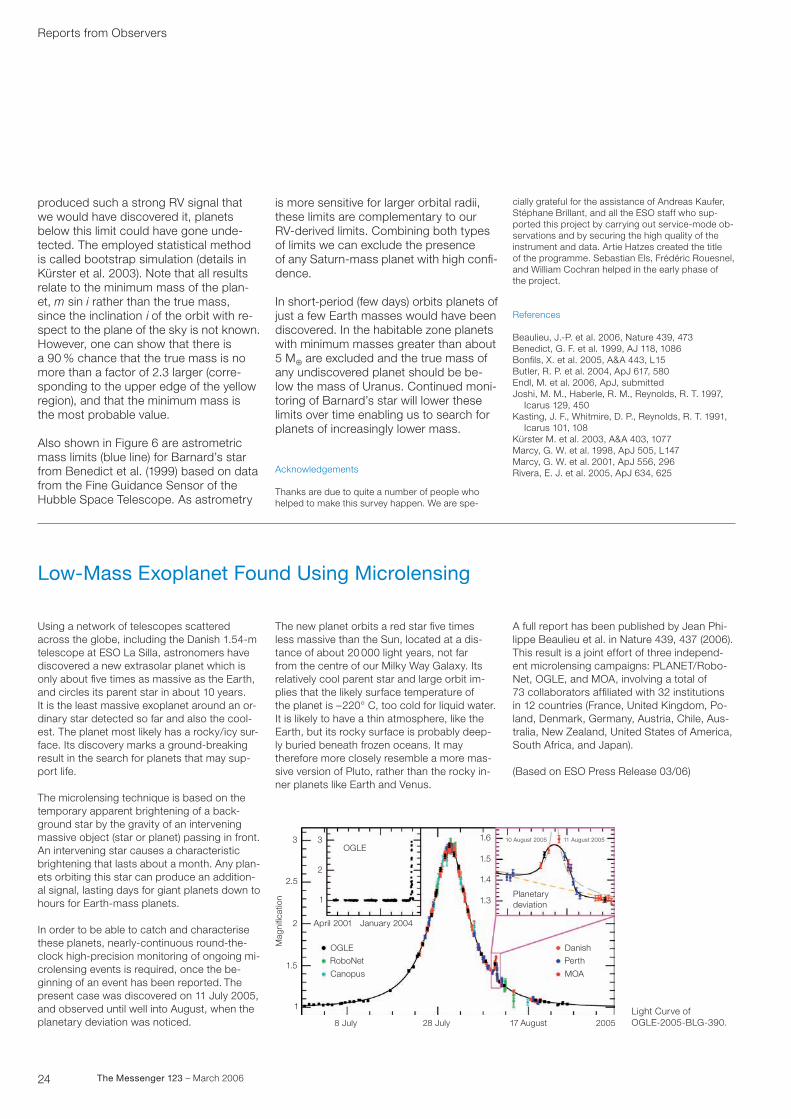
2� The Messenger 123 – March 2006
produced such a strong RV signal that we would have discovered it, planets below this limit could have gone unde-tected. The employed statistical method is called bootstrap simulation (details in Kürster et al. 200�). Note that all results relate to the minimum mass of the plan-et, m sin i rather than the true mass, since the inclination i of the orbit with re- spect to the plane of the sky is not known. However, one can show that there is a 90 % chance that the true mass is no more than a factor of 2.� larger (corre-sponding to the upper edge of the yellow region), and that the minimum mass is the most probable value.
Also shown in Figure 6 are astrometric mass limits (blue line) for Barnard’s star from Benedict et al. (1999) based on data from the Fine Guidance Sensor of the Hubble Space Telescope. As astrometry
is more sensitive for larger orbital radii, these limits are complementary to our RV-derived limits. Combining both types of limits we can exclude the presence of any Saturn-mass planet with high confi-dence.
In short-period (few days) orbits planets of just a few Earth masses would have been discovered. In the habitable zone planets with minimum masses greater than about 5 M⊕ are excluded and the true mass of any undiscovered planet should be be- low the mass of Uranus. Continued moni-toring of Barnard’s star will lower these limits over time enabling us to search for planets of increasingly lower mass.
Acknowledgements
Thanks are due to quite a number of people who helped to make this survey happen. We are spe-
cially grateful for the assistance of Andreas Kaufer, Stéphane Brillant, and all the ESO staff who sup-ported this project by carrying out service-mode ob- servations and by securing the high quality of the instrument and data. Artie Hatzes created the title of the programme. Sebastian Els, Frédéric Rouesnel, and William Cochran helped in the early phase of the project.
References
Beaulieu, J.-P. et al. 2006, Nature ��9, �7�Benedict, G. F. et al. 1999, AJ 118, 1086Bonfils, X. et al. 2005, A&A ���, L15Butler, R. P. et al. 200�, ApJ 617, 580Endl, M. et al. 2006, ApJ, submittedJoshi, M. M., Haberle, R. M., Reynolds, R. T. 1997, Icarus 129, �50Kasting, J. F., Whitmire, D. P., Reynolds, R. T. 1991, Icarus 101, 108Kürster M. et al. 200�, A&A �0�, 1077Marcy, G. W. et al. 1998, ApJ 505, L1�7Marcy, G. W. et al. 2001, ApJ 556, 296Rivera, E. J. et al. 2005, ApJ 6��, 625
Reports from Observers
Low-Mass Exoplanet Found Using Microlensing
Using a network of telescopes scattered across the globe, including the Danish 1.5�-m telescope at ESO La Silla, astronomers have discovered a new extrasolar planet which is only about five times as massive as the Earth, and circles its parent star in about 10 years. It is the least massive exoplanet around an or-dinary star detected so far and also the cool-est. The planet most likely has a rocky/icy sur- face. Its discovery marks a ground-breaking result in the search for planets that may sup-port life.
The microlensing technique is based on the temporary apparent brightening of a back-ground star by the gravity of an intervening massive object (star or planet) passing in front. An intervening star causes a characteristic brightening that lasts about a month. Any plan-ets orbiting this star can produce an addition-al signal, lasting days for giant planets down to hours for Earth-mass planets.
In order to be able to catch and characterise these planets, nearly-continuous round-the-clock high-precision monitoring of ongoing mi- crolensing events is required, once the be-ginning of an event has been reported. The present case was discovered on 11 July 2005, and observed until well into August, when the planetary deviation was noticed.
The new planet orbits a red star five times less massive than the Sun, located at a dis- tance of about 20 000 light years, not far from the centre of our Milky Way Galaxy. Its relatively cool parent star and large orbit im-plies that the likely surface temperature of the planet is –220° C, too cold for liquid water. It is likely to have a thin atmosphere, like the Earth, but its rocky surface is probably deep- ly buried beneath frozen oceans. It may therefore more closely resemble a more mas-sive version of Pluto, rather than the rocky in- ner planets like Earth and Venus.
Light Curve of OGLE-2005-BLG-�90.
A full report has been published by Jean Phi-lippe Beaulieu et al. in Nature ��9, ��7 (2006). This result is a joint effort of three independ- ent microlensing campaigns: PLANET/Robo-Net, OGLE, and MOA, involving a total of 7� collaborators affiliated with �2 institutions in 12 countries (France, United Kingdom, Po-land, Denmark, Germany, Austria, Chile, Aus-tralia, New Zealand, United States of America, South Africa, and Japan).
(Based on ESO Press Release 0�/06)
8 July
1
1
1.5
1.3
1.4
1.5
1.6
2.52
2
33
April 2001 January 2004
Planetarydeviation
OGLE
OGLE
RoboNet
Canopus
Mag
nific
atio
n
Danish
Perth
MOA
28 July 17 August
10 August 2005 11 August 2005
2005
25The Messenger 123 – March 2006
Reports from Observers
Direct Imaging of Sub-Stellar Companions around Young Stars – Special Case: GQ Lup A + b
Ralph Neuhäuser1
Markus Mugrauer1
Eike Guenther 2
1 Astrophysical Institute and University Observatory (AIU), Jena, Germany
2 Thüringer Landessternwarte (TLS), Tautenburg, Germany
In several years of direct imaging searches of sub-stellar companions around young nearby stars, first with plain and speckle imaging, now with Adaptive Optics (AO), we have found several brown dwarf companions – and most recently also an object with a mass estimate well below 13 Ju- piter masses, so that it is probably a giant planet imaged directly, GQ Lup b. We were able to confirm all these com-panion candidates by common prop- er motion and spectroscopy showing a cool spectral type of late-M or early-L. They are only a few million years old and allow us to study the formation of planets and brown dwarfs observa-tionally.
Objects below the hydrogen-burning mass limit of ~ 0.078 MA are called sub-stellar objects, which include brown dwarfs and planets. The definitions of brown dwarfs and planets and their distinction are still under dispute. Can the mass ranges of those two types of sub-stellar objects overlap? May only objects orbiting normal stars be called planets? The working definition of the IAU for planets accepts objects below the deuterium-burning mass limit of ~ 1� Jupiter masses orbiting around normal stars.
The formation mechanism of sub-stellar objects is also not yet clear. Do brown dwarfs form just like stars, or always as companions to normal stars, so that all free-floating, isolated brown dwarfs are ejected stellar embryos? Do planets form fast by direct gravitational collapse in a massive circumstellar disc or by a slow build-up of a solid core? Such questions can be studied observationally, just by observing young sub-stellar objects, in particular as companions to young stars. E.g., the youngest star found to be or-
bited by a planet gives the lower limit for the planet formation timescale. Migra- tion of planets in a circumstellar disc can also be studied by comparing young plan-etary systems with old ones.
However, imaging detection of sub-stellar companions is difficult due to the prob-lem of dynamic range: Sub-stellar ob- jects are too faint and too close to much brighter stars. After a brief phase of deu-terium burning, a few million years only, brown dwarfs cool down and fade away. Planets also get fainter as they age.
In 199�, it became clear that young sub-stellar objects are hotter and brighter than old sub-stellar objects by several or- ders of magnitude: young sub-stellar objects, still contracting and possibly even accreting, gain gravitational energy and become self-luminous in the infra- red (Burrows et al. 199�). The magnitude difference between a sub-stellar com-panion of a given mass and its stellar pri- mary gets worse as they age, because the stellar primary will reach stable hy-drogen burning, i.e. constant luminosity, while the sub-stellar companion gets fainter. Hence, direct imaging of sub-stel-lar companions should be less difficult around young stars.
For a direct imaging detection of a faint companion next to a bright star, one al-so needs high angular resolution, i.e. nearby young stars. Without AO, we set our distance limit to roughly 70 to 100 pc. However, around the mid-1990s, basi-cally no pre-main-sequence stars were known within 100 pc. All the well-known star-forming regions like Taurus, Lupus, Corona Australis, Chamaeleon are at roughly 1�0 pc. Hence, the first step should be a search for stars which are both young and nearby. That is what we did in the 1990s with optical follow-up observations of unidentified ROSAT X-ray sources, using mostly the B&C spec-trograph at the ESO 1.5-m telescope, and Caspec at the �.6-m for high-resolution spectra of good candidates (Neuhäuser 1997).
In the course of this survey, many new pre-main sequence stars were found, both within and around the star forming clouds. If some of them are tens of de-grees, i.e. tens of pc, off the clouds, then
they should partly be tens of pc closer than the clouds, but no parallaxes were available. Towards the end of the 1990s, newly available Hipparcos data gave the distances of many of those and pre- viously known young stars, showing that some of them were indeed located within 100 pc (Neuhäuser and Brandner 1998), e.g. TW Hya and the stars of the group now called TW Hya Association (TWA) and many more. Hence, we could now start our direct imaging survey, namely deep, high angular resolution im-ages of pre-main-sequence stars within 100 pc. For the southern sky, we used the MPE speckle camera SHARP at the ESO �.5-m NTT.
Sub-stellar companions show up as faint objects close to the primary target star. Faint dots next to bright stars are not always companions, they are mostly background. However, they can all be regared as companion candidates. To confirm such a candidate as a real com-panion, one has to check for common proper motion and take a spectrum of the companion, which should be as cool as expected from the magnitude difference between primary and companion candi-dates, given the age and distance of the target. Given the known proper motion of the primary stars, the pixel scale of the detector used, and the actual astromet-ric precision achieved (primary some-times saturated or in the non-linear re-gime, companion very faint with low S/N), one has to wait one to a few years before second-epoch images can be taken.
Once common proper motion is shown and the spectral type and, hence, tem-perature of the companion is determined, one can place primary and companion together in the H-R diagram to check whether they appear to be coeval, and to measure the mass of the companion from theoretical evolutionary tracks. Here, it becomes clear whether we are deal- ing with a low-mass stellar companion or, e.g., a brown dwarf.
Since brown dwarfs are both brighter than planets and may also be at larger separations, we first found a few brown dwarfs: Within our project, we found and/or confirmed three brown dwarfs as companions to young nearby stars with-in 100 pc by both common proper motion

26 The Messenger 123 – March 2006
and spectroscopy (Figure 1). These were the first three brown dwarfs found and confirmed as companions to young stars.
With the advent of NACO, i.e. AO at the VLT, we (and other groups) were able to extend the sample of young stars to those in the nearby star forming re- gions at 1�0 pc including Lupus, and al-so reobserve those within 100 pc in- cluding TWA and other associations. We could now hope for both closer and fainter companions, i.e. giant planets.
About one year ago, we announced the detection of a sub-stellar companion to GQ Lup (Neuhäuser et al. 2005), which could well be a planet imaged directly. The direct evidence presented included the common proper motion (high sig-nificance after five year epoch difference), a cool spectral type (M9–L�), and ap- parently low gravity (log g = 2 to �), how-ever from a low-resolution NACO spec-trum only. Given the location in the H-R diagram, the companion to GQ Lup could have a mass of � to �2 Jupiter masses according to calculations from the Tucson and Lyon groups (Neuhäuser et al. 2005), which do not take into account the for-mation of the objects, so that they are not valid in the first few million years, but only a few Jupiter masses according to more recent formation models (Wuchterl 2005).
Figure 2 shows our deepest image of GQ Lup so far, after shift-and-add of three NACO observations from June
Reports from Observers Neuhäuser R. et al., Direct Imaging of Sub-Stellar Companions around Young Stars
Figure 1: These three images show the three brown dwarf companions found so far by us around young near-by stars: HR 7�29 B (left, VLT/ISAAC), TWA-5 B (middle, VLT/FORS1), and GSC 80�7 B (right, NTT/Sharp). They show common proper motion with their primary star and a cool spectral type of M7-9, so that they have 15 to �0 Jupiter masses.
200� to August 2005. The dynamic range obtained is then shown in Figure �. We can exclude all other companions outside of 0.2 arcsec (28 AU at 1�0 pc) with at least the mass of GQ Lup b.
Our NACO K-band spectrum of GQ Lup b shows a spectral type of M9 to L�, consistently obtained from comparison to standards and from spectral indices. Note in particular the water-steam absorp-tion band in the blue part (Figure �) of both GQ Lup b and the L2 dwarf, which is not present in the M8 brown dwarf, which is hotter. The spectral slope was corrected with both the GQ Lup prima- ry (in the same slit) and a telluric standard (Neuhäuser et al. 2005).
From the K-band magnitude (~ 1�.1 mag), the flux observed at ~ 1�0 pc (distance towards the Lupus clouds), and the best- fit temperature of ~ 2 000 K, we obtain a radius of one to two Jupiter radii. With the gravity log g = 2 to �, this results in ~ 0.5 to 6 Jupiter masses (Neuhäuser et al. 2005), so that GQ Lup b may very well be an object with mass below the deute-rium-burning limit (1� Jupiter masses), i.e. a planet. Our mass determinations are model-dependent, not yet from orbital dynamics.
The companion to GQ Lup is younger in age and later in spectral type than the previously found brown dwarf compan-ions to young stars, so that GQ Lup b is lower in mass. GQ Lup b is also cooler than the two components of the eclips-ing double-lined spectroscopic brown dwarf – brown dwarf binary found in Orion (Stassun et al. 2005), and at about the same age, so that GQ Lup is lower in mass than those two brown dwarfs (Guenther 2006), which are �0-Jupiter-mass objects determined dynamically (Stassun et al. 2005).
Figure 2: Deep, high S/N, high angu-lar resolution VLT/NACO image of GQ Lup A (bright star in the centre) and b (0.7 arc sec west of it) after shift-and-add of three deep observa-tions of ~ 20 to �0 min each (June 200�, May and August 2005). The FWHM is 68 mas, the field size shown is 2.2 arcsec × 2.2 arcsec, east is left, north is up.
Comparing the images obtained over the last few years, including the new observations from 2005, shows that the separation remains constant, no orbital motion is detected so far. Orbital motion would be detectable as a slight devia- tion from a constant separation (or posi-tion angle), but within about ± 5 mas/yr, the expected maximal orbital motion. We would have to wait at least until the de-tection of curvature in the orbit before we could determine the mass dynamically. This may take tens to hundreds of years.
GQ Lup b has a projected separation of ~ 100 AU (7�2 milliarcsec at 1�0 pc), which is three times further out than the outermost gaseous planet in the solar system. It could have formed further inwards, but got onto an highly eccentric orbit by a close encounter with anoth-er protoplanet (Debes and Sigurdsson 2006) or another star. For the time being, its formation remains unclear.
By now, we and other groups have ob-served roughly 100 young nearby stars, and two planet candidates were found, GQ Lupi b and 2M1207 b in the TWA group (Chauvin et al. 2005). For the latter case, it is not yet shown that the re- maining motion between the two compo-nents is significantly smaller than the ex- pected escape velocity for the com-panion, given the smaller epoch differ-ence and/or the small total mass. In the case of GQ Lup A + b, this has been shown: The remaining motion seen be-
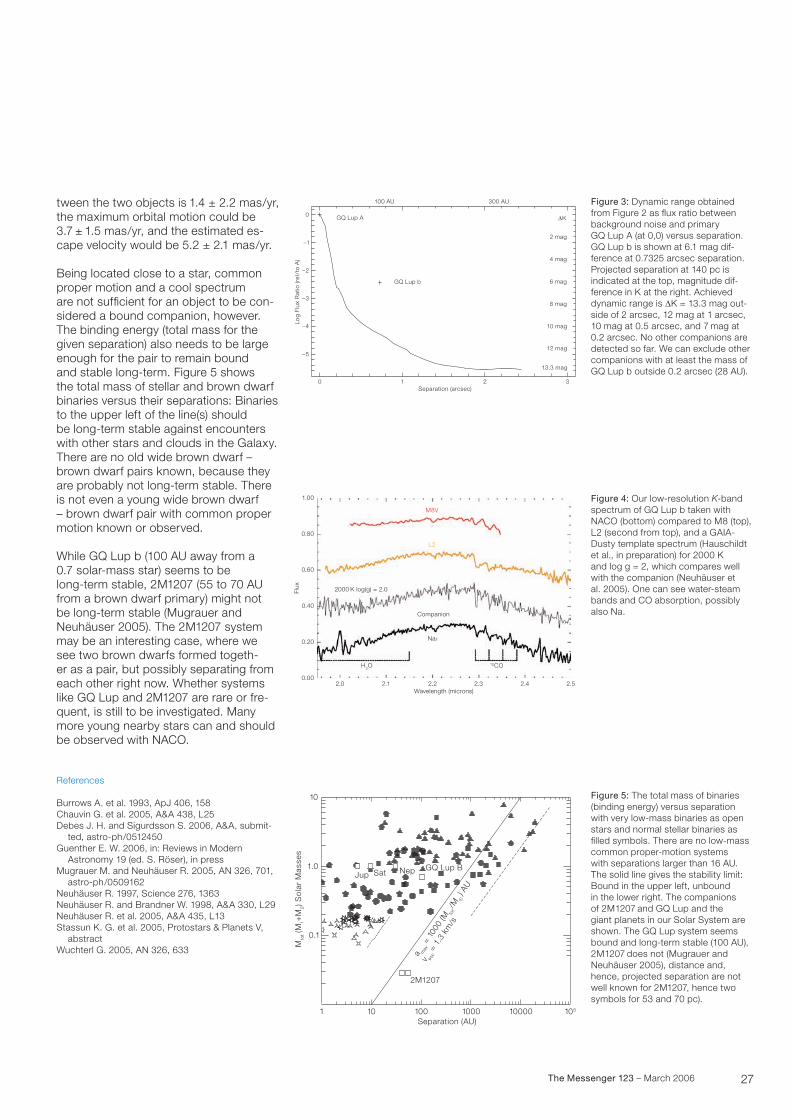
27The Messenger 123 – March 2006
tween the two objects is 1.� ± 2.2 mas/yr, the maximum orbital motion could be �.7 ± 1.5 mas/yr, and the estimated es-cape velocity would be 5.2 ± 2.1 mas/yr.
Being located close to a star, common proper motion and a cool spectrum are not sufficient for an object to be con-sidered a bound companion, however. The binding energy (total mass for the given separation) also needs to be large enough for the pair to remain bound and stable long-term. Figure 5 shows the total mass of stellar and brown dwarf binaries versus their separations: Binaries to the upper left of the line(s) should be long-term stable against encounters with other stars and clouds in the Galaxy. There are no old wide brown dwarf – brown dwarf pairs known, because they are probably not long-term stable. There is not even a young wide brown dwarf – brown dwarf pair with common proper motion known or observed.
While GQ Lup b (100 AU away from a 0.7 solar-mass star) seems to be long-term stable, 2M1207 (55 to 70 AU from a brown dwarf primary) might not be long-term stable (Mugrauer and Neuhäuser 2005). The 2M1207 system may be an interesting case, where we see two brown dwarfs formed togeth- er as a pair, but possibly separating from each other right now. Whether systems like GQ Lup and 2M1207 are rare or fre- quent, is still to be investigated. Many more young nearby stars can and should be observed with NACO.
References
Burrows A. et al. 199�, ApJ �06, 158Chauvin G. et al. 2005, A&A ��8, L25Debes J. H. and Sigurdsson S. 2006, A&A, submit- ted, astro-ph/0512�50Guenther E. W. 2006, in: Reviews in Modern Astronomy 19 (ed. S. Röser), in pressMugrauer M. and Neuhäuser R. 2005, AN �26, 701, astro-ph/0509162Neuhäuser R. 1997, Science 276, 1�6�Neuhäuser R. and Brandner W. 1998, A&A ��0, L29Neuhäuser R. et al. 2005, A&A ��5, L1�Stassun K. G. et al. 2005, Protostars & Planets V, abstractWuchterl G. 2005, AN �26, 6��
Figure 4: Our low-resolution K-band spectrum of GQ Lup b taken with NACO (bottom) compared to M8 (top), L2 (second from top), and a GAIA-Dusty template spectrum (Hauschildt et al., in preparation) for 2000 K and log g = 2, which compares well with the companion (Neuhäuser et al. 2005). One can see water-steam bands and CO absorption, possibly also Na.
Figure 3: Dynamic range obtained from Figure 2 as flux ratio between background noise and primary GQ Lup A (at 0,0) versus separation. GQ Lup b is shown at 6.1 mag dif-ference at 0.7�25 arcsec separation. Projected separation at 1�0 pc is indicated at the top, magnitude dif-ference in K at the right. Achieved dynamic range is ΔK = 1�.� mag out-side of 2 arcsec, 12 mag at 1 arcsec, 10 mag at 0.5 arcsec, and 7 mag at 0.2 arcsec. No other companions are detected so far. We can exclude other companions with at least the mass of GQ Lup b outside 0.2 arcsec (28 AU).
Figure 5: The total mass of binaries (binding energy) versus separation with very low-mass binaries as open stars and normal stellar binaries as filled symbols. There are no low-mass common proper-motion systems with separations larger than 16 AU. The solid line gives the stability limit: Bound in the upper left, unbound in the lower right. The companions of 2M1207 and GQ Lup and the giant planets in our Solar System are shown. The GQ Lup system seems bound and long-term stable (100 AU), 2M1207 does not (Mugrauer and Neuhäuser 2005), distance and, hence, projected separation are not well known for 2M1207, hence two symbols for 5� and 70 pc).
2.2 2.3 2.4 2.52.12.00.00
0.20
0.40
0.60
0.80
1.00
Flux
Wavelength (microns)
M8V
L2
Companion
2000 K log(g) = 2.0
Na I
H2O12CO
2M1207
1 10 100 1000 10000 105
Separation (AU)
10
1.0
0.1
Mto
t (M
1+M
2) S
ola
r M
asse
s
Jup Sat Nep GQ Lup B
a max
= 1
000
(Mto
t/M
� )
AU
v esc
= 1.
3 km
/s
0 321
100 AU 300 AU
GQ Lup A
Separation (arcsec)
Log
Flux
Rat
io (r
el/t
o A
)
–5
–4
–3
–2
–1
0 ∆K
2 mag
4 mag
6 mag
8 mag
10 mag
12 mag
13.3 mag
GQ Lup b
28 The Messenger 123 – March 2006
Reports from Observers
The Formation and Early Evolution of Massive Stars
Thomas Henning1
Markus Feldt1
Hendrik Linz1
Elena Puga Antolín2
Bringfried Stecklum�
1 Max-Planck-Institut für Astronomie, Heidelberg, Germany
2 Instituut voor Sterrenkunde Leuven, Belgium
� Thüringer Landessternwarte Tauten-burg, Germany
The enormous influence exerted by massive stars on their environment can affect the evolution of entire galaxies. It manifests itself most strongly during their formation in molecular clouds and their deaths as supernovae. We give examples for current observational results that shed light on the formation of these fascinating objects. We ex-amine how this knowledge has been achieved and how it can be extended with the help of the latest observational methods.
The birth and death of high-mass stars play a major role in shaping the mor- phological, dynamical, and chemical structure of many galaxies. How dramatic the effects of the formation of massive stars can be is best seen in starburst gal-axies, whose structure is entirely deter-mined by the almost explosive formation of OB stars. From which mass upwards is a star called massive? The lower mass limit can be set quite well to be 8–10 MA. Only stars at least that massive are capa-ble of producing enough UV photons to ionise the surrounding gas and to form H ii regions, to create supersonic winds, and finally to explode as supernovae. Moreover, it is known that the accretion phase is longer than the contraction period for stars exceeding roughly 8 MA. Thus, newly forming massive stars are still deeply embedded in their parental molecular cloud. Therefore, no optically visible massive pre-main-sequence stars are observed. This is in strong con-trast to the low- and intermediate-mass pre-main-sequence stars – the so-called TTauri and Herbig-Ae/Be stars. It is ob-vious that especially this fact has a large impact on observational strategies; to
overcome the large extinction one has to go to longer wavelengths, mainly the near- and thermal infrared. For the ear-liest phases even this is not sufficient, and new knowledge has to be extracted from far-infrared and (sub-)millimetre ob-servations.
The formation of massive stars repre-sents one of the major astrophysical problems which is still unsolved despite the crucial role these stars play in the evolution of galaxies (see the proceed-ings of the recent IAU Symposium 227, Cesaroni et al. 2005). The single key question is how these stars manage to accumulate that much matter during their birth process. Even during the main accretion phase, they already exhibit very high luminosities. This is a severe prob-lem since the immense radiation pressure on dust grains counteracts the accretion, and the growing ionisation further pushes the gas to expand. It is not clear wheth-er spherical accretion on the one hand can compete against the strong radiation, and on the other hand can cope with the vastly growing ionising flux of the form-ing star in order to quench an H ii region for many dynamical times. The forma- tion of massive stars by spherically sym-metric mass infall therefore seems rather unlikely.
However, if the material is accumulated from a circumstellar disc the problem may disappear. The reason is that due to the presence of a disc, a highly an-isotropic radiation field is produced, with different energy flows parallel and perpen-dicular to the disc’s axis. First evidence for such accretion discs was thought to be found in the bipolar morphologies of the ionised regions around some well- known massive young stars or by the existence of very energetic and massive molecular outflows. We now have ac-cumulating evidence that at least early B and late O stars (up to probably 20 MA) form via disc-accretion processes similar to their low-mass counterparts. The char- acterisation of massive accretion discs is often considered as the missing link in the understanding of massive star forma-tion.
An alternative theory to explain the for-mation of massive stars is based on the merging of lower-mass stars. The ‘coa-
lescence’ scenario implies that tidal fric-tion in close binary systems and dense clusters ‘melt’ a number of lower-mass stars into one high-mass star. In its origi-nally proposed form, this scenario im- plied a broken mass distribution function in the cluster (due to missing lower-mass stars that already underwent merging), which is not observed in ‘normal’ clusters. The concept of coalescence may still play a role in very dense clusters especially in starburst regions, but observational in- dications such as the omnipresent out-flows and even more collimated jets can-not be easily explained in this scenario and thus are in favour of a more conven-tional accretion scenario for more typical galactic environments.
A related issue is the question of what the observational characteristics of the ear-liest stages of massive stars are. Do they always form in clusters? What is the ini-tial mass function (IMF) in these clusters? How important is competitive accretion? When do the outflows start? What are the spectral properties of the very young massive stars? Answers to these ques-tions can only be obtained by disentan-gling the complex structure of massive star-forming regions, using near-infrared adaptive optics and long-baseline infra-red interferometry, sensitive thermal in- frared observations, and interferometry at millimetre and radio wavelengths. In this article, we will give examples of such observations and concentrate on re- cent results where ESO instrumentation has provided important contributions.
The early stages of evolution
The earliest stage of star formation is the collapse and fragmentation of a molecu-lar cloud to (a) protostellar object(s). These objects are rather cold and usually not detected at near- or mid-infrared wavelengths. The search for massive and cold (pre-)protostellar cores only recently led to the detection of the first good can-didates.
The best tool to find such cold and mas- sive molecular cloud cores is an un-biased, large survey at far-infrared and sub-millimetre wavelengths. With more than 15 % sky coverage, the Isophot 170 µm Serendipity Survey (IsoSS) is cur-
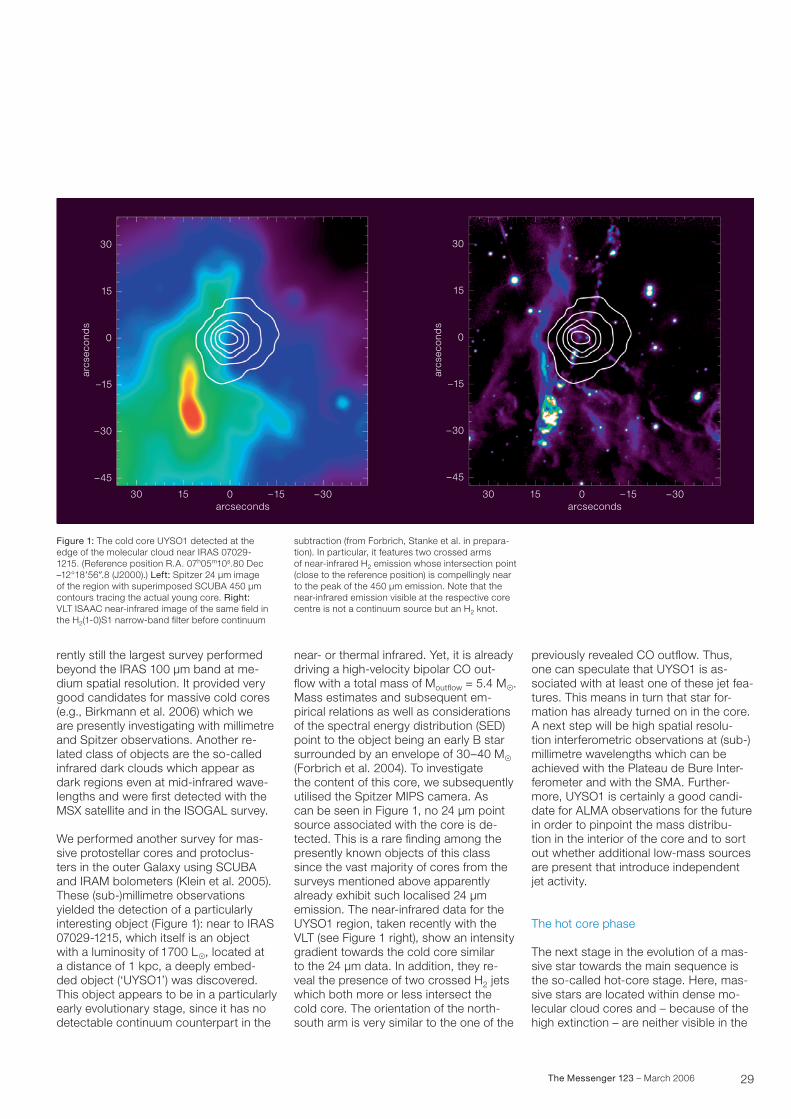
29The Messenger 123 – March 2006
rently still the largest survey performed beyond the IRAS 100 µm band at me-dium spatial resolution. It provided very good candidates for massive cold cores (e.g., Birkmann et al. 2006) which we are presently investigating with millimetre and Spitzer observations. Another re- lated class of objects are the so-called infrared dark clouds which appear as dark regions even at mid-infrared wave-lengths and were first detected with the MSX satellite and in the ISOGAL survey.
We performed another survey for mas-sive protostellar cores and protoclus- ters in the outer Galaxy using SCUBA and IRAM bolometers (Klein et al. 2005). These (sub-)millimetre observations yielded the detection of a particularly interesting object (Figure 1): near to IRAs 07029-1215, which itself is an object with a luminosity of 1700 LA, located at a distance of 1 kpc, a deeply embed- ded object (‘UYSO1’) was discovered. This object appears to be in a particularly early evolutionary stage, since it has no detectable continuum counterpart in the
near- or thermal infrared. Yet, it is already driving a high-velocity bipolar CO out- flow with a total mass of Moutflow = 5.� MA. Mass estimates and subsequent em- pirical relations as well as considerations of the spectral energy distribution (SED) point to the object being an early B star surrounded by an envelope of �0–�0 MA (Forbrich et al. 200�). To investigate the content of this core, we subsequently utilised the Spitzer MIPS camera. As can be seen in Figure 1, no 2� µm point source associated with the core is de-tected. This is a rare finding among the presently known objects of this class since the vast majority of cores from the surveys mentioned above apparently already exhibit such localised 2� µm emission. The near-infrared data for the UYSO1 region, taken recently with the VLT (see Figure 1 right), show an intensity gradient towards the cold core similar to the 2� µm data. In addition, they re- veal the presence of two crossed H2 jets which both more or less intersect the cold core. The orientation of the north-south arm is very similar to the one of the
Figure 1: The cold core UYSO1 detected at the edge of the molecular cloud near IRAS 07029-1215. (Reference position R.A. 07h05m10s.80 Dec –12°18;56?.8 (J2000).) Left: Spitzer 2� µm image of the region with superimposed SCUBA �50 µm contours tracing the actual young core. Right: VLT ISAAC near-infrared image of the same field in the H2(1-0)S1 narrow-band filter before continuum
subtraction (from Forbrich, Stanke et al. in prepara-tion). In particular, it features two crossed arms of near-infrared H2 emission whose intersection point (close to the reference position) is compellingly near to the peak of the �50 µm emission. Note that the near-infrared emission visible at the respective core centre is not a continuum source but an H2 knot.
previously revealed CO outflow. Thus, one can speculate that UYSO1 is as- sociated with at least one of these jet fea- tures. This means in turn that star for- mation has already turned on in the core. A next step will be high spatial resolu- tion interferometric observations at (sub-) millimetre wavelengths which can be achieved with the Plateau de Bure Inter-ferometer and with the SMA. Further-more, UYSO1 is certainly a good candi-date for ALMA observations for the future in order to pinpoint the mass distribu- tion in the interior of the core and to sort out whether additional low-mass sources are present that introduce independent jet activity.
The hot core phase
The next stage in the evolution of a mas-sive star towards the main sequence is the so-called hot-core stage. Here, mas-sive stars are located within dense mo- lecular cloud cores and – because of the high extinction – are neither visible in the
30 15 0 –15 –30
–45
–30
–15
0
15
30
arcs
eco
nds
arcseconds30 15 0 –15 –30
–45
–30
–15
0
15
30
arcs
eco
nds
arcseconds
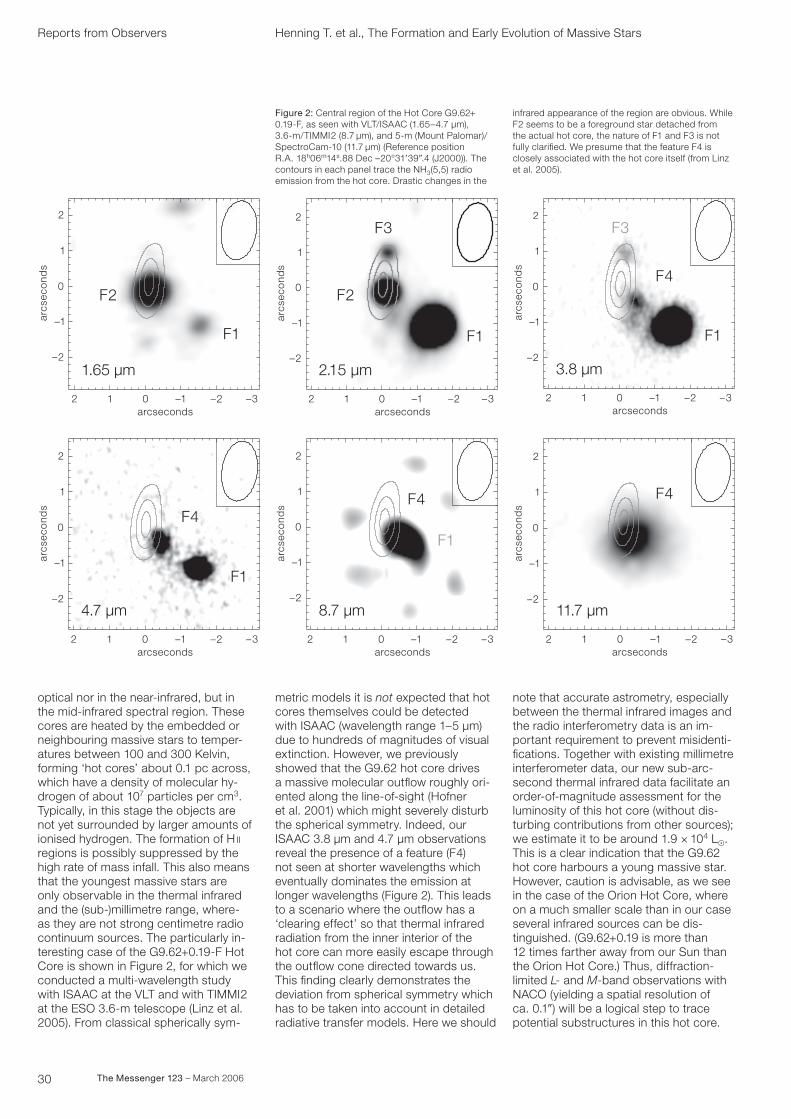
�0 The Messenger 123 – March 2006
optical nor in the near-infrared, but in the mid-infrared spectral region. These cores are heated by the embedded or neighbouring massive stars to temper-atures between 100 and �00 Kelvin, forming ‘hot cores’ about 0.1 pc across, which have a density of molecular hy-drogen of about 107 particles per cm�. Typically, in this stage the objects are not yet surrounded by larger amounts of ionised hydrogen. The formation of H ii regions is possibly suppressed by the high rate of mass infall. This also means that the youngest massive stars are only observable in the thermal infrared and the (sub-)millimetre range, where- as they are not strong centimetre radio continuum sources. The particularly in- teresting case of the G9.62+0.19-F Hot Core is shown in Figure 2, for which we conducted a multi-wavelength study with ISAAC at the VLT and with TIMMI2 at the ESO �.6-m telescope (Linz et al. 2005). From classical spherically sym-
Reports from Observers Henning T. et al., The Formation and Early Evolution of Massive Stars
2
1
0
–1
–2
2 1 0 –1 –2 –3
arcs
eco
nds
1.65 µm
F1
F2
arcseconds
Figure 2: Central region of the Hot Core G9.62+ 0.19-F, as seen with VLT/ISAAC (1.65–�.7 µm), �.6-m/TIMMI2 (8.7 µm), and 5-m (Mount Palomar)/SpectroCam-10 (11.7 µm) (Reference position R.A. 18h06m1�s.88 Dec –20°�1;�9?.� (J2000)). The contours in each panel trace the NH�(5,5) radio emission from the hot core. Drastic changes in the
infrared appearance of the region are obvious. While F2 seems to be a foreground star detached from the actual hot core, the nature of F1 and F� is not fully clarified. We presume that the feature F� is closely associated with the hot core itself (from Linz et al. 2005).
metric models it is not expected that hot cores themselves could be detected with ISAAC (wavelength range 1–5 µm) due to hundreds of magnitudes of visual extinction. However, we previously showed that the G9.62 hot core drives a massive molecular outflow roughly ori-ented along the line-of-sight (Hofner et al. 2001) which might severely disturb the spherical symmetry. Indeed, our ISAAC �.8 µm and �.7 µm observations reveal the presence of a feature (F�) not seen at shorter wavelengths which eventually dominates the emission at longer wavelengths (Figure 2). This leads to a scenario where the outflow has a ‘clearing effect’ so that thermal infrared radiation from the inner interior of the hot core can more easily escape through the outflow cone directed towards us. This finding clearly demonstrates the deviation from spherical symmetry which has to be taken into account in detailed radiative transfer models. Here we should
note that accurate astrometry, especially between the thermal infrared images and the radio interferometry data is an im-portant requirement to prevent misidenti-fications. Together with existing millimetre interferometer data, our new sub-arc-second thermal infrared data facilitate an order-of-magnitude assessment for the luminosity of this hot core (without dis-turbing contributions from other sources); we estimate it to be around 1.9 × 10� LA. This is a clear indication that the G9.62 hot core harbours a young massive star. However, caution is advisable, as we see in the case of the Orion Hot Core, where on a much smaller scale than in our case several infrared sources can be dis- tinguished. (G9.62+0.19 is more than 12 times farther away from our Sun than the Orion Hot Core.) Thus, diffraction-limited L- and M-band observations with NACO (yielding a spatial resolution of ca. 0.1?) will be a logical step to trace potential substructures in this hot core.
2
1
0
–1
–2
2 1 0 –1 –2 –3
arcs
eco
nds
2.15 µm
F1
F2
F3
arcseconds
2
1
0
–1
–2
2 1 0 –1 –2 –3
arcs
eco
nds
3.8 µm
F1
F4
F3
arcseconds
2
1
0
–1
–2
2 1 0 –1 –2 –3
arcs
eco
nds
4.7 µm
F1
F4
arcseconds
2
1
0
–1
–2
2 1 0 –1 –2 –3
arcs
eco
nds
11.7 µm
F4
arcseconds
2
1
0
–1
–2
2 1 0 –1 –2 –3
arcs
eco
nds
8.7 µm
F1
F4
arcseconds
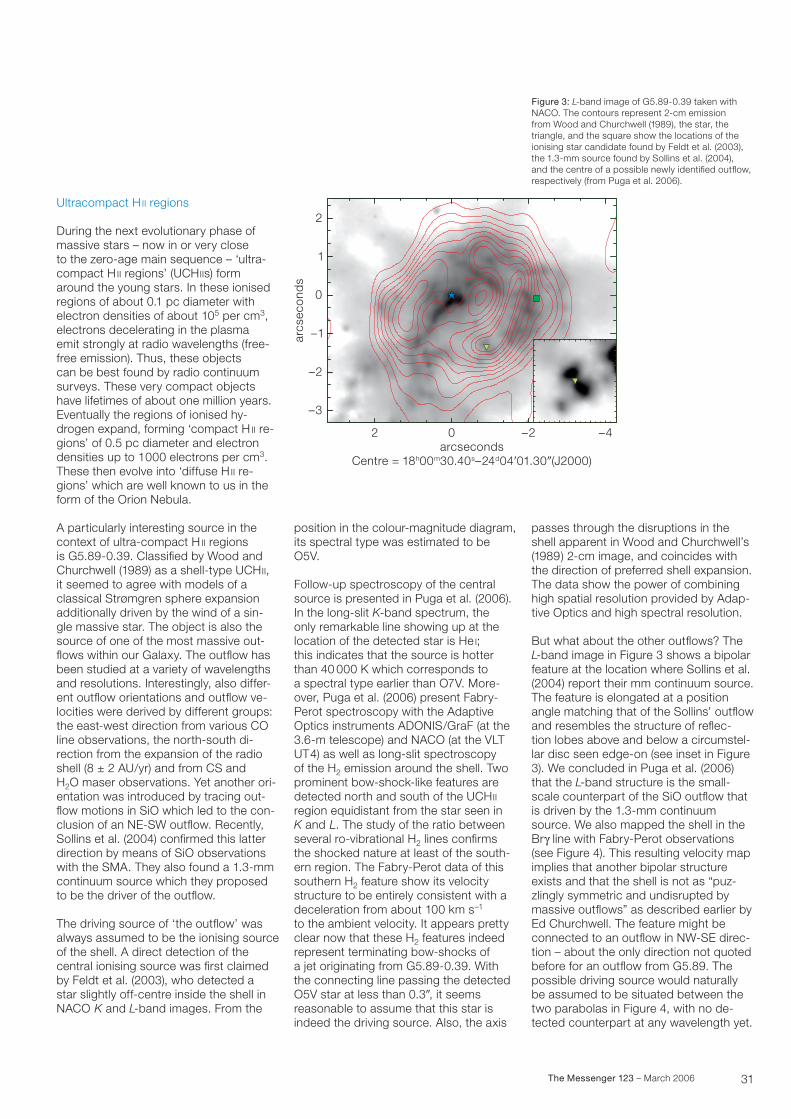
�1The Messenger 123 – March 2006
Ultracompact H ii regions
During the next evolutionary phase of massive stars – now in or very close to the zero-age main sequence – ‘ultra-compact H ii regions’ (UCH iis) form around the young stars. In these ionised regions of about 0.1 pc diameter with electron densities of about 105 per cm�, electrons decelerating in the plasma emit strongly at radio wavelengths (free-free emission). Thus, these objects can be best found by radio continuum surveys. These very compact objects have lifetimes of about one million years. Eventually the regions of ionised hy-drogen expand, forming ‘compact H ii re- gions’ of 0.5 pc diameter and electron densities up to 1000 electrons per cm�. These then evolve into ‘diffuse H ii re-gions’ which are well known to us in the form of the Orion Nebula.
A particularly interesting source in the context of ultra-compact H ii regions is G5.89-0.�9. Classified by Wood and Churchwell (1989) as a shell-type UCH ii, it seemed to agree with models of a classical Strømgren sphere expansion additionally driven by the wind of a sin-gle massive star. The object is also the source of one of the most massive out-flows within our Galaxy. The outflow has been studied at a variety of wavelengths and resolutions. Interestingly, also differ-ent outflow orientations and outflow ve-locities were derived by different groups: the east-west direction from various CO line observations, the north-south di- rection from the expansion of the radio shell (8 ± 2 AU/yr) and from CS and H2O maser observations. Yet another ori-entation was introduced by tracing out-flow motions in SiO which led to the con-clusion of an NE-SW outflow. Recently, Sollins et al. (200�) confirmed this latter direction by means of SiO observations with the SMA. They also found a 1.�-mm continuum source which they proposed to be the driver of the outflow.
The driving source of ‘the outflow’ was always assumed to be the ionising source of the shell. A direct detection of the central ionising source was first claimed by Feldt et al. (200�), who detected a star slightly off-centre inside the shell in NACO K and L-band images. From the
Figure 3: L-band image of G5.89-0.�9 taken with NACO. The contours represent 2-cm emission from Wood and Churchwell (1989), the star, the triangle, and the square show the locations of the ionising star candidate found by Feldt et al. (200�), the 1.�-mm source found by Sollins et al. (200�), and the centre of a possible newly identified outflow, respectively (from Puga et al. 2006).
position in the colour-magnitude diagram, its spectral type was estimated to be O5V.
Follow-up spectroscopy of the central source is presented in Puga et al. (2006). In the long-slit K-band spectrum, the only remarkable line showing up at the location of the detected star is He i; this indicates that the source is hotter than �0 000 K which corresponds to a spectral type earlier than O7V. More-over, Puga et al. (2006) present Fabry-Perot spectroscopy with the Adaptive Optics instruments ADONIS/GraF (at the �.6-m telescope) and NACO (at the VLT UT�) as well as long-slit spectroscopy of the H2 emission around the shell. Two prominent bow-shock-like features are detected north and south of the UCH ii region equidistant from the star seen in K and L. The study of the ratio between several ro-vibrational H2 lines confirms the shocked nature at least of the south-ern region. The Fabry-Perot data of this southern H2 feature show its velocity structure to be entirely consistent with a deceleration from about 100 km s–1 to the ambient velocity. It appears pretty clear now that these H2 features indeed represent terminating bow-shocks of a jet originating from G5.89-0.�9. With the connecting line passing the detected O5V star at less than 0.�?, it seems reasonable to assume that this star is indeed the driving source. Also, the axis
passes through the disruptions in the shell apparent in Wood and Churchwell’s (1989) 2-cm image, and coincides with the direction of preferred shell expansion. The data show the power of combining high spatial resolution provided by Adap-tive Optics and high spectral resolution.
But what about the other outflows? The L-band image in Figure � shows a bipolar feature at the location where Sollins et al. (200�) report their mm continuum source. The feature is elongated at a position angle matching that of the Sollins’ outflow and resembles the structure of reflec- tion lobes above and below a circumstel-lar disc seen edge-on (see inset in Figure �). We concluded in Puga et al. (2006) that the L-band structure is the small-scale counterpart of the SiO outflow that is driven by the 1.�-mm continuum source. We also mapped the shell in the Brg line with Fabry-Perot observations (see Figure �). This resulting velocity map implies that another bipolar structure exists and that the shell is not as “puz-zlingly symmetric and undisrupted by massive outflows” as described earlier by Ed Churchwell. The feature might be connected to an outflow in NW-SE direc-tion – about the only direction not quoted before for an outflow from G5.89. The possible driving source would naturally be assumed to be situated between the two parabolas in Figure �, with no de-tected counterpart at any wavelength yet.
2 0 –2 –4arcseconds
Centre = 18h00m30.40s–24d04�01.30�(J2000)
–3
–1
0
1
2
arcs
econ
ds
–2
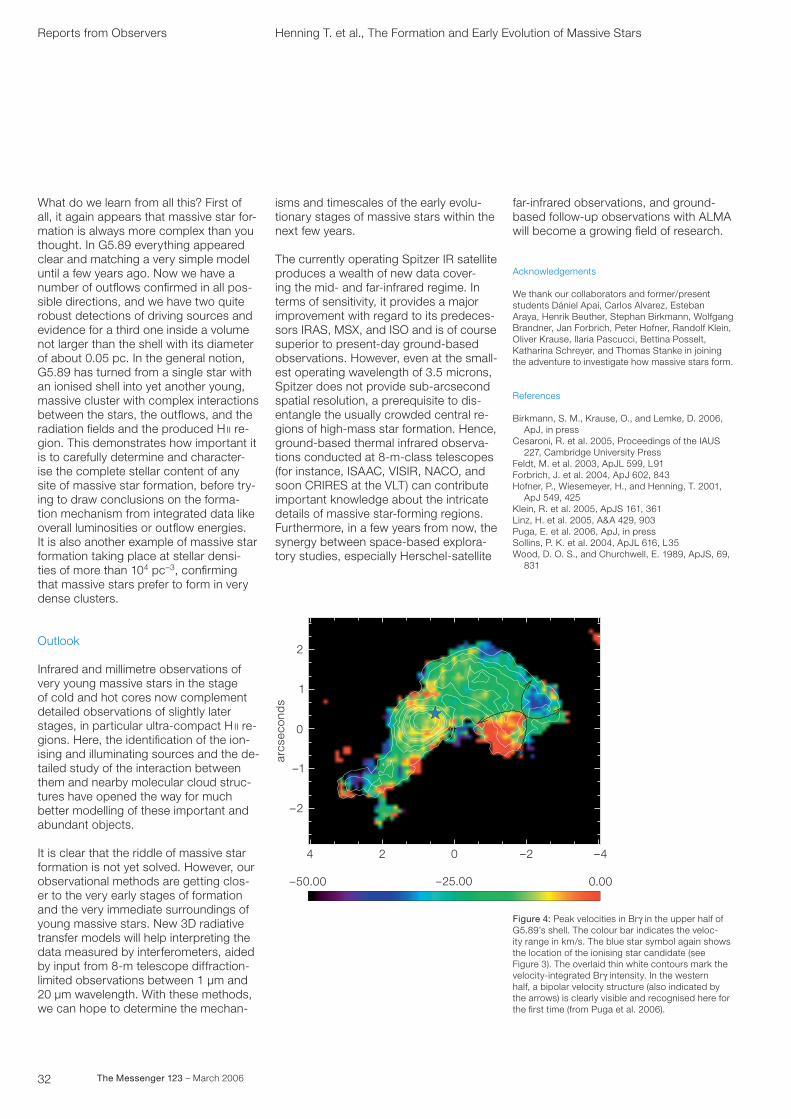
�2 The Messenger 123 – March 2006
What do we learn from all this? First of all, it again appears that massive star for-mation is always more complex than you thought. In G5.89 everything appeared clear and matching a very simple model until a few years ago. Now we have a number of outflows confirmed in all pos-sible directions, and we have two quite robust detections of driving sources and evidence for a third one inside a volume not larger than the shell with its diameter of about 0.05 pc. In the general notion, G5.89 has turned from a single star with an ionised shell into yet another young, massive cluster with complex interactions between the stars, the outflows, and the radiation fields and the produced H ii re-gion. This demonstrates how important it is to carefully determine and character- ise the complete stellar content of any site of massive star formation, before try- ing to draw conclusions on the forma- tion mechanism from integrated data like overall luminosities or outflow energies. It is also another example of massive star formation taking place at stellar densi-ties of more than 10� pc–�, confirming that massive stars prefer to form in very dense clusters.
Outlook
Infrared and millimetre observations of very young massive stars in the stage of cold and hot cores now complement detailed observations of slightly later stages, in particular ultra-compact H ii re- gions. Here, the identification of the ion-ising and illuminating sources and the de- tailed study of the interaction between them and nearby molecular cloud struc-tures have opened the way for much better modelling of these important and abundant objects.
It is clear that the riddle of massive star formation is not yet solved. However, our observational methods are getting clos-er to the very early stages of formation and the very immediate surroundings of young massive stars. New �D radiative transfer models will help interpreting the data measured by interferometers, aided by input from 8-m telescope diffraction-limited observations between 1 µm and 20 µm wavelength. With these methods, we can hope to determine the mechan-
isms and timescales of the early evolu-tionary stages of massive stars within the next few years.
The currently operating Spitzer IR satellite produces a wealth of new data cover-ing the mid- and far-infrared regime. In terms of sensitivity, it provides a major improvement with regard to its predeces-sors IRAS, MSX, and ISO and is of course superior to present-day ground-based observations. However, even at the small-est operating wavelength of �.5 microns, Spitzer does not provide sub-arcsecond spatial resolution, a prerequisite to dis- entangle the usually crowded central re- gions of high-mass star formation. Hence, ground-based thermal infrared observa-tions conducted at 8-m-class telescopes (for instance, ISAAC, VISIR, NACO, and soon CRIRES at the VLT) can contribute important knowledge about the intricate details of massive star-forming regions. Furthermore, in a few years from now, the synergy between space-based explora-tory studies, especially Herschel-satellite
4 2 0 –2 –4
–50.00 0.00–25.00
2
1
0
–1
–2
arcs
eco
nds
Figure 4: Peak velocities in Brg in the upper half of G5.89’s shell. The colour bar indicates the veloc- ity range in km/s. The blue star symbol again shows the location of the ionising star candidate (see Figure �). The overlaid thin white contours mark the velocity-integrated Brg intensity. In the western half, a bipolar velocity structure (also indicated by the arrows) is clearly visible and recognised here for the first time (from Puga et al. 2006).
far-infrared observations, and ground-based follow-up observations with ALMA will become a growing field of research.
Acknowledgements
We thank our collaborators and former/present students Dániel Apai, Carlos Alvarez, Esteban Araya, Henrik Beuther, Stephan Birkmann, Wolfgang Brandner, Jan Forbrich, Peter Hofner, Randolf Klein, Oliver Krause, Ilaria Pascucci, Bettina Posselt, Katharina Schreyer, and Thomas Stanke in joining the adventure to investigate how massive stars form.
References
Birkmann, S. M., Krause, O., and Lemke, D. 2006, ApJ, in pressCesaroni, R. et al. 2005, Proceedings of the IAUS 227, Cambridge University Press Feldt, M. et al. 200�, ApJL 599, L91Forbrich, J. et al. 200�, ApJ 602, 8��Hofner, P., Wiesemeyer, H., and Henning, T. 2001, ApJ 5�9, �25Klein, R. et al. 2005, ApJS 161, �61Linz, H. et al. 2005, A&A �29, 90�Puga, E. et al. 2006, ApJ, in pressSollins, P. K. et al. 200�, ApJL 616, L�5Wood, D. O. S., and Churchwell, E. 1989, ApJS, 69, 8�1
Reports from Observers Henning T. et al., The Formation and Early Evolution of Massive Stars
��The Messenger 123 – March 2006
Reports from Observers
The Dwarf galaxy Abundances and Radial-velocities Team (DART) Large Programme – A Close Look at Nearby GalaxiesEline Tolstoy1
Vanessa Hill2
Mike Irwin�
Amina Helmi1
Giuseppina Battaglia1
Bruno Letarte1
Kim Venn�
Pascale Jablonka5,6
Matthew Shetrone7
Nobuo Arimoto8
Tom Abel9
Francesca Primas10
Andreas Kaufer10
Thomas Szeifert10
Patrick Francois2
Kozo Sadakane11
1 Kapteyn Institute, University of Gronin-gen, the Netherlands
2 Observatoire de Paris, France� Institute of Astronomy, University of
Cambridge, United Kingdom� Department of Physics and Astronomy,
University of Victoria, Canada5 Observatoire de Genève, Laboratoire
d’Astrophysique, Ecole Polytechnique Fédérale de Lausanne, Switzerland
6 on leave from Observatoire de Paris, France
7 University of Texas, McDonald Observ-atory, Fort Davis, Texas, USA
8 National Astronomical Observatory, Tokyo, Japan
9 KIPAC, Stanford University, Menlo Park, California, USA
10 ESO11 Astronomical Institute, Osaka Kyoiku
University, Japan
We review the progress of ESO/WFI Im-aging and VLT/FLAMES spectroscopy of large numbers of individual stars in nearby dwarf spheroidal galaxies by the Dwarf galaxy Abundances and Radial-velocities Team (DART). These observa-tions have allowed us to show that neither the kinematics nor the abundan-ces nor the spatial distributions are easy to explain in a straightforward manner for these smallest galaxies. The main result is that dwarf galaxies show com-plex and highly specific evolutionary and metal-enrichment processes, espe-cially at ancient times. This conclusively proves that these small galaxies are not the building blocks of the larger gal-axies in the Local Group.
The dwarf galaxies we have studied are the lowest-luminosity (and mass) galax-ies that have ever been found. It is likely that these low-mass dwarfs are the most common type of galaxy in the Universe, but because of their extremely low surface brightness our ability to detect them diminishes rapidly with increasing distance. The only place where we can be reasonably sure to detect a large frac- tion of these objects is in the Local Group, and even here, ‘complete sam-ples’ are added to each year. Within 250 kpc of our Galaxy there are nine low- mass galaxies (seven observable from the southern hemisphere), including Sag-ittarius which is in the process of merging with our Galaxy. We will show that only the closest galaxies can be observed in detail, even with an 8-m telescope.
The lowest-mass galaxies are dwarf irreg- ular (dI) and dwarf spheroidal (dSph) type galaxies. The only difference between these low-mass dSphs and dIs seems to be the presence of gas and current star formation in dIs. It has already been not- ed that dSphs predominantly lie close to our Galaxy (< 250 kpc away), and dIs predominantly further away (> �00 kpc away). This suggests that the proximity of dSph to our Galaxy played a role in the removal of gas from these systems. How- ever, the range of properties found in dSph and dI galaxies does not allow a straightforward explanation, particular- ly not the large variations in star-formation histories and chemical-evolution paths that have now been observed in different systems (e.g., Dolphin et al. 2005).
It is perhaps not a surprise that there is apparently a lower limit to the mass of an object which is able to form more than one generation of stars, which is related to the limit below which one supernova will completely destroy a galaxy. Numeri-cal and analytic models tell us that this must be around a few × 106 MA. Globular clusters typically have much lower masses than this limit.
Observations
VLT/FLAMES with fibre-feeds to the Gi-raffe and UVES spectrographs has made a revolution possible in spectroscopic studies of resolved stellar populations in
nearby galaxies. The modes of operation, the sensitivity and the field of view are an almost perfect match to requirements for the study of Galactic dSph galaxies. For example, it is now possible to meas-ure the abundance of numerous elements in nearby galaxies for more than 100 stars over a 25;-diameter field of view in one shot. A vast improvement on previous la- borious (but valiant) efforts with single-slit spectrographs to observe a handful of stars per galaxy (e.g., Tolstoy et al. 200�; Shetrone et al. 200�; Geisler et al. 2005).
The DART Large Programme has meas-ured abundances and velocities for sev-eral hundred individual stars in a sample of four nearby dSph galaxies: Sculptor, Fornax, Sextans and Carina. We have used the VLT/FLAMES facility in the low- resolution mode (LR 8, R ~ 8 000) to obtain Ca ii triplet metallicity estimates as well as accurate radial-velocity measure-ments over large areas in Sculptor, For-nax and Sextans out to the tidal radius (Tolstoy et al. 200�; Battaglia et al. 2006, in prep.), see Figure 1 for the example of Sculptor. In Figure 1 we show the area on the sky around the Sculptor dSph galaxy. The large ellipse is the tidal radius of Sculptor as determined by Irwin and Hatzidimitriou (1995). The positions ob-served with VLT/FLAMES are marked as circles, where the solid circles repre- sent the 10 individual FLAMES point-ings analysed so far, and the dashed-line circles are the positions of five addition- al fields that were observed in November 2005. Also plotted for the analysed fields are the positions of the stars that are probable members (small red squares) and the non-members (black crosses). Each of the four galaxies has been ob-served at high resolution (Giraffe settings HR 10, 1� and 1�) in the central region to obtain detailed abundances for a range of interesting elements such as Mg, Ca, O, Ti, Na, Eu to name a few (Hill et al. 2006 in prep.; Letarte et al. 2006a in prep.) for about 100 stars. During the Giraffe HR observations we were also able to use the fibre feed to the UVES spectrograph to obtain greater wavelength coverage and higher resolution for a sample of sev- en to 1� stars per galaxy (e.g., Venn et al. 2006 in prep.; Shetrone et al. 2006 in prep.). The comparison we can make between results from UVES spectroscopy (R ~ �0 000) and Giraffe spectroscopy
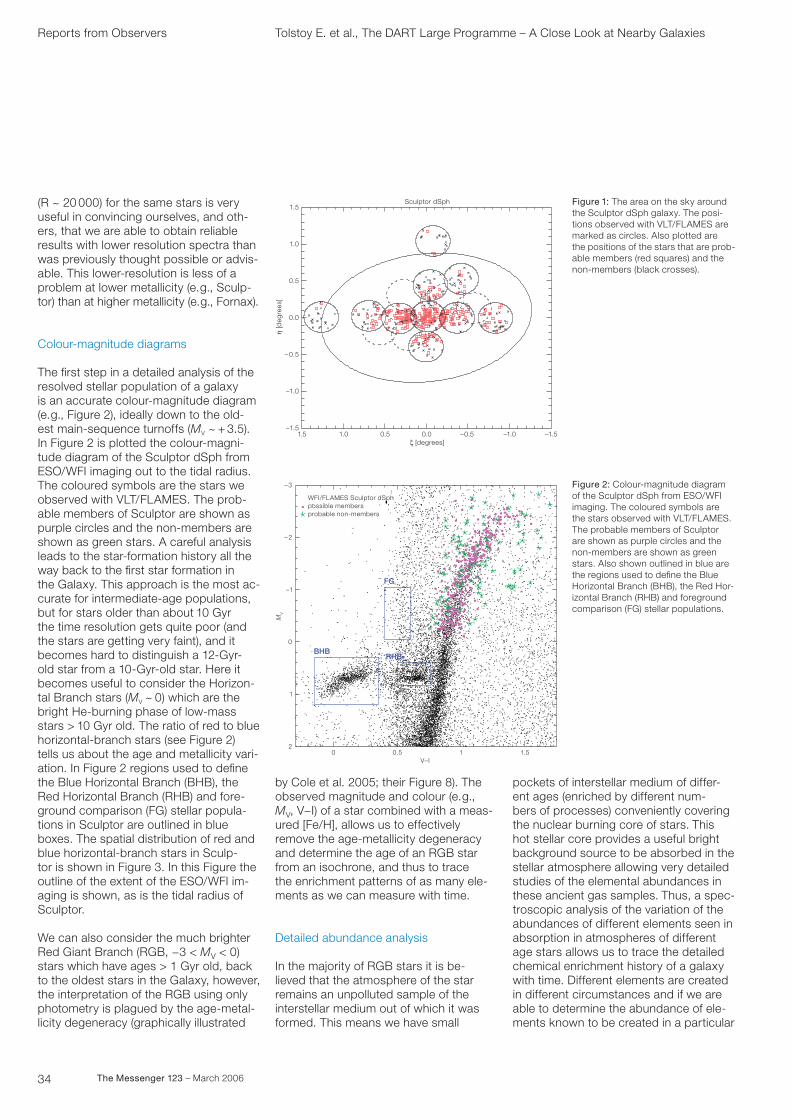
�� The Messenger 123 – March 2006
(R ~ 20 000) for the same stars is very useful in convincing ourselves, and oth-ers, that we are able to obtain reliable results with lower resolution spectra than was previously thought possible or advis-able. This lower-resolution is less of a problem at lower metallicity (e.g., Sculp- tor) than at higher metallicity (e.g., Fornax).
Colour-magnitude diagrams
The first step in a detailed analysis of the resolved stellar population of a galaxy is an accurate colour-magnitude diagram (e.g., Figure 2), ideally down to the old- est main-sequence turnoffs (MV ~ + �.5). In Figure 2 is plotted the colour-magni-tude diagram of the Sculptor dSph from ESO/WFI imaging out to the tidal radius. The coloured symbols are the stars we observed with VLT/FLAMES. The prob-able members of Sculptor are shown as purple circles and the non-members are shown as green stars. A careful analysis leads to the star-formation history all the way back to the first star formation in the Galaxy. This approach is the most ac- curate for intermediate-age populations, but for stars older than about 10 Gyr the time resolution gets quite poor (and the stars are getting very faint), and it becomes hard to distinguish a 12-Gyr-old star from a 10-Gyr-old star. Here it becomes useful to consider the Horizon-tal Branch stars (MV ~ 0) which are the bright He-burning phase of low-mass stars > 10 Gyr old. The ratio of red to blue horizontal-branch stars (see Figure 2) tells us about the age and metallicity vari- ation. In Figure 2 regions used to define the Blue Horizontal Branch (BHB), the Red Horizontal Branch (RHB) and fore-ground comparison (FG) stellar popula-tions in Sculptor are outlined in blue boxes. The spatial distribution of red and blue horizontal-branch stars in Sculp- tor is shown in Figure �. In this Figure the outline of the extent of the ESO/WFI im-aging is shown, as is the tidal radius of Sculptor.
We can also consider the much brighter Red Giant Branch (RGB, −� < MV < 0) stars which have ages > 1 Gyr old, back to the oldest stars in the Galaxy, however, the interpretation of the RGB using only photometry is plagued by the age-metal-licity degeneracy (graphically illustrated
Figure 2: Colour-magnitude diagram of the Sculptor dSph from ESO/WFI imaging. The coloured symbols are the stars observed with VLT/FLAMES. The probable members of Sculptor are shown as purple circles and the non-members are shown as green stars. Also shown outlined in blue are the regions used to define the Blue Horizontal Branch (BHB), the Red Hor-izontal Branch (RHB) and foreground comparison (FG) stellar populations.
–1.5
–1.0
–0.5
0.0
0.5
1.0
1.5
1.5 1.0 0.5 0.0 –1.0 –1.5–0.5
Sculptor dSph
ξ [degrees]
η [d
egre
es]
by Cole et al. 2005; their Figure 8). The observed magnitude and colour (e.g., MV, V−I) of a star combined with a meas- ured [Fe/H], allows us to effectively remove the age-metallicity degeneracy and determine the age of an RGB star from an isochrone, and thus to trace the enrichment patterns of as many ele- ments as we can measure with time.
Detailed abundance analysis
In the majority of RGB stars it is be-lieved that the atmosphere of the star remains an unpolluted sample of the interstellar medium out of which it was formed. This means we have small
Figure 1: The area on the sky around the Sculptor dSph galaxy. The posi-tions observed with VLT/FLAMES are marked as circles. Also plotted are the positions of the stars that are prob-able members (red squares) and the non-members (black crosses).
BHB
FG
RHB
WFI/FLAMES Sculptor dSph possible membersprobable non-members
V–I 1.510.50
2
–3
–2
–1
0
1
MV
Reports from Observers Tolstoy E. et al., The DART Large Programme – A Close Look at Nearby Galaxies
pockets of interstellar medium of differ-ent ages (enriched by different num- bers of processes) conveniently covering the nuclear burning core of stars. This hot stellar core provides a useful bright background source to be absorbed in the stellar atmosphere allowing very detailed studies of the elemental abundances in these ancient gas samples. Thus, a spec-troscopic analysis of the variation of the abundances of different elements seen in absorption in atmospheres of different age stars allows us to trace the detailed chemical enrichment history of a galaxy with time. Different elements are created in different circumstances and if we are able to determine the abundance of ele-ments known to be created in a particular
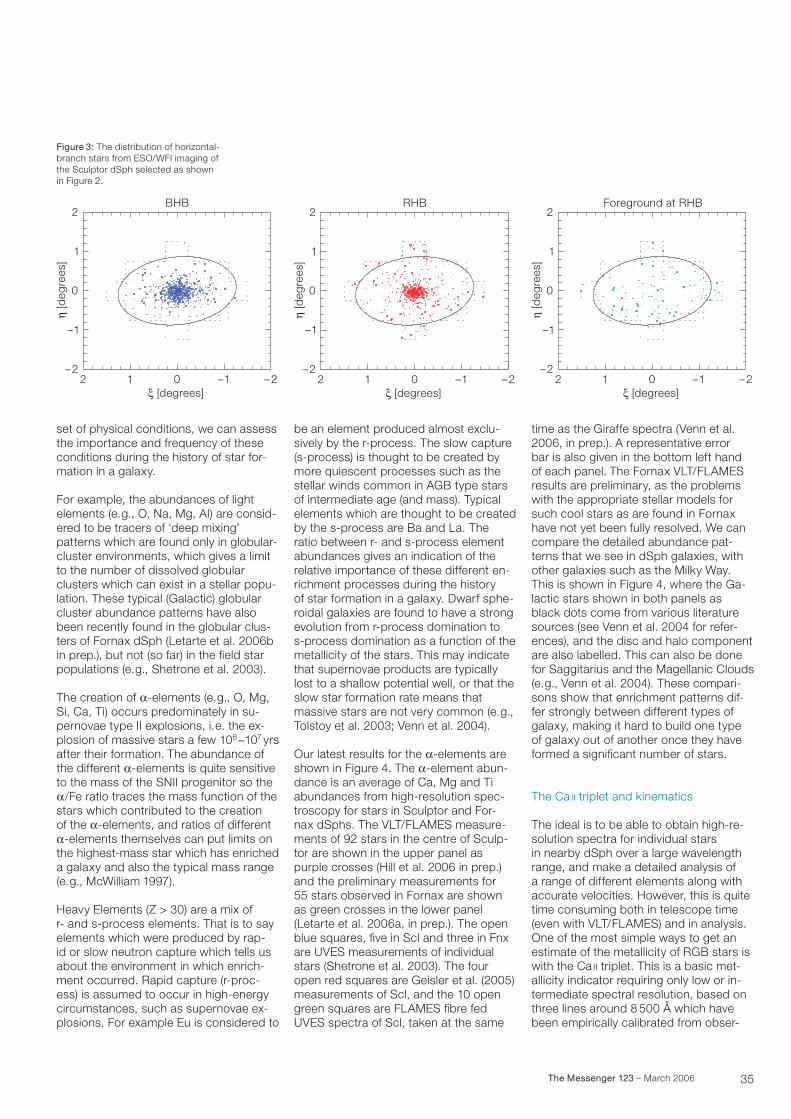
�5The Messenger 123 – March 2006
–2–1012–2
–1
0
1
2
ξ [degrees]
η [d
egre
es]
BHB
–2–1012–2
–1
0
1
2
ξ [degrees]
η [d
egre
es]
RHB
–2–1012–2
–1
0
1
2
ξ [degrees]
η [d
egre
es]
Foreground at RHB
Figure 3: The distribution of horizontal- branch stars from ESO/WFI imaging of the Sculptor dSph selected as shown in Figure 2.
set of physical conditions, we can assess the importance and frequency of these conditions during the history of star for-mation in a galaxy.
For example, the abundances of light elements (e.g., O, Na, Mg, Al) are consid-ered to be tracers of ‘deep mixing’ patterns which are found only in globular- cluster environments, which gives a limit to the number of dissolved globular clusters which can exist in a stellar popu-lation. These typical (Galactic) globular cluster abundance patterns have also been recently found in the globular clus-ters of Fornax dSph (Letarte et al. 2006b in prep.), but not (so far) in the field star populations (e.g., Shetrone et al. 200�).
The creation of a-elements (e.g., O, Mg, Si, Ca, Ti) occurs predominately in su-pernovae type II explosions, i.e. the ex-plosion of massive stars a few 106−107 yrs after their formation. The abundance of the different a-elements is quite sensitive to the mass of the SNII progenitor so the a/Fe ratio traces the mass function of the stars which contributed to the creation of the a-elements, and ratios of different a-elements themselves can put limits on the highest-mass star which has enriched a galaxy and also the typical mass range (e.g., McWilliam 1997).
Heavy Elements (Z > �0) are a mix of r- and s-process elements. That is to say elements which were produced by rap- id or slow neutron capture which tells us about the environment in which enrich-ment occurred. Rapid capture (r-proc-ess) is assumed to occur in high-energy circumstances, such as supernovae ex- plosions. For example Eu is considered to
be an element produced almost exclu-sively by the r-process. The slow capture (s-process) is thought to be created by more quiescent processes such as the stellar winds common in AGB type stars of intermediate age (and mass). Typical elements which are thought to be created by the s-process are Ba and La. The ratio between r- and s-process element abundances gives an indication of the relative importance of these different en-richment processes during the history of star formation in a galaxy. Dwarf sphe-roidal galaxies are found to have a strong evolution from r-process domination to s-process domination as a function of the metallicity of the stars. This may indicate that supernovae products are typically lost to a shallow potential well, or that the slow star formation rate means that massive stars are not very common (e.g., Tolstoy et al. 200�; Venn et al. 200�).
Our latest results for the a-elements are shown in Figure �. The a-element abun- dance is an average of Ca, Mg and Ti abundances from high-resolution spec-troscopy for stars in Sculptor and For- nax dSphs. The VLT/FLAMES measure-ments of 92 stars in the centre of Sculp-tor are shown in the upper panel as purple crosses (Hill et al. 2006 in prep.) and the preliminary measurements for 55 stars observed in Fornax are shown as green crosses in the lower panel (Letarte et al. 2006a, in prep.). The open blue squares, five in Scl and three in Fnx are UVES measurements of individual stars (Shetrone et al. 200�). The four open red squares are Geisler et al. (2005) measurements of Scl, and the 10 open green squares are FLAMES fibre fed UVES spectra of Scl, taken at the same
time as the Giraffe spectra (Venn et al. 2006, in prep.). A representative error bar is also given in the bottom left hand of each panel. The Fornax VLT/FLAMES results are preliminary, as the problems with the appropriate stellar models for such cool stars as are found in Fornax have not yet been fully resolved. We can compare the detailed abundance pat-terns that we see in dSph galaxies, with other galaxies such as the Milky Way. This is shown in Figure �, where the Ga-lactic stars shown in both panels as black dots come from various literature sources (see Venn et al. 200� for refer-ences), and the disc and halo component are also labelled. This can also be done for Saggitarius and the Magellanic Clouds (e.g., Venn et al. 200�). These compari-sons show that enrichment patterns dif- fer strongly between different types of galaxy, making it hard to build one type of galaxy out of another once they have formed a significant number of stars.
The Ca ii triplet and kinematics
The ideal is to be able to obtain high-re- solution spectra for individual stars in nearby dSph over a large wavelength range, and make a detailed analysis of a range of different elements along with accurate velocities. However, this is quite time consuming both in telescope time (even with VLT/FLAMES) and in analysis. One of the most simple ways to get an estimate of the metallicity of RGB stars is with the Ca ii triplet. This is a basic met- allicity indicator requiring only low or in- termediate spectral resolution, based on three lines around 8 500 Å which have been empirically calibrated from obser-
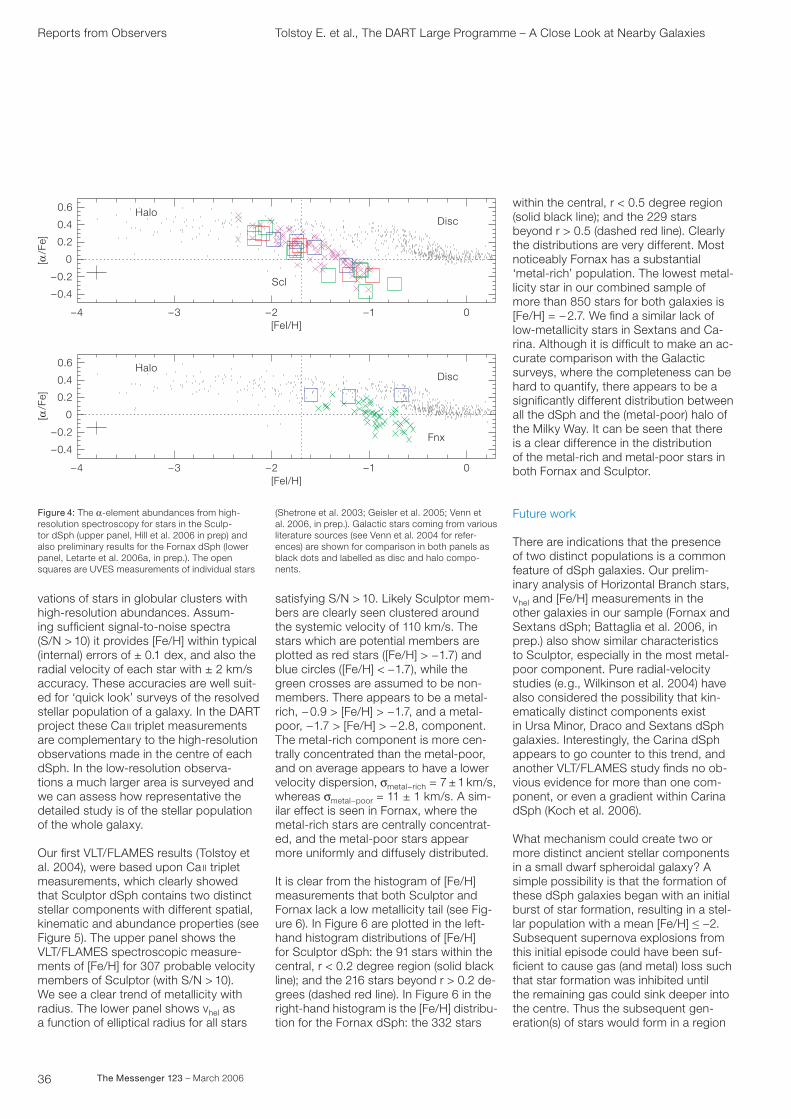
�6 The Messenger 123 – March 2006
vations of stars in globular clusters with high-resolution abundances. Assum- ing sufficient signal-to-noise spectra (S/N > 10) it provides [Fe/H] within typical (internal) errors of ± 0.1 dex, and also the radial velocity of each star with ± 2 km/s accuracy. These accuracies are well suit-ed for ‘quick look’ surveys of the resolved stellar population of a galaxy. In the DART project these Ca ii triplet measurements are complementary to the high-resolution observations made in the centre of each dSph. In the low-resolution observa-tions a much larger area is surveyed and we can assess how representative the detailed study is of the stellar population of the whole galaxy.
Our first VLT/FLAMES results (Tolstoy et al. 200�), were based upon Ca ii triplet measurements, which clearly showed that Sculptor dSph contains two distinct stellar components with different spatial, kinematic and abundance properties (see Figure 5). The upper panel shows the VLT/FLAMES spectroscopic measure-ments of [Fe/H] for �07 probable velocity members of Sculptor (with S/N > 10). We see a clear trend of metallicity with radius. The lower panel shows vhel as a function of elliptical radius for all stars
satisfying S/N > 10. Likely Sculptor mem- bers are clearly seen clustered around the systemic velocity of 110 km/s. The stars which are potential members are plotted as red stars ([Fe/H] > −1.7) and blue circles ([Fe/H] < −1.7), while the green crosses are assumed to be non- members. There appears to be a metal- rich, −0.9 > [Fe/H] > −1.7, and a metal- poor, −1.7 > [Fe/H] > −2.8, component. The metal-rich component is more cen-trally concentrated than the metal-poor, and on average appears to have a lower velocity dispersion, smetal−rich = 7 ± 1 km/s, whereas smetal−poor = 11 ± 1 km/s. A sim- ilar effect is seen in Fornax, where the metal-rich stars are centrally concentrat-ed, and the metal-poor stars appear more uniformly and diffusely distributed.
It is clear from the histogram of [Fe/H] measurements that both Sculptor and Fornax lack a low metallicity tail (see Fig- ure 6). In Figure 6 are plotted in the left-hand histogram distributions of [Fe/H] for Sculptor dSph: the 91 stars within the central, r < 0.2 degree region (solid black line); and the 216 stars beyond r > 0.2 de-grees (dashed red line). In Figure 6 in the right-hand histogram is the [Fe/H] distribu-tion for the Fornax dSph: the ��2 stars
within the central, r < 0.5 degree region (solid black line); and the 229 stars beyond r > 0.5 (dashed red line). Clearly the distributions are very different. Most noticeably Fornax has a substantial ‘metal-rich’ population. The lowest metal- licity star in our combined sample of more than 850 stars for both galaxies is [Fe/H] = −2.7. We find a similar lack of low-metallicity stars in Sextans and Ca-rina. Although it is difficult to make an ac- curate comparison with the Galactic surveys, where the completeness can be hard to quantify, there appears to be a significantly different distribution between all the dSph and the (metal-poor) halo of the Milky Way. It can be seen that there is a clear difference in the distribution of the metal-rich and metal-poor stars in both Fornax and Sculptor.
Future work
There are indications that the presence of two distinct populations is a common feature of dSph galaxies. Our prelim-inary analysis of Horizontal Branch stars, vhel and [Fe/H] measurements in the other galaxies in our sample (Fornax and Sextans dSph; Battaglia et al. 2006, in prep.) also show similar characteristics to Sculptor, especially in the most metal-poor component. Pure radial-velocity studies (e.g., Wilkinson et al. 200�) have also considered the possibility that kin-ematically distinct components exist in Ursa Minor, Draco and Sextans dSph galaxies. Interestingly, the Carina dSph appears to go counter to this trend, and another VLT/FLAMES study finds no ob- vious evidence for more than one com-ponent, or even a gradient within Carina dSph (Koch et al. 2006).
What mechanism could create two or more distinct ancient stellar components in a small dwarf spheroidal galaxy? A simple possibility is that the formation of these dSph galaxies began with an initial burst of star formation, resulting in a stel-lar population with a mean [Fe/H] ≤ −2. Subsequent supernova explosions from this initial episode could have been suf- ficient to cause gas (and metal) loss such that star formation was inhibited until the remaining gas could sink deeper into the centre. Thus the subsequent gen-eration(s) of stars would form in a region
Reports from Observers Tolstoy E. et al., The DART Large Programme – A Close Look at Nearby Galaxies
DiscHalo
Scl
[α/F
e]
–4 –3 –2 –1 0
–0.4
–0.2
0
0.2
0.4
0.6
[FeI/H]
DiscHalo
Fnx
[α/F
e]
–4 –3 –2 –1 0
–0.4
–0.2
0
0.2
0.4
0.6
[FeI/H]
Figure 4: The a-element abundances from high- resolution spectroscopy for stars in the Sculp-tor dSph (upper panel, Hill et al. 2006 in prep) and also preliminary results for the Fornax dSph (lower panel, Letarte et al. 2006a, in prep.). The open squares are UVES measurements of individual stars
(Shetrone et al. 200�; Geisler et al. 2005; Venn et al. 2006, in prep.). Galactic stars coming from various literature sources (see Venn et al. 200� for refer-ences) are shown for comparison in both panels as black dots and labelled as disc and halo compo-nents.
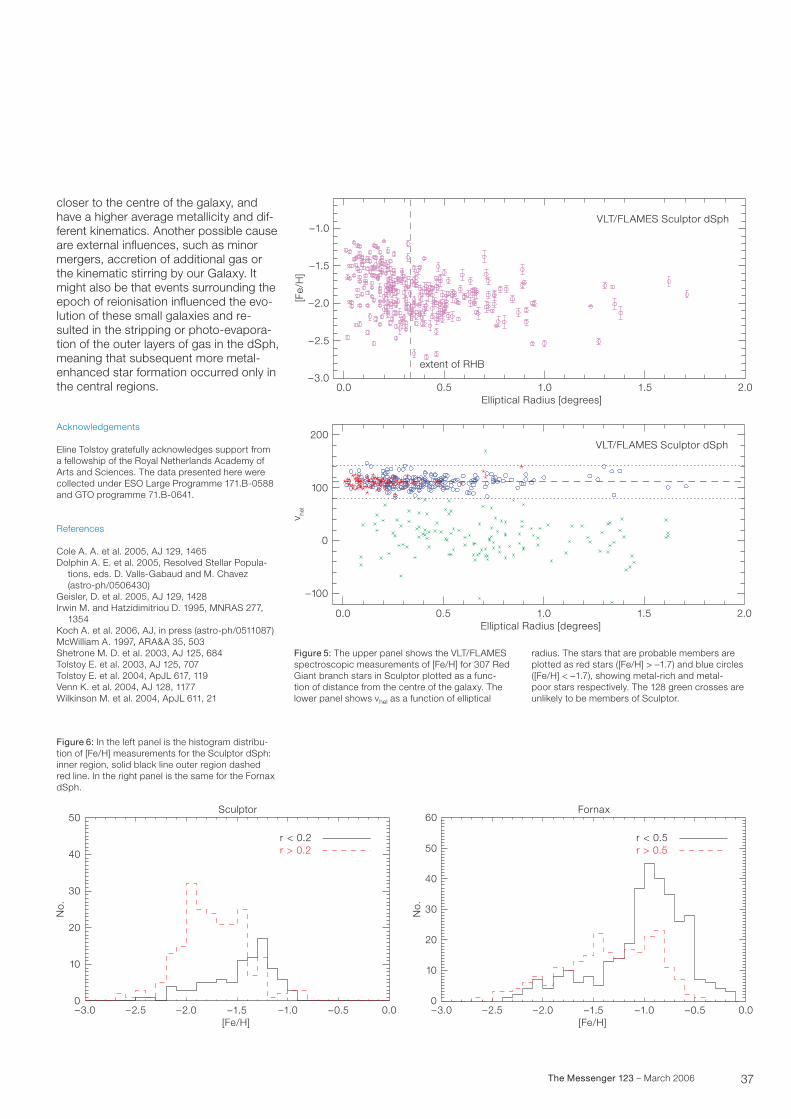
�7The Messenger 123 – March 2006
closer to the centre of the galaxy, and have a higher average metallicity and dif- ferent kinematics. Another possible cause are external influences, such as minor mergers, accretion of additional gas or the kinematic stirring by our Galaxy. It might also be that events surrounding the epoch of reionisation influenced the evo- lution of these small galaxies and re-sulted in the stripping or photo-evapora-tion of the outer layers of gas in the dSph, meaning that subsequent more metal- enhanced star formation occurred only in the central regions.
Acknowledgements
Eline Tolstoy gratefully acknowledges support from a fellowship of the Royal Netherlands Academy of Arts and Sciences. The data presented here were collected under ESO Large Programme 171.B-0588 and GTO programme 71.B-06�1.
References
Cole A. A. et al. 2005, AJ 129, 1�65Dolphin A. E. et al. 2005, Resolved Stellar Popula- tions, eds. D. Valls-Gabaud and M. Chavez
(astro-ph/0506��0)Geisler, D. et al. 2005, AJ 129, 1�28Irwin M. and Hatzidimitriou D. 1995, MNRAS 277, 1�5�Koch A. et al. 2006, AJ, in press (astro-ph/0511087)McWilliam A. 1997, ARA&A �5, 50�Shetrone M. D. et al. 200�, AJ 125, 68�Tolstoy E. et al. 200�, AJ 125, 707Tolstoy E. et al. 200�, ApJL 617, 119Venn K. et al. 200�, AJ 128, 1177Wilkinson M. et al. 200�, ApJL 611, 21
1.0 1.5 2.0
–2.5
–2.0
–1.5
–1.0
0.50.0Elliptical Radius [degrees]
[Fe/
H]
extent of RHB
VLT/FLAMES Sculptor dSph
–3.0
VLT/FLAMES Sculptor dSph
1.0 1.5 2.0
0
200
0.50.0Elliptical Radius [degrees]
v hel
–100
100
Figure 5: The upper panel shows the VLT/FLAMES spectroscopic measurements of [Fe/H] for �07 Red Giant branch stars in Sculptor plotted as a func- tion of distance from the centre of the galaxy. The lower panel shows vhel as a function of elliptical
Figure 6: In the left panel is the histogram distribu-tion of [Fe/H] measurements for the Sculptor dSph: inner region, solid black line outer region dashed red line. In the right panel is the same for the Fornax dSph.
0.0–0.5–1.0–1.5–2.0–2.5–3.00
10
20
30
40
50
[Fe/H]
No.
Sculptor
r < 0.2r > 0.2
0.0–0.5–1.0–1.5–2.0–2.5–3.00
10
20
30
40
50
60
[Fe/H]
No.
Fornax
r < 0.5r > 0.5
radius. The stars that are probable members are plotted as red stars ([Fe/H] > –1.7) and blue circles ([Fe/H] < –1.7), showing metal-rich and metal- poor stars respectively. The 128 green crosses are unlikely to be members of Sculptor.
�8 The Messenger 123 – March 2006
Reports from Observers
The Age-Metallicity Degeneracy in the Dwarf Spheroidal Carina as Seen by FLAMES
Andreas Koch1
Eva K. Grebel1
Rosemary F. G. Wyse2
Jan T. Kleyna� Mark I. Wilkinson�
Daniel R. Harbeck5
Gerard F. Gilmore �
N. Wyn Evans�
1 Astronomical Institute of the University of Basel, Department of Physics and Astronomy, Binningen, Switzerland
2 The John Hopkins University, Baltimore, USA
� Institute for Astronomy, Honolulu, USA� Institute of Astronomy, Cambridge
University, United Kingdom5 Department of Astronomy, University of
Wisconsin, Madison, USA
The Carina dwarf spheroidal galaxy is the only one of this type to show clearly episodic star formation separated by long pauses. Still its Red Giant Branch is remarkably narrow. Our medium-res-olution spectroscopy of 437 Red Giants in this galactic satellite with FLAMES reveals a full range of metallicities from ~ –3.0 up to ~ 0.0 dex. There also ap-pears to be a mild radial gradient in that more metal-rich populations are more centrally concentrated, matching a sim- ilar trend in ages with an increasing fraction of intermediate-age stars in the centre (Harbeck et al. 2001). Comple- mented by the colours of the more me-tal-rich stars, this suggests that Carina exhibits an age-metallicity relation. We address the star formation in this in-triguing galaxy by also pursuing its age- metallicity degeneracy, resulting in a narrow Red Giant Branch despite the considerable spread in metallicity and wide range of ages, and applying basic models of chemical evolution.
Dwarf spheroidal galaxies (dSphs) are the least luminous, least massive galax-ies known. Most of them are found within �00 kpc around more massive galaxies. DSphs are gas-deficient and are typically dominated by old (> 10 Gyrs) or inter- mediate-age populations (1–10 Gyrs). All dSphs studied in sufficient detail have been found to contain ancient populations that are indistinguishable in age from
the oldest populations in the Milky Way (Grebel and Gallagher 200�). While their detailed star-formation histories (SFHs) vary from galaxy to galaxy, dSphs exhib-it a trend of increasing luminosity with increasing mean metallicity (e.g., Grebel, Gallagher, and Harbeck 200�). DSphs usually show fairly continuous star forma-tion (SF) with some amplitude variations. Younger and/or more metal-rich popula-tions are more centrally concentrated, in- dicating longer-lasting SF episodes in the centres of the dSphs’ shallow poten-tial wells (Harbeck et al. 2001).
Dsphs are enigmatic objects. Their past extended SF histories contrast with their present, puzzling lack of gas. It is still un- der debate whether they are dark mat- ter dominated and how much dark matter they contain. While they clearly interact with more massive galaxies, their impor-tance as cosmological building blocks remains unclear. Not only do cosmologi-cal models predict two orders of mag-nitude more ‘dark matter halos’ than the observed number of low-mass dSphs (e.g., Moore et al. 1999), but also the el- ement abundance ratios in the galactic halo differ from those measured in dSphs (e.g., Shetrone, Côté, and Sargent 2001).
Our current knowledge of the detailed ev- olutionary history of nearby dwarf galax-ies is mainly based on photometry, oc-casionally supplemented by rather sparse spectroscopic information. But spectros-copy is of paramount importance since it permits us to break the age-metallicity degeneracy that plagues purely photo-metric colour-magnitude-diagram analy-ses. The information from independent spectroscopic metallicity determinations for individual stars removes this ambigu-ity from subsequent photometric determi-nations of the SF history.
In the gas-deficient dSphs, our primary sources of metallicity information are Red Giants, which are now easily acces-sible for ground-based 8- to 10-m-class telescopes. Thus, we may ultimately be able to derive detailed evolutionary histories by using the VLT with its power-ful multi-object spectroscopy facility FLAMES. Moreover, velocities can be extracted from such spectra, permitting membership and kinematic analyses.
Our VLT Large Programme (171.B-0520, PI: Gilmore) aims at doing just that: We wish to (1) constrain the chemical evolu-tion of dSphs and to (2) measure the size and extent of the dark-matter halos of dSphs. One of our prime targets is the galactic dSph companion Carina at a distance of about 9� kpc from the Milky Way. Here we present first results of our abundance analysis of Carina (see also Koch et al. 2006). A detailed kinematic analysis is in preparation (Wilkinson et al. 2006).
The dwarf galaxy Carina
Carina stands out among the dSphs in the Local Group because of its unu- sual, episodic star-formation history (e.g., Smecker-Hane et al. 199�). In no other dSph has clear evidence for well-sepa-rated episodes of star formation been found. Carina may have experienced at least four episodes of star formation, one possibly as recently as 0.6 Gyr ago (Monelli et al. 200�). The dominant epi-sodes occurred approximately 2, � to 6, and 11 to 1� Gyrs ago. Their distinct main-sequence turn-offs all connect to the same narrow Red Giant Branch with an estimated mean metallicity of [Fe/H] ~ –1.99 dex and a spread of about 0.08 dex (Smecker-Hane et al. 1999). Smecker-Hane et al. (1999) argue that the narrow Red Giant Branch of Carina re-sults from an age-metallicity conspiracy in the sense that more metal-rich, but younger stars come to lie at the same lo- cation in the colour-magnitude plane as older, metal-poor stars. Based on a photometric study, Rizzi et al. (200�) sug-gest that the narrow Red Giant Branch is a consequence of the contribution of the dominant intermediate-age star-for-mation episode, while the contribution of the ancient episode is almost negligible, which cannot be rejected as a plausible cause, unless reliable spectroscopic age estimates are available.
These findings underline the highly com-plex star-formation history of Carina. There is not yet a satisfactory explanation of why Carina would have experienced episodic SF, and why its evolution was so different from that of other dSphs. Was Carina’s SF activity triggered by inter-actions? Did this dSph manage to repeat-
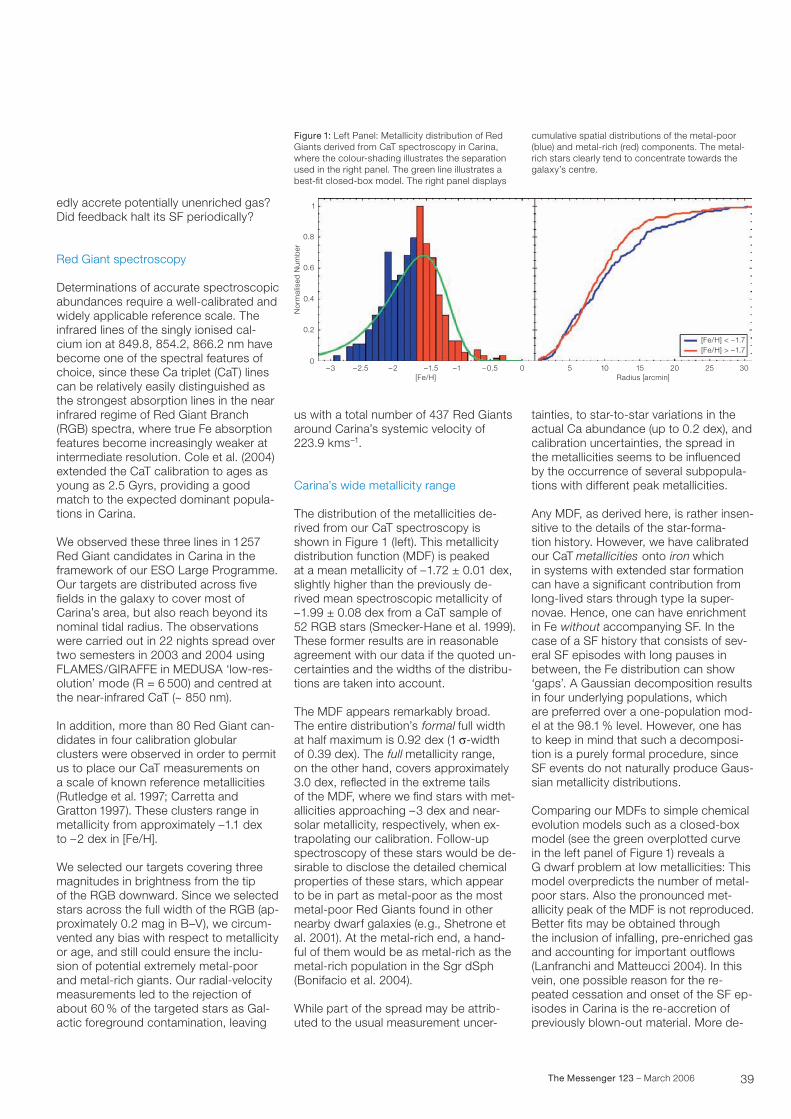
�9The Messenger 123 – March 2006
edly accrete potentially unenriched gas? Did feedback halt its SF periodically?
Red Giant spectroscopy
Determinations of accurate spectroscopic abundances require a well-calibrated and widely applicable reference scale. The infrared lines of the singly ionised cal-cium ion at 8�9.8, 85�.2, 866.2 nm have become one of the spectral features of choice, since these Ca triplet (CaT) lines can be relatively easily distinguished as the strongest absorption lines in the near infrared regime of Red Giant Branch (RGB) spectra, where true Fe absorption features become increasingly weaker at intermediate resolution. Cole et al. (200�) extended the CaT calibration to ages as young as 2.5 Gyrs, providing a good match to the expected dominant popula-tions in Carina.
We observed these three lines in 1257 Red Giant candidates in Carina in the framework of our ESO Large Programme. Our targets are distributed across five fields in the galaxy to cover most of Carina’s area, but also reach beyond its nominal tidal radius. The observations were carried out in 22 nights spread over two semesters in 200� and 200� using FLAMES/GIRAFFE in MEDUSA ‘low-res- olution’ mode (R = 6 500) and centred at the near-infrared CaT (~ 850 nm).
In addition, more than 80 Red Giant can- didates in four calibration globular clusters were observed in order to permit us to place our CaT measurements on a scale of known reference metallicities (Rutledge et al. 1997; Carretta and Gratton 1997). These clusters range in metallicity from approximately –1.1 dex to –2 dex in [Fe/H].
We selected our targets covering three magnitudes in brightness from the tip of the RGB downward. Since we selected stars across the full width of the RGB (ap- proximately 0.2 mag in B–V), we circum-vented any bias with respect to metallicity or age, and still could ensure the inclu-sion of potential extremely metal-poor and metal-rich giants. Our radial-velocity measurements led to the rejection of about 60 % of the targeted stars as Gal-actic foreground contamination, leaving
us with a total number of ��7 Red Giants around Carina’s systemic velocity of 22�.9 kms–1.
Carina’s wide metallicity range
The distribution of the metallicities de- rived from our CaT spectroscopy is shown in Figure 1 (left). This metallicity distribution function (MDF) is peaked at a mean metallicity of –1.72 ± 0.01 dex, slightly higher than the previously de- rived mean spectroscopic metallicity of –1.99 ± 0.08 dex from a CaT sample of 52 RGB stars (Smecker-Hane et al. 1999). These former results are in reasonable agreement with our data if the quoted un- certainties and the widths of the distribu-tions are taken into account.
The MDF appears remarkably broad.The entire distribution’s formal full width at half maximum is 0.92 dex (1 s-width of 0.�9 dex). The full metallicity range, on the other hand, covers approximately �.0 dex, reflected in the extreme tails of the MDF, where we find stars with met- allicities approaching –� dex and near-solar metallicity, respectively, when ex-trapolating our calibration. Follow-up spectroscopy of these stars would be de-sirable to disclose the detailed chemical properties of these stars, which appear to be in part as metal-poor as the most metal-poor Red Giants found in other nearby dwarf galaxies (e.g., Shetrone et al. 2001). At the metal-rich end, a hand-ful of them would be as metal-rich as the metal-rich population in the Sgr dSph (Bonifacio et al. 200�).
While part of the spread may be attrib-uted to the usual measurement uncer-
tainties, to star-to-star variations in the actual Ca abundance (up to 0.2 dex), and calibration uncertainties, the spread in the metallicities seems to be influenced by the occurrence of several subpopula-tions with different peak metallicities.
Any MDF, as derived here, is rather insen-sitive to the details of the star-forma- tion history. However, we have calibrated our CaT metallicities onto iron which in systems with extended star formation can have a significant contribution from long-lived stars through type Ia super- novae. Hence, one can have enrichment in Fe without accompanying SF. In the case of a SF history that consists of sev- eral SF episodes with long pauses in between, the Fe distribution can show ‘gaps’. A Gaussian decomposition results in four underlying populations, which are preferred over a one-population mod-el at the 98.1 % level. However, one has to keep in mind that such a decomposi-tion is a purely formal procedure, since SF events do not naturally produce Gaus-sian metallicity distributions.
Comparing our MDFs to simple chemical evolution models such as a closed-box model (see the green overplotted curve in the left panel of Figure 1) reveals a G dwarf problem at low metallicities: This model overpredicts the number of metal- poor stars. Also the pronounced met- allicity peak of the MDF is not reproduced. Better fits may be obtained through the inclusion of infalling, pre-enriched gas and accounting for important outflows (Lanfranchi and Matteucci 200�). In this vein, one possible reason for the re-peated cessation and onset of the SF ep- isodes in Carina is the re-accretion of previously blown-out material. More de-
Figure 1: Left Panel: Metallicity distribution of Red Giants derived from CaT spectroscopy in Carina, where the colour-shading illustrates the separation used in the right panel. The green line illustrates a best-fit closed-box model. The right panel displays
cumulative spatial distributions of the metal-poor (blue) and metal-rich (red) components. The metal- rich stars clearly tend to concentrate towards the galaxy’s centre.
[Fe/H] < –1.7[Fe/H] > –1.7
302520151050–0.5–1–1.5–2–2.5–30
0.2
0.4
0.6
0.8
1
No
rmal
ised
Num
ber
Radius [arcmin][Fe/H]
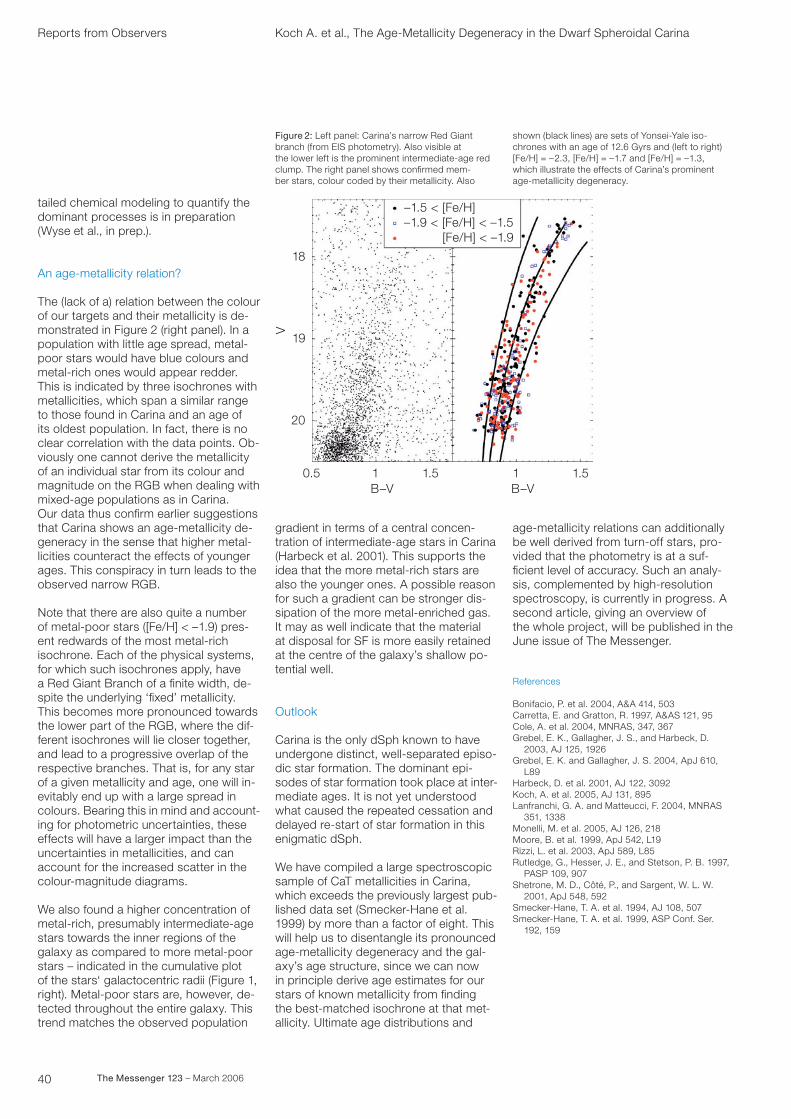
�0 The Messenger 123 – March 2006
tailed chemical modeling to quantify the dominant processes is in preparation (Wyse et al., in prep.).
An age-metallicity relation?
The (lack of a) relation between the colour of our targets and their metallicity is de-monstrated in Figure 2 (right panel). In a population with little age spread, metal-poor stars would have blue colours and metal-rich ones would appear redder. This is indicated by three isochrones with metallicities, which span a similar range to those found in Carina and an age of its oldest population. In fact, there is no clear correlation with the data points. Ob-viously one cannot derive the metallicity of an individual star from its colour and magnitude on the RGB when dealing with mixed-age populations as in Carina. Our data thus confirm earlier suggestions that Carina shows an age-metallicity de-generacy in the sense that higher metal-licities counteract the effects of younger ages. This conspiracy in turn leads to the observed narrow RGB.
Note that there are also quite a number of metal-poor stars ([Fe/H] < –1.9) pres-ent redwards of the most metal-rich isochrone. Each of the physical systems, for which such isochrones apply, have a Red Giant Branch of a finite width, de- spite the underlying ‘fixed’ metallicity. This becomes more pronounced towards the lower part of the RGB, where the dif-ferent isochrones will lie closer together, and lead to a progressive overlap of the respective branches. That is, for any star of a given metallicity and age, one will in- evitably end up with a large spread in colours. Bearing this in mind and account-ing for photometric uncertainties, these effects will have a larger impact than the uncertainties in metallicities, and can account for the increased scatter in the colour-magnitude diagrams.
We also found a higher concentration of metal-rich, presumably intermediate-age stars towards the inner regions of the galaxy as compared to more metal-poor stars – indicated in the cumulative plot of the stars‘ galactocentric radii (Figure 1, right). Metal-poor stars are, however, de-tected throughout the entire galaxy. This trend matches the observed population
gradient in terms of a central concen-tration of intermediate-age stars in Carina (Harbeck et al. 2001). This supports the idea that the more metal-rich stars are also the younger ones. A possible reason for such a gradient can be stronger dis-sipation of the more metal-enriched gas. It may as well indicate that the material at disposal for SF is more easily retained at the centre of the galaxy’s shallow po-tential well.
Outlook
Carina is the only dSph known to have undergone distinct, well-separated episo- dic star formation. The dominant epi-sodes of star formation took place at inter-mediate ages. It is not yet understood what caused the repeated cessation and delayed re-start of star formation in this enigmatic dSph.
We have compiled a large spectroscopic sample of CaT metallicities in Carina, which exceeds the previously largest pub- lished data set (Smecker-Hane et al. 1999) by more than a factor of eight. This will help us to disentangle its pronounced age-metallicity degeneracy and the gal-axy’s age structure, since we can now in principle derive age estimates for our stars of known metallicity from finding the best-matched isochrone at that met- allicity. Ultimate age distributions and
age-metallicity relations can additionally be well derived from turn-off stars, pro-vided that the photometry is at a suf-ficient level of accuracy. Such an analy-sis, complemented by high-resolution spectroscopy, is currently in progress. A second article, giving an overview of the whole project, will be published in the June issue of The Messenger.
References
Bonifacio, P. et al. 200�, A&A �1�, 50�Carretta, E. and Gratton, R. 1997, A&AS 121, 95Cole, A. et al. 200�, MNRAS, ��7, �67Grebel, E. K., Gallagher, J. S., and Harbeck, D. 200�, AJ 125, 1926Grebel, E. K. and Gallagher, J. S. 200�, ApJ 610, L89Harbeck, D. et al. 2001, AJ 122, �092Koch, A. et al. 2005, AJ 1�1, 895Lanfranchi, G. A. and Matteucci, F. 200�, MNRAS �51, 1��8Monelli, M. et al. 2005, AJ 126, 218Moore, B. et al. 1999, ApJ 5�2, L19Rizzi, L. et al. 200�, ApJ 589, L85Rutledge, G., Hesser, J. E., and Stetson, P. B. 1997, PASP 109, 907Shetrone, M. D., Côté, P., and Sargent, W. L. W. 2001, ApJ 5�8, 592Smecker-Hane, T. A. et al. 199�, AJ 108, 507Smecker-Hane, T. A. et al. 1999, ASP Conf. Ser. 192, 159
Reports from Observers Koch A. et al., The Age-Metallicity Degeneracy in the Dwarf Spheroidal Carina
Figure 2: Left panel: Carina’s narrow Red Giant branch (from EIS photometry). Also visible at the lower left is the prominent intermediate-age red clump. The right panel shows confirmed mem- ber stars, colour coded by their metallicity. Also
B–V B–V1.511.510.5
20
19
18
V
–1.5 < [Fe/H]–1.9 < [Fe/H] < –1.5
[Fe/H] < –1.9
shown (black lines) are sets of Yonsei-Yale iso-chrones with an age of 12.6 Gyrs and (left to right) [Fe/H] = –2.�, [Fe/H] = –1.7 and [Fe/H] = –1.�, which illustrate the effects of Carina’s prominent age-metallicity degeneracy.
41The Messenger 123 – March 2006
Reports from Observers
The Formation of Intermediate-Mass Galaxies over the Last 8 Gyrs
François Hammer1
Matthew Lehnert2
Mathieu Puech1
Hector Flores1
Yan-Chun Liang3
1 Laboratoire Galaxies, Etoiles, Physique et Instrumentation, Observatoire de Paris, France
2 Max-Planck-Institut für Extraterres-trische Physik, Garching, Germany
3 National Astronomical Observatories, Chinese Academy of Sciences, China
The physical processes driving the growth of galaxies can be robustly in-vestigated all the way to z = 1, i.e. when the Universe was only about 40 % of its current age. The advantage of re-stricting ourselves to this redshift range is that the total stellar mass, extinction, star-formation rate, gas-phase metal abundance, and galaxy kinematics can be recovered with reasonable accuracy. Moreover, half of the stars in spirals were formed less than 8 Gyrs ago. More practically, as we shall show, the cur-rent generation of instruments at the ESO VLT allows us to study galaxies up to z = 1 at approximately the same level of detail as what has been done for nearby galaxies. Here we present the first results of the properties of galax- ies out to this redshift based on a mod- erately large sample of 0.4 < z < 1 galaxies using VLT/FORS, ISAAC and GIRAFFE. This study has allowed us to investigate the important physical processes that shaped galaxies includ-ing merging, gas accretion, and feed-back from intense star formation.
Measuring stellar masses, star-formation rates and oxygen abundances: the impor-tance of extinction
To investigate the physical processes shaping galaxies at 40 % of the age of the Universe, we have gathered a sample of 200 galaxies selected from the Can-ada France Redshift Survey (IAB < 22.5, 0.4 < z < 1). These galaxies have stellar masses ranging from 3 × 10¹⁰ to 3 × 10¹¹ MA, i.e., dominated by inter- mediate-mass galaxies. Almost all of them have been imaged by the Hubble
Space Telescope and several have been observed using the combination of FORS2 and ISAAC in order to recover their physical characteristics and to compare them to local galaxies in the same mass range.
But before reviewing our findings, we believe it necessary to be precise in the definition of the words ‘massive’ and ‘dwarfs’ when these terms are applied to galaxies. The physical characteristics of local galaxies seem to suggest that mas-sive galaxies have Mstar > 3 × 10¹¹ MA (i.e., approximately the Milky Way and more massive), and that dwarfs are defined by Mstar < 3 × 10¹⁰ MA. At this dividing point, the massive galaxies are dominated by older populations, high surface mass densities, and are dominated by the mor-phological type, E/S0. Spiral and irreg-ular galaxies with lower surface densities and younger populations dominate the intermediate and dwarf mass regime re-spectively (Kauffman et al. 2003).
Studies of the ‘star-formation history’ of the Universe suggest that the star-forma-tion rate density has declined significant- ly from z ≈ 1 to the current epoch. Mas-sive E/S0s and dwarfs are apparently not the main contributors to this decline, be-cause the early-type galaxies were mostly in place at z = 1, and dwarf galaxies contribute marginally to the global stellar mass or metal content. Therefore to un-derstand how galaxies grew, we focus, in the following, on the population of in- termediate-mass galaxies. Intermediate-mass galaxies populate the ‘knee’ of the luminosity function and comprise at least 2/3 of the current stellar mass den-sity (Brinchman and Ellis 2000; Heavens et al. 2004). Locally, according to the morphological classified luminosity func-tion from the Sloan Survey (see Naka-mura et al. 2004), 53 % of galaxies are early-type spirals (earlier than Sbc), 27% are E/S0, 17 % are late-type spirals, and only few (3 %) are classified as irregulars.
The near-IR luminosity of galaxies seems to correlate well with their stellar masses. This is intriguing because most of the near-IR light is not coming from the main- sequence stars that make up most of the galaxy mass. One may justifiably sus- pect that mass estimates based on near- infrared photometry must have large un-
certainties and whether this method can apply equally to starbursts and early-type evolved galaxies. Bell et al. (2003) have ingeniously circumvented these difficul- ties, by applying an empirical correction depending on the B–V colour of the galax-ies (the bluer galaxies have lower stel- lar masses at a given K luminosity which is contaminated by red supergiant stars). Nevertheless the systematic uncertain- ty related to stellar-mass estimates could be as high as a factor of 2–3, by, for ex- ample, ignoring the effects or range of possible choices for the stellar initial mass function (IMF). Since dynamical mass estimates are sensitive to different sys-tematic effects, only through the compar-ison of dynamical and photometric mass estimates can we overcome problems related to, e.g., the choice of plausible IMFs, the amount and distribution of the extinction, and our ignorance of the star-formation history of individual galaxies.
Estimates of star-formation rates (SFRs) for individual galaxies are usually be- lieved to be very uncertain. A significant uncertainty is the IMF: most (all?) tracers used to estimate SFRs are proportional to the number of massive (e.g., IR) or very massive, ionising, stars (e.g., Ha). In a critical examination of the literature, Ken-nicutt (1998) has provided us with some useful tools to derive SFRs based on var- ious indicators and all assuming the same IMF. Similarly, it is also important to be consistent when comparing SFR with stellar mass by using a common IMF. For observational reasons, UV continuum or [O ii]l3727 fluxes have been frequently used to estimate the SFR, since these wavelengths are redshifted into the visible window at moderate or high redshifts. Unfortunately, these estimates are strong- ly affected by dust, its distribution and amount, and thus underestimate the true SFR of individual galaxies by very large factors (see Figure 1). Indeed, actively star-forming galaxies, starbursts, espec-ially the dust-enshrouded ones, the lu-minous infrared galaxies with bolometric luminosities about 1011 LA, LIRGs, are so numerous at z > 0.4, that the only viable tracers of the star-formation rate at those redshifts are only those which account for the light reprocessed by dust (IR), or those that can be properly corrected for extinction (e.g., Ha after using Ha/Hb to estimate the extinction). For a given
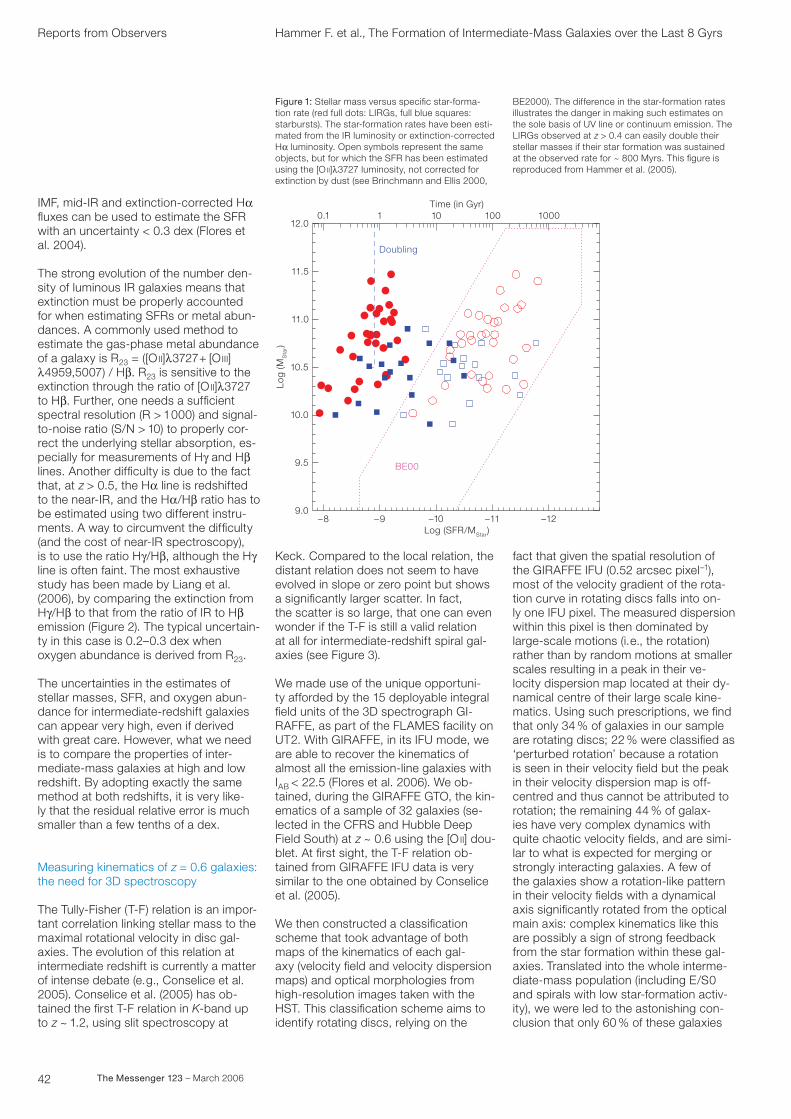
42 The Messenger 123 – March 2006
IMF, mid-IR and extinction-corrected Ha fluxes can be used to estimate the SFR with an uncertainty < 0.3 dex (Flores et al. 2004).
The strong evolution of the number den-sity of luminous IR galaxies means that extinction must be properly accounted for when estimating SFRs or metal abun- dances. A commonly used method to estimate the gas-phase metal abundance of a galaxy is R23 = ([O ii]l3727+ [O iii] l4959,5007) / Hb. R23 is sensitive to the extinction through the ratio of [O ii]l3727 to Hb. Further, one needs a sufficient spectral resolution (R > 1000) and signal- to-noise ratio (S/N > 10) to properly cor-rect the underlying stellar absorption, es-pecially for measurements of Hg and Hb lines. Another difficulty is due to the fact that, at z > 0.5, the Ha line is redshifted to the near-IR, and the Ha/Hb ratio has to be estimated using two different instru-ments. A way to circumvent the difficulty (and the cost of near-IR spectroscopy), is to use the ratio Hg/Hb, although the Hg line is often faint. The most exhaustive study has been made by Liang et al. (2006), by comparing the extinction from Hg/Hb to that from the ratio of IR to Hb emission (Figure 2). The typical uncertain- ty in this case is 0.2–0.3 dex when oxygen abundance is derived from R23.
The uncertainties in the estimates of stellar masses, SFR, and oxygen abun-dance for intermediate-redshift galaxies can appear very high, even if derived with great care. However, what we need is to compare the properties of inter-mediate-mass galaxies at high and low redshift. By adopting exactly the same method at both redshifts, it is very like- ly that the residual relative error is much smaller than a few tenths of a dex.
Measuring kinematics of z = 0.6 galaxies: the need for 3D spectroscopy
The Tully-Fisher (T-F) relation is an impor-tant correlation linking stellar mass to the maximal rotational velocity in disc gal- axies. The evolution of this relation at intermediate redshift is currently a matter of intense debate (e.g., Conselice et al. 2005). Conselice et al. (2005) has ob-tained the first T-F relation in K-band up to z ~ 1.2, using slit spectroscopy at
Keck. Compared to the local relation, the distant relation does not seem to have evolved in slope or zero point but shows a significantly larger scatter. In fact, the scatter is so large, that one can even wonder if the T-F is still a valid relation at all for intermediate-redshift spiral gal-axies (see Figure 3).
We made use of the unique opportuni- ty afforded by the 15 deployable integral field units of the 3D spectrograph GI-RAFFE, as part of the FLAMES facility on UT2. With GIRAFFE, in its IFU mode, we are able to recover the kinematics of almost all the emission-line galaxies with IAB < 22.5 (Flores et al. 2006). We ob- tained, during the GIRAFFE GTO, the kin- ematics of a sample of 32 galaxies (se- lected in the CFRS and Hubble Deep Field South) at z ~ 0.6 using the [O ii] dou- blet. At first sight, the T-F relation ob-tained from GIRAFFE IFU data is very similar to the one obtained by Conselice et al. (2005).
We then constructed a classification scheme that took advantage of both maps of the kinematics of each gal- axy (velocity field and velocity dispersion maps) and optical morphologies from high-resolution images taken with the HST. This classification scheme aims to identify rotating discs, relying on the
fact that given the spatial resolution of the GIRAFFE IFU (0.52 arcsec pixel–1), most of the velocity gradient of the rota-tion curve in rotating discs falls into on- ly one IFU pixel. The measured dispersion within this pixel is then dominated by large-scale motions (i.e., the rotation) rather than by random motions at smaller scales resulting in a peak in their ve- locity dispersion map located at their dy- namical centre of their large scale kine-matics. Using such prescriptions, we find that only 34 % of galaxies in our sample are rotating discs; 22 % were classified as ‘perturbed rotation’ because a rotation is seen in their velocity field but the peak in their velocity dispersion map is off-centred and thus cannot be attributed to rotation; the remaining 44 % of galax- ies have very complex dynamics with quite chaotic velocity fields, and are simi- lar to what is expected for merging or strongly interacting galaxies. A few of the galaxies show a rotation-like pattern in their velocity fields with a dynamical axis significantly rotated from the optical main axis: complex kinematics like this are possibly a sign of strong feedback from the star formation within these gal- axies. Translated into the whole interme- diate-mass population (including E/S0 and spirals with low star-formation activ-ity), we were led to the astonishing con-clusion that only 60 % of these galaxies
Reports from Observers Hammer F. et al., The Formation of Intermediate-Mass Galaxies over the Last 8 Gyrs
Figure 1: Stellar mass versus specific star-forma-tion rate (red full dots: LIRGs, full blue squares: starbursts). The star-formation rates have been esti-mated from the IR luminosity or extinction-corrected Ha luminosity. Open symbols represent the same objects, but for which the SFR has been estimated using the [O ii]l3727 luminosity, not corrected for extinction by dust (see Brinchmann and Ellis 2000,
Doubling
–12–11–10–9–8
0.1 1 10 100
11.5
11.0
10.5
10.0
9.5
9.0
Log
(MS
tar)
12.01000
Log (SFR/MStar)
Time (in Gyr)
BE00
BE2000). The difference in the star-formation rates illustrates the danger in making such estimates on the sole basis of UV line or continuum emission. The LIRGs observed at z > 0.4 can easily double their stellar masses if their star formation was sustained at the observed rate for ~ 800 Myrs. This figure is reproduced from Hammer et al. (2005).
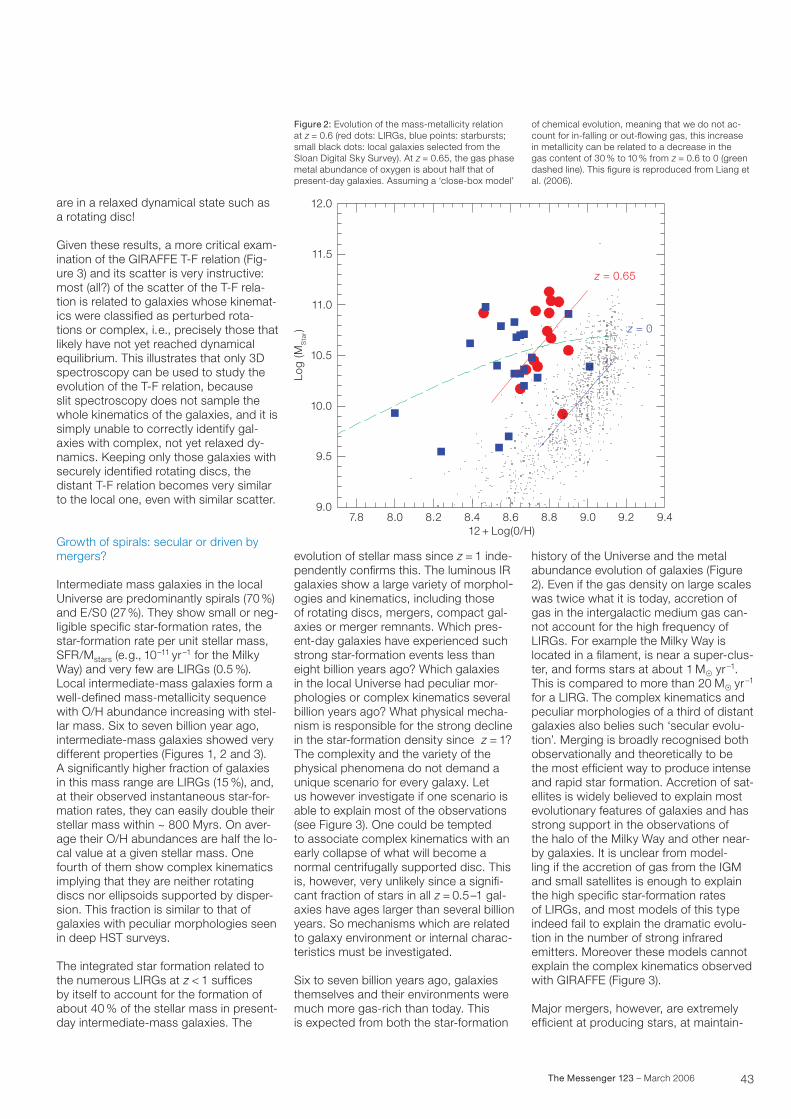
43The Messenger 123 – March 2006
are in a relaxed dynamical state such as a rotating disc!
Given these results, a more critical exam- ination of the GIRAFFE T-F relation (Fig-ure 3) and its scatter is very instructive: most (all?) of the scatter of the T-F rela-tion is related to galaxies whose kinemat-ics were classified as perturbed rota-tions or complex, i.e., precisely those that likely have not yet reached dynamical equilibrium. This illustrates that only 3D spectroscopy can be used to study the evolution of the T-F relation, because slit spectroscopy does not sample the whole kinematics of the galaxies, and it is simply unable to correctly identify gal- axies with complex, not yet relaxed dy- namics. Keeping only those galaxies with securely identified rotating discs, the distant T-F relation becomes very similar to the local one, even with similar scatter.
Growth of spirals: secular or driven by mergers?
Intermediate mass galaxies in the local Universe are predominantly spirals (70 %) and E/S0 (27%). They show small or neg-ligible specific star-formation rates, the star-formation rate per unit stellar mass, SFR/Mstars (e.g., 10–11 yr –1 for the Milky Way) and very few are LIRGs (0.5 %). Local intermediate-mass galaxies form a well-defined mass-metallicity sequence with O/H abundance increasing with stel-lar mass. Six to seven billion year ago, intermediate-mass galaxies showed very different properties (Figures 1, 2 and 3). A significantly higher fraction of galaxies in this mass range are LIRGs (15 %), and, at their observed instantaneous star-for-mation rates, they can easily double their stellar mass within ~ 800 Myrs. On aver-age their O/H abundances are half the lo- cal value at a given stellar mass. One fourth of them show complex kinematics implying that they are neither rotating discs nor ellipsoids supported by disper-sion. This fraction is similar to that of galaxies with peculiar morphologies seen in deep HST surveys.
The integrated star formation related to the numerous LIRGs at z < 1 suffices by itself to account for the formation of about 40 % of the stellar mass in present-day intermediate-mass galaxies. The
Figure 2: Evolution of the mass-metallicity relation at z = 0.6 (red dots: LIRGs, blue points: starbursts; small black dots: local galaxies selected from the Sloan Digital Sky Survey). At z = 0.65, the gas phase metal abundance of oxygen is about half that of present-day galaxies. Assuming a ‘close-box model’
of chemical evolution, meaning that we do not ac-count for in-falling or out-flowing gas, this increase in metallicity can be related to a decrease in the gas content of 30 % to 10 % from z = 0.6 to 0 (green dashed line). This figure is reproduced from Liang et al. (2006).
9.49.29.08.88.68.48.28.07.89.0
9.5
10.0
10.5
11.0
11.5
12.0
Log
(MS
tar)
z = 0.65
z = 0
12 + Log(0/H)
evolution of stellar mass since z = 1 inde- pendently confirms this. The luminous IR galaxies show a large variety of morphol-ogies and kinematics, including those of rotating discs, mergers, compact gal- axies or merger remnants. Which pres-ent-day galaxies have experienced such strong star-formation events less than eight billion years ago? Which galaxies in the local Universe had peculiar mor-phologies or complex kinematics several billion years ago? What physical mecha-nism is responsible for the strong decline in the star-formation density since z = 1? The complexity and the variety of the physical phenomena do not demand a unique scenario for every galaxy. Let us however investigate if one scenario is able to explain most of the observations (see Figure 3). One could be tempted to associate complex kinematics with an early collapse of what will become a normal centrifugally supported disc. This is, however, very unlikely since a signifi-cant fraction of stars in all z = 0.5–1 gal-axies have ages larger than several billion years. So mechanisms which are related to galaxy environment or internal charac-teristics must be investigated.
Six to seven billion years ago, galaxies themselves and their environments were much more gas-rich than today. This is expected from both the star-formation
history of the Universe and the metal abundance evolution of galaxies (Figure 2). Even if the gas density on large scales was twice what it is today, accretion of gas in the intergalactic medium gas can- not account for the high frequency of LIRGs. For example the Milky Way is located in a filament, is near a super-clus-ter, and forms stars at about 1 MA yr –1. This is compared to more than 20 MA yr –1 for a LIRG. The complex kinematics and peculiar morphologies of a third of distant galaxies also belies such ‘secular evolu-tion’. Merging is broadly recognised both observationally and theoretically to be the most efficient way to produce intense and rapid star formation. Accretion of sat- ellites is widely believed to explain most evolutionary features of galaxies and has strong support in the observations of the halo of the Milky Way and other near- by galaxies. It is unclear from model- ling if the accretion of gas from the IGM and small satellites is enough to explain the high specific star-formation rates of LIRGs, and most models of this type indeed fail to explain the dramatic evolu-tion in the number of strong infrared emitters. Moreover these models cannot explain the complex kinematics observed with GIRAFFE (Figure 3).
Major mergers, however, are extremely efficient at producing stars, at maintain-
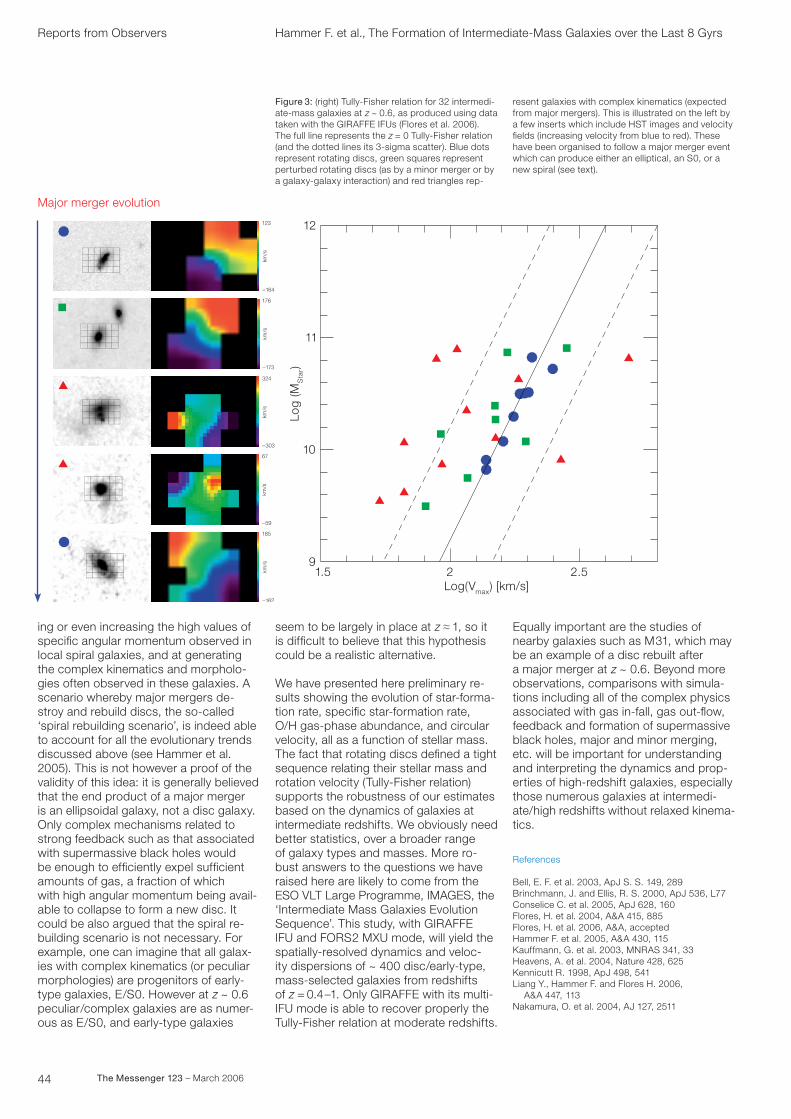
44 The Messenger 123 – March 2006
Reports from Observers Hammer F. et al., The Formation of Intermediate-Mass Galaxies over the Last 8 Gyrs
Figure 3: (right) Tully-Fisher relation for 32 intermedi-ate-mass galaxies at z ~ 0.6, as produced using data taken with the GIRAFFE IFUs (Flores et al. 2006). The full line represents the z = 0 Tully-Fisher relation (and the dotted lines its 3-sigma scatter). Blue dots represent rotating discs, green squares represent perturbed rotating discs (as by a minor merger or by a galaxy-galaxy interaction) and red triangles rep-
resent galaxies with complex kinematics (expected from major mergers). This is illustrated on the left by a few inserts which include HST images and velocity fields (increasing velocity from blue to red). These have been organised to follow a major merger event which can produce either an elliptical, an S0, or a new spiral (see text).
1.59
10
11
12
2Log(Vmax) [km/s]
2.5
Log
(MS
tar)
–303
324
km/s
–173
176
km/s
–59
67
km/s
–162
185
km/s
Major merger evolution
–164
123
km/s
ing or even increasing the high values of specific angular momentum observed in local spiral galaxies, and at generating the complex kinematics and morpholo-gies often observed in these galaxies. A scenario whereby major mergers de- stroy and rebuild discs, the so-called ‘spiral rebuilding scenario’, is indeed able to account for all the evolutionary trends discussed above (see Hammer et al. 2005). This is not however a proof of the validity of this idea: it is generally believed that the end product of a major merger is an ellipsoidal galaxy, not a disc galaxy. Only complex mechanisms related to strong feedback such as that associated with supermassive black holes would be enough to efficiently expel sufficient amounts of gas, a fraction of which with high angular momentum being avail- able to collapse to form a new disc. It could be also argued that the spiral re- building scenario is not necessary. For example, one can imagine that all galax-ies with complex kinematics (or peculiar morphologies) are progenitors of early- type galaxies, E/S0. However at z ~ 0.6 peculiar/complex galaxies are as numer-ous as E/S0, and early-type galaxies
seem to be largely in place at z ≈ 1, so it is difficult to believe that this hypothesis could be a realistic alternative.
We have presented here preliminary re- sults showing the evolution of star-forma-tion rate, specific star-formation rate, O/H gas-phase abundance, and circular velocity, all as a function of stellar mass. The fact that rotating discs defined a tight sequence relating their stellar mass and rotation velocity (Tully-Fisher relation) supports the robustness of our estimates based on the dynamics of galaxies at intermediate redshifts. We obviously need better statistics, over a broader range of galaxy types and masses. More ro- bust answers to the questions we have raised here are likely to come from the ESO VLT Large Programme, IMAGES, the ‘Intermediate Mass Galaxies Evolution Sequence’. This study, with GIRAFFE IFU and FORS2 MXU mode, will yield the spatially-resolved dynamics and veloc-ity dispersions of ~ 400 disc/early-type, mass-selected galaxies from redshifts of z = 0.4–1. Only GIRAFFE with its multi-IFU mode is able to recover properly the Tully-Fisher relation at moderate redshifts.
Equally important are the studies of nearby galaxies such as M31, which may be an example of a disc rebuilt after a major merger at z ~ 0.6. Beyond more observations, comparisons with simula-tions including all of the complex physics associated with gas in-fall, gas out-flow, feedback and formation of supermassive black holes, major and minor merging, etc. will be important for understanding and interpreting the dynamics and prop-erties of high-redshift galaxies, especially those numerous galaxies at intermedi-ate/high redshifts without relaxed kinema-tics.
References
Bell, E. F. et al. 2003, ApJ S. S. 149, 289Brinchmann, J. and Ellis, R. S. 2000, ApJ 536, L77Conselice C. et al. 2005, ApJ 628, 160Flores, H. et al. 2004, A&A 415, 885Flores, H. et al. 2006, A&A, acceptedHammer F. et al. 2005, A&A 430, 115Kauffmann, G. et al. 2003, MNRAS 341, 33Heavens, A. et al. 2004, Nature 428, 625Kennicutt R. 1998, ApJ 498, 541Liang Y., Hammer F. and Flores H. 2006, A&A 447, 113Nakamura, O. et al. 2004, AJ 127, 2511
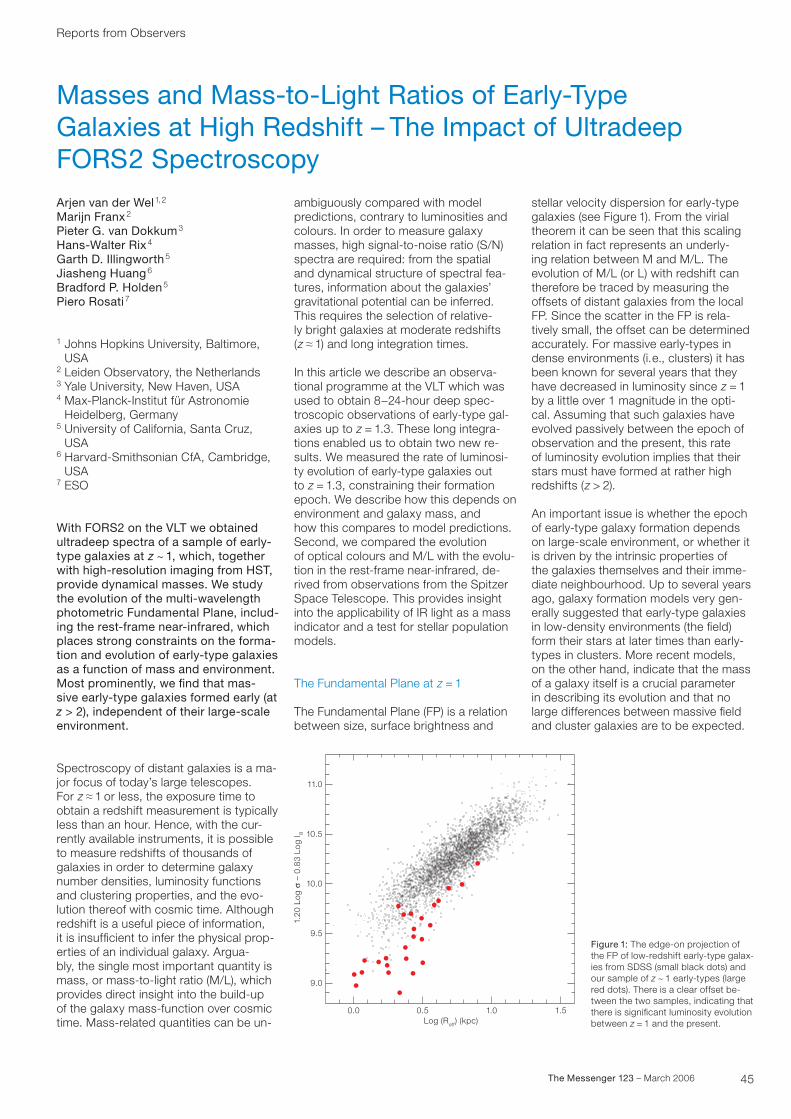
45The Messenger 123 – March 2006
Reports from Observers
Masses and Mass-to-Light Ratios of Early-Type Galaxies at High Redshift – The Impact of Ultradeep FORS2 SpectroscopyArjen van der Wel1,2
Marijn Franx2
Pieter G. van Dokkum3
Hans-Walter Rix 4
Garth D. Illingworth 5
Jiasheng Huang6
Bradford P. Holden5
Piero Rosati7
1 Johns Hopkins University, Baltimore, USA
2 Leiden Observatory, the Netherlands3 Yale University, New Haven, USA4 Max-Planck-Institut für Astronomie
Heidelberg, Germany5 University of California, Santa Cruz,
USA6 Harvard-Smithsonian CfA, Cambridge,
USA7 ESO
With FORS2 on the VLT we obtained ultradeep spectra of a sample of early-type galaxies at z ~ 1, which, together with high-resolution imaging from HST, provide dynamical masses. We study the evolution of the multi-wavelength photometric Fundamental Plane, includ-ing the rest-frame near-infrared, which places strong constraints on the forma-tion and evolution of early-type galaxies as a function of mass and environment. Most prominently, we find that mas- sive early-type galaxies formed early (at z > 2), independent of their large-scale environment.
Spectroscopy of distant galaxies is a ma-jor focus of today’s large telescopes. For z ≈ 1 or less, the exposure time to obtain a redshift measurement is typically less than an hour. Hence, with the cur-rently available instruments, it is possible to measure redshifts of thousands of galaxies in order to determine galaxy number densities, luminosity functions and clustering properties, and the evo-lution thereof with cosmic time. Although redshift is a useful piece of information, it is insufficient to infer the physical prop-erties of an individual galaxy. Argua- bly, the single most important quantity is mass, or mass-to-light ratio (M/L), which provides direct insight into the build-up of the galaxy mass-function over cosmic time. Mass-related quantities can be un-
ambiguously compared with model predictions, contrary to luminosities and colours. In order to measure galaxy masses, high signal-to-noise ratio (S/N) spectra are required: from the spatial and dynamical structure of spectral fea- tures, information about the galaxies’ gravitational potential can be inferred. This requires the selection of relative- ly bright galaxies at moderate redshifts (z ≈ 1) and long integration times.
In this article we describe an observa-tional programme at the VLT which was used to obtain 8−24-hour deep spec- troscopic observations of early-type gal- axies up to z = 1.3. These long integra-tions enabled us to obtain two new re- sults. We measured the rate of luminosi-ty evolution of early-type galaxies out to z = 1.3, constraining their formation epoch. We describe how this depends on environment and galaxy mass, and how this compares to model predictions. Second, we compared the evolution of optical colours and M/L with the evolu-tion in the rest-frame near-infrared, de-rived from observations from the Spitzer Space Telescope. This provides insight into the applicability of IR light as a mass indicator and a test for stellar population models.
The Fundamental Plane at z = 1
The Fundamental Plane (FP) is a relation between size, surface brightness and
stellar velocity dispersion for early-type galaxies (see Figure 1). From the virial theorem it can be seen that this scaling relation in fact represents an underly-ing relation between M and M/L. The evolution of M/L (or L) with redshift can therefore be traced by measuring the offsets of distant galaxies from the local FP. Since the scatter in the FP is rela- tively small, the offset can be determined accurately. For massive early-types in dense environments (i.e., clusters) it has been known for several years that they have decreased in luminosity since z = 1 by a little over 1 magnitude in the opti-cal. Assuming that such galaxies have evolved passively between the epoch of observation and the present, this rate of luminosity evolution implies that their stars must have formed at rather high redshifts (z > 2).
An important issue is whether the epoch of early-type galaxy formation depends on large-scale environment, or whether it is driven by the intrinsic properties of the galaxies themselves and their imme-diate neighbourhood. Up to several years ago, galaxy formation models very gen-erally suggested that early-type galaxies in low-density environments (the field) form their stars at later times than early-types in clusters. More recent models, on the other hand, indicate that the mass of a galaxy itself is a crucial parameter in describing its evolution and that no large differences between massive field and cluster galaxies are to be expected.
Figure 1: The edge-on projection of the FP of low-redshift early-type galax-ies from SDSS (small black dots) and our sample of z ~ 1 early-types (large red dots). There is a clear offset be-tween the two samples, indicating that there is significant luminosity evolution between z = 1 and the present.
0.0 0.5 1.0 1.5Log (Reff) (kpc)
9.0
9.5
10.0
10.5
11.0
1.20
Log
σ –
0.8
3 Lo
g I B
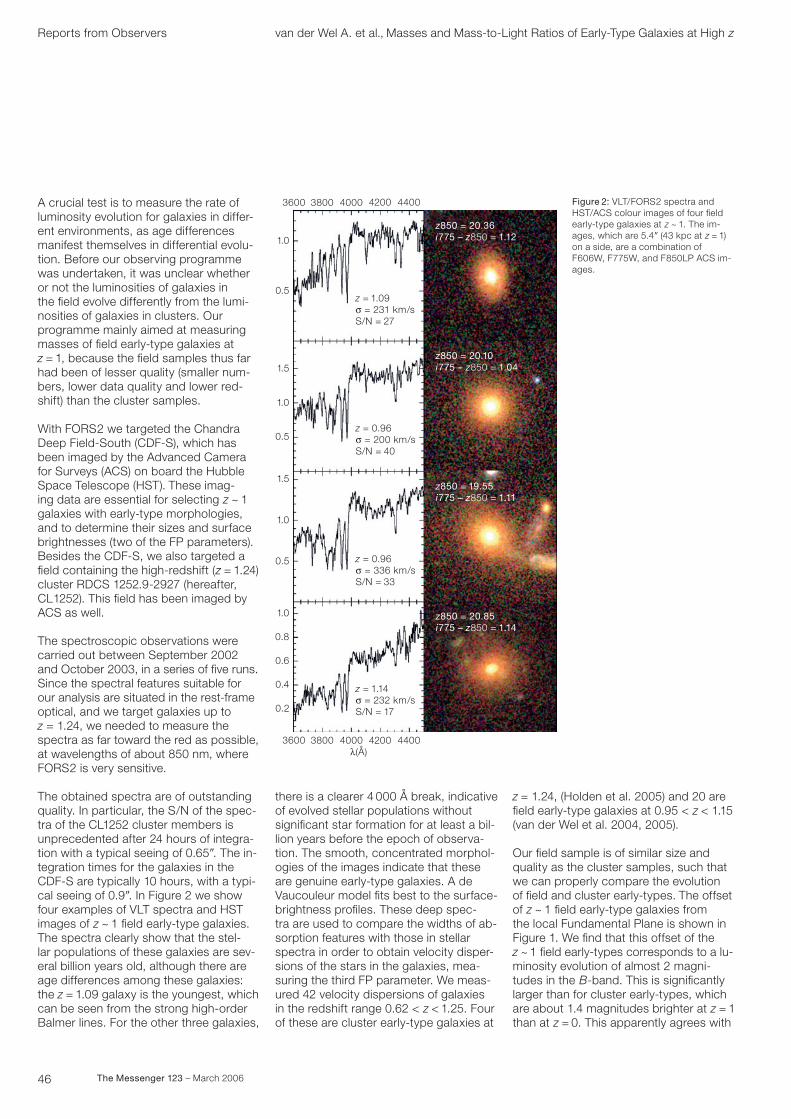
46 The Messenger 123 – March 2006
A crucial test is to measure the rate of luminosity evolution for galaxies in differ- ent environments, as age differences manifest themselves in differential evolu- tion. Before our observing programme was undertaken, it was unclear whether or not the luminosities of galaxies in the field evolve differently from the lumi- nosities of galaxies in clusters. Our programme mainly aimed at measuring masses of field early-type galaxies at z = 1, because the field samples thus far had been of lesser quality (smaller num- bers, lower data quality and lower red-shift) than the cluster samples.
With FORS2 we targeted the Chandra Deep Field-South (CDF-S), which has been imaged by the Advanced Camera for Surveys (ACS) on board the Hubble Space Telescope (HST). These imag-ing data are essential for selecting z ~ 1 galaxies with early-type morphologies, and to determine their sizes and surface brightnesses (two of the FP parameters). Besides the CDF-S, we also targeted a field containing the high-redshift (z = 1.24) cluster RDCS 1252.9-2927 (hereafter, CL1252). This field has been imaged by ACS as well.
The spectroscopic observations were carried out between September 2002 and October 2003, in a series of five runs. Since the spectral features suitable for our analysis are situated in the rest-frame optical, and we target galaxies up to z = 1.24, we needed to measure the spectra as far toward the red as possible, at wavelengths of about 850 nm, where FORS2 is very sensitive.
The obtained spectra are of outstanding quality. In particular, the S/N of the spec-tra of the CL1252 cluster members is unprecedented after 24 hours of integra-tion with a typical seeing of 0.65?. The in- tegration times for the galaxies in the CDF-S are typically 10 hours, with a typi-cal seeing of 0.9?. In Figure 2 we show four examples of VLT spectra and HST images of z ~ 1 field early-type galaxies. The spectra clearly show that the stel- lar populations of these galaxies are sev-eral billion years old, although there are age differences among these galaxies: the z = 1.09 galaxy is the youngest, which can be seen from the strong high-order Balmer lines. For the other three galaxies,
Reports from Observers van der Wel A. et al., Masses and Mass-to-Light Ratios of Early-Type Galaxies at High z
there is a clearer 4 000 Å break, indicative of evolved stellar populations without significant star formation for at least a bil- lion years before the epoch of observa-tion. The smooth, concentrated morphol- ogies of the images indicate that these are genuine early-type galaxies. A de Vaucouleur model fits best to the surface- brightness profiles. These deep spec- tra are used to compare the widths of ab- sorption features with those in stellar spectra in order to obtain velocity disper-sions of the stars in the galaxies, mea-suring the third FP parameter. We meas-ured 42 velocity dispersions of galaxies in the redshift range 0.62 < z < 1.25. Four of these are cluster early-type galaxies at
z = 1.24, (Holden et al. 2005) and 20 are field early-type galaxies at 0.95 < z < 1.15 (van der Wel et al. 2004, 2005).
Our field sample is of similar size and quality as the cluster samples, such that we can properly compare the evolution of field and cluster early-types. The offset of z ~ 1 field early-type galaxies from the local Fundamental Plane is shown in Figure 1. We find that this offset of the z ~ 1 field early-types corresponds to a lu- minosity evolution of almost 2 magni-tudes in the B-band. This is significantly larger than for cluster early-types, which are about 1.4 magnitudes brighter at z = 1 than at z = 0. This apparently agrees with
Figure 2: VLT/FORS2 spectra and HST/ACS colour images of four field early-type galaxies at z ~ 1. The im- ages, which are 5.4? (43 kpc at z = 1) on a side, are a combination of F606W, F775W, and F850LP ACS im- ages.
38003600 4000 4200 4400λ(Å)
0.2
0.4
0.6
0.8
1.0
0.5
1.0
1.5
0.5
1.0
1.5
0.5
1.0
z850 = 20.36i775 – z850 = 1.12
z = 1.14σ = 232 km/sS/N = 17
z850 = 20.10i775 – z850 = 1.04
z850 = 19.55i775 – z850 = 1.11
z850 = 20.85i775 – z850 = 1.14
z = 0.96σ = 336 km/sS/N = 33
z = 0.96σ = 200 km/sS/N = 40
z = 1.09σ = 231 km/sS/N = 27
38003600 4000 4200 4400
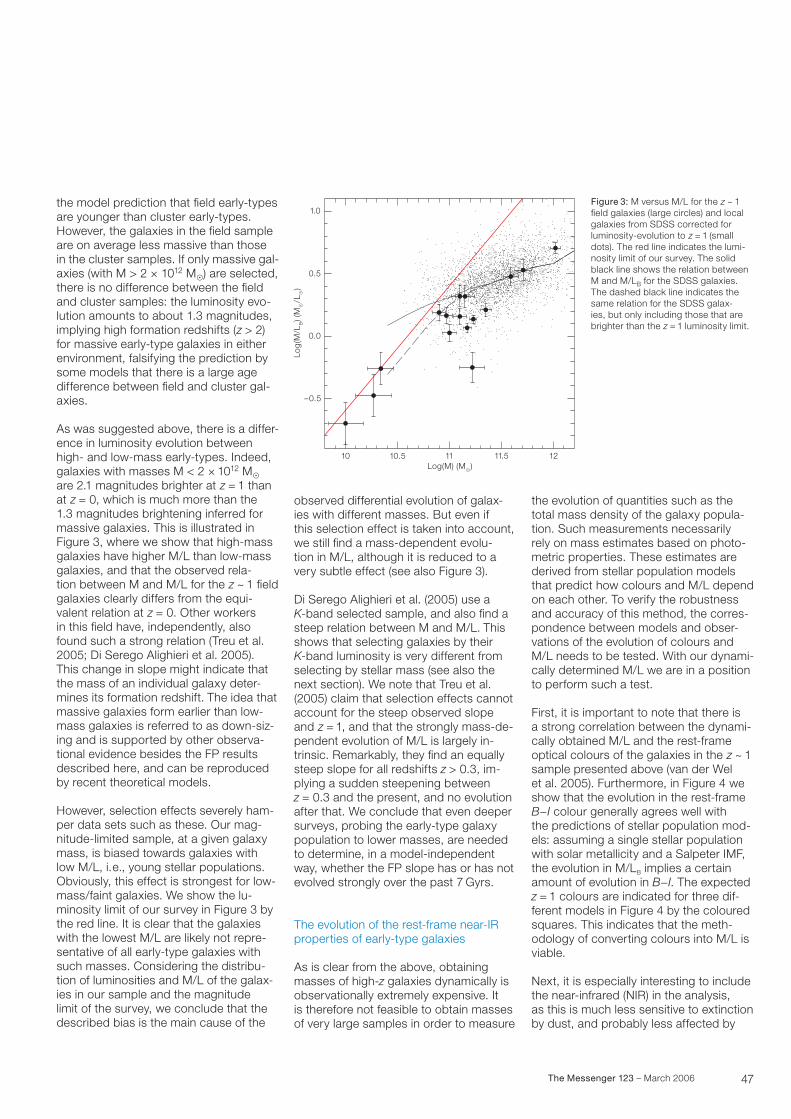
47The Messenger 123 – March 2006
the model prediction that field early-types are younger than cluster early-types. However, the galaxies in the field sample are on average less massive than those in the cluster samples. If only massive gal-axies (with M > 2 × 10¹² MA) are selected, there is no difference between the field and cluster samples: the luminosity evo- lution amounts to about 1.3 magnitudes, implying high formation redshifts (z > 2) for massive early-type galaxies in either environment, falsifying the prediction by some models that there is a large age difference between field and cluster gal-axies.
As was suggested above, there is a differ-ence in luminosity evolution between high- and low-mass early-types. Indeed, galaxies with masses M < 2 × 10¹² MA are 2.1 magnitudes brighter at z = 1 than at z = 0, which is much more than the 1.3 magnitudes brightening inferred for massive galaxies. This is illustrated in Figure 3, where we show that high-mass galaxies have higher M/L than low-mass galaxies, and that the observed rela- tion between M and M/L for the z ~ 1 field galaxies clearly differs from the equi-valent relation at z = 0. Other workers in this field have, independently, also found such a strong relation (Treu et al. 2005; Di Serego Alighieri et al. 2005). This change in slope might indicate that the mass of an individual galaxy deter-mines its formation redshift. The idea that massive galaxies form earlier than low-mass galaxies is referred to as down-siz-ing and is supported by other observa-tional evidence besides the FP results described here, and can be reproduced by recent theoretical models.
However, selection effects severely ham- per data sets such as these. Our mag-nitude-limited sample, at a given galaxy mass, is biased towards galaxies with low M/L, i.e., young stellar populations. Obviously, this effect is strongest for low- mass/faint galaxies. We show the lu-minosity limit of our survey in Figure 3 by the red line. It is clear that the galaxies with the lowest M/L are likely not repre-sentative of all early-type galaxies with such masses. Considering the distribu-tion of luminosities and M/L of the galax-ies in our sample and the magnitude limit of the survey, we conclude that the described bias is the main cause of the
observed differential evolution of galax- ies with different masses. But even if this selection effect is taken into account, we still find a mass-dependent evolu- tion in M/L, although it is reduced to a very subtle effect (see also Figure 3).
Di Serego Alighieri et al. (2005) use a K-band selected sample, and also find a steep relation between M and M/L. This shows that selecting galaxies by their K-band luminosity is very different from selecting by stellar mass (see also the next section). We note that Treu et al. (2005) claim that selection effects cannot account for the steep observed slope and z = 1, and that the strongly mass-de- pendent evolution of M/L is largely in-trinsic. Remarkably, they find an equally steep slope for all redshifts z > 0.3, im-plying a sudden steepening between z = 0.3 and the present, and no evolution after that. We conclude that even deeper surveys, probing the early-type galaxy population to lower masses, are needed to determine, in a model-independent way, whether the FP slope has or has not evolved strongly over the past 7 Gyrs.
The evolution of the rest-frame near-IR properties of early-type galaxies
As is clear from the above, obtaining masses of high-z galaxies dynamically is observationally extremely expensive. It is therefore not feasible to obtain masses of very large samples in order to measure
the evolution of quantities such as the total mass density of the galaxy popula-tion. Such measurements necessarily rely on mass estimates based on photo-metric properties. These estimates are derived from stellar population models that predict how colours and M/L depend on each other. To verify the robustness and accuracy of this method, the corres-pondence between models and obser-vations of the evolution of colours and M/L needs to be tested. With our dynami-cally determined M/L we are in a position to perform such a test.
First, it is important to note that there is a strong correlation between the dynami-cally obtained M/L and the rest-frame optical colours of the galaxies in the z ~ 1 sample presented above (van der Wel et al. 2005). Furthermore, in Figure 4 we show that the evolution in the rest-frame B−I colour generally agrees well with the predictions of stellar population mod-els: assuming a single stellar population with solar metallicity and a Salpeter IMF, the evolution in M/LB implies a certain amount of evolution in B−I. The expected z = 1 colours are indicated for three dif-ferent models in Figure 4 by the coloured squares. This indicates that the meth-odology of converting colours into M/L is viable.
Next, it is especially interesting to include the near-infrared (NIR) in the analysis, as this is much less sensitive to extinction by dust, and probably less affected by
Figure 3: M versus M/L for the z ~ 1 field galaxies (large circles) and local galaxies from SDSS corrected for luminosity-evolution to z = 1 (small dots). The red line indicates the lumi-nosity limit of our survey. The solid black line shows the relation between M and M/LB for the SDSS galaxies. The dashed black line indicates the same relation for the SDSS galax-ies, but only including those that are brighter than the z = 1 luminosity limit.
1211.51110.510
–0.5
Log(M) (M�)
0.0
0.5
1.0
Log
(M/L
B) (
M�/L
�)
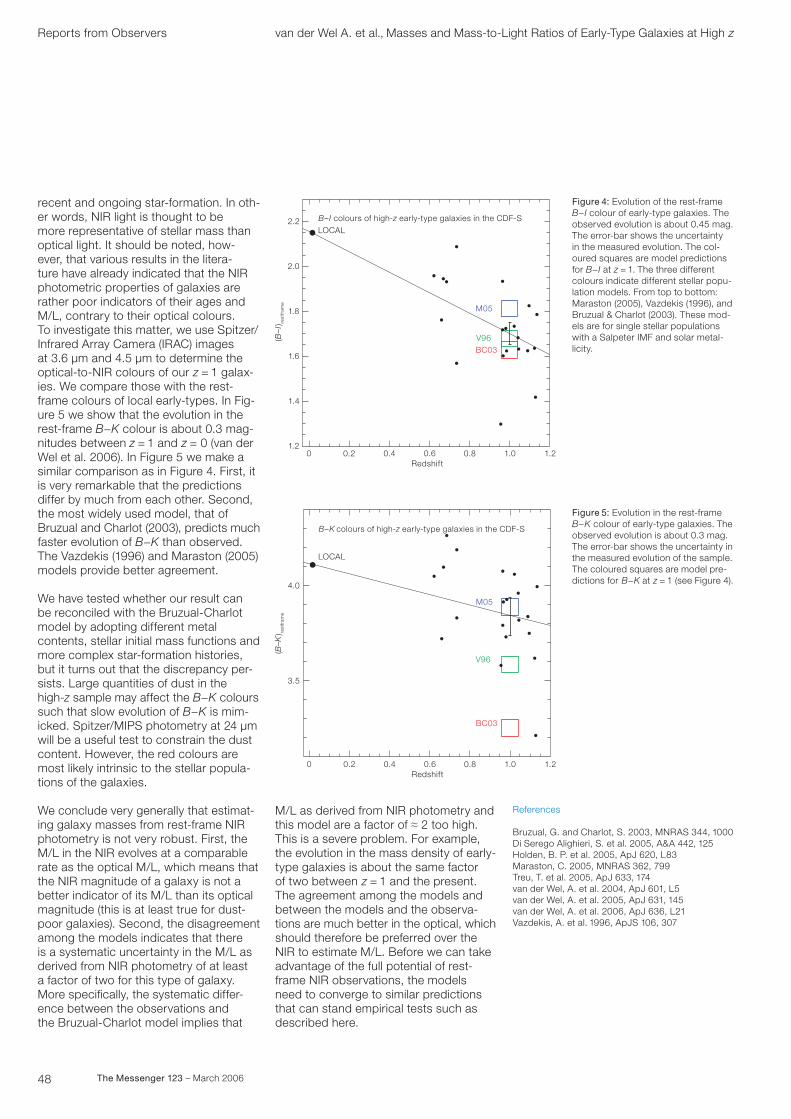
48 The Messenger 123 – March 2006
recent and ongoing star-formation. In oth- er words, NIR light is thought to be more representative of stellar mass than optical light. It should be noted, how- ever, that various results in the litera- ture have already indicated that the NIR photometric properties of galaxies are rather poor indicators of their ages and M/L, contrary to their optical colours. To investigate this matter, we use Spitzer/ Infrared Array Camera (IRAC) images at 3.6 μm and 4.5 μm to determine the optical-to-NIR colours of our z = 1 galax- ies. We compare those with the rest-frame colours of local early-types. In Fig- ure 5 we show that the evolution in the rest-frame B−K colour is about 0.3 mag-nitudes between z = 1 and z = 0 (van der Wel et al. 2006). In Figure 5 we make a similar comparison as in Figure 4. First, it is very remarkable that the predictions differ by much from each other. Second, the most widely used model, that of Bruzual and Charlot (2003), predicts much faster evolution of B−K than observed. The Vazdekis (1996) and Maraston (2005) models provide better agreement.
We have tested whether our result can be reconciled with the Bruzual-Charlot model by adopting different metal contents, stellar initial mass functions and more complex star-formation histories, but it turns out that the discrepancy per- sists. Large quantities of dust in the high-z sample may affect the B−K colours such that slow evolution of B−K is mim-icked. Spitzer/MIPS photometry at 24 μm will be a useful test to constrain the dust content. However, the red colours are most likely intrinsic to the stellar popula-tions of the galaxies.
We conclude very generally that estimat-ing galaxy masses from rest-frame NIR photometry is not very robust. First, the M/L in the NIR evolves at a comparable rate as the optical M/L, which means that the NIR magnitude of a galaxy is not a better indicator of its M/L than its optical magnitude (this is at least true for dust-poor galaxies). Second, the disagreement among the models indicates that there is a systematic uncertainty in the M/L as derived from NIR photometry of at least a factor of two for this type of galaxy. More specifically, the systematic differ-ence between the observations and the Bruzual-Charlot model implies that
M/L as derived from NIR photometry and this model are a factor of ≈ 2 too high. This is a severe problem. For example, the evolution in the mass density of early-type galaxies is about the same factor of two between z = 1 and the present. The agreement among the models and between the models and the observa-tions are much better in the optical, which should therefore be preferred over the NIR to estimate M/L. Before we can take advantage of the full potential of rest-frame NIR observations, the models need to converge to similar predictions that can stand empirical tests such as described here.
Reports from Observers van der Wel A. et al., Masses and Mass-to-Light Ratios of Early-Type Galaxies at High z
References
Bruzual, G. and Charlot, S. 2003, MNRAS 344, 1000Di Serego Alighieri, S. et al. 2005, A&A 442, 125Holden, B. P. et al. 2005, ApJ 620, L83Maraston, C. 2005, MNRAS 362, 799Treu, T. et al. 2005, ApJ 633, 174van der Wel, A. et al. 2004, ApJ 601, L5van der Wel, A. et al. 2005, ApJ 631, 145van der Wel, A. et al. 2006, ApJ 636, L21Vazdekis, A. et al. 1996, ApJS 106, 307
Figure 5: Evolution in the rest-frame B−K colour of early-type galaxies. The observed evolution is about 0.3 mag. The error-bar shows the uncertainty in the measured evolution of the sample. The coloured squares are model pre-dictions for B−K at z = 1 (see Figure 4).
Figure 4: Evolution of the rest-frame B−I colour of early-type galaxies. The observed evolution is about 0.45 mag. The error-bar shows the uncertainty in the measured evolution. The col-oured squares are model predictions for B−I at z = 1. The three different colours indicate different stellar popu-lation models. From top to bottom: Maraston (2005), Vazdekis (1996), and Bruzual & Charlot (2003). These mod- els are for single stellar populations with a Salpeter IMF and solar metal-licity.
0.4
1.4
1.6
1.8
2.0
2.2
Redshift
M05
V96BC03
1.21.00.80.60.201.2
(B–I
) rest
fram
e
LOCALB–I colours of high-z early-type galaxies in the CDF-S
M05
V96
BC03
(B–K
) rest
fram
e
LOCAL
3.5
4.0
B–K colours of high-z early-type galaxies in the CDF-S
0.4Redshift
1.21.00.80.60.20
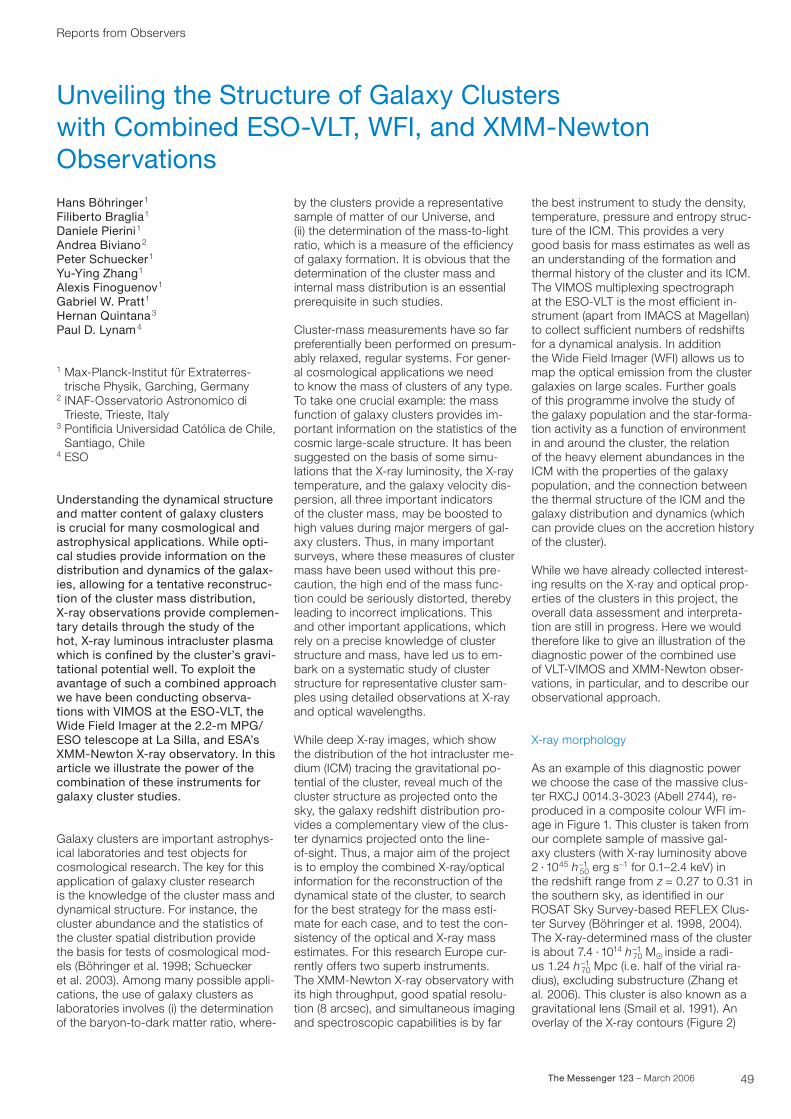
49The Messenger 123 – March 2006
Reports from Observers
Unveiling the Structure of Galaxy Clusters with Combined ESO-VLT, WFI, and XMM-Newton ObservationsHans Böhringer1 Filiberto Braglia1 Daniele Pierini1 Andrea Biviano2 Peter Schuecker1 Yu-Ying Zhang1 Alexis Finoguenov1 Gabriel W. Pratt1 Hernan Quintana 3 Paul D. Lynam 4
1 Max-Planck-Institut für Extraterres-trische Physik, Garching, Germany
2 INAF-Osservatorio Astronomico di Trieste, Trieste, Italy
3 Pontificia Universidad Católica de Chile, Santiago, Chile
4 ESO
Understanding the dynamical structure and matter content of galaxy clusters is crucial for many cosmological and astrophysical applications. While opti-cal studies provide information on the distribution and dynamics of the galax-ies, allowing for a tentative reconstruc-tion of the cluster mass distribution, X-ray observations provide complemen-tary details through the study of the hot, X-ray luminous intracluster plasma which is confined by the cluster’s gravi-tational potential well. To exploit the avantage of such a combined approach we have been conducting observa- tions with VIMOS at the ESO-VLT, the Wide Field Imager at the 2.2-m MPG/ESO telescope at La Silla, and ESA’s XMM-Newton X-ray observatory. In this article we illustrate the power of the combination of these instruments for galaxy cluster studies.
Galaxy clusters are important astrophys-ical laboratories and test objects for cosmological research. The key for this application of galaxy cluster research is the knowledge of the cluster mass and dynamical structure. For instance, the cluster abundance and the statistics of the cluster spatial distribution provide the basis for tests of cosmological mod-els (Böhringer et al. 1998; Schuecker et al. 2003). Among many possible appli- cations, the use of galaxy clusters as laboratories involves (i) the determination of the baryon-to-dark matter ratio, where-
by the clusters provide a representative sample of matter of our Universe, and (ii) the determination of the mass-to-light ratio, which is a measure of the efficiency of galaxy formation. It is obvious that the determination of the cluster mass and internal mass distribution is an essential prerequisite in such studies.
Cluster-mass measurements have so far preferentially been performed on presum- ably relaxed, regular systems. For gener-al cosmological applications we need to know the mass of clusters of any type. To take one crucial example: the mass function of galaxy clusters provides im-portant information on the statistics of the cosmic large-scale structure. It has been suggested on the basis of some simu- lations that the X-ray luminosity, the X-ray temperature, and the galaxy velocity dis- persion, all three important indicators of the cluster mass, may be boosted to high values during major mergers of gal- axy clusters. Thus, in many important surveys, where these measures of cluster mass have been used without this pre-caution, the high end of the mass func-tion could be seriously distorted, thereby leading to incorrect implications. This and other important applications, which rely on a precise knowledge of cluster structure and mass, have led us to em-bark on a systematic study of cluster structure for representative cluster sam-ples using detailed observations at X-ray and optical wavelengths.
While deep X-ray images, which show the distribution of the hot intracluster me- dium (ICM) tracing the gravitational po- tential of the cluster, reveal much of the cluster structure as projected onto the sky, the galaxy redshift distribution pro- vides a complementary view of the clus-ter dynamics projected onto the line- of-sight. Thus, a major aim of the project is to employ the combined X-ray/optical information for the reconstruction of the dynamical state of the cluster, to search for the best strategy for the mass esti-mate for each case, and to test the con- sistency of the optical and X-ray mass estimates. For this research Europe cur-rently offers two superb instruments. The XMM-Newton X-ray observatory with its high throughput, good spatial resolu-tion (8 arcsec), and simultaneous imaging and spectroscopic capabilities is by far
the best instrument to study the density, temperature, pressure and entropy struc-ture of the ICM. This provides a very good basis for mass estimates as well as an understanding of the formation and thermal history of the cluster and its ICM. The VIMOS multiplexing spectrograph at the ESO-VLT is the most efficient in-strument (apart from IMACS at Magellan) to collect sufficient numbers of redshifts for a dynamical analysis. In addition the Wide Field Imager (WFI) allows us to map the optical emission from the cluster galaxies on large scales. Further goals of this programme involve the study of the galaxy population and the star-forma-tion activity as a function of environment in and around the cluster, the relation of the heavy element abundances in the ICM with the properties of the galaxy population, and the connection between the thermal structure of the ICM and the galaxy distribution and dynamics (which can provide clues on the accretion history of the cluster).
While we have already collected interest-ing results on the X-ray and optical prop- erties of the clusters in this project, the overall data assessment and interpreta-tion are still in progress. Here we would therefore like to give an illustration of the diagnostic power of the combined use of VLT-VIMOS and XMM-Newton obser-vations, in particular, and to describe our observational approach.
X-ray morphology
As an example of this diagnostic power we choose the case of the massive clus- ter RXCJ 0014.3-3023 (Abell 2744), re- produced in a composite colour WFI im- age in Figure 1. This cluster is taken from our complete sample of massive gal- axy clusters (with X-ray luminosity above 2 · 1045 h−1
50 erg s−1 for 0.1–2.4 keV) in the redshift range from z = 0.27 to 0.31 in the southern sky, as identified in our ROSAT Sky Survey-based REFLEX Clus- ter Survey (Böhringer et al. 1998, 2004). The X-ray-determined mass of the cluster is about 7.4 · 1014 h−1
70 MA inside a radi- us 1.24 h−1
70 Mpc (i.e. half of the virial ra-dius), excluding substructure (Zhang et al. 2006). This cluster is also known as a gravitational lens (Smail et al. 1991). An overlay of the X-ray contours (Figure 2)
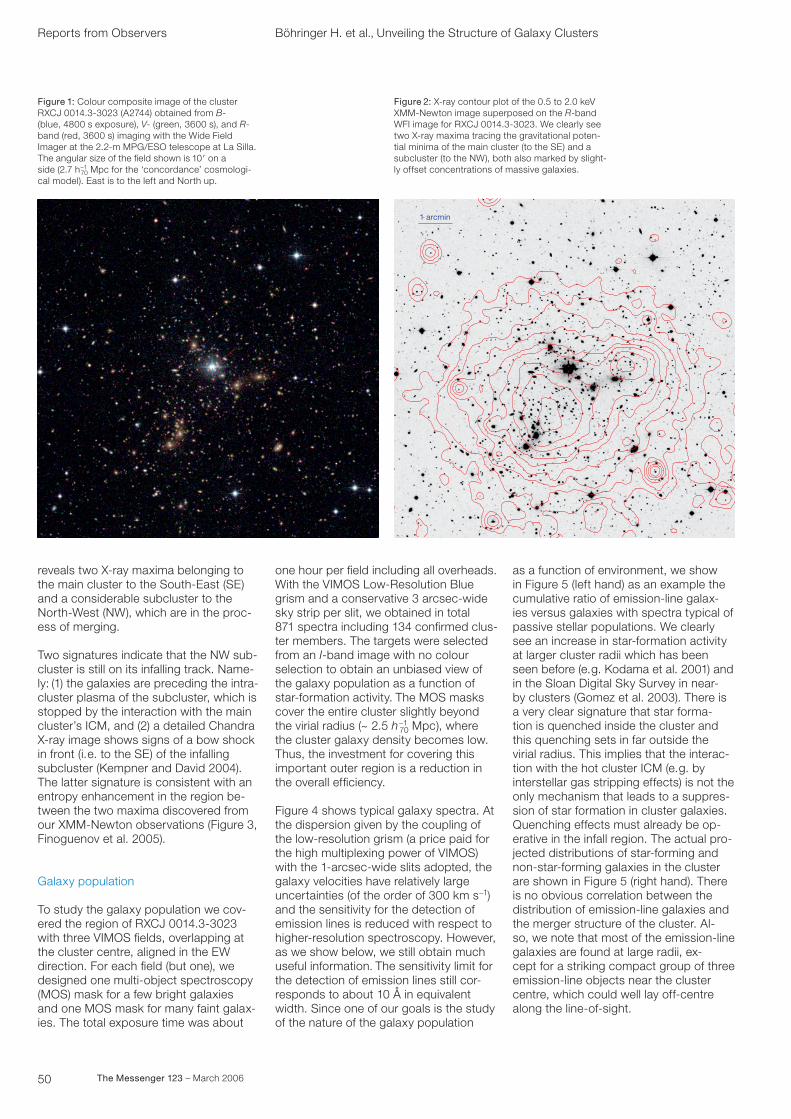
50 The Messenger 123 – March 2006
Reports from Observers Böhringer H. et al., Unveiling the Structure of Galaxy Clusters
reveals two X-ray maxima belonging to the main cluster to the South-East (SE) and a considerable subcluster to the North-West (NW), which are in the proc-ess of merging.
Two signatures indicate that the NW sub- cluster is still on its infalling track. Name-ly: (1) the galaxies are preceding the intra-cluster plasma of the subcluster, which is stopped by the interaction with the main cluster’s ICM, and (2) a detailed Chandra X-ray image shows signs of a bow shock in front (i.e. to the SE) of the infalling subcluster (Kempner and David 2004). The latter signature is consistent with an entropy enhancement in the region be-tween the two maxima discovered from our XMM-Newton observations (Figure 3, Finoguenov et al. 2005).
Galaxy population
To study the galaxy population we cov-ered the region of RXCJ 0014.3-3023 with three VIMOS fields, overlapping at the cluster centre, aligned in the EW direction. For each field (but one), we designed one multi-object spectroscopy (MOS) mask for a few bright galaxies and one MOS mask for many faint galax-ies. The total exposure time was about
1 arcmin
Figure 2: X-ray contour plot of the 0.5 to 2.0 keV XMM-Newton image superposed on the R-band WFI image for RXCJ 0014.3-3023. We clearly see two X-ray maxima tracing the gravitational poten- tial minima of the main cluster (to the SE) and a subcluster (to the NW), both also marked by slight- ly offset concentrations of massive galaxies.
one hour per field including all overheads. With the VIMOS Low-Resolution Blue grism and a conservative 3 arcsec-wide sky strip per slit, we obtained in total 871 spectra including 134 confirmed clus-ter members. The targets were selected from an I-band image with no colour selection to obtain an unbiased view of the galaxy population as a function of star-formation activity. The MOS masks cover the entire cluster slightly beyond the virial radius (~ 2.5 h−1
70 Mpc), where the cluster galaxy density becomes low. Thus, the investment for covering this important outer region is a reduction in the overall efficiency.
Figure 4 shows typical galaxy spectra. At the dispersion given by the coupling of the low-resolution grism (a price paid for the high multiplexing power of VIMOS) with the 1-arcsec-wide slits adopted, the galaxy velocities have relatively large uncertainties (of the order of 300 km s−1) and the sensitivity for the detection of emission lines is reduced with respect to higher-resolution spectroscopy. However, as we show below, we still obtain much useful information. The sensitivity limit for the detection of emission lines still cor- responds to about 10 Å in equivalent width. Since one of our goals is the study of the nature of the galaxy population
as a function of environment, we show in Figure 5 (left hand) as an example the cumulative ratio of emission-line galax- ies versus galaxies with spectra typical of passive stellar populations. We clearly see an increase in star-formation activity at larger cluster radii which has been seen before (e.g. Kodama et al. 2001) and in the Sloan Digital Sky Survey in near- by clusters (Gomez et al. 2003). There is a very clear signature that star forma- tion is quenched inside the cluster and this quenching sets in far outside the virial radius. This implies that the interac-tion with the hot cluster ICM (e.g. by interstellar gas stripping effects) is not the only mechanism that leads to a suppres-sion of star formation in cluster galaxies. Quenching effects must already be op-erative in the infall region. The actual pro-jected distributions of star-forming and non-star-forming galaxies in the cluster are shown in Figure 5 (right hand). There is no obvious correlation between the distribution of emission-line galaxies and the merger structure of the cluster. Al- so, we note that most of the emission-line galaxies are found at large radii, ex- cept for a striking compact group of three emission-line objects near the cluster centre, which could well lay off-centre along the line-of-sight.
Figure 1: Colour composite image of the cluster RXCJ 0014.3-3023 (A2744) obtained from B- (blue, 4800 s exposure), V- (green, 3600 s), and R- band (red, 3600 s) imaging with the Wide Field Imager at the 2.2-m MPG/ESO telescope at La Silla. The angular size of the field shown is 10; on a side (2.7 h−1
70 Mpc for the ‘concordance’ cosmologi-cal model). East is to the left and North up.

51The Messenger 123 – March 2006
Figure 3 (above): Entropy structure of the ICM in RXCJ 0014.3-3023 seen in projection as derived from the XMM-Newton spectro-imaging (Finoguenov et al. 2005). While we expect the entropy to steadily increase with radius in a relaxed cluster, we here observe low entropy gas (in blue) marking the two subcomponent centres, whereas the high entropy (in yellow/red) in the region in-between implies energy dis- sipation due to the merger shock. Another interesting feature is the low- entropy channel connecting the main cluster centre with the southern edge (in green). The overplotted contours show the galaxy distribution (see Fig- ure 7).
Figure 4: Examples of VIMOS spectra (observed-frame wavelength in Å) of three cluster galaxies, in- cluding a star-forming emission-line galaxy (top) and two galaxies dominated by old, passively evolv-ing stellar populations (middle and bottom). While the upper two examples include two bright galaxies, a galaxy near the detection limit of 22.5 I-mag is shown at the bottom.
600050004000
2000
0
1000
O II O III
600050004000
2000
0
1000
Ca II H + K
600050004000
0
–100
–50 Ca II H + K
50
Figure 5 (below): Left: Radial distribu-tion of the cumulative ratio of galax- ies with and without emission lines in their spectra. The central peak in the blue line (all galaxies) is due to only three galaxies (see right hand), which are excised in the red curve. Right: Projected distribution of the galaxies with spectroscopic observations. Dif- ferent colours mark the redshift re-gions (blue: ∆v < −1321 km s−1, green: −1321 < ∆v < 0 km s−1, yellow: 0 < ∆v < 1321 km s−1, red: ∆v > 1321 km s−1) and the asterisk symbol indicates ongoing star formation activity. The cluster centre is marked by a cross.
0 1000 2000 3000 4000 50000
0.1
0.2
0.3
0.4
Radius (kpc)
Ne/
Nne
3.43.53.7 3.6RA
3.83.9
–30.6
–30.5
–30.4
–30.3
–30.2
DE
C
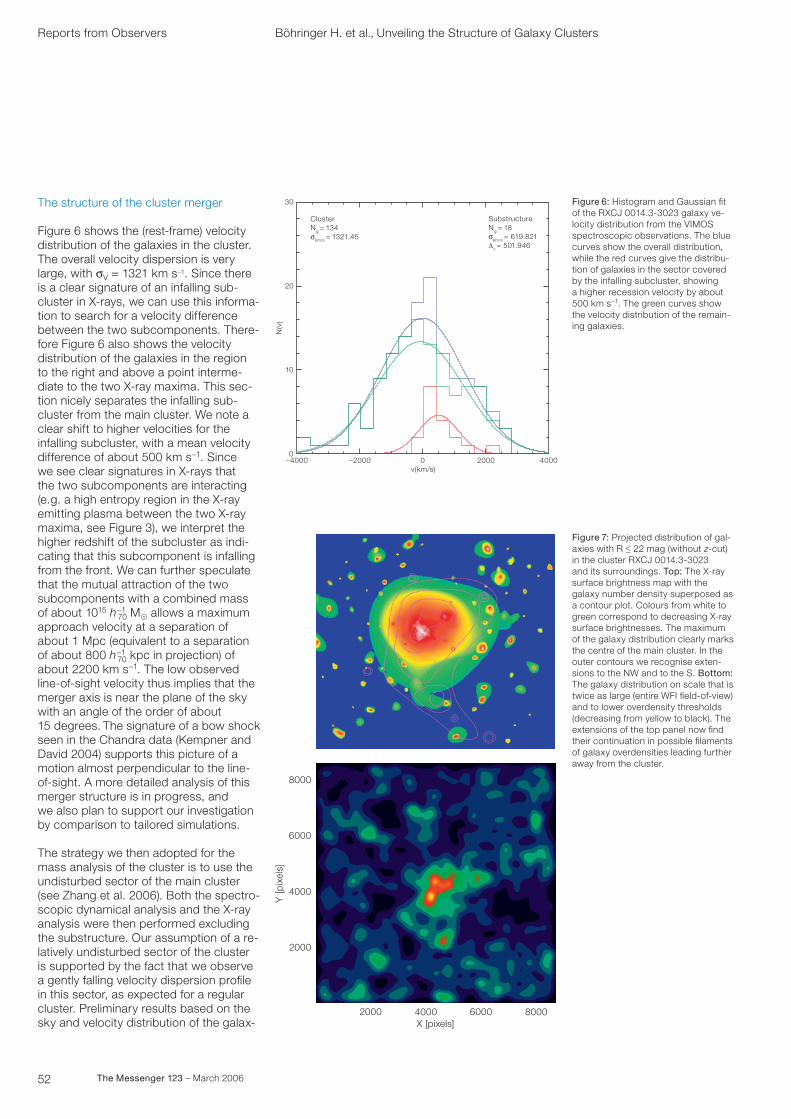
52 The Messenger 123 – March 2006
The structure of the cluster merger
Figure 6 shows the (rest-frame) velocity distribution of the galaxies in the cluster. The overall velocity dispersion is very large, with sV = 1321 km s−1. Since there is a clear signature of an infalling sub-cluster in X-rays, we can use this informa-tion to search for a velocity difference between the two subcomponents. There-fore Figure 6 also shows the velocity distribution of the galaxies in the region to the right and above a point interme-diate to the two X-ray maxima. This sec- tion nicely separates the infalling sub-cluster from the main cluster. We note a clear shift to higher velocities for the infalling subcluster, with a mean velocity difference of about 500 km s−1. Since we see clear signatures in X-rays that the two subcomponents are interacting (e.g. a high entropy region in the X-ray emitting plasma between the two X-ray maxima, see Figure 3), we interpret the higher redshift of the subcluster as indi-cating that this subcomponent is infalling from the front. We can further speculate that the mutual attraction of the two subcomponents with a combined mass of about 1015 h−1
70 MA allows a maximum approach velocity at a separation of about 1 Mpc (equivalent to a separation of about 800 h−1
70 kpc in projection) of about 2200 km s−1. The low observed line-of-sight velocity thus implies that the merger axis is near the plane of the sky with an angle of the order of about 15 degrees. The signature of a bow shock seen in the Chandra data (Kempner and David 2004) supports this picture of a motion almost perpendicular to the line-of-sight. A more detailed analysis of this merger structure is in progress, and we also plan to support our investigation by comparison to tailored simulations.
The strategy we then adopted for the mass analysis of the cluster is to use the undisturbed sector of the main cluster (see Zhang et al. 2006). Both the spectro-scopic dynamical analysis and the X-ray analysis were then performed excluding the substructure. Our assumption of a re-latively undisturbed sector of the cluster is supported by the fact that we observe a gently falling velocity dispersion profile in this sector, as expected for a regular cluster. Preliminary results based on the sky and velocity distribution of the galax-
Reports from Observers Böhringer H. et al., Unveiling the Structure of Galaxy Clusters
Figure 7: Projected distribution of gal- axies with R ≤ 22 mag (without z-cut) in the cluster RXCJ 0014.3-3023 and its surroundings. Top: The X-ray surface brightness map with the galaxy number density superposed as a contour plot. Colours from white to green correspond to decreasing X-ray surface brightnesses. The maximum of the galaxy distribution clearly marks the centre of the main cluster. In the outer contours we recognise exten- sions to the NW and to the S. Bottom: The galaxy distribution on scale that is twice as large (entire WFI field-of-view) and to lower overdensity thresholds (decreasing from yellow to black). The extensions of the top panel now find their continuation in possible filaments of galaxy overdensities leading further away from the cluster.
4000
10
20N
(v)
SubstructureNg = 18σkm/s = 619.821∆v = 501.946
20000v(km/s)
ClusterNg = 134σkm/s = 1321.45
0
30
–2000–4000
8000600040002000
2000
4000
Y [p
ixel
s]
6000
8000
X [pixels]
Figure 6: Histogram and Gaussian fit of the RXCJ 0014.3-3023 galaxy ve- locity distribution from the VIMOS spectroscopic observations. The blue curves show the overall distribution, while the red curves give the distribu-tion of galaxies in the sector covered by the infalling subcluster, showing a higher recession velocity by about 500 km s−1. The green curves show the velocity distribution of the remain-ing galaxies.
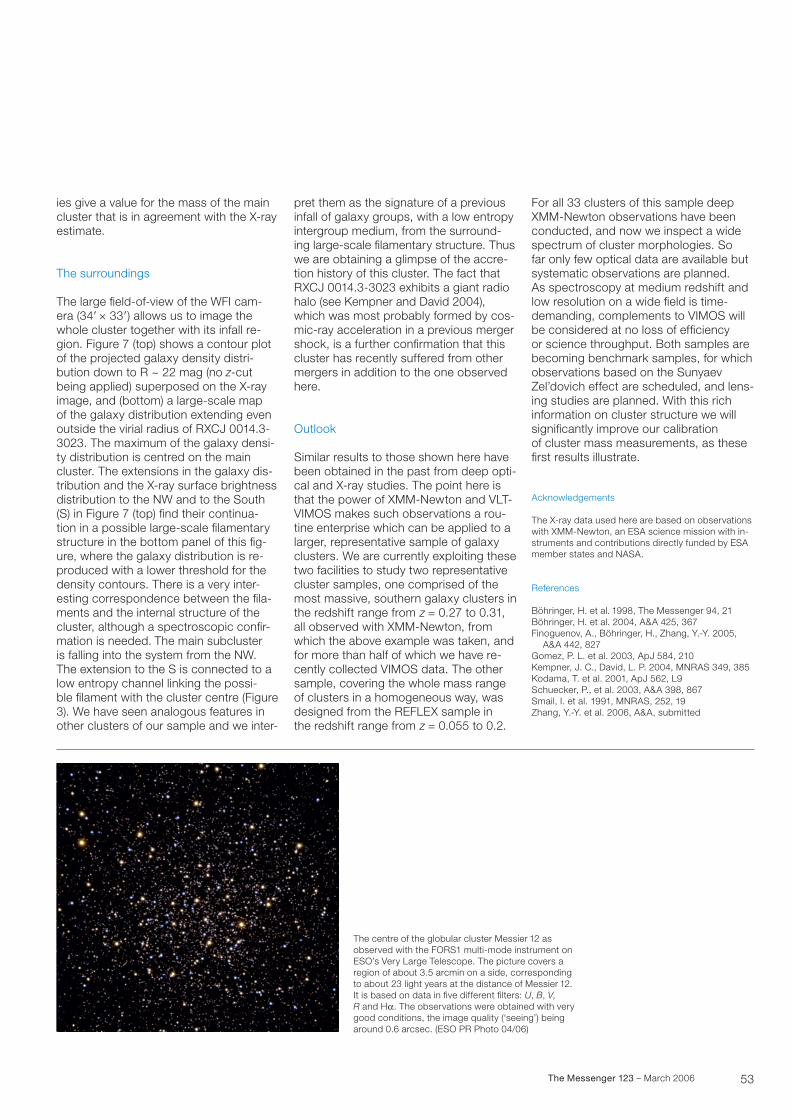
53The Messenger 123 – March 2006
ies give a value for the mass of the main cluster that is in agreement with the X-ray estimate.
The surroundings
The large field-of-view of the WFI cam- era (34; × 33;) allows us to image the whole cluster together with its infall re- gion. Figure 7 (top) shows a contour plot of the projected galaxy density distri-bution down to R ~ 22 mag (no z-cut being applied) superposed on the X-ray image, and (bottom) a large-scale map of the galaxy distribution extending even outside the virial radius of RXCJ 0014.3-3023. The maximum of the galaxy densi- ty distribution is centred on the main cluster. The extensions in the galaxy dis- tribution and the X-ray surface brightness distribution to the NW and to the South (S) in Figure 7 (top) find their continua-tion in a possible large-scale filamentary structure in the bottom panel of this fig- ure, where the galaxy distribution is re- produced with a lower threshold for the density contours. There is a very inter- esting correspondence between the fila- ments and the internal structure of the cluster, although a spectroscopic confir-mation is needed. The main subcluster is falling into the system from the NW. The extension to the S is connected to a low entropy channel linking the possi- ble filament with the cluster centre (Figure 3). We have seen analogous features in other clusters of our sample and we inter-
pret them as the signature of a previous infall of galaxy groups, with a low entropy intergroup medium, from the surround- ing large-scale filamentary structure. Thus we are obtaining a glimpse of the accre-tion history of this cluster. The fact that RXCJ 0014.3-3023 exhibits a giant radio halo (see Kempner and David 2004), which was most probably formed by cos-mic-ray acceleration in a previous merger shock, is a further confirmation that this cluster has recently suffered from other mergers in addition to the one observed here.
Outlook
Similar results to those shown here have been obtained in the past from deep opti-cal and X-ray studies. The point here is that the power of XMM-Newton and VLT-VIMOS makes such observations a rou-tine enterprise which can be applied to a larger, representative sample of galaxy clusters. We are currently exploiting these two facilities to study two representative cluster samples, one comprised of the most massive, southern galaxy clusters in the redshift range from z = 0.27 to 0.31, all observed with XMM-Newton, from which the above example was taken, and for more than half of which we have re-cently collected VIMOS data. The other sample, covering the whole mass range of clusters in a homogeneous way, was designed from the REFLEX sample in the redshift range from z = 0.055 to 0.2.
For all 33 clusters of this sample deep XMM-Newton observations have been conducted, and now we inspect a wide spectrum of cluster morphologies. So far only few optical data are available but systematic observations are planned. As spectroscopy at medium redshift and low resolution on a wide field is time- demanding, complements to VIMOS will be considered at no loss of efficiency or science throughput. Both samples are becoming benchmark samples, for which observations based on the Sunyaev Zel’dovich effect are scheduled, and lens- ing studies are planned. With this rich information on cluster structure we will significantly improve our calibration of cluster mass measurements, as these first results illustrate.
Acknowledgements
The X-ray data used here are based on observations with XMM-Newton, an ESA science mission with in-struments and contributions directly funded by ESA member states and NASA.
References
Böhringer, H. et al. 1998, The Messenger 94, 21 Böhringer, H. et al. 2004, A&A 425, 367 Finoguenov, A., Böhringer, H., Zhang, Y.-Y. 2005, A&A 442, 827 Gomez, P. L. et al. 2003, ApJ 584, 210 Kempner, J. C., David, L. P. 2004, MNRAS 349, 385Kodama, T. et al. 2001, ApJ 562, L9 Schuecker, P., et al. 2003, A&A 398, 867 Smail, I. et al. 1991, MNRAS, 252, 19 Zhang, Y.-Y. et al. 2006, A&A, submitted
The centre of the globular cluster Messier 12 as observed with the FORS1 multi-mode instrument on ESO’s Very Large Telescope. The picture covers a region of about 3.5 arcmin on a side, corresponding to about 23 light years at the distance of Messier 12. It is based on data in five different filters: U, B, V, R and Ha. The observations were obtained with very good conditions, the image quality (‘seeing’) being around 0.6 arcsec. (ESO PR Photo 04/06)
54 The Messenger 123 – March 2006
Reports from Observers
Gamma-Ray Bursts: Learning about the Birth of Black Holes and Opening new Frontiers for Cosmology
Guido Chincarini1,2
Fabrizio Fiore3
Massimo Della Valle4
Angelo Antonelli3 Sergio Campana 2
Stefano Covino 2
Giancarlo Cusumano 5
Paolo Giommi6
Daniele Malesani7
Felix Mirabel8
Alberto Moretti2,9
Patrizia Romano2,9
Luigi Stella 3
Gianpiero Tagliaferri2
1 Università degli Studi di Milano-Bicocca, Italy
2 INAF – Osservatorio Astronomico di Brera, Italy
3 INAF – Osservatorio Astronomico di Roma, Italy
4 INAF – Osservatorio Astrofisico di Arcetri, Italy
5 INAF/IASF Palermo, Italy6 ASI Science Data Center7 International School for Advanced Stud-
ies (SISSA), Trieste, Italy 8 ESO9 Supported by the Italian Space Agency
(ASI)
Swift, a satellite devoted to the study of cosmic gamma-ray bursts (GRBs), is now fully operational and detects about 100 GRBs per year, as the first year of operation demonstrated. Since its launch (20 November 2004), Swift has monitored with the narrow-field X-Ray Telescope (XRT) 75 afterglows (out of 97 GRBs), starting just a few minutes after the GRB onset. Together with the events detected by HETE-II and INTE-GRAL, Swift gives us a unique position to unveil the details of these enigmat- ic events, which likely identify the birth of black holes. GRBs are also useful cosmological tools, and can be used as powerful, distant beacons to trace the history and evolution of the early Uni-verse. All of this can be accomplished by the use of Swift, coupled to large ground-based telescopes. In this article we describe some of the fresh, exciting results obtained in the field.
Zwicky used to say that Nature manifests itself in any form we may think of and has far more ways than we can possibly imagine. Indeed every time we increase the sensitivity of our instruments or develop the technology to open a new window in the electromagnetic spectrum, we discover new phenomena that in most cases were not predicted or even expected.
The Swift mission is no exception, its strength being the mission concept itself based on: multi-wavelength coverage with the on-board instrumentation, fast pointing capabilities of the satellite, tight international collaboration with team members permanently on duty, and worldwide networks with robotic and very large telescopes ready to respond in a matter of minutes. Facilities like the VLT, Keck, Gemini, Subaru, and many others, play a fundamental role with their fast response and high sensitivity. The funda-mental discoveries made in the past year were made possible by the excellent level of coordination between Swift team members, ground-based telescopes and the GRB community at large. The key el- ements in this scientific enterprise, i.e. speed and coordination, were discussed and carefully planned over the years; they are now working very efficiently.
Back in 1963 Hoyle and Fowler pointed out that the energy source of a quasar or AGN could arise from a collapsed ob- ject or black hole. A flow chart original- ly due to Martin Rees illustrates different channels possibly leading to the forma-tion of black holes, on a variety of scale lengths, always with gravity as the main player. We do not know the quantitative aspect of various processes but we are making important theoretical progress in the field. The energy that black holes ir- radiate can be produced in different ways, for instance via extraction of black hole rotational energy through the Blandford and Znajek mechanism, or via the more generally accepted mechanism involving the release of gravitational energy from matter inflowing through an accretion disc. Both mechanisms can be made to work on a sufficiently short time and with high enough efficiency to power GRBs, pro- vided that nuclear density matter, possi-bly in the form of a torus, surrounds the
innermost regions around the event hori-zon of the black hole.
The collapse of a massive star towards a black hole occurs in a very short time and releases a very large amount of energy. Woosley, Paczynski and cowork-ers proposed the collapsar/hypernova model: the fast rotating iron core of a very massive star collapses and forms a rotating black hole surrounded by a very high-density accretion ring. This sce- nario was illustrated by the simulations of Zhang, Woosley and MacFadyen. Pow-erful relativistic jets along the polar axis are formed by extracting the potential en- ergy and rotational energy via neutrinos or magnetic fields. Contrary to ordinary core-collapse supernovae (SNe), a col-lapsar/hypernova is also expected to ex- pel matter at relativistic speed. This model envisages that long GRBs should go off mainly in star forming regions.
The coalescence of two relativistic stars (double neutron star or black hole/neu-tron star binary mergers) is the end result of 0.1–1 Gyr of orbital decay caused by the emission of gravitational waves. This paroxysmal event should also give rise to a black hole surrounded by a torus of matter at nuclear densities, possibly producing relativistic jets that are less energetic and shorter lived than those of collapsars and originating short GRBs. These merger events should, in general, be associated with galaxies having an older stellar population and take place, in a fraction of the cases, in the outskirts of (or even outside) the galaxy.
These are the two main models invoked to explain the two flavours in which GRBs manifest themselves: long and short. Gathering evidence in favour of this over-all scenario is certainly among main re- sults so far obtained by Swift, in conjunc-tion with large ground-based telescopes, the ESO VLT facility in particular, where, thanks to the MISTICI and GRACE colla-borations, most of the bursts visible from the southern hemisphere have been monitored. The deep significance of the ongoing research is not only that of putting together a complicated mosaic, but also trying to match at an unprece-dented level the observational results with the predictions of the models. This
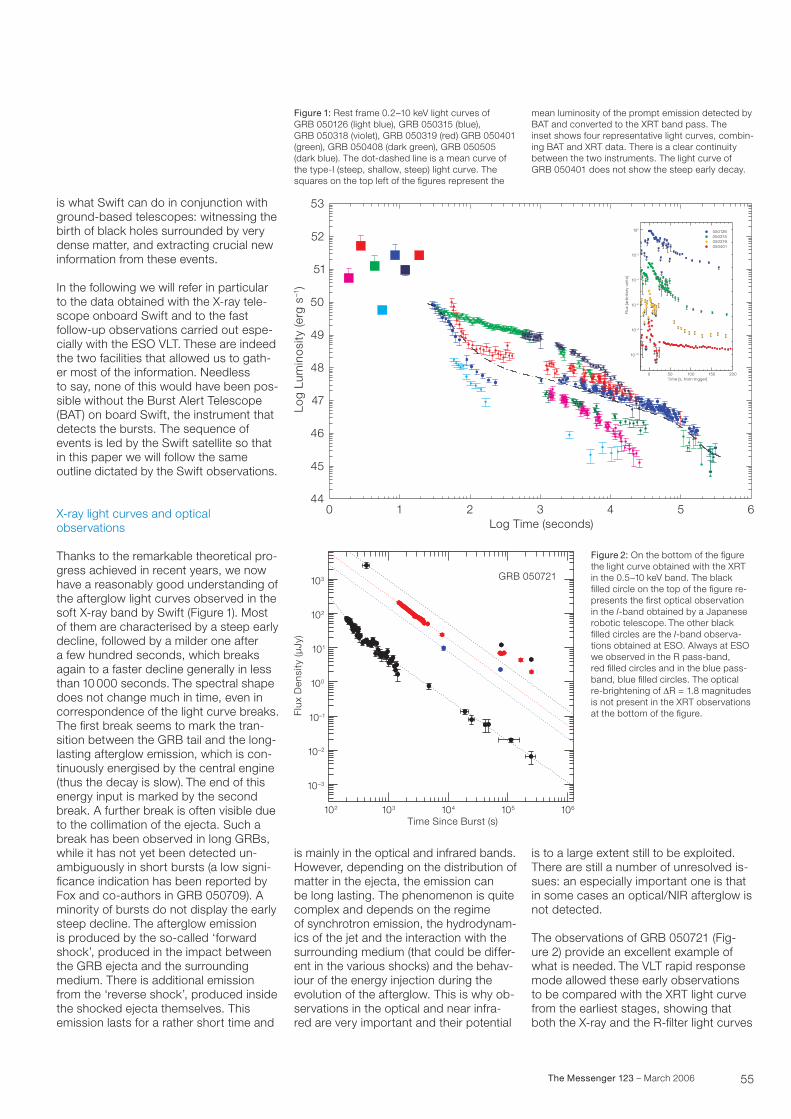
55The Messenger 123 – March 2006
is what Swift can do in conjunction with ground-based telescopes: witnessing the birth of black holes surrounded by very dense matter, and extracting crucial new information from these events.
In the following we will refer in particular to the data obtained with the X-ray tele-scope onboard Swift and to the fast follow-up observations carried out espe- cially with the ESO VLT. These are indeed the two facilities that allowed us to gath- er most of the information. Needless to say, none of this would have been pos-sible without the Burst Alert Telescope (BAT) on board Swift, the instrument that detects the bursts. The sequence of events is led by the Swift satellite so that in this paper we will follow the same outline dictated by the Swift observations.
X-ray light curves and optical observations
Thanks to the remarkable theoretical pro-gress achieved in recent years, we now have a reasonably good understanding of the afterglow light curves observed in the soft X-ray band by Swift (Figure 1). Most of them are characterised by a steep early decline, followed by a milder one after a few hundred seconds, which breaks again to a faster decline generally in less than 10 000 seconds. The spectral shape does not change much in time, even in correspondence of the light curve breaks. The first break seems to mark the tran- sition between the GRB tail and the long- lasting afterglow emission, which is con-tinuously energised by the central engine (thus the decay is slow). The end of this energy input is marked by the second break. A further break is often visible due to the collimation of the ejecta. Such a break has been observed in long GRBs, while it has not yet been detected un-ambiguously in short bursts (a low signi-ficance indication has been reported by Fox and co-authors in GRB 050709). A minority of bursts do not display the early steep decline. The afterglow emission is produced by the so-called ‘forward shock’, produced in the impact between the GRB ejecta and the surrounding medium. There is additional emission from the ‘reverse shock’, produced inside the shocked ejecta themselves. This emission lasts for a rather short time and
is mainly in the optical and infrared bands. However, depending on the distribution of matter in the ejecta, the emission can be long lasting. The phenomenon is quite complex and depends on the regime of synchrotron emission, the hydrodynam- ics of the jet and the interaction with the surrounding medium (that could be differ-ent in the various shocks) and the behav- iour of the energy injection during the evolution of the afterglow. This is why ob-servations in the optical and near infra- red are very important and their potential
is to a large extent still to be exploited. There are still a number of unresolved is-sues: an especially important one is that in some cases an optical/NIR afterglow is not detected.
The observations of GRB 050721 (Fig-ure 2) provide an excellent example of what is needed. The VLT rapid response mode allowed these early observations to be compared with the XRT light curve from the earliest stages, showing that both the X-ray and the R-filter light curves
Figure 1: Rest frame 0.2–10 keV light curves of GRB 050126 (light blue), GRB 050315 (blue), GRB 050318 (violet), GRB 050319 (red) GRB 050401 (green), GRB 050408 (dark green), GRB 050505 (dark blue). The dot-dashed line is a mean curve of the type-I (steep, shallow, steep) light curve. The squares on the top left of the figures represent the
mean luminosity of the prompt emission detected by BAT and converted to the XRT band pass. The inset shows four representative light curves, combin-ing BAT and XRT data. There is a clear continuity between the two instruments. The light curve of GRB 050401 does not show the steep early decay.
200100500Time [s. from trigger]
10–10
10–8
10–6
10–4
10–2
Flux
[arb
rita
ry u
nits
]
050126050315050319050401
150
100
5 643210Log Time (seconds)
44
45
46
47
48
49
50
51
52
53
Log
Lum
ino
sity
(erg
s–1
)
10–2
10–1
100
101
102
103
10–3
102 103 104 105 106
Time Since Burst (s)
Flux
Den
sity
(µJy
)
GRB 050721
Figure 2: On the bottom of the figure the light curve obtained with the XRT in the 0.5–10 keV band. The black filled circle on the top of the figure re-presents the first optical observation in the I-band obtained by a Japanese robotic telescope. The other black filled circles are the I-band observa-tions obtained at ESO. Always at ESO we observed in the R pass-band, red filled circles and in the blue pass-band, blue filled circles. The optical re-brightening of ∆R = 1.8 magnitudes is not present in the XRT observations at the bottom of the figure.
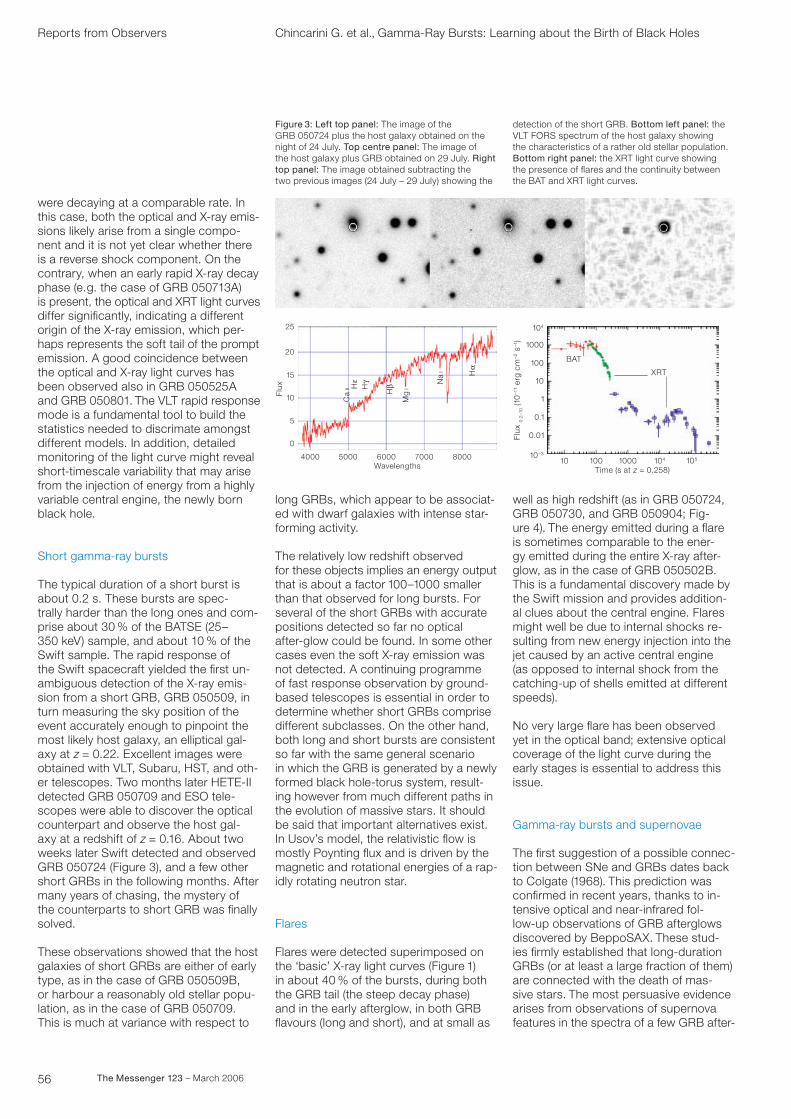
56 The Messenger 123 – March 2006
were decaying at a comparable rate. In this case, both the optical and X-ray emis-sions likely arise from a single compo-nent and it is not yet clear whether there is a reverse shock component. On the contrary, when an early rapid X-ray decay phase (e.g. the case of GRB 050713A) is present, the optical and XRT light curves differ significantly, indicating a different origin of the X-ray emission, which per- haps represents the soft tail of the prompt emission. A good coincidence between the optical and X-ray light curves has been observed also in GRB 050525A and GRB 050801. The VLT rapid response mode is a fundamental tool to build the statistics needed to discrimate amongst different models. In addition, detailed monitoring of the light curve might reveal short-timescale variability that may arise from the injection of energy from a highly variable central engine, the newly born black hole.
Short gamma-ray bursts
The typical duration of a short burst is about 0.2 s. These bursts are spec- trally harder than the long ones and com- prise about 30 % of the BATSE (25–350 keV) sample, and about 10 % of the Swift sample. The rapid response of the Swift spacecraft yielded the first un- ambiguous detection of the X-ray emis-sion from a short GRB, GRB 050509, in turn measuring the sky position of the event accurately enough to pinpoint the most likely host galaxy, an elliptical gal-axy at z = 0.22. Excellent images were obtained with VLT, Subaru, HST, and oth- er telescopes. Two months later HETE-II detected GRB 050709 and ESO tele-scopes were able to discover the optical counterpart and observe the host gal- axy at a redshift of z = 0.16. About two weeks later Swift detected and observed GRB 050724 (Figure 3), and a few other short GRBs in the following months. After many years of chasing, the mystery of the counterparts to short GRB was finally solved.
These observations showed that the host galaxies of short GRBs are either of early type, as in the case of GRB 050509B, or harbour a reasonably old stellar popu- lation, as in the case of GRB 050709. This is much at variance with respect to
long GRBs, which appear to be associat- ed with dwarf galaxies with intense star-forming activity.
The relatively low redshift observed for these objects implies an energy output that is about a factor 100–1000 smaller than that observed for long bursts. For several of the short GRBs with accurate positions detected so far no optical after-glow could be found. In some other cases even the soft X-ray emission was not detected. A continuing programme of fast response observation by ground-based telescopes is essential in order to determine whether short GRBs comprise different subclasses. On the other hand, both long and short bursts are consistent so far with the same general scenario in which the GRB is generated by a newly formed black hole-torus system, result-ing however from much different paths in the evolution of massive stars. It should be said that important alternatives exist. In Usov’s model, the relativistic flow is mostly Poynting flux and is driven by the magnetic and rotational energies of a rap-idly rotating neutron star.
Flares
Flares were detected superimposed on the ‘basic’ X-ray light curves (Figure 1) in about 40 % of the bursts, during both the GRB tail (the steep decay phase) and in the early afterglow, in both GRB flavours (long and short), and at small as
well as high redshift (as in GRB 050724, GRB 050730, and GRB 050904; Fig-ure 4). The energy emitted during a flare is sometimes comparable to the ener- gy emitted during the entire X-ray after-glow, as in the case of GRB 050502B. This is a fundamental discovery made by the Swift mission and provides addition-al clues about the central engine. Flares might well be due to internal shocks re- sulting from new energy injection into the jet caused by an active central engine (as opposed to internal shock from the catching-up of shells emitted at different speeds).
No very large flare has been observed yet in the optical band; extensive optical coverage of the light curve during the early stages is essential to address this issue.
Gamma-ray bursts and supernovae
The first suggestion of a possible connec-tion between SNe and GRBs dates back to Colgate (1968). This prediction was confirmed in recent years, thanks to in- tensive optical and near-infrared fol-low-up observations of GRB afterglows discovered by BeppoSAX. These stud- ies firmly established that long-duration GRBs (or at least a large fraction of them) are connected with the death of mas-sive stars. The most persuasive evidence arises from observations of supernova features in the spectra of a few GRB after-
Reports from Observers Chincarini G. et al., Gamma-Ray Bursts: Learning about the Birth of Black Holes
Figure 3: Left top panel: The image of the GRB 050724 plus the host galaxy obtained on the night of 24 July. Top centre panel: The image of the host galaxy plus GRB obtained on 29 July. Right top panel: The image obtained subtracting the two previous images (24 July – 29 July) showing the
detection of the short GRB. Bottom left panel: the VLT FORS spectrum of the host galaxy showing the characteristics of a rather old stellar population. Bottom right panel: the XRT light curve showing the presence of flares and the continuity between the BAT and XRT light curves.
Wavelengths80007000600050004000
5
25
20
15
10
0
Flux H
ε Na
I
Mg
I
Hβ
Hα
Hγ
Ca
II
105104100010010
104
10–3
0.01
0.1
1
10
100
1000
XRT
BAT
Time (s at z = 0.258)
Flux
0.2–
10 (1
0–1
1 er
g cm
–2 s
–1)
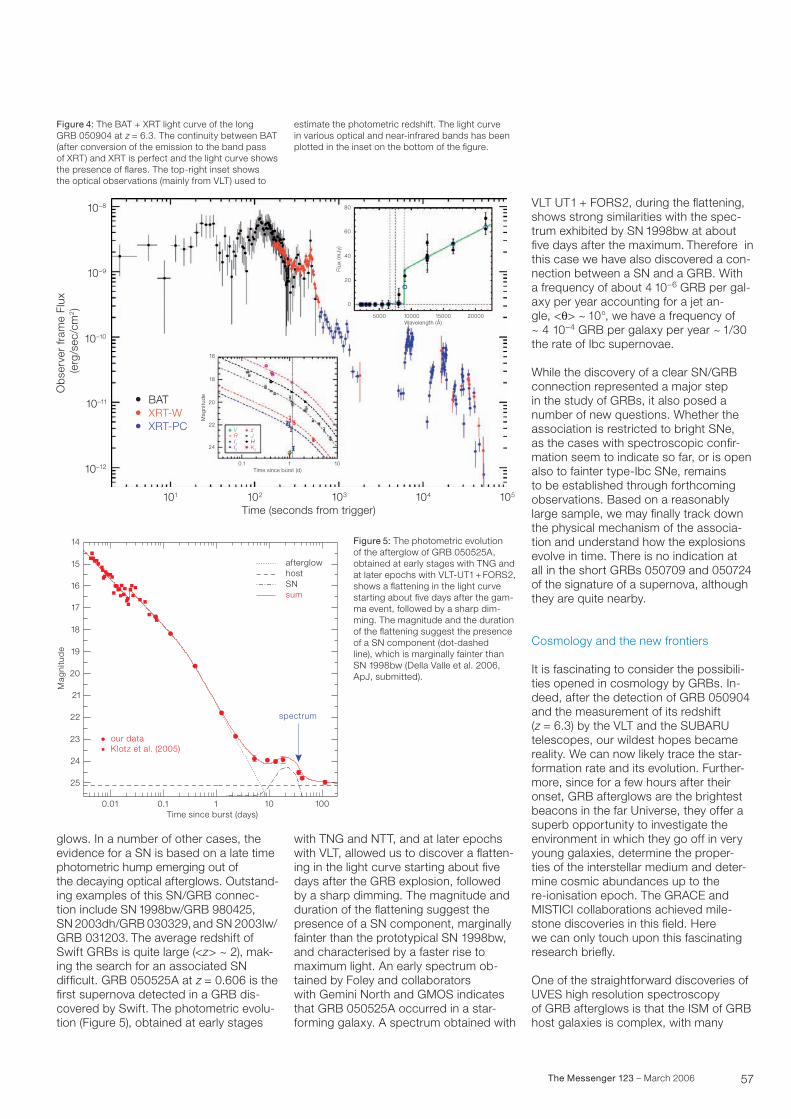
57The Messenger 123 – March 2006
glows. In a number of other cases, the evidence for a SN is based on a late time photometric hump emerging out of the decaying optical afterglows. Outstand-ing examples of this SN/GRB connec-tion include SN 1998bw/GRB 980425, SN 2003dh/GRB 030329, and SN 2003lw/ GRB 031203. The average redshift of Swift GRBs is quite large (<z> ~ 2), mak- ing the search for an associated SN difficult. GRB 050525A at z = 0.606 is the first supernova detected in a GRB dis-covered by Swift. The photometric evolu-tion (Figure 5), obtained at early stages
Figure 4: The BAT + XRT light curve of the long GRB 050904 at z = 6.3. The continuity between BAT (after conversion of the emission to the band pass of XRT) and XRT is perfect and the light curve shows the presence of flares. The top-right inset shows the optical observations (mainly from VLT) used to
0
20
40
5000 10000 15000 20000Wavelength (Å)
60
80
Flux
(mJy
)
105104103102101
10–12
10–11
10–10
10–9
10–8
Time (seconds from trigger)
Ob
serv
er fr
ame
Flux
(e
rg/s
ec/c
m2)
BATXRT-WXRT-PC
Time since burst (d)1010.1
24
22
20
18
16
Mag
nitu
de
RV
I1I2
zJHK2
estimate the photometric redshift. The light curve in various optical and near-infrared bands has been plotted in the inset on the bottom of the figure.
Figure 5: The photometric evolution of the afterglow of GRB 050525A, obtained at early stages with TNG and at later epochs with VLT-UT1 + FORS2, shows a flattening in the light curve starting about five days after the gam-ma event, followed by a sharp dim-ming. The magnitude and the duration of the flattening suggest the presence of a SN component (dot-dashed line), which is marginally fainter than SN 1998bw (Della Valle et al. 2006, ApJ, submitted).
1001010.10.01Time since burst (days)
spectrum
our dataKlotz et al. (2005)
Mag
nitu
de
25
24
23
22
21
20
19
18
17
16
15
14
afterglowhostSNsum
with TNG and NTT, and at later epochs with VLT, allowed us to discover a flatten-ing in the light curve starting about five days after the GRB explosion, followed by a sharp dimming. The magnitude and duration of the flattening suggest the presence of a SN component, marginally fainter than the prototypical SN 1998bw, and characterised by a faster rise to maximum light. An early spectrum ob-tained by Foley and collaborators with Gemini North and GMOS indicates that GRB 050525A occurred in a star- forming galaxy. A spectrum obtained with
VLT UT1 + FORS2, during the flattening, shows strong similarities with the spec-trum exhibited by SN 1998bw at about five days after the maximum. Therefore in this case we have also discovered a con-nection between a SN and a GRB. With a frequency of about 4 10–6 GRB per gal- axy per year accounting for a jet an-gle, <q> ~ 10°, we have a frequency of ~ 4 10–4 GRB per galaxy per year ~ 1/30 the rate of Ibc supernovae.
While the discovery of a clear SN/GRB connection represented a major step in the study of GRBs, it also posed a number of new questions. Whether the association is restricted to bright SNe, as the cases with spectroscopic confir-mation seem to indicate so far, or is open also to fainter type-Ibc SNe, remains to be established through forthcoming observations. Based on a reasonably large sample, we may finally track down the physical mechanism of the associa- tion and understand how the explosions evolve in time. There is no indication at all in the short GRBs 050709 and 050724 of the signature of a supernova, although they are quite nearby.
Cosmology and the new frontiers
It is fascinating to consider the possibili-ties opened in cosmology by GRBs. In-deed, after the detection of GRB 050904 and the measurement of its redshift (z = 6.3) by the VLT and the SUBARU telescopes, our wildest hopes became reality. We can now likely trace the star- formation rate and its evolution. Further-more, since for a few hours after their onset, GRB afterglows are the brightest beacons in the far Universe, they offer a superb opportunity to investigate the environment in which they go off in very young galaxies, determine the proper- ties of the interstellar medium and deter-mine cosmic abundances up to the re-ionisation epoch. The GRACE and MISTICI collaborations achieved mile-stone discoveries in this field. Here we can only touch upon this fascinating research briefly.
One of the straightforward discoveries of UVES high resolution spectroscopy of GRB afterglows is that the ISM of GRB host galaxies is complex, with many
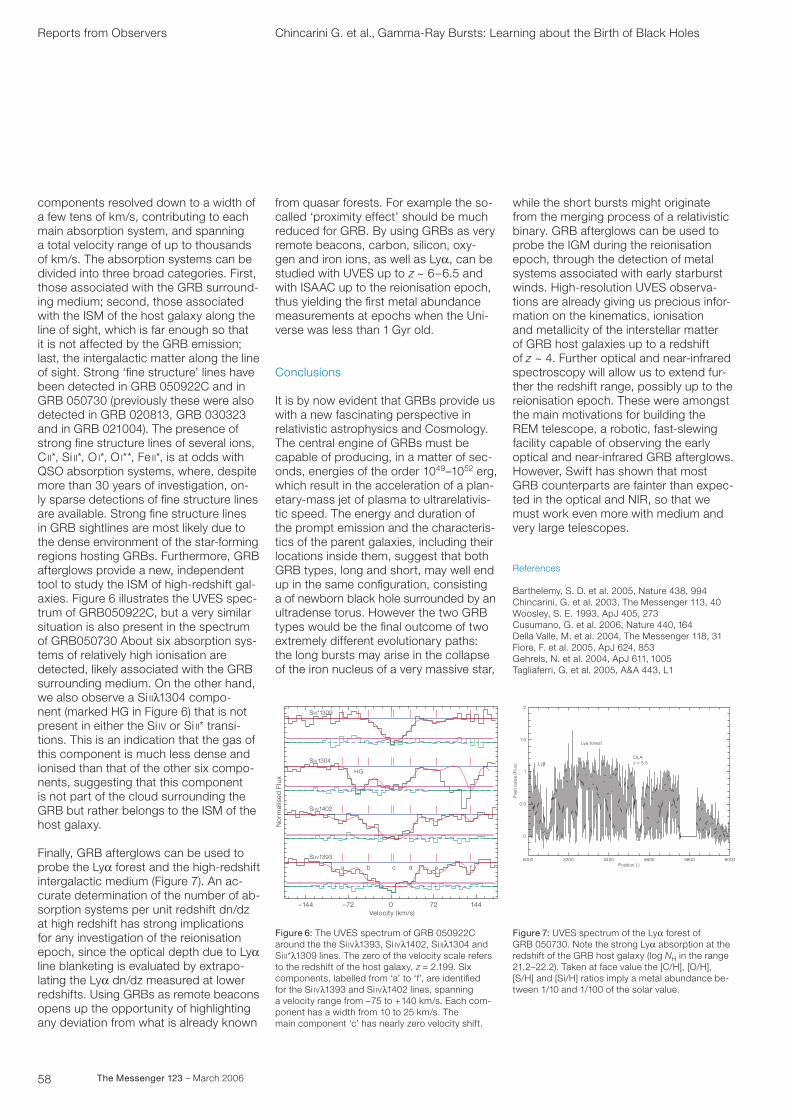
58 The Messenger 123 – March 2006
Reports from Observers
components resolved down to a width of a few tens of km/s, contributing to each main absorption system, and spanning a total velocity range of up to thousands of km/s. The absorption systems can be divided into three broad categories. First, those associated with the GRB surround-ing medium; second, those associated with the ISM of the host galaxy along the line of sight, which is far enough so that it is not affected by the GRB emission; last, the intergalactic matter along the line of sight. Strong ‘fine structure’ lines have been detected in GRB 050922C and in GRB 050730 (previously these were also detected in GRB 020813, GRB 030323 and in GRB 021004). The presence of strong fine structure lines of several ions, C ii*, Si ii*, O i*, O i**, Fe ii*, is at odds with QSO absorption systems, where, despite more than 30 years of investigation, on- ly sparse detections of fine structure lines are available. Strong fine structure lines in GRB sightlines are most likely due to the dense environment of the star-forming regions hosting GRBs. Furthermore, GRB afterglows provide a new, independent tool to study the ISM of high-redshift gal-axies. Figure 6 illustrates the UVES spec-trum of GRB050922C, but a very similar situation is also present in the spectrum of GRB050730 About six absorption sys- tems of relatively high ionisation are detected, likely associated with the GRB surrounding medium. On the other hand, we also observe a Si iil1304 compo-nent (marked HG in Figure 6) that is not present in either the Si iv or Si ii* transi-tions. This is an indication that the gas of this component is much less dense and ionised than that of the other six compo-nents, suggesting that this component is not part of the cloud surrounding the GRB but rather belongs to the ISM of the host galaxy.
Finally, GRB afterglows can be used to probe the Lya forest and the high-redshift intergalactic medium (Figure 7). An ac-curate determination of the number of ab-sorption systems per unit redshift dn/dz at high redshift has strong implications for any investigation of the reionisation epoch, since the optical depth due to Lya line blanketing is evaluated by extrapo- lating the Lya dn/dz measured at lower redshifts. Using GRBs as remote beacons opens up the opportunity of highlighting any deviation from what is already known
from quasar forests. For example the so- called ‘proximity effect’ should be much reduced for GRB. By using GRBs as very remote beacons, carbon, silicon, oxy-gen and iron ions, as well as Lya, can be studied with UVES up to z ~ 6–6.5 and with ISAAC up to the reionisation epoch, thus yielding the first metal abundance measurements at epochs when the Uni-verse was less than 1 Gyr old.
Conclusions
It is by now evident that GRBs provide us with a new fascinating perspective in relativistic astrophysics and Cosmology. The central engine of GRBs must be capable of producing, in a matter of sec-onds, energies of the order 1049–1052 erg, which result in the acceleration of a plan-etary-mass jet of plasma to ultrarelativis-tic speed. The energy and duration of the prompt emission and the characteris-tics of the parent galaxies, including their locations inside them, suggest that both GRB types, long and short, may well end up in the same configuration, consisting a of newborn black hole surrounded by an ultradense torus. However the two GRB types would be the final outcome of two extremely different evolutionary paths: the long bursts may arise in the collapse of the iron nucleus of a very massive star,
while the short bursts might originate from the merging process of a relativistic binary. GRB afterglows can be used to probe the IGM during the reionisation epoch, through the detection of metal systems associated with early starburst winds. High-resolution UVES observa-tions are already giving us precious infor- mation on the kinematics, ionisation and metallicity of the interstellar matter of GRB host galaxies up to a redshift of z ~ 4. Further optical and near-infrared spectroscopy will allow us to extend fur-ther the redshift range, possibly up to the reionisation epoch. These were amongst the main motivations for building the REM telescope, a robotic, fast-slewing facility capable of observing the early optical and near-infrared GRB afterglows. However, Swift has shown that most GRB counterparts are fainter than expec-ted in the optical and NIR, so that we must work even more with medium and very large telescopes.
References
Barthelemy, S. D. et al. 2005, Nature 438, 994Chincarini, G. et al. 2003, The Messenger 113, 40Woosley, S. E. 1993, ApJ 405, 273Cusumano, G. et al. 2006, Nature 440, 164Della Valle, M. et al. 2004, The Messenger 118, 31Fiore, F. et al. 2005, ApJ 624, 853Gehrels, N. et al. 2004, ApJ 611, 1005Tagliaferri, G. et al. 2005, A&A 443, L1
Figure 6: The UVES spectrum of GRB 050922C around the the Si ivl1393, Si ivl1402, Si iil1304 and Si ii*l1309 lines. The zero of the velocity scale refers to the redshift of the host galaxy, z = 2.199. Six components, labelled from ‘a’ to ‘f’, are identified for the Si ivl1393 and Si ivl1402 lines, spanning a velocity range from –75 to +140 km/s. Each com-ponent has a width from 10 to 25 km/s. The main component ‘c’ has nearly zero velocity shift.
Figure 7: UVES spectrum of the Lya forest of GRB 050730. Note the strong Lya absorption at the redshift of the GRB host galaxy (log NH in the range 21.2–22.2). Taken at face value the [C/H], [O/H], [S/H] and [Si/H] ratios imply a metal abundance be-tween 1/10 and 1/100 of the solar value.
144720–72–144Velocity (km/s)
No
rmal
ised
Flu
x
Si II*1309
Si II1304
HG
Si IV1402
Si IV1393
a b c d e f600058005600540052005000
Position ( )
0
0.5
1
1.5
2
Pix
el v
alue
(Flu
x) Lyβ
Lyα forest
DLA z = 3.5
Chincarini G. et al., Gamma-Ray Bursts: Learning about the Birth of Black Holes
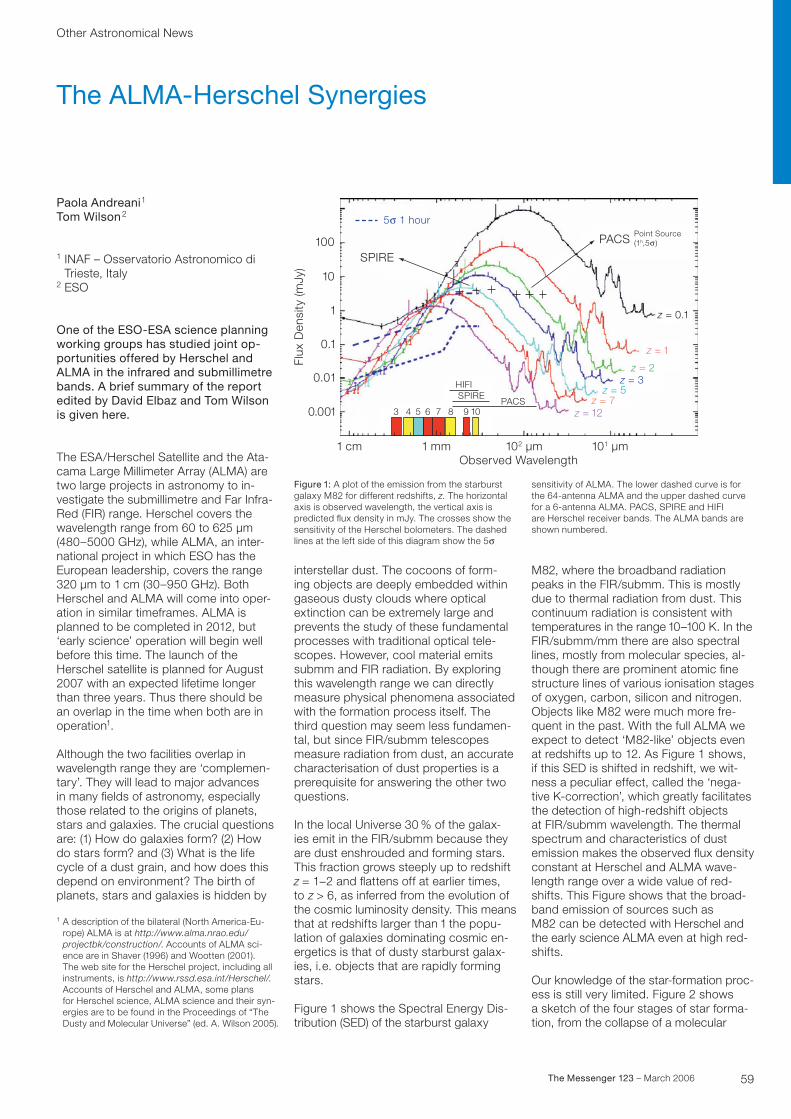
59The Messenger 123 – March 2006
Other Astronomical News
The ALMA-Herschel Synergies
Paola Andreani1
Tom Wilson2
1 INAF – Osservatorio Astronomico di Trieste, Italy
2 ESO
One of the ESO-ESA science planning working groups has studied joint op-portunities offered by Herschel and ALMA in the infrared and submillimetre bands. A brief summary of the report edited by David Elbaz and Tom Wilson is given here.
The ESA/Herschel Satellite and the Ata- cama Large Millimeter Array (ALMA) are two large projects in astronomy to in- vestigate the submillimetre and Far Infra-Red (FIR) range. Herschel covers the wavelength range from 60 to 625 μm (480–5000 GHz), while ALMA, an inter-national project in which ESO has the European leadership, covers the range 320 μm to 1 cm (30–950 GHz). Both Herschel and ALMA will come into oper- ation in similar timeframes. ALMA is planned to be completed in 2012, but ‘early science’ operation will begin well before this time. The launch of the Herschel satellite is planned for August 2007 with an expected lifetime longer than three years. Thus there should be an overlap in the time when both are in operation1.
Although the two facilities overlap in wavelength range they are ‘complemen-tary’. They will lead to major advances in many fields of astronomy, especially those related to the origins of planets, stars and galaxies. The crucial questions are: (1) How do galaxies form? (2) How do stars form? and (3) What is the life cycle of a dust grain, and how does this depend on environment? The birth of planets, stars and galaxies is hidden by
interstellar dust. The cocoons of form-ing objects are deeply embedded within gaseous dusty clouds where optical extinction can be extremely large and prevents the study of these fundamental processes with traditional optical tele- scopes. However, cool material emits submm and FIR radiation. By exploring this wavelength range we can directly measure physical phenomena associated with the formation process itself. The third question may seem less fundamen-tal, but since FIR/submm telescopes measure radiation from dust, an accurate characterisation of dust properties is a prerequisite for answering the other two questions.
In the local Universe 30 % of the galax-ies emit in the FIR/submm because they are dust enshrouded and forming stars. This fraction grows steeply up to redshift z = 1−2 and flattens off at earlier times, to z > 6, as inferred from the evolution of the cosmic luminosity density. This means that at redshifts larger than 1 the popu-lation of galaxies dominating cosmic en- ergetics is that of dusty starburst galax-ies, i.e. objects that are rapidly forming stars.
Figure 1 shows the Spectral Energy Dis- tribution (SED) of the starburst galaxy
1 A description of the bilateral (North America-Eu-rope) ALMA is at http://www.alma.nrao.edu/ projectbk/construction/. Accounts of ALMA sci-ence are in Shaver (1996) and Wootten (2001). The web site for the Herschel project, including all instruments, is http://www.rssd.esa.int/Herschel/. Accounts of Herschel and ALMA, some plans for Herschel science, ALMA science and their syn-ergies are to be found in the Proceedings of “The Dusty and Molecular Universe” (ed. A. Wilson 2005).
M82, where the broadband radiation peaks in the FIR/submm. This is mostly due to thermal radiation from dust. This continuum radiation is consistent with temperatures in the range 10–100 K. In the FIR/submm/mm there are also spectral lines, mostly from molecular species, al- though there are prominent atomic fine structure lines of various ionisation stages of oxygen, carbon, silicon and nitrogen. Objects like M82 were much more fre-quent in the past. With the full ALMA we expect to detect ‘M82-like’ objects even at redshifts up to 12. As Figure 1 shows, if this SED is shifted in redshift, we wit- ness a peculiar effect, called the ‘nega-tive K-correction’, which greatly facilitates the detection of high-redshift objects at FIR/submm wavelength. The thermal spectrum and characteristics of dust emission makes the observed flux density constant at Herschel and ALMA wave- length range over a wide value of red- shifts. This Figure shows that the broad-band emission of sources such as M82 can be detected with Herschel and the early science ALMA even at high red-shifts.
Our knowledge of the star-formation proc- ess is still very limited. Figure 2 shows a sketch of the four stages of star forma-tion, from the collapse of a molecular
Figure 1: A plot of the emission from the starburst galaxy M82 for different redshifts, z. The horizontal axis is observed wavelength, the vertical axis is predicted flux density in mJy. The crosses show the sensitivity of the Herschel bolometers. The dashed lines at the left side of this diagram show the 5s
sensitivity of ALMA. The lower dashed curve is for the 64-antenna ALMA and the upper dashed curve for a 6-antenna ALMA. PACS, SPIRE and HIFI are Herschel receiver bands. The ALMA bands are shown numbered.
100
10
1
0.1
0.01
0.001
Flux
Den
sity
(mJy
)
Observed Wavelength102 µm 101 µm1 mm1 cm
SPIRE
PACS Point Source(1h,5σ )
z = 0.1
z = 1
z = 7
z = 3
z = 12
z = 5
z = 2
5σ 1 hour
HIFISPIRE
PACS3 4 5 6 7 8 9 10
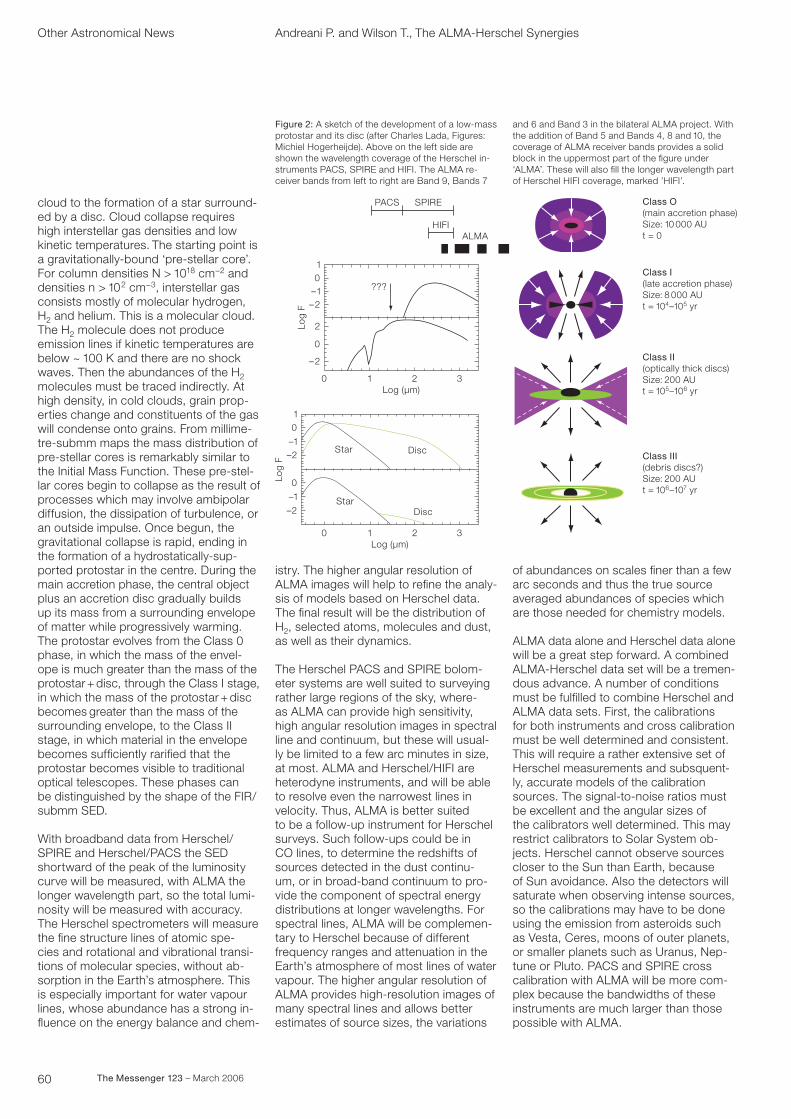
60 The Messenger 123 – March 2006
cloud to the formation of a star surround-ed by a disc. Cloud collapse requires high interstellar gas densities and low kinetic temperatures. The starting point is a gravitationally-bound ‘pre-stellar core’. For column densities N > 1018 cm−2 and densities n > 102 cm−3, interstellar gas consists mostly of molecular hydrogen, H2 and helium. This is a molecular cloud. The H2 molecule does not produce emission lines if kinetic temperatures are below ~ 100 K and there are no shock waves. Then the abundances of the H2 molecules must be traced indirectly. At high density, in cold clouds, grain prop-erties change and constituents of the gas will condense onto grains. From millime-tre-submm maps the mass distribution of pre-stellar cores is remarkably similar to the Initial Mass Function. These pre-stel-lar cores begin to collapse as the result of processes which may involve ambipolar diffusion, the dissipation of turbulence, or an outside impulse. Once begun, the gravitational collapse is rapid, ending in the formation of a hydrostatically-sup-ported protostar in the centre. During the main accretion phase, the central object plus an accretion disc gradually builds up its mass from a surrounding envelope of matter while progressively warming. The protostar evolves from the Class 0 phase, in which the mass of the envel- ope is much greater than the mass of the protostar + disc, through the Class I stage, in which the mass of the protostar + disc becomes greater than the mass of the surrounding envelope, to the Class II stage, in which material in the envelope becomes sufficiently rarified that the protostar becomes visible to traditional optical telescopes. These phases can be distinguished by the shape of the FIR/ submm SED.
With broadband data from Herschel/SPIRE and Herschel/PACS the SED shortward of the peak of the luminosity curve will be measured, with ALMA the longer wavelength part, so the total lumi-nosity will be measured with accuracy. The Herschel spectrometers will measure the fine structure lines of atomic spe- cies and rotational and vibrational transi-tions of molecular species, without ab-sorption in the Earth’s atmosphere. This is especially important for water vapour lines, whose abundance has a strong in- fluence on the energy balance and chem-
Other Astronomical News Andreani P. and Wilson T., The ALMA-Herschel Synergies
istry. The higher angular resolution of ALMA images will help to refine the analy-sis of models based on Herschel data. The final result will be the distribution of H2, selected atoms, molecules and dust, as well as their dynamics.
The Herschel PACS and SPIRE bolom-eter systems are well suited to surveying rather large regions of the sky, where- as ALMA can provide high sensitivity, high angular resolution images in spectral line and continuum, but these will usual- ly be limited to a few arc minutes in size, at most. ALMA and Herschel/HIFI are heterodyne instruments, and will be able to resolve even the narrowest lines in velocity. Thus, ALMA is better suited to be a follow-up instrument for Herschel surveys. Such follow-ups could be in CO lines, to determine the redshifts of sources detected in the dust continu- um, or in broad-band continuum to pro-vide the component of spectral energy distributions at longer wavelengths. For spectral lines, ALMA will be complemen-tary to Herschel because of different frequency ranges and attenuation in the Earth’s atmosphere of most lines of water vapour. The higher angular resolution of ALMA provides high-resolution images of many spectral lines and allows better estimates of source sizes, the variations
of abundances on scales finer than a few arc seconds and thus the true source averaged abundances of species which are those needed for chemistry models.
ALMA data alone and Herschel data alone will be a great step forward. A combined ALMA-Herschel data set will be a tremen-dous advance. A number of conditions must be fulfilled to combine Herschel and ALMA data sets. First, the calibrations for both instruments and cross calibration must be well determined and consistent. This will require a rather extensive set of Herschel measurements and subsquent-ly, accurate models of the calibration sources. The signal-to-noise ratios must be excellent and the angular sizes of the calibrators well determined. This may restrict calibrators to Solar System ob-jects. Herschel cannot observe sources closer to the Sun than Earth, because of Sun avoidance. Also the detectors will saturate when observing intense sources, so the calibrations may have to be done using the emission from asteroids such as Vesta, Ceres, moons of outer planets, or smaller planets such as Uranus, Nep-tune or Pluto. PACS and SPIRE cross calibration with ALMA will be more com-plex because the bandwidths of these instruments are much larger than those possible with ALMA.
Figure 2: A sketch of the development of a low-mass protostar and its disc (after Charles Lada, Figures: Michiel Hogerheijde). Above on the left side are shown the wavelength coverage of the Herschel in- struments PACS, SPIRE and HIFI. The ALMA re-ceiver bands from left to right are Band 9, Bands 7
and 6 and Band 3 in the bilateral ALMA project. With the addition of Band 5 and Bands 4, 8 and 10, the coverage of ALMA receiver bands provides a solid block in the uppermost part of the figure under ‘ALMA’. These will also fill the longer wavelength part of Herschel HIFI coverage, marked ’HIFI’.
Class O(main accretion phase)Size: 10 000 AUt = 0
Class I(late accretion phase)Size: 8 000 AUt = 104–105 yr
Class III(debris discs?)Size: 200 AUt = 106–107 yr
Class II(optically thick discs)Size: 200 AUt = 105–106 yr
320 1Log (µm)
10
–1–2
0
–1
–2
Log
F
Disc
Disc
Star
Star
320 1
HIFIALMA
Log (µm)
–2
0
2
–2–101
???Lo
g F
PACS SPIRE
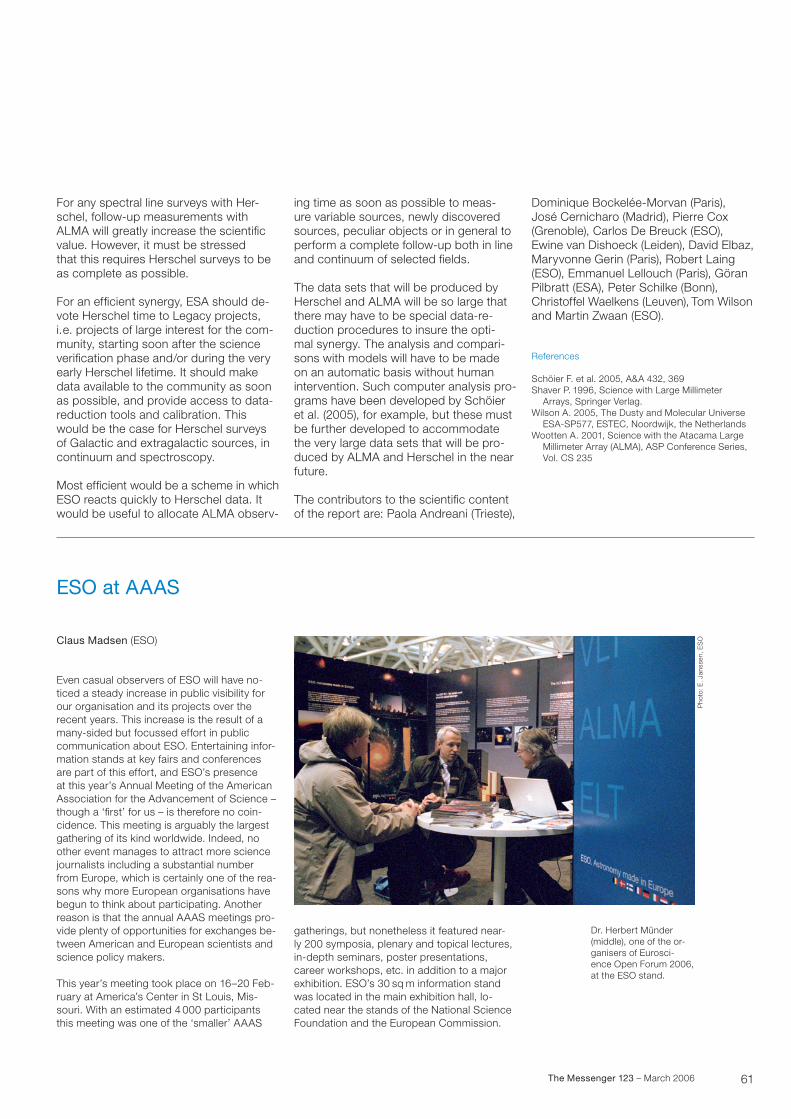
61The Messenger 123 – March 2006
For any spectral line surveys with Her-schel, follow-up measurements with ALMA will greatly increase the scientific value. However, it must be stressed that this requires Herschel surveys to be as complete as possible.
For an efficient synergy, ESA should de-vote Herschel time to Legacy projects, i.e. projects of large interest for the com-munity, starting soon after the science verification phase and/or during the very early Herschel lifetime. It should make data available to the community as soon as possible, and provide access to data- reduction tools and calibration. This would be the case for Herschel surveys of Galactic and extragalactic sources, in continuum and spectroscopy.
Most efficient would be a scheme in which ESO reacts quickly to Herschel data. It would be useful to allocate ALMA observ-
ing time as soon as possible to meas-ure variable sources, newly discovered sources, peculiar objects or in general to perform a complete follow-up both in line and continuum of selected fields.
The data sets that will be produced by Herschel and ALMA will be so large that there may have to be special data-re-duction procedures to insure the opti- mal synergy. The analysis and compari-sons with models will have to be made on an automatic basis without human intervention. Such computer analysis pro-grams have been developed by Schöier et al. (2005), for example, but these must be further developed to accommodate the very large data sets that will be pro-duced by ALMA and Herschel in the near future.
The contributors to the scientific content of the report are: Paola Andreani (Trieste),
Dominique Bockelée-Morvan (Paris), José Cernicharo (Madrid), Pierre Cox (Grenoble), Carlos De Breuck (ESO), Ewine van Dishoeck (Leiden), David Elbaz, Maryvonne Gerin (Paris), Robert Laing (ESO), Emmanuel Lellouch (Paris), Göran Pilbratt (ESA), Peter Schilke (Bonn), Christoffel Waelkens (Leuven), Tom Wilson and Martin Zwaan (ESO).
References
Schöier F. et al. 2005, A&A 432, 369Shaver P. 1996, Science with Large Millimeter Arrays, Springer Verlag.Wilson A. 2005, The Dusty and Molecular Universe ESA-SP577, ESTEC, Noordwijk, the NetherlandsWootten A. 2001, Science with the Atacama Large Millimeter Array (ALMA), ASP Conference Series,
Vol. CS 235
ESO at AAAS
Claus Madsen (ESO)
Even casual observers of ESO will have no- ticed a steady increase in public visibility for our organisation and its projects over the recent years. This increase is the result of a many-sided but focussed effort in public communication about ESO. Entertaining infor-mation stands at key fairs and conferences are part of this effort, and ESO’s presence at this year’s Annual Meeting of the American Association for the Advancement of Science – though a ‘first’ for us – is therefore no coin-cidence. This meeting is arguably the largest gathering of its kind worldwide. Indeed, no other event manages to attract more science journalists including a substantial number from Europe, which is certainly one of the rea-sons why more European organisations have begun to think about participating. Another reason is that the annual AAAS meetings pro-vide plenty of opportunities for exchanges be- tween American and European scientists and science policy makers.
This year’s meeting took place on 16–20 Feb- ruary at America’s Center in St Louis, Mis-souri. With an estimated 4 000 participants this meeting was one of the ‘smaller’ AAAS
gatherings, but nonetheless it featured near-ly 200 symposia, plenary and topical lectures, in-depth seminars, poster presentations, career workshops, etc. in addition to a major exhibition. ESO’s 30 sq m information stand was located in the main exhibition hall, lo-cated near the stands of the National Science Foundation and the European Commission.
Dr. Herbert Münder (middle), one of the or- ganisers of Eurosci-ence Open Forum 2006, at the ESO stand.
Pho
to: E
. Jan
ssen
, ES
O
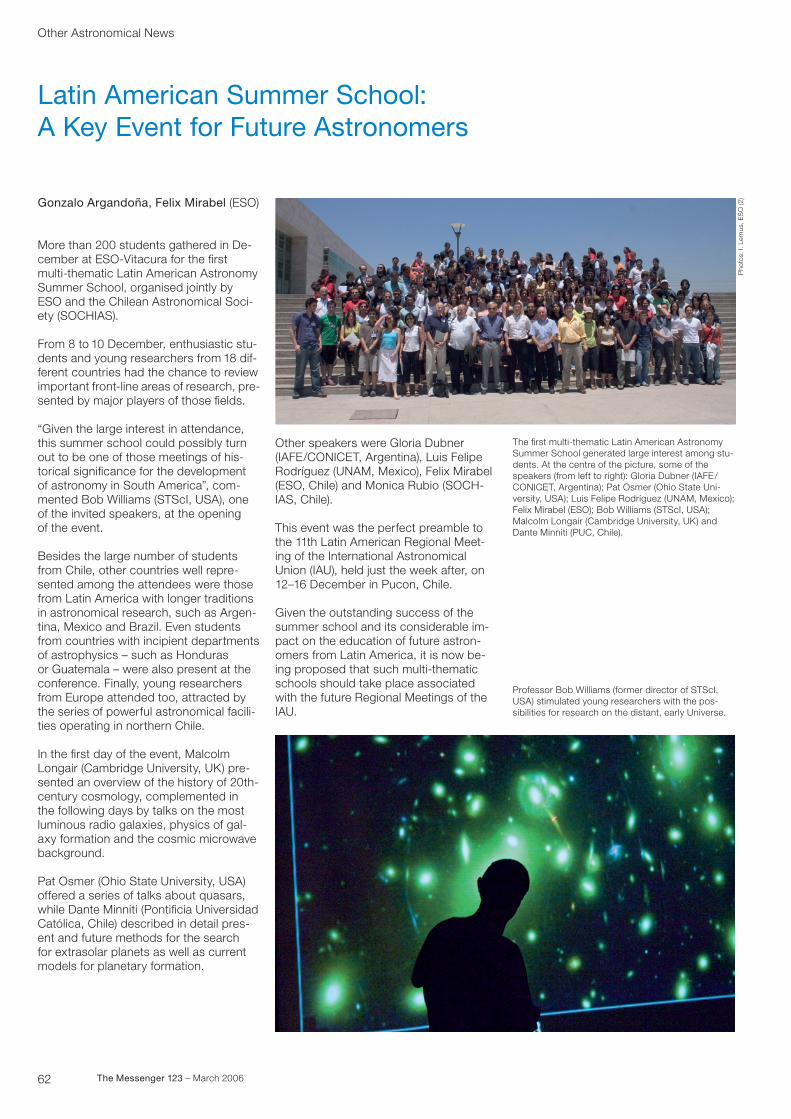
62 The Messenger 123 – March 2006
Latin American Summer School:A Key Event for Future Astronomers
Gonzalo Argandoña, Felix Mirabel (ESO)
More than 200 students gathered in De- cember at ESO-Vitacura for the first multi-thematic Latin American Astronomy Summer School, organised jointly by ESO and the Chilean Astronomical Soci-ety (SOCHIAS).
From 8 to 10 December, enthusiastic stu-dents and young researchers from 18 dif-ferent countries had the chance to review important front-line areas of research, pre-sented by major players of those fields.
“Given the large interest in attendance, this summer school could possibly turn out to be one of those meetings of his-torical significance for the development of astronomy in South America”, com-mented Bob Williams (STScI, USA), one of the invited speakers, at the opening of the event.
Besides the large number of students from Chile, other countries well repre-sented among the attendees were those from Latin America with longer traditions in astronomical research, such as Argen-tina, Mexico and Brazil. Even students from countries with incipient departments of astrophysics – such as Honduras or Guatemala – were also present at the conference. Finally, young researchers from Europe attended too, attracted by the series of powerful astronomical facili-ties operating in northern Chile.
In the first day of the event, Malcolm Longair (Cambridge University, UK) pre-sented an overview of the history of 20th- century cosmology, complemented in the following days by talks on the most luminous radio galaxies, physics of gal-axy formation and the cosmic microwave background.
Pat Osmer (Ohio State University, USA) offered a series of talks about quasars, while Dante Minniti (Pontificia Universidad Católica, Chile) described in detail pres-ent and future methods for the search for extrasolar planets as well as current models for planetary formation.
Other speakers were Gloria Dubner (IAFE/CONICET, Argentina), Luis Felipe Rodríguez (UNAM, Mexico), Felix Mirabel (ESO, Chile) and Monica Rubio (SOCH-IAS, Chile).
This event was the perfect preamble to the 11th Latin American Regional Meet-ing of the International Astronomical Union (IAU), held just the week after, on 12–16 December in Pucon, Chile.
Given the outstanding success of the summer school and its considerable im- pact on the education of future astron-omers from Latin America, it is now be- ing proposed that such multi-thematic schools should take place associated with the future Regional Meetings of the IAU.
The first multi-thematic Latin American Astronomy Summer School generated large interest among stu- dents. At the centre of the picture, some of the speakers (from left to right): Gloria Dubner (IAFE/CONICET, Argentina); Pat Osmer (Ohio State Uni-versity, USA); Luis Felipe Rodríguez (UNAM, Mexico); Felix Mirabel (ESO); Bob Williams (STScI, USA); Malcolm Longair (Cambridge University, UK) and Dante Minniti (PUC, Chile).
Professor Bob Williams (former director of STScI, USA) stimulated young researchers with the pos-sibilities for research on the distant, early Universe.
Pho
tos:
I. L
emus
, ES
O (2
)
Other Astronomical News
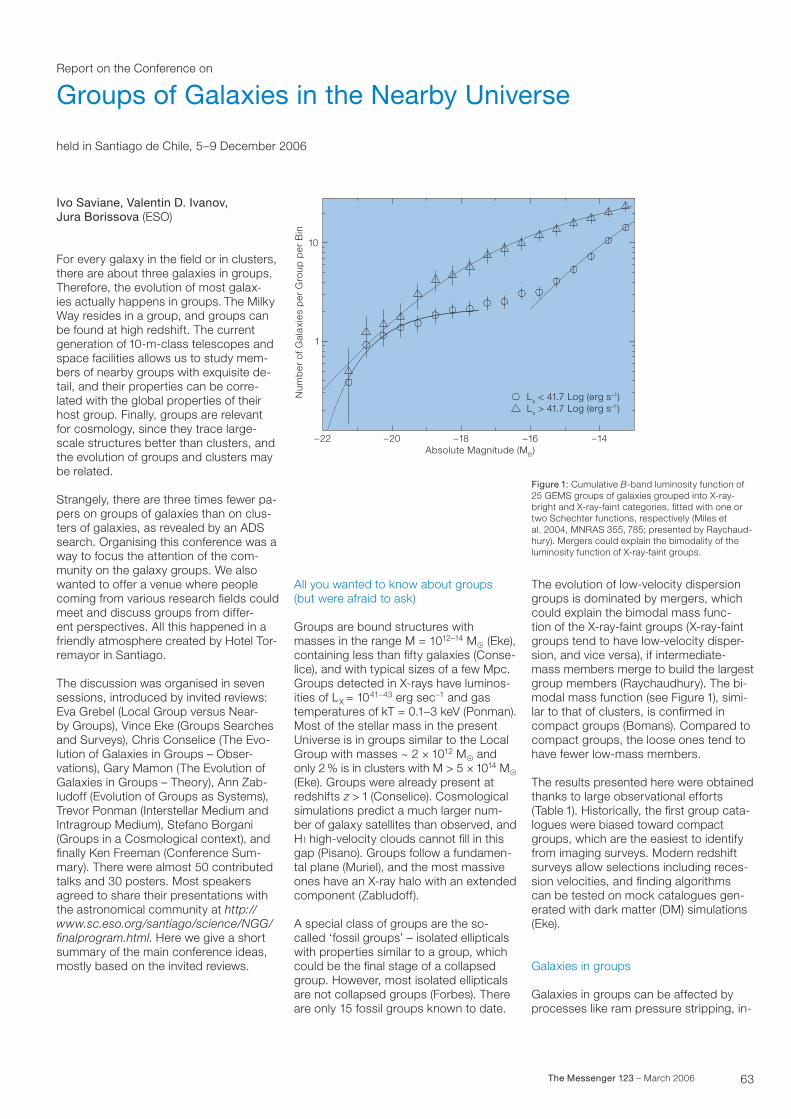
63The Messenger 123 – March 2006
Report on the Conference on
Groups of Galaxies in the Nearby Universe
Ivo Saviane, Valentin D. Ivanov, Jura Borissova (ESO)
For every galaxy in the field or in clusters, there are about three galaxies in groups. Therefore, the evolution of most galax- ies actually happens in groups. The Milky Way resides in a group, and groups can be found at high redshift. The current generation of 10-m-class telescopes and space facilities allows us to study mem-bers of nearby groups with exquisite de- tail, and their properties can be corre-lated with the global properties of their host group. Finally, groups are relevant for cosmology, since they trace large-scale structures better than clusters, and the evolution of groups and clusters may be related.
Strangely, there are three times fewer pa- pers on groups of galaxies than on clus-ters of galaxies, as revealed by an ADS search. Organising this conference was a way to focus the attention of the com-munity on the galaxy groups. We also wanted to offer a venue where people coming from various research fields could meet and discuss groups from differ-ent perspectives. All this happened in a friendly atmosphere created by Hotel Tor- remayor in Santiago.
The discussion was organised in seven sessions, introduced by invited reviews: Eva Grebel (Local Group versus Near- by Groups), Vince Eke (Groups Searches and Surveys), Chris Conselice (The Evo- lution of Galaxies in Groups – Obser-vations), Gary Mamon (The Evolution of Galaxies in Groups – Theory), Ann Zab-ludoff (Evolution of Groups as Systems), Trevor Ponman (Interstellar Medium and Intragroup Medium), Stefano Borgani (Groups in a Cosmological context), and finally Ken Freeman (Conference Sum-mary). There were almost 50 contributed talks and 30 posters. Most speakers agreed to share their presentations with the astronomical community at http://www.sc.eso.org/santiago/science/NGG/finalprogram.html. Here we give a short summary of the main conference ideas, mostly based on the invited reviews.
All you wanted to know about groups (but were afraid to ask)
Groups are bound structures with masses in the range M = 1012–14 MA (Eke), containing less than fifty galaxies (Conse- lice), and with typical sizes of a few Mpc. Groups detected in X-rays have luminos-ities of LX = 1041–43 erg sec–1 and gas temperatures of kT = 0.1–3 keV (Ponman). Most of the stellar mass in the present Universe is in groups similar to the Local Group with masses ~ 2 × 10¹² MA and only 2 % is in clusters with M > 5 × 10¹⁴ MA (Eke). Groups were already present at redshifts z > 1 (Conselice). Cosmological simulations predict a much larger num-ber of galaxy satellites than observed, and H i high-velocity clouds cannot fill in this gap (Pisano). Groups follow a fundamen-tal plane (Muriel), and the most massive ones have an X-ray halo with an extended component (Zabludoff).
A special class of groups are the so-called ‘fossil groups’ – isolated ellipticals with properties similar to a group, which could be the final stage of a collapsed group. However, most isolated ellipticals are not collapsed groups (Forbes). There are only 15 fossil groups known to date.
The evolution of low-velocity dispersion groups is dominated by mergers, which could explain the bimodal mass func-tion of the X-ray-faint groups (X-ray-faint groups tend to have low-velocity disper-sion, and vice versa), if intermediate-mass members merge to build the largest group members (Raychaudhury). The bi- modal mass function (see Figure 1), simi- lar to that of clusters, is confirmed in compact groups (Bomans). Compared to compact groups, the loose ones tend to have fewer low-mass members.
The results presented here were obtained thanks to large observational efforts (Table 1). Historically, the first group cata- logues were biased toward compact groups, which are the easiest to identify from imaging surveys. Modern redshift surveys allow selections including reces-sion velocities, and finding algorithms can be tested on mock catalogues gen-erated with dark matter (DM) simulations (Eke).
Galaxies in groups
Galaxies in groups can be affected by processes like ram pressure stripping, in-
held in Santiago de Chile, 5–9 December 2006
Lx < 41.7 Log (erg s–1)Lx > 41.7 Log (erg s–1)
–14–16–18–20–22Absolute Magnitude (MB)
Num
ber
of G
ala
xies
per
Gro
up p
er B
in
10
1
Figure 1: Cumulative B-band luminosity function of 25 GEMS groups of galaxies grouped into X-ray-bright and X-ray-faint categories, fitted with one or two Schechter functions, respectively (Miles et al. 2004, MNRAS 355, 785; presented by Raychaud-hury). Mergers could explain the bimodality of the luminosity function of X-ray-faint groups.
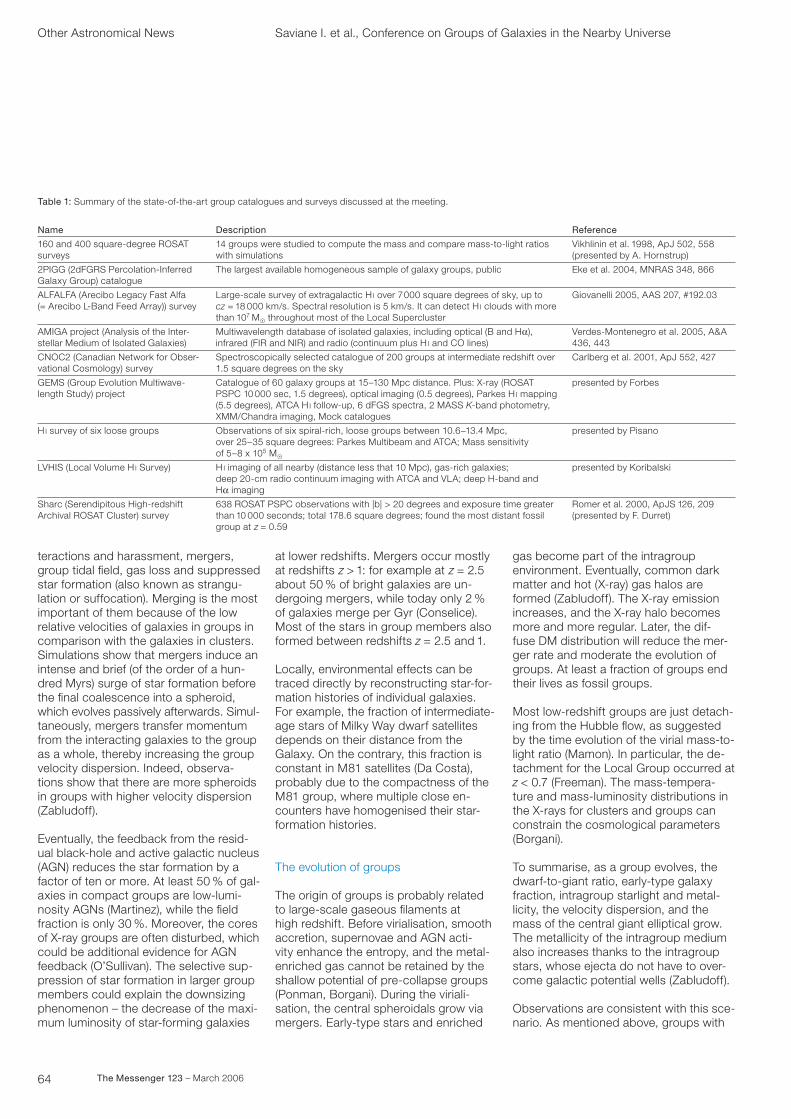
64 The Messenger 123 – March 2006
teractions and harassment, mergers, group tidal field, gas loss and suppressed star formation (also known as strangu-lation or suffocation). Merging is the most important of them because of the low relative velocities of galaxies in groups in comparison with the galaxies in clusters. Simulations show that mergers induce an intense and brief (of the order of a hun-dred Myrs) surge of star formation before the final coalescence into a spheroid, which evolves passively afterwards. Simul-taneously, mergers transfer momentum from the interacting galaxies to the group as a whole, thereby increasing the group velocity dispersion. Indeed, observa- tions show that there are more spheroids in groups with higher velocity dispersion (Zabludoff).
Eventually, the feedback from the resid-ual black-hole and active galactic nucleus (AGN) reduces the star formation by a factor of ten or more. At least 50 % of gal- axies in compact groups are low-lumi-nosity AGNs (Martinez), while the field fraction is only 30 %. Moreover, the cores of X-ray groups are often disturbed, which could be additional evidence for AGN feedback (O’Sullivan). The selective sup-pression of star formation in larger group members could explain the downsizing phenomenon – the decrease of the maxi-mum luminosity of star-forming galaxies
at lower redshifts. Mergers occur mostly at redshifts z > 1: for example at z = 2.5 about 50 % of bright galaxies are un- dergoing mergers, while today only 2 % of galaxies merge per Gyr (Conselice). Most of the stars in group members also formed between redshifts z = 2.5 and 1.
Locally, environmental effects can be traced directly by reconstructing star-for-mation histories of individual galaxies. For example, the fraction of intermediate- age stars of Milky Way dwarf satellites depends on their distance from the Galaxy. On the contrary, this fraction is constant in M81 satellites (Da Costa), probably due to the compactness of the M81 group, where multiple close en-counters have homogenised their star-formation histories.
The evolution of groups
The origin of groups is probably related to large-scale gaseous filaments at high redshift. Before virialisation, smooth accretion, supernovae and AGN acti- vity enhance the entropy, and the metal-enriched gas cannot be retained by the shallow potential of pre-collapse groups (Ponman, Borgani). During the viriali- sation, the central spheroidals grow via mergers. Early-type stars and enriched
gas become part of the intragroup environment. Eventually, common dark matter and hot (X-ray) gas halos are formed (Zabludoff). The X-ray emission increases, and the X-ray halo becomes more and more regular. Later, the dif- fuse DM distribution will reduce the mer-ger rate and moderate the evolution of groups. At least a fraction of groups end their lives as fossil groups.
Most low-redshift groups are just detach-ing from the Hubble flow, as suggested by the time evolution of the virial mass-to-light ratio (Mamon). In particular, the de-tachment for the Local Group occurred at z < 0.7 (Freeman). The mass-tempera-ture and mass-luminosity distributions in the X-rays for clusters and groups can constrain the cosmological parameters (Borgani).
To summarise, as a group evolves, the dwarf-to-giant ratio, early-type galaxy fraction, intragroup starlight and metal-licity, the velocity dispersion, and the mass of the central giant elliptical grow. The metallicity of the intragroup medium also increases thanks to the intragroup stars, whose ejecta do not have to over-come galactic potential wells (Zabludoff).
Observations are consistent with this sce-nario. As mentioned above, groups with
Other Astronomical News Saviane I. et al., Conference on Groups of Galaxies in the Nearby Universe
Name
160 and 400 square-degree ROSATsurveys
2PIGG (2dFGRS Percolation-InferredGalaxy Group) catalogue
ALFALFA (Arecibo Legacy Fast Alfa(= Arecibo L-Band Feed Array)) survey
AMIGA project (Analysis of the Inter-stellar Medium of Isolated Galaxies)
CNOC2 (Canadian Network for Obser-vational Cosmology) survey
GEMS (Group Evolution Multiwave-length Study) project
H i survey of six loose groups
LVHIS (Local Volume H i Survey)
Sharc (Serendipitous High-redshiftArchival ROSAT Cluster) survey
Description
14 groups were studied to compute the mass and compare mass-to-light ratioswith simulations
The largest available homogeneous sample of galaxy groups, public
Large-scale survey of extragalactic H i over 7000 square degrees of sky, up tocz = 18 000 km/s. Spectral resolution is 5 km/s. It can detect H i clouds with more than 107 MA throughout most of the Local Supercluster
Multiwavelength database of isolated galaxies, including optical (B and Ha),infrared (FIR and NIR) and radio (continuum plus H i and CO lines)
Spectroscopically selected catalogue of 200 groups at intermediate redshift over 1.5 square degrees on the sky
Catalogue of 60 galaxy groups at 15–130 Mpc distance. Plus: X-ray (ROSAT PSPC 10 000 sec, 1.5 degrees), optical imaging (0.5 degrees), Parkes H i mapping (5.5 degrees), ATCA H i follow-up, 6 dFGS spectra, 2 MASS K-band photometry, XMM/Chandra imaging, Mock catalogues
Observations of six spiral-rich, loose groups between 10.6–13.4 Mpc,over 25–35 square degrees: Parkes Multibeam and ATCA; Mass sensitivity of 5–8 x 10⁵ MA
H i imaging of all nearby (distance less that 10 Mpc), gas-rich galaxies;deep 20-cm radio continuum imaging with ATCA and VLA; deep H-band and Ha imaging
638 ROSAT PSPC observations with |b| > 20 degrees and exposure time greaterthan 10 000 seconds; total 178.6 square degrees; found the most distant fossil group at z = 0.59
Reference
Vikhlinin et al. 1998, ApJ 502, 558(presented by A. Hornstrup)
Eke et al. 2004, MNRAS 348, 866
Giovanelli 2005, AAS 207, #192.03
Verdes-Montenegro et al. 2005, A&A436, 443
Carlberg et al. 2001, ApJ 552, 427
presented by Forbes
presented by Pisano
presented by Koribalski
Romer et al. 2000, ApJS 126, 209(presented by F. Durret)
Table 1: Summary of the state-of-the-art group catalogues and surveys discussed at the meeting.
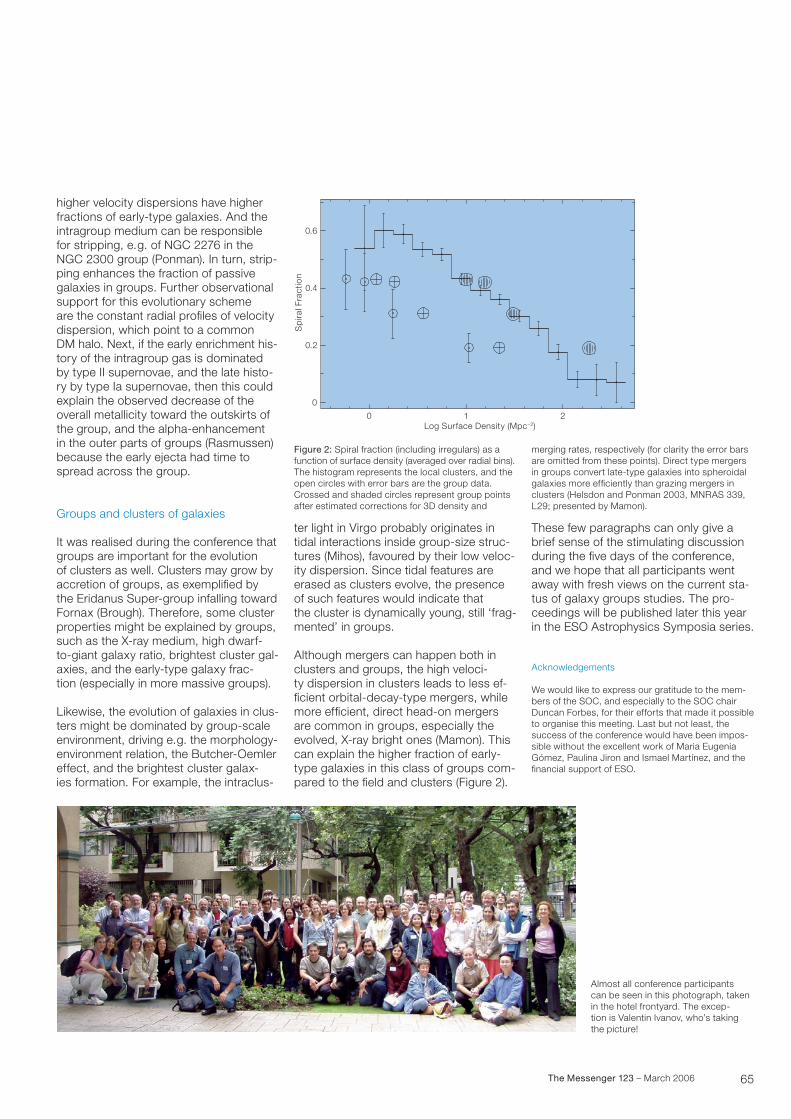
65The Messenger 123 – March 2006
higher velocity dispersions have higher fractions of early-type galaxies. And the intragroup medium can be responsible for stripping, e.g. of NGC 2276 in the NGC 2300 group (Ponman). In turn, strip-ping enhances the fraction of passive galaxies in groups. Further observational support for this evolutionary scheme are the constant radial profiles of velocity dispersion, which point to a common DM halo. Next, if the early enrichment his- tory of the intragroup gas is dominated by type II supernovae, and the late histo- ry by type Ia supernovae, then this could explain the observed decrease of the overall metallicity toward the outskirts of the group, and the alpha-enhancement in the outer parts of groups ( Rasmussen) because the early ejecta had time to spread across the group.
Groups and clusters of galaxies
It was realised during the conference that groups are important for the evolution of clusters as well. Clusters may grow by accretion of groups, as exemplified by the Eridanus Super-group infalling toward Fornax (Brough). Therefore, some cluster properties might be explained by groups, such as the X-ray medium, high dwarf- to-giant galaxy ratio, brightest cluster gal-axies, and the early-type galaxy frac- tion (especially in more massive groups).
Likewise, the evolution of galaxies in clus- ters might be dominated by group-scale environment, driving e.g. the morphology- environment relation, the Butcher-Oemler effect, and the brightest cluster galax- ies formation. For example, the intraclus-
ter light in Virgo probably originates in tidal interactions inside group-size struc-tures (Mihos), favoured by their low veloc- ity dispersion. Since tidal features are erased as clusters evolve, the presence of such features would indicate that the cluster is dynamically young, still ‘frag- mented’ in groups.
Although mergers can happen both in clusters and groups, the high veloci- ty dispersion in clusters leads to less ef-ficient orbital-decay-type mergers, while more efficient, direct head-on mergers are common in groups, especially the evolved, X-ray bright ones (Mamon). This can explain the higher fraction of early- type galaxies in this class of groups com-pared to the field and clusters (Figure 2).
These few paragraphs can only give a brief sense of the stimulating discussion during the five days of the conference, and we hope that all participants went away with fresh views on the current sta- tus of galaxy groups studies. The pro-ceedings will be published later this year in the ESO Astrophysics Symposia series.
Acknowledgements
We would like to express our gratitude to the mem-bers of the SOC, and especially to the SOC chair Duncan Forbes, for their efforts that made it possible to organise this meeting. Last but not least, the success of the conference would have been impos-sible without the excellent work of Maria Eugenia Gómez, Paulina Jiron and Ismael Martínez, and the financial support of ESO.
0 1 2Log Surface Density (Mpc–2)
0.6
0.4
0.2
0
Sp
iral
Fra
ctio
n
Figure 2: Spiral fraction (including irregulars) as a function of surface density (averaged over radial bins). The histogram represents the local clusters, and the open circles with error bars are the group data. Crossed and shaded circles represent group points after estimated corrections for 3D density and
Almost all conference participants can be seen in this photograph, taken in the hotel frontyard. The excep- tion is Valentin Ivanov, who’s taking the picture!
merging rates, respectively (for clarity the error bars are omitted from these points). Direct type mergers in groups convert late-type galaxies into spheroidal galaxies more efficiently than grazing mergers in clusters (Helsdon and Ponman 2003, MNRAS 339, L29; presented by Mamon).
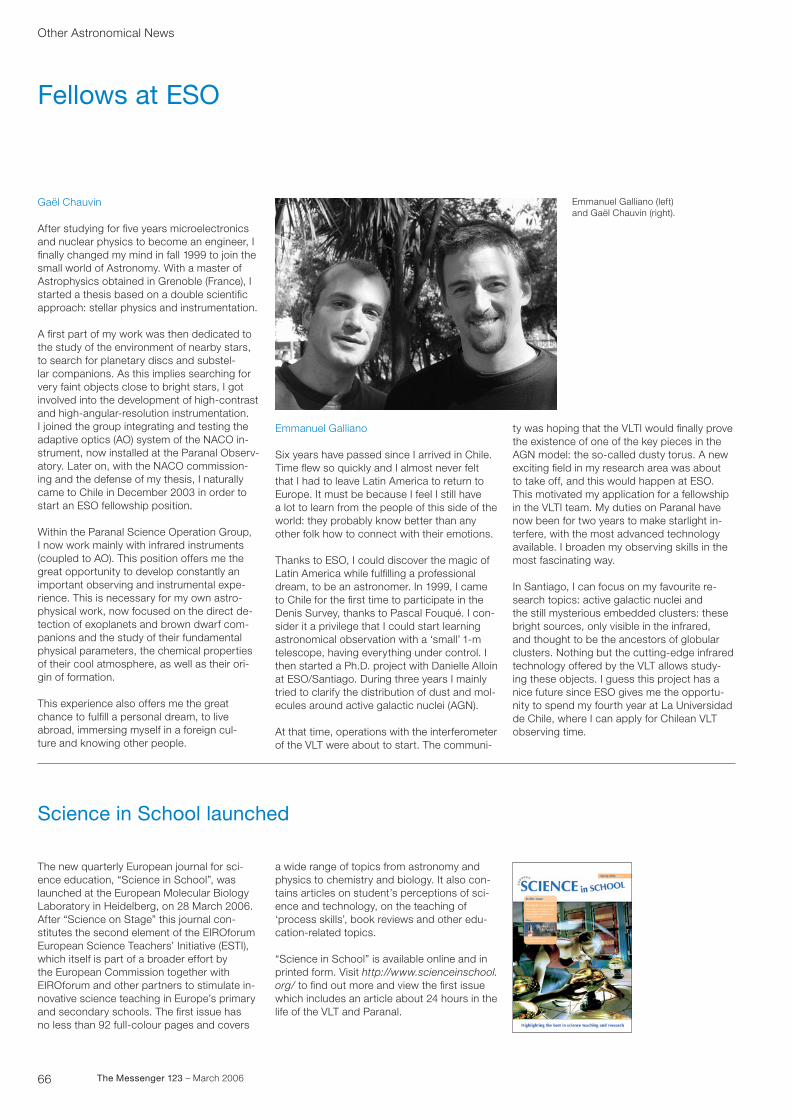
66 The Messenger 123 – March 2006
Other Astronomical News
Fellows at ESO
Gaël Chauvin
After studying for five years microelectronics and nuclear physics to become an engineer, I finally changed my mind in fall 1999 to join the small world of Astronomy. With a master of Astrophysics obtained in Grenoble (France), I started a thesis based on a double scientific approach: stellar physics and instrumentation.
A first part of my work was then dedicated to the study of the environment of nearby stars, to search for planetary discs and substel- lar companions. As this implies searching for very faint objects close to bright stars, I got involved into the development of high-contrast and high-angular-resolution instrumentation. I joined the group integrating and testing the adaptive optics (AO) system of the NACO in-strument, now installed at the Paranal Observ- atory. Later on, with the NACO commission-ing and the defense of my thesis, I naturally came to Chile in December 2003 in order to start an ESO fellowship position.
Within the Paranal Science Operation Group, I now work mainly with infrared instruments (coupled to AO). This position offers me the great opportunity to develop constantly an important observing and instrumental expe- rience. This is necessary for my own astro-physical work, now focused on the direct de- tection of exoplanets and brown dwarf com-panions and the study of their fundamental physical parameters, the chemical properties of their cool atmosphere, as well as their ori-gin of formation.
This experience also offers me the great chance to fulfill a personal dream, to live abroad, immersing myself in a foreign cul- ture and knowing other people.
Emmanuel Galliano
Six years have passed since I arrived in Chile. Time flew so quickly and I almost never felt that I had to leave Latin America to return to Europe. It must be because I feel I still have a lot to learn from the people of this side of the world: they probably know better than any other folk how to connect with their emotions.
Thanks to ESO, I could discover the magic of Latin America while fulfilling a professional dream, to be an astronomer. In 1999, I came to Chile for the first time to participate in the Denis Survey, thanks to Pascal Fouqué. I con-sider it a privilege that I could start learning astronomical observation with a ‘small’ 1-m telescope, having everything under control. I then started a Ph.D. project with Danielle Alloin at ESO/Santiago. During three years I mainly tried to clarify the distribution of dust and mol-ecules around active galactic nuclei (AGN).
At that time, operations with the interferometer of the VLT were about to start. The communi-
ty was hoping that the VLTI would finally prove the existence of one of the key pieces in the AGN model: the so-called dusty torus. A new exciting field in my research area was about to take off, and this would happen at ESO. This motivated my application for a fellowship in the VLTI team. My duties on Paranal have now been for two years to make starlight in-terfere, with the most advanced technology available. I broaden my observing skills in the most fascinating way.
In Santiago, I can focus on my favourite re-search topics: active galactic nuclei and the still mysterious embedded clusters: these bright sources, only visible in the infrared, and thought to be the ancestors of globular clusters. Nothing but the cutting-edge infrared technology offered by the VLT allows study- ing these objects. I guess this project has a nice future since ESO gives me the opportu-nity to spend my fourth year at La Universidad de Chile, where I can apply for Chilean VLT observing time.
Emmanuel Galliano (left) and Gaël Chauvin (right).
Science in School launched
The new quarterly European journal for sci-ence education, “Science in School”, was launched at the European Molecular Biology Laboratory in Heidelberg, on 28 March 2006. After “Science on Stage” this journal con-stitutes the second element of the EIROforum European Science Teachers’ Initiative (ESTI), which itself is part of a broader effort by the European Commission together with EIROforum and other partners to stimulate in-novative science teaching in Europe’s primary and secondary schools. The first issue has no less than 92 full-colour pages and covers
a wide range of topics from astronomy and physics to chemistry and biology. It also con- tains articles on student’s perceptions of sci- ence and technology, on the teaching of ‘process skills’, book reviews and other edu-cation-related topics.
“Science in School” is available online and in printed form. Visit http://www.scienceinschool.org/ to find out more and view the first issue which includes an article about 24 hours in the life of the VLT and Paranal.
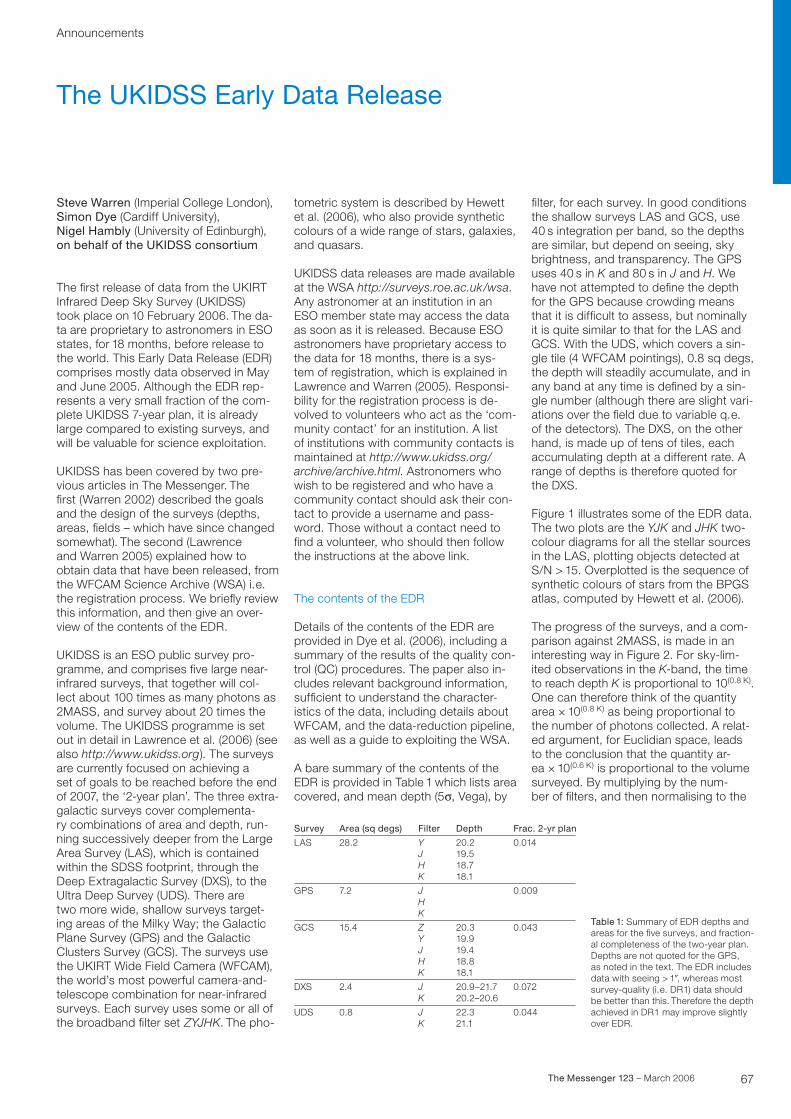
67The Messenger 123 – March 2006
Announcements
Steve Warren (Imperial College London), Simon Dye (Cardiff University),Nigel Hambly (University of Edinburgh),on behalf of the UKIDSS consortium
The first release of data from the UKIRT Infrared Deep Sky Survey (UKIDSS) took place on 10 February 2006. The da-ta are proprietary to astronomers in ESO states, for 18 months, before release to the world. This Early Data Release (EDR) comprises mostly data observed in May and June 2005. Although the EDR rep-resents a very small fraction of the com-plete UKIDSS 7-year plan, it is already large compared to existing surveys, and will be valuable for science exploitation.
UKIDSS has been covered by two pre- vious articles in The Messenger. The first (Warren 2002) described the goals and the design of the surveys (depths, areas, fields – which have since changed somewhat). The second (Lawrence and Warren 2005) explained how to obtain data that have been released, from the WFCAM Science Archive (WSA) i.e. the registration process. We briefly review this information, and then give an over-view of the contents of the EDR.
UKIDSS is an ESO public survey pro-gramme, and comprises five large near-infrared surveys, that together will col- lect about 100 times as many photons as 2MASS, and survey about 20 times the volume. The UKIDSS programme is set out in detail in Lawrence et al. (2006) (see also http://www.ukidss.org). The surveys are currently focused on achieving a set of goals to be reached before the end of 2007, the ‘2-year plan’. The three extra-galactic surveys cover complementa- ry combinations of area and depth, run-ning successively deeper from the Large Area Survey (LAS), which is contained within the SDSS footprint, through the Deep Extragalactic Survey (DXS), to the Ultra Deep Survey (UDS). There are two more wide, shallow surveys target-ing areas of the Milky Way; the Galactic Plane Survey (GPS) and the Galactic Clusters Survey (GCS). The surveys use the UKIRT Wide Field Camera (WFCAM), the world’s most powerful camera-and-telescope combination for near-infrared surveys. Each survey uses some or all of the broadband filter set ZYJHK. The pho-
tometric system is described by Hewett et al. (2006), who also provide synthetic colours of a wide range of stars, galaxies, and quasars.
UKIDSS data releases are made available at the WSA http://surveys.roe.ac.uk/wsa. Any astronomer at an institution in an ESO member state may access the data as soon as it is released. Because ESO astronomers have proprietary access to the data for 18 months, there is a sys- tem of registration, which is explained in Lawrence and Warren (2005). Responsi-bility for the registration process is de- volved to volunteers who act as the ‘com-munity contact’ for an institution. A list of institutions with community contacts is maintained at http://www.ukidss.org/ archive/archive.html. Astronomers who wish to be registered and who have a community contact should ask their con- tact to provide a username and pass-word. Those without a contact need to find a volunteer, who should then follow the instructions at the above link.
The contents of the EDR
Details of the contents of the EDR are provided in Dye et al. (2006), including a summary of the results of the quality con- trol (QC) procedures. The paper also in-cludes relevant background information, sufficient to understand the character-istics of the data, including details about WFCAM, and the data-reduction pipeline, as well as a guide to exploiting the WSA.
A bare summary of the contents of the EDR is provided in Table 1 which lists area covered, and mean depth (5s, Vega), by
filter, for each survey. In good conditions the shallow surveys LAS and GCS, use 40 s integration per band, so the depths are similar, but depend on seeing, sky brightness, and transparency. The GPS uses 40 s in K and 80 s in J and H. We have not attempted to define the depth for the GPS because crowding means that it is difficult to assess, but nominally it is quite similar to that for the LAS and GCS. With the UDS, which covers a sin- gle tile (4 WFCAM pointings), 0.8 sq degs, the depth will steadily accumulate, and in any band at any time is defined by a sin-gle number (although there are slight vari-ations over the field due to variable q.e. of the detectors). The DXS, on the other hand, is made up of tens of tiles, each accumulating depth at a different rate. A range of depths is therefore quoted for the DXS.
Figure 1 illustrates some of the EDR data. The two plots are the YJK and JHK two- colour diagrams for all the stellar sources in the LAS, plotting objects detected at S/N > 15. Overplotted is the sequence of synthetic colours of stars from the BPGS atlas, computed by Hewett et al. (2006).
The progress of the surveys, and a com- parison against 2MASS, is made in an interesting way in Figure 2. For sky-lim-ited observations in the K-band, the time to reach depth K is proportional to 10(0.8 K). One can therefore think of the quantity area × 10(0.8 K) as being proportional to the number of photons collected. A relat- ed argument, for Euclidian space, leads to the conclusion that the quantity ar-ea × 10(0.6 K) is proportional to the volume surveyed. By multiplying by the num- ber of filters, and then normalising to the
Survey
LAS
GPS
GCS
DXS
UDS
Area (sq degs)
28.2
7.2
15.4
2.4
0.8
Filter
YJHK
JHK
ZYJHK
JK
JK
Depth
20.219.518.718.1
20.319.919.418.818.1
20.9–21.720.2–20.6
22.321.1
Frac. 2-yr plan
0.014
0.009
0.043
0.072
0.044
Table 1: Summary of EDR depths and areas for the five surveys, and fraction-al completeness of the two-year plan. Depths are not quoted for the GPS, as noted in the text. The EDR includes data with seeing > 1?, whereas most survey-quality (i.e. DR1) data should be better than this. Therefore the depth achieved in DR1 may improve slightly over EDR.
The UKIDSS Early Data Release
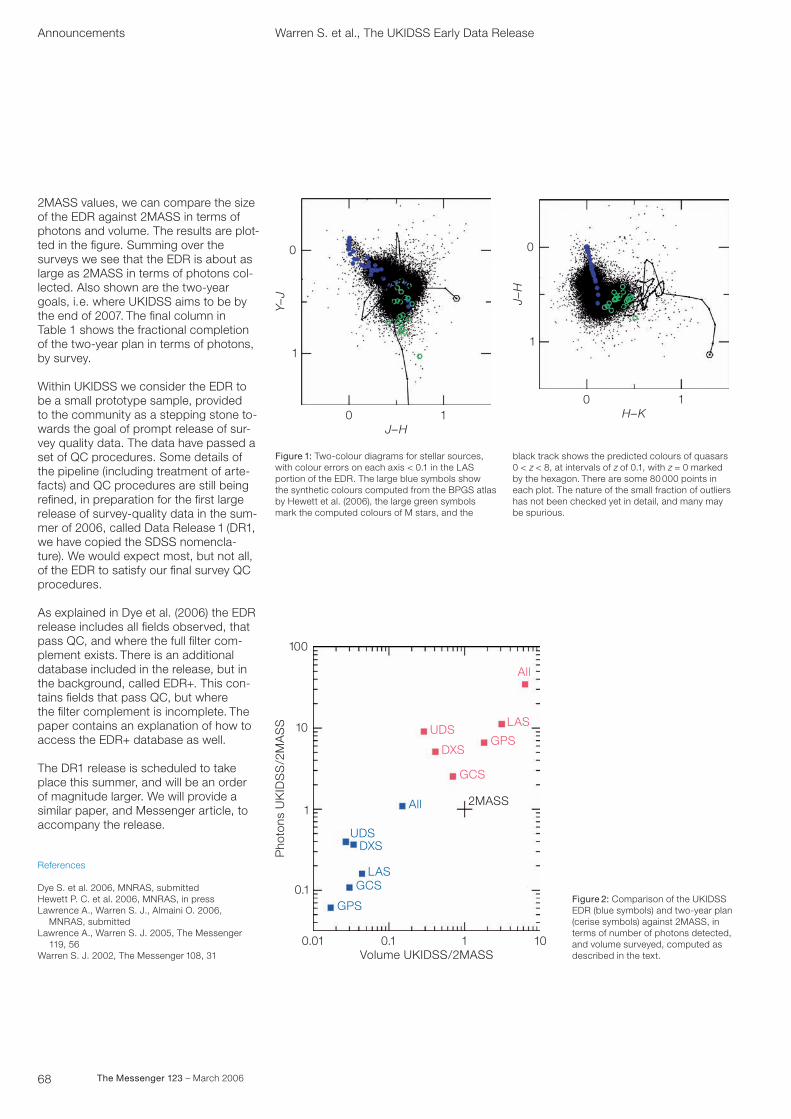
68 The Messenger 123 – March 2006
Warren S. et al., The UKIDSS Early Data Release
2MASS values, we can compare the size of the EDR against 2MASS in terms of photons and volume. The results are plot- ted in the figure. Summing over the surveys we see that the EDR is about as large as 2MASS in terms of photons col- lected. Also shown are the two-year goals, i.e. where UKIDSS aims to be by the end of 2007. The final column in Table 1 shows the fractional completion of the two-year plan in terms of photons, by survey.
Within UKIDSS we consider the EDR to be a small prototype sample, provided to the community as a stepping stone to- wards the goal of prompt release of sur-vey quality data. The data have passed a set of QC procedures. Some details of the pipeline (including treatment of arte-facts) and QC procedures are still being refined, in preparation for the first large release of survey-quality data in the sum-mer of 2006, called Data Release 1 (DR1, we have copied the SDSS nomencla- ture). We would expect most, but not all, of the EDR to satisfy our final survey QC procedures.
As explained in Dye et al. (2006) the EDR release includes all fields observed, that pass QC, and where the full filter com-plement exists. There is an additional database included in the release, but in the background, called EDR+. This con- tains fields that pass QC, but where the filter complement is incomplete. The paper contains an explanation of how to access the EDR+ database as well.
The DR1 release is scheduled to take place this summer, and will be an order of magnitude larger. We will provide a similar paper, and Messenger article, to accompany the release.
References
Dye S. et al. 2006, MNRAS, submittedHewett P. C. et al. 2006, MNRAS, in pressLawrence A., Warren S. J., Almaini O. 2006, MNRAS, submittedLawrence A., Warren S. J. 2005, The Messenger 119, 56Warren S. J. 2002, The Messenger 108, 31
Figure 1: Two-colour diagrams for stellar sources, with colour errors on each axis < 0.1 in the LAS portion of the EDR. The large blue symbols show the synthetic colours computed from the BPGS atlas by Hewett et al. (2006), the large green symbols mark the computed colours of M stars, and the
black track shows the predicted colours of quasars 0 < z < 8, at intervals of z of 0.1, with z = 0 marked by the hexagon. There are some 80 000 points in each plot. The nature of the small fraction of outliers has not been checked yet in detail, and many may be spurious.
0
0
J–H
Y–J
1
1
0
0
H–K
J–H
1
1
Figure 2: Comparison of the UKIDSS EDR (blue symbols) and two-year plan (cerise symbols) against 2MASS, in terms of number of photons detected, and volume surveyed, computed as described in the text.
0.01 0.1
0.1
Volume UKIDSS/2MASS
Pho
tons
UK
IDS
S/2
MA
SS
1
1
10
All
UDS
UDS
2MASS
DXS
DXS
LAS
LAS
GCS
GCS
GPS
GPS10
100
All
Announcements
69The Messenger 123 – March 2006
Deep Impact as a World Observatory Event – Synergies in Space, Time, and Wavelength
Workshop on
7–10 August 2006, Palace of the Royal Academy for Science and the Arts (RASAB), Brussels, Belgium
The astronomy group in the physics fac- ulty of the Vrije Universiteit Brussel to- gether with ESO, is organising a workshop on the worldwide observational campaign of the “Deep Impact Experiment” (c.f. Käufl et al. 2005, The Messenger 121, 11). In the context of NASA’s Deep Impact space mission Comet 9P/Tempel 1 was at the focus of an unprecedented world- wide long-term multi-wavelength obser-vation campaign. The comet was studied through its perihelion passage by various spacecraft including the Deep Impact mission itself, HST, Spitzer, Rosetta, XMM and all major ground-based observato-ries in a wavelength band from cm-wave radio astronomy to X-rays.
The objective of this workshop is to make full use of this data set by bringing together observers across the electro-magnetic spectrum and from different sites and projects. Synergy between the
different data sets can only be achieved if observers share their data and arrive at a coherent interpretation. Consequent- ly a coherent presentation of all data sets will allow theoreticians to fully appreciate all observational constraints.
Specific topics of this workshop are: General Cometary Topics From Space and Ground; the cometary nucleus; com-etary gas; cometary plasma; cometary dust; cometary surface and activity. Deep Impact Specific Questions will include: release of unprocessed primordial mate-rial from the formation period of the com-et; long-term effects from the impact; understanding of global properties of the nucleus; surface layering of the Comet 9P/Tempel 1 nucleus; impact cratering; understanding of cometary dust after deep impact; understanding the proc-esses in the gas coma; and ground sup-port of space missions (complementari- ty and needs).
The scientific organising committee is composed of: Chris Sterken (chair), Ulli Käufl (co-chair), Mike A’Hearn, Hermann Böhnhardt, Michael Combi, Yan Fernandez, Marco Fulle, Luisa Lara, Casey Lisse, Jean Manfroid, Karen Meech, Javier Licandro, Heike Rauer, Rita Schulz, Gerhardt Schwehm and Diane Wooden. The proceedings will ap-pear in the ESO/Springer series (eds. Ulli Käufl and Chris Sterken).
The relevant deadlines are: 3 April 2006, final call for papers; 15 June 2006, ab-stracts due for programme.
For further details, see http://www.eso.org/~hukaufl/deepimpact.html or http://www.vub.ac.be/STER/DI/di-conf2006.htm or contact Chris Sterken ([email protected]) or Ulli Käufl ([email protected]).
Scisoft VI
Richard Hook (ST-ECF/ESO) and the Scisoft Team
Scisoft is a collection of astronomical software intended mostly for ESO users but also distributed to other interested parties. It includes most of the pack-ages needed by working observational astronomers with an emphasis on those widely used for handling optical and infrared data sets. It is installed on all the standard scientific computers running Linux at ESO Garching. More complete details, including a list of software that is included in the bundle, can be found at www.eso.org/scisoft.
We are pleased to announce the avail-ability of Scisoft VI (April 2006). This new version of the collection includes many updates and additional packages and al- so incorporates some new features. Scisoft VI was built on, and intended to be used on, Fedora Core 3 Linux, but is likely to run on similar modern Linux systems. We no longer maintain a version of Scisoft for other architectures such as Solaris or HPUX but an independent version for Mac OSX, maintained outside ESO, is also available.
Scisoft VI can be either downloaded from the ESO ftp site, by following the link on the web page given above, or the entire
collection may be requested on DVD. Re-quests for DVDs should be made through the request form on the same web page or by email to scisoft_[email protected].
The next release of Scisoft will be Sci-soft VII at the end of 2006. This ver- sion will include a selection of virtual ob-servatory tools as well as many other new features.
Scisoft is a collaboration between many people at ESO. I would particularly like to thank Alexis Huxley, formerly with Terma at ESO, for his very diligent and thorough help with the technical aspects of the re- lease.
70 The Messenger 123 – March 2006
Announcements
Precision Spectroscopy in AstrophysicsConference on
11–15 September 2006, Aveiro, Portugal
In the last decade we have witnessed im- pressive advancements in the accuracy of Doppler-shift measurements in astron-omy and of high-precision spectroscopy in general.
The random measurement uncertainty depends on the inverse of the Signal- to-Noise ratio, therefore high accuracy re- quires a high photon flux and a large photon-collecting capability. As a conse-quence, not only the scientific domains using this technique benefit tremendous-ly from the use of 8-m-class telescopes, but, also, they will fully exploit the tremen-dous gain provided by future Extremely Large Telescopes (ELTs), as clearly shown by the preliminary study of CODEX. Even if most applications so far have been at
optical wavelengths, IR high-resolution spectroscopy should soon approach the same accuracy regime.
The goal of the conference is to gather together scientists to discuss all the scientific topics related to various as-pects of high-precision spectroscopy (de-termination of Doppler shifts, accurate line profiles, isotopic ratios, etc.). In addi-tion to presentations on the state of the art of research in the field, part of the programme will be devoted to future pro- grammes and instruments, including those for ELTs. In addition to presenting their current results, we would like to ask all the speakers to highlight also their limitations and to indicate, when possible, future avenues to progress.
This ESO conference is co-organised with the Centre for Astronomy and Astrophysics (University of Lisbon) and the University of Aveiro.
Scientific Organising Committee: Beatriz Barbuy (Brasil), Jacqueline Bergeron (France), Dainis Dravins (Sweden), Artie Hatzes (Germany), Garik Israelian (Spain), David Lambert (USA), Michel Mayor (Switzerland), Paolo Molaro (Italy), Mario J. Monteiro (Portugal), Luca Pasquini (ESO, co-chair), Max Pettini (UK), Martino Romaniello (ESO, co-chair), Nuno C. Santos (Portugal, co-chair)
Conference webpage: http://www.oal.ul.pt/psa2006Contact: [email protected]
MPA/ESO/MPE/USM Joint Astronomy Conference on
6–11 August 2006, Garching, Germany
The aim of the conference is a review of our knowledge of the physical processes controlling the state of the dense, cen- tral intracluster medium in galaxy clusters and to dicuss their analogy to feedback process in regulated galaxy formation.
Detailed multiwavelength observations suggest that the dense plasma regions at the centres of galaxy clusters, previous-ly thought to harbour cooling flows, are subject to a delicate balance between heating and cooling, which substantially reduces mass condensation and star- formation rates. While these regions are quite complex, the rich observational detail now becoming available can guide understanding and modelling. The aim of this conference is to provide a synthe-sis of all the observational evidence and to confront it with astrophysical model-ling. Analogous issues arise in the models of galaxy formation where the observed properties and the evolution of the galaxy population can only be explained if gas cooling and star formation are assumed to be regulated by feedback heating. The
conference will explore possible connec-tions between these two areas.
In recent years the effort to understand cluster cooling cores has grown both in terms of observation (in particular in X-rays with the Chandra and XMM-New-ton satellites) and in terms of detailed numerical hydrodynamical simulations. A review of the state of the subject is thus timely. Also, in recent years it has been much more generally appreciated that the suppression of gas cooling in the centre of galaxy clusters may be a model for the effects of feedback in galaxy and struc-ture formation in general. In our meeting we consequently broaden the view to in-clude feedback and self-regulation during galaxy formation.
The wealth of new observational data and modelling results will provide the basis for the current meeting, which will include the following topics: (i) evidence for cool-ing, cold material, and star formation in the centres of galaxy clusters and ellip-tical galaxies with results from observa-
tions in X-rays, optical, IR, radio, and ab- sorption studies), (ii) heating of central cluster regions by the AGN-intracluster medium interaction and by other proc-esses, confrontation of modelling results with observed cooling core structure, (iii) diagnostics of the cooling core re-gions through the entropy structure of the intracluster medium and chemical en- richment as signatures of feedback heat-ing in the past, (iv) the need for feedback regulation in galaxy formation, detailed comparison of model predictions and ob-servations for the feedback during gal- axy formation from both, stars/superno-vae and from AGN.
Scientific Organising Committee: M. Arnaud, M. Begelman, H. Böhringer, M. Donahue, A. Fabian, G. Hasinger, T. Heckman, C. Jones, B. McNamara, T. Ohashi, F. Owen, M. Pettini, T. Reiprich, A. Renzini, P. Rosati, C. Sarazin, N. Soker, R. Sunyeav, S. White
Visit out webpage: http://www.mpe.mpg.de/~cool06
Heating versus Cooling in Galaxies and Clusters of Galaxies
71The Messenger 123 – March 2006
National Events: April–October 2006, in 29 participating countriesInternational Event: 2–6 April 2007, ATRIA Centre, Grenoble, France
The first Science on Stage festival, held at CERN in Geneva in November 2005, was a great success. As described in the previous issue of The Messenger, al- most five hundred science educators from across Europe met to share innova-tive science-teaching techniques.
Now, the countdown has begun for Sci-ence on Stage 2. The festival is again being organised by the EIROforum, of which ESO is a member, and co-funded by the European Commission as part of the EIROforum Science Teachers’ Ini- tiative (ESTI). The international event will take place in Grenoble at the ATRIA
Centre from 2–6 April 2007. The Euro-pean Synchrotron Research Facility and the Institut Laue-Langevin are the local organisers from the EIROforum.
If you are a teacher or are interested in innovative teaching methods, and are from one of the 29 countries who will be represented at Science on Stage 2, then now is your chance to get involved! Each country will be running a National Event during 2006, in order to choose the delegates who will go to Grenoble in April 2007.
Science on Stage 2
Visit the Science on Stage website at http://www.scienceonstage.net/ (or email [email protected]) to find contact details for your National Steering Committee (NSC). The national websites will be avail-able by the end of April, giving details of how to get involved with Science on Stage at a national level. The National Events will be taking place between April and October of this year, so if you want to join this exciting programme you should contact your NSC as soon as possible.
For further details see http://www. scienceonstage.net/ or email [email protected]
Euroscience Open Forum – ESOF2006
15–19 July 2006, Munich, Germany
Following the successful first ESOF2004 event in Stockholm, the second pan-European ‘General Science Meeting’ ESOF2006 is scheduled to be held in Mu- nich from 15–19 July 2006 at the Forum am Deutschen Museum and the Deut-sches Museum. ESOF constitutes an at- tempt to create a European version of the famous AAAS meeting and targets scientists, science administrators and policy makers as well as science journal-ists from across the continent.
ESOF is an initiative by EUROSCIENCE with strong sponsors including the Eu-ropean Commission and major German funders. It is supported by an advisory board, which – among others – includes Enric Banda (former Secretary General of ESF), Phillip Campbell (editor of Nature), Helga Nowotny (until recently chairperson of EURAB and a member of the Scien-tific Advisory Board of the future Europe-an Research Council) and the Directors General of ESO, Catherine Cesarsky, and the EPO, Alain Pompidou.
The organisers intend to put a special focus on young scientists, young journal-ists and students through an exten- sive Careers Programme with educational workshops and seminars on career de-velopment. In this connection, the EIRO-forum will organise videoconferences to the facilities of the partner organisations, including ESO.
According to the current programme, the meeting comprises over 70 seminars, symposia and workshops.
One of these seminars – on exoplanet re- search – is organised by ESO. This parti-cular session will take place on 17 July 2006 at the Forum. Another astronomy-related event is the key-note talk by Prof. Gerry Gilmore (Cambridge Univer-sity) with the title “The history and future of the Universe”.
As at the Stockholm meeting, ESO will also be represented as part of the EIROforum partnership that will mount a major information stand at the exhibition area, also at the Forum.
Also as in Stockholm, which featured a wide programme for the general pub- lic, ESOF2006 offers an interesting range of outreach activities, comprising hands- on experiments, games and science cafés. These activities will be held to-gether with the German national science week from 15–21 July 2006. The pub- lic activities are free and will take place at the Marienhof square, behind the his- torical Munich town hall. The Wissen-schaftssommer is organised annually by Wissenschaft im Dialog, an initiative of the Stifterverband für die Deutsche Wis-senschaft and other German science-funding organisations.
For further information, see: http://www.esof2006.org
Contact: Claus Madsen ([email protected]), Bruno Leibundgut ([email protected])
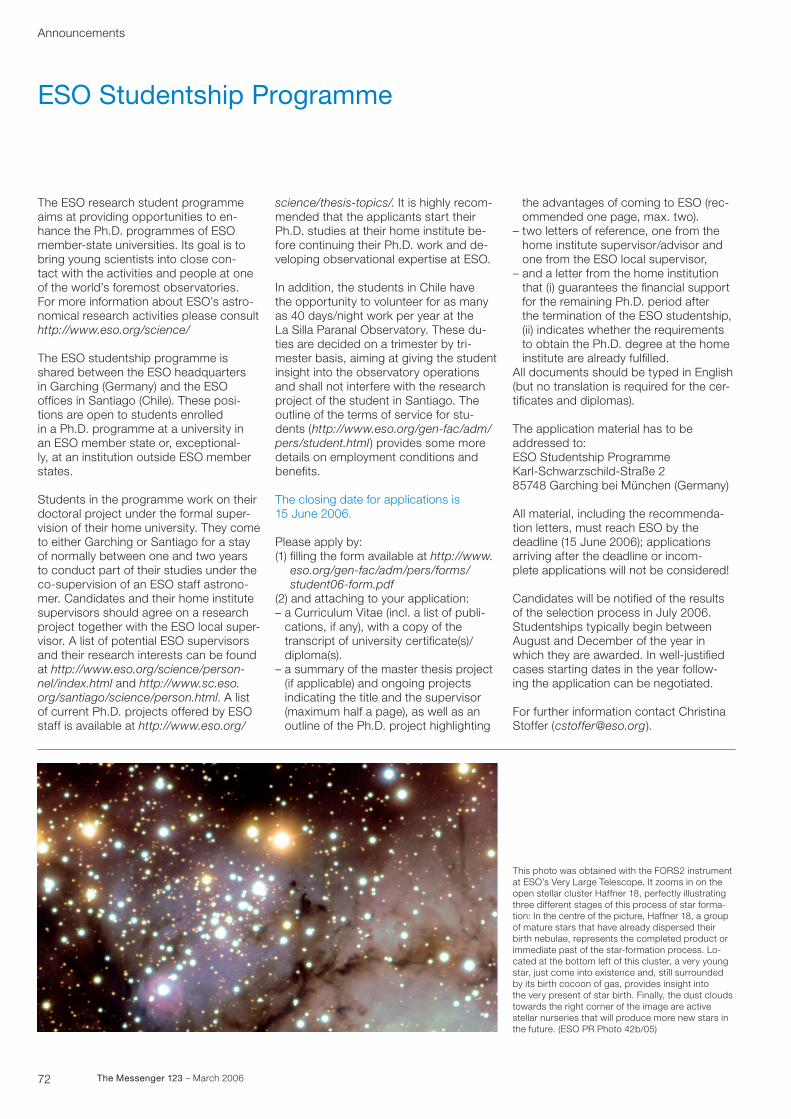
72 The Messenger 123 – March 2006
Announcements
ESO Studentship Programme
The ESO research student programme aims at providing opportunities to en-hance the Ph.D. programmes of ESO member-state universities. Its goal is to bring young scientists into close con- tact with the activities and people at one of the world’s foremost observatories. For more information about ESO’s astro-nomical research activities please consult http://www.eso.org/science/
The ESO studentship programme is shared between the ESO headquarters in Garching (Germany) and the ESO offices in Santiago (Chile). These posi-tions are open to students enrolled in a Ph.D. programme at a university in an ESO member state or, exceptional- ly, at an institution outside ESO member states.
Students in the programme work on their doctoral project under the formal super-vision of their home university. They come to either Garching or Santiago for a stay of normally between one and two years to conduct part of their studies under the co-supervision of an ESO staff astrono-mer. Candidates and their home institute supervisors should agree on a research project together with the ESO local super-visor. A list of potential ESO supervisors and their research interests can be found at http://www.eso.org/science/person-nel/index.html and http://www.sc.eso.org/santiago/science/person.html. A list of current Ph.D. projects offered by ESO staff is available at http://www.eso.org/
science/thesis-topics/. It is highly recom-mended that the applicants start their Ph.D. studies at their home institute be- fore continuing their Ph.D. work and de-veloping observational expertise at ESO.
In addition, the students in Chile have the opportunity to volunteer for as many as 40 days/night work per year at the La Silla Paranal Observatory. These du- ties are decided on a trimester by tri-mester basis, aiming at giving the student insight into the observatory operations and shall not interfere with the research project of the student in Santiago. The outline of the terms of service for stu-dents (http://www.eso.org/gen-fac/adm/pers/student.html) provides some more details on employment conditions and benefits.
The closing date for applications is 15 June 2006.
Please apply by:(1) filling the form available at http://www.
eso.org/gen-fac/adm/pers/forms/ student06-form.pdf
(2) and attaching to your application:– a Curriculum Vitae (incl. a list of publi-
cations, if any), with a copy of the transcript of university certificate(s)/diploma(s).
– a summary of the master thesis project (if applicable) and ongoing projects indicating the title and the supervisor (maximum half a page), as well as an outline of the Ph.D. project highlighting
the advantages of coming to ESO (rec-ommended one page, max. two).
– two letters of reference, one from the home institute supervisor/advisor and one from the ESO local supervisor,
– and a letter from the home institution that (i) guarantees the financial support for the remaining Ph.D. period after the termination of the ESO studentship, (ii) indicates whether the requirements to obtain the Ph.D. degree at the home institute are already fulfilled.
All documents should be typed in English (but no translation is required for the cer-tificates and diplomas).
The application material has to be addressed to:ESO Studentship Programme Karl-Schwarzschild-Straße 285748 Garching bei München (Germany)
All material, including the recommenda- tion letters, must reach ESO by the deadline (15 June 2006); applications arriving after the deadline or incom- plete applications will not be considered!
Candidates will be notified of the results of the selection process in July 2006. Studentships typically begin between August and December of the year in which they are awarded. In well-justified cases starting dates in the year follow- ing the application can be negotiated.
For further information contact Christina Stoffer ([email protected]).
This photo was obtained with the FORS2 instrument at ESO’s Very Large Telescope. It zooms in on the open stellar cluster Haffner 18, perfectly illustrating three different stages of this process of star forma-tion: In the centre of the picture, Haffner 18, a group of mature stars that have already dispersed their birth nebulae, represents the completed product or immediate past of the star-formation process. Lo-cated at the bottom left of this cluster, a very young star, just come into existence and, still surrounded by its birth cocoon of gas, provides insight into the very present of star birth. Finally, the dust clouds towards the right corner of the image are active stellar nurseries that will produce more new stars in the future. (ESO PR Photo 42b/05)
73The Messenger 123 – March 2006
ESO is opening the following management positions of
The Director responsible for the Observatories on La Silla, Paranal and APEX will lead a multidisciplinary team and act as a link be-tween user community, the Director General and the Observatories. She/he will in particular be responsible for:– the continuation, creation and implementation of scientific and
technical policies for the operation of the Observatories in accord-ance with ESO’s overall policy
– the management of the Observatories and their staff members through the definition and implementation of goals and objectives
– the Observatories’ budget– the representation of all Observatories in the science community,
public and public relations (e.g. media support, exhibitions, presentations, etc.) in close interaction with ESO’s representative in Chile and the Public Affairs Department.
The Director of the Observatories reports directly to the Director General. The staff of the Observatories presently consist of about 70 international and 150 local staff members who work in groups or teams. As a senior astronomer the Director of the Observato- ries is a member of the ESO science faculty and is expected and encouraged to actively conduct astronomical research. She/he should foster the participation and integration of the scientists of the Observatories in the ESO faculty and in the Office for Science in Santiago.
Basic requirements for the position include a Ph.D. in astronomy, astrophysics or physics, or related fields, substantial and long or equivalent experience in management and leadership preferably gained within multinational scientific organisations. A proven record in astronomical systems such as instruments, large optical tele-scopes or systems of equivalent complexity as well as an outstand-ing record of astronomical research and international scientific collaborations are required. Initiative, ability to judge, to decide and to work with people of different nationalities as well as excellent communication skills are essential. The position requires a very good knowledge of English and a working knowledge of Spanish or willingness to learn it.
Senior AstronomerDirector of the La Silla Paranal Observatory
ESO
European Organisationfor Astronomical Research in the Southern Hemisphere
ESO. Astronomy made in Europe
Associate Director
The primary purpose of this position is to support and assist the Director General in the discharge of his/her duties. The Associate Director reports directly to the Director General and is required to work closely with division heads and other senior staff in the Or- ganisation. She/he shall carry out such tasks as requested or delegated by the Director General which shall include, but not be limited to, responsibility for:– providing the Director General with briefing material and appropri-
ate analysis on any matter which could have implications for the operation of ESO
– the management of the Council secretariat– the management of the ALMA board and European ALMA board
business, and specifically acting as ALMA board secretary when the chair is nominated by ESO.
An appropriate professional qualification as well as substantial man-agement and leadership experience within a scientific organisation, preferably international, are required. Excellent communication skills and a very good knowledge of English are essential.
As members of the ESO management both job holders contribute directly to the development of the overall policy, the strategic plan-ning, and maintain professional contacts at highest level outside the Organisation.
For details and to download an application form, please consult our homepage: http://www.eso.org. If you are interested in working in areas of frontline technology and in a stimulating international en-vironment please send your application in English to:
ESO Personnel Department, Karl-Schwarzschild-Straße 2 85748 Garching near Munich, Germanye-mail: [email protected]
ESO is an equal opportunity employer. Qualified female candidates are invited to apply.
74 The Messenger 123 – March 2006
ESO is opening the following positions of
This position is in the Instrumentation Division which is responsible for the design and develop-ment of advanced optical and infrared instru-ments for the Very Large Telescope and other telescopes at ESO’s La Silla Paranal Observatory and, in the future, for a possible Extremely Large (30–60 m diametre) Telescope (see http://www.eso.org/instruments/ ).
The successful candidate will initially work in the Optical Instrumentation Department as Instru-ment Scientist of the X-shooter, a medium-resolu-tion, echelle spectrograph for the VLT, covering in one exposure the spectral region from the UV- to the K-band and expected to go to the tele- scope in 2008. She/he will directly be in charge or collaborate with the P.I. and project manager of the project in various tasks related to the docu-mentation for the instrument (e.g. calibration plan, commissioning plan, user manual), the develop-ment of the exposure time calculator, of the data- reduction pipeline, the testing of the instrument in Europe and the commissioning in Chile. She/he will be responsible for verifying that the overall performance of the instrument at the telescope matches the specified values, and support the op-eration during the first year. In parallel, she/he will be involved in the definition studies of other instru-ment projects for the VLT and possibly the ELT.
Basic requirements for the position include qua- lified experience in observational astronomy at optical or IR wavelengths at large telescopes. A proven, strong record of scientific research in areas which are related to the functional work and good experience with spectroscopic data- reduction packages in IDL, IRAF or MIDAS are a requirement.
This is an astronomer position in the ESO faculty. The successful candidate is expected to carry out a vigorous research programme in the field of ob-servational astronomy. He/she is entitled to work up to 50 % on scientific research and will receive financial and technical support by the ESO faculty for this purpose.
Instrument Scientist
ESO
European Organisationfor Astronomical Research in the Southern Hemisphere
ESO. Astronomy made in Europe
Front End Production EngineerWithin the European ALMA team, the selected candidate will take up responsibilities in the prduction engineering, integration and monitoring of contracts for the receivers of the ALMA radio telescope.The position will include the following tasks:– management, both technical and programmatic,
of individual production work packages for the ALMA Front End (FE) subsystem and the related production contracts
– developing front end integration and test plans, and assist in the development of an operations and maintenance plan in close collaboration with ALMA system engineers
– quality management: definition of applicable processes, mainly in the areas of production, integration and validation. Participation in and organisation of product reviews
– assisting in developing and maintaining the FE subsystem specifications and interfaces. Assuring that subsystem designs comply with defined specifications.
– keeping track of detailed subsystem perform-ance of the front end technical budgets.
– contributing to the ALMA configuration and change-control processes.
– reporting directly to the European ALMA Front End IPT manager.
We seek a professional with a university degree in engineering, in one or more of the following fields: electronics, technical physics or other relevant fields and at least five years of working experience in an engineering position on multidisciplinary, high- technology, and complex electronics project(s).
For details and to download an application form, please consult our homepage: http://www.eso.org.
If you are interested in working in a stimulating in-ternational research environment and in areas of frontline science and technology, please send us your application in English to:
Software EngineersThe successful candidates will work within the Data Flow Systems (DFS) Department, which is re-sponsible for designing, implementing, testing and maintaining the Data Flow System used to operate ESO’s Very Large Telescope (VLT) array.
Two positions are opened in the area of detailed design, development and documentation of components of the back-end DFS, that is the col-lection of client server applications used on-line at the Observatory and off-line in Garching to collect, archive and organise the raw data, sched- ule and parallise their processing. Sound ex- perience in Java, C++ and a solid understanding of data archives are required.
An additional position is opened to the verification and validation of a subset of the DFS, starting with the back-end applications used at the Observa-tory and in Garching. She/he will be responsible for defining, implementing and executing manually or automatically test cases to ensure that users’ requirements have been met and that the behav-iour under abnormal or extreme conditions is acceptable. Test data will have to be defined and maintained, test plans and reports produced and discussed with development teams, accord-ing to DFS Software Quality Assurance stand- ards. A first level support to DFS users should be provided. Finally, she/he will contribute to the DFS installation activities and software configura-tion management. A minimum of three years of experience in testing and integration of complex distributed software applications running on UNIX platforms is required.
ESO Personnel DepartmentKarl-Schwarzschild-Straße 2 85748 Garching near Munich, Germanye-mail: [email protected]
ESO is an equal opportunity employer. Qualified female candidates are invited to apply.
Announcements
75The Messenger 123 – March 2006
1 January–31 March 2006
Arrivals
Europe
Abuter, Roberto (RCH) Software EngineerBotticella, Maria Teresa (I) StudentCaproni, Alessandro (I) Software EngineerDi Dio, Tommaso (I) Accounting ClerkGuidolin, Ivan Maria (I) Electronics EngineerJahreiss, Hans (D) Head of AdministrationPatkós, Eniko (H) European Affairs OfficerSuc, Vincent (F) StudentTaylor, Luke (GB) Laser SpecialistTurolla, Stefano (I) Software EngineerVasisht, Gautam (IND) Software EngineerYaitskova, Nataliya (RUS) Applied Scientist
Chile
Choque Cortez, Christian (BOL) StudentFrancois, Patrick (F) Operations Staff AstronomerHaguenauer, Pierre (F) Optical EngineerKubas, Daniel (D) FellowMellado, Angel (RCH) Mechanical TechnicianPizarro, Andres (RCH) Safety OfficerRahoui, Farid (F) StudentSomboli, Fabio (I) System Engineer
Departures
Europe
Alves, João (P) AstronomerBoneva, Kristina (BG) StudentDell’Erba, Anna Maria (I) Administrative AssistantLarsen, Søren (DK) Instrument ScientistLeoni, Marco (I) Software EngineerNees, Walter (D) Head of Electronic SystemsPott, Jörg-Uwe (D) StudentRettura, Alessandro (I) Student
Chile
Badel, Arnaud (F) StudentBrancacho, Jorge (RCH) Software EngineerCoppolani, Franck (F) StudentInzunza, Lorena (RCH) Telescope Instruments OperatorSchemrl, Anton (RCH) Data Handling AdministratorTorres, Danilo (RCH) Electronics Engineer
Personnel Movements
List of Proceedings from the ESO Astrophysics Symposia
Volume
(foreseen for July) 2006
(foreseen for April) 2006
2005
2005
2005
2005
16/2003
15/2004
14/2003
13/2003
12/2003
11/2003
10/2003
9/2003
8/2003
7/2003
6/2003
Title
Chemical Abundances and Mixing in Stars in the Milky Way and its Satellites
Planetary Nebulae Beyond the Milky Way
Growing Black Holes: Accretion in a Cosmological Context
High Resolution Infrared Spectroscopy in Astronomy
Multiwavelength Mapping of Galaxy Formation and Evolution
Science with Adaptive Optics
Astronomy, Cosmology and Fundamental Physics
Toward an International Virtual Observatory
Extragalactic Globular Cluster Systems
From Twilight to Highlight: The Physics of Supernovae
The Mass of Galaxies at Low and High Redshift
Lighthouses of the Universe: The Most Luminous Celestial Objectsand Their Use for Cosmology
Scientific Drivers for ESO Future VLT/VLTI Instrumentation
The Origin of Stars and Planets: The VLT View
Gamma-Ray Bursts in the Afterglow Era
Deep Fields
Mining the Sky
Editors
Sofia Randich, Luca Pasquini
Letizia Stanghellini, Jeremy R. Walsh, Nigel G. Douglas
Andrea Merloni, Sergei Nayakshin, Rashid A. Sunyaev
Hans-Ulrich Käufl, Ralf Siebenmorgen, Alan F. M. Moorwood
Alvio Renzini, Ralf Bender
Wolfgang Brandner, Markus Kasper
Peter A. Shaver, Luigi DiLella, Alvaro Giménez
Peter J. Quinn, Krzysztof M. Górski
Markus Kissler-Patig
Wolfgang Hillebrandt, Bruno Leibundgut
Ralf Bender, Alvio Renzini
Marat Gilfanov, Rashid A. Sunyaev, Eugene Churazov
Jacqueline Bergeron, Guy Monnet
João F. Alves, Mark J. McCaughrean
Enrico Costa, Filippo Frontera, Jens Hjorth
Stefano Cristiani, Alvio Renzini, Robert E. Williams
Anthony J. Banday, Saleem Zaroubi, Matthias Bartelmann
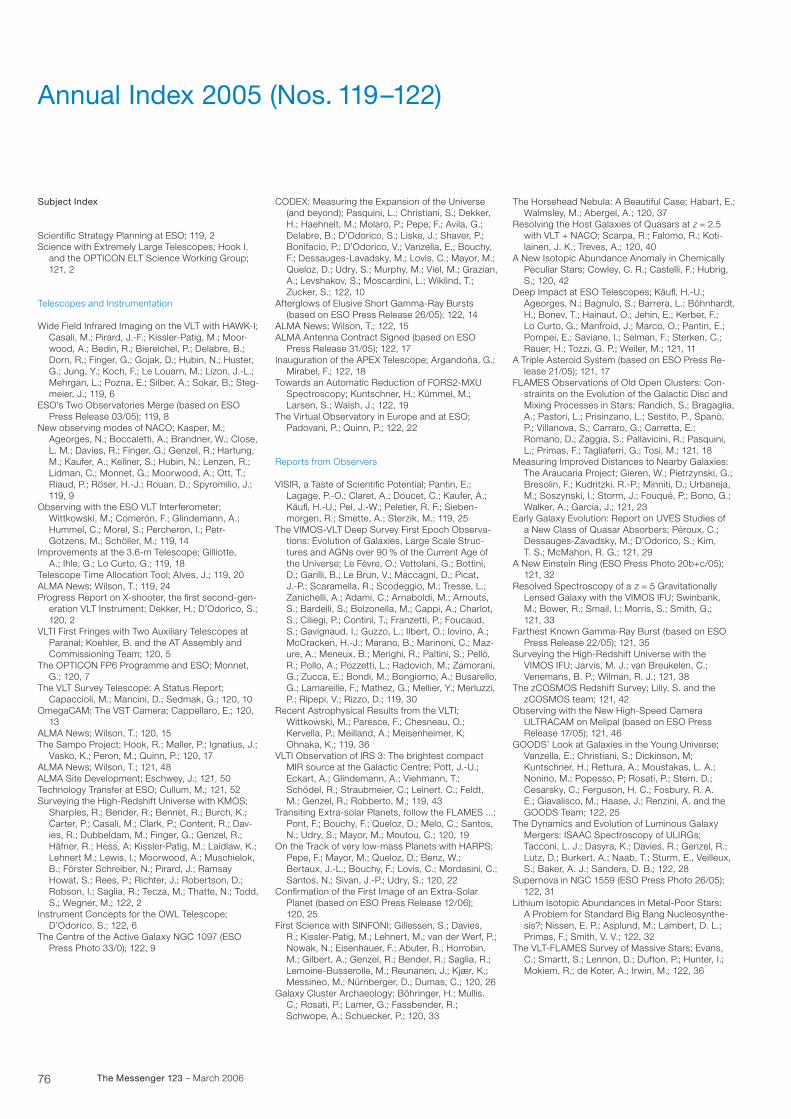
76 The Messenger 123 – March 2006
Annual Index 2005 (Nos. 119–122)
Subject Index
Scientific Strategy Planning at ESO; 119, 2Science with Extremely Large Telescopes; Hook I. and the OPTICON ELT Science Working Group;
121, 2
Telescopes and Instrumentation
Wide Field Infrared Imaging on the VLT with HAWK-I; Casali, M.; Pirard, J.-F.; Kissler-Patig, M.; Moor-
wood, A.; Bedin, R.; Biereichel, P.; Delabre, B.; Dorn, R.; Finger, G.; Gojak, D.; Hubin, N.; Huster, G.; Jung, Y.; Koch, F.; Le Louarn, M.; Lizon, J.-L.; Mehrgan, L.; Pozna, E.; Silber, A.; Sokar, B.; Steg-meier, J.; 119, 6
ESO’s Two Observatories Merge (based on ESO Press Release 03/05); 119, 8New observing modes of NACO; Kasper, M.; Ageorges, N.; Boccaletti, A.; Brandner, W.; Close,
L. M.; Davies, R.; Finger, G.; Genzel, R.; Hartung, M.; Kaufer, A.; Kellner, S.; Hubin, N.; Lenzen, R.; Lidman, C.; Monnet, G.; Moorwood, A.; Ott, T.; Riaud, P.; Röser, H.-J.; Rouan, D.; Spyromilio, J.; 119, 9
Observing with the ESO VLT Interferometer; Wittkowski, M.; Comerón, F.; Glindemann, A.;
Hummel, C.; Morel, S.; Percheron, I.; Petr-Gotzens, M.; Schöller, M.; 119, 14
Improvements at the 3.6-m Telescope; Gilliotte, A.; Ihle, G.; Lo Curto, G.; 119, 18Telescope Time Allocation Tool; Alves, J.; 119, 20ALMA News; Wilson, T.; 119, 24 Progress Report on X-shooter, the first second-gen- eration VLT Instrument; Dekker, H.; D’Odorico, S.;
120, 2VLTI First Fringes with Two Auxiliary Telescopes at Paranal; Koehler, B. and the AT Assembly and
Commissioning Team; 120, 5The OPTICON FP6 Programme and ESO; Monnet, G.; 120, 7The VLT Survey Telescope: A Status Report; Capaccioli, M.; Mancini, D.; Sedmak, G.; 120, 10OmegaCAM: The VST Camera; Cappellaro, E.; 120, 13ALMA News; Wilson, T.; 120, 15The Sampo Project; Hook, R.; Møller, P.; Ignatius, J.; Vasko, K.; Peron, M.; Quinn, P.; 120, 17ALMA News; Wilson, T.; 121, 48ALMA Site Development; Eschwey, J.; 121, 50Technology Transfer at ESO; Cullum, M.; 121, 52Surveying the High-Redshift Universe with KMOS; Sharples, R.; Bender, R.; Bennet, R.; Burch, K.;
Carter, P.; Casali, M.; Clark, P.; Content, R.; Dav-ies, R.; Dubbeldam, M.; Finger, G.; Genzel, R.; Häfner, R.; Hess, A; Kissler-Patig, M.; Laidlaw, K.; Lehnert M.; Lewis, I.; Moorwood, A.; Muschielok, B.; Förster Schreiber, N.; Pirard, J.; Ramsay Howat, S.; Rees, P.; Richter, J.; Robertson, D.; Robson, I.; Saglia, R.; Tecza, M.; Thatte, N.; Todd, S.; Wegner, M.; 122, 2
Instrument Concepts for the OWL Telescope; D’Odorico, S.; 122, 6The Centre of the Active Galaxy NGC 1097 (ESO Press Photo 33/0); 122, 9
CODEX: Measuring the Expansion of the Universe (and beyond); Pasquini, L.; Christiani, S.; Dekker,
H.; Haehnelt, M.; Molaro, P.; Pepe, F.; Avila, G.; Delabre, B.; D’Odorico, S.; Liske, J.; Shaver, P.; Bonifacio, P.; D’Odorico, V.; Vanzella, E.; Bouchy, F.; Dessauges-Lavadsky, M.; Lovis, C.; Mayor, M.; Queloz, D.; Udry, S.; Murphy, M.; Viel, M.; Grazian, A.; Levshakov, S.; Moscardini, L.; Wiklind, T.; Zucker, S.; 122, 10
Afterglows of Elusive Short Gamma-Ray Bursts (based on ESO Press Release 26/05); 122, 14ALMA News; Wilson, T.; 122, 15ALMA Antenna Contract Signed (based on ESO Press Release 31/05); 122, 17Inauguration of the APEX Telescope; Argandoña, G.; Mirabel, F.; 122, 18Towards an Automatic Reduction of FORS2-MXU Spectroscopy; Kuntschner, H.; Kümmel, M.;
Larsen, S.; Walsh, J.; 122, 19The Virtual Observatory in Europe and at ESO; Padovani, P.; Quinn, P.; 122, 22
Reports from Observers
VISIR, a Taste of Scientific Potential; Pantin, E.; Lagage, P.-O.; Claret, A.; Doucet, C.; Kaufer, A.;
Käufl, H.-U.; Pel, J.-W.; Peletier, R. F.; Sieben-morgen, R.; Smette, A.; Sterzik, M.; 119, 25
The VIMOS-VLT Deep Survey First Epoch Observa- tions: Evolution of Galaxies, Large Scale Struc-
tures and AGNs over 90 % of the Current Age of the Universe; Le Fèvre, O.; Vettolani, G.; Bottini, D.; Garilli, B.; Le Brun, V.; Maccagni, D.; Picat, J.-P.; Scaramella, R.; Scodeggio, M.; Tresse, L.; Zanichelli, A.; Adami, C.; Arnaboldi, M.; Arnouts, S.; Bardelli, S.; Bolzonella, M.; Cappi, A.; Charlot, S.; Ciliegi, P.; Contini, T.; Franzetti, P.; Foucaud, S.; Gavignaud, I.; Guzzo, L.; Ilbert, O.; Iovino, A.; McCracken, H.-J.; Marano, B.; Marinoni, C.; Maz-ure, A.; Meneux, B.; Merighi, R.; Paltini, S.; Pellò, R.; Pollo, A.; Pozzetti, L.; Radovich, M.; Zamorani, G.; Zucca, E.; Bondi, M.; Bongiorno, A.; Busarello, G.; Lamareille, F.; Mathez, G.; Mellier, Y.; Merluzzi, P.; Ripepi, V.; Rizzo, D.; 119, 30
Recent Astrophysical Results from the VLTI; Wittkowski, M.; Paresce, F.; Chesneau, O.;
Kervella, P.; Meilland, A.; Meisenheimer, K; Ohnaka, K.; 119, 36
VLTI Observation of IRS 3: The brightest compact MIR source at the Galactic Centre; Pott, J.-U.;
Eckart, A.; Glindemann, A.; Viehmann, T.; Schödel, R.; Straubmeier, C.; Leinert. C.; Feldt. M.; Genzel, R.; Robberto, M.; 119, 43
Transiting Extra-solar Planets, follow the FLAMES ...; Pont, F.; Bouchy, F.; Queloz, D.; Melo, C.; Santos,
N.; Udry, S.; Mayor, M.; Moutou, C.; 120, 19On the Track of very low-mass Planets with HARPS; Pepe, F.; Mayor, M.; Queloz, D.; Benz, W.;
Bertaux, J.-L.; Bouchy, F.; Lovis, C.; Mordasini, C.; Santos, N.; Sivan, J.-P.; Udry, S.; 120, 22
Confirmation of the First Image of an Extra-Solar Planet (based on ESO Press Release 12/06);
120, 25First Science with SINFONI; Gillessen, S.; Davies, R.; Kissler-Patig, M.; Lehnert, M.; van der Werf, P.;
Nowak, N.; Eisenhauer, F.; Abuter, R.; Horrobin, M.; Gilbert, A.; Genzel, R.; Bender, R.; Saglia, R.; Lemoine-Busserolle, M.; Reunanen, J.; Kjær, K.; Messineo, M.; Nürnberger, D.; Dumas, C.; 120, 26
Galaxy Cluster Archaeology; Böhringer, H.; Mullis. C.; Rosati, P.; Lamer, G.; Fassbender, R.;
Schwope, A.; Schuecker, P.; 120, 33
The Horsehead Nebula: A Beautiful Case; Habart, E.; Walmsley, M.; Abergel, A.; 120, 37Resolving the Host Galaxies of Quasars at z = 2.5 with VLT + NACO; Scarpa, R.; Falomo, R.; Koti-
lainen, J. K.; Treves, A.; 120, 40A New Isotopic Abundance Anomaly in Chemically Peculiar Stars; Cowley, C. R.; Castelli, F.; Hubrig,
S.; 120, 42Deep Impact at ESO Telescopes; Käufl, H.-U.; Ageorges, N.; Bagnulo, S.; Barrera, L.; Böhnhardt,
H.; Bonev, T.; Hainaut, O.; Jehin, E.; Kerber, F.; Lo Curto, G.; Manfroid, J.; Marco, O.; Pantin, E.; Pompei, E.; Saviane, I.; Selman, F.; Sterken, C.; Rauer, H.; Tozzi, G. P.; Weiler, M.; 121, 11
A Triple Asteroid System (based on ESO Press Re- lease 21/05); 121, 17FLAMES Observations of Old Open Clusters: Con- straints on the Evolution of the Galactic Disc and
Mixing Processes in Stars; Randich, S.; Bragaglia, A.; Pastori, L.; Prisinzano, L.; Sestito, P., Spanò, P.; Villanova, S.; Carraro, G.; Carretta, E.; Romano, D.; Zaggia, S.; Pallavicini, R.; Pasquini, L.; Primas, F.; Tagliaferri, G.; Tosi, M.; 121, 18
Measuring Improved Distances to Nearby Galaxies: The Araucaria Project; Gieren, W.; Pietrzynski, G.;
Bresolin, F.; Kudritzki. R.-P.; Minniti, D.; Urbaneja, M.; Soszynski, I.; Storm, J.; Fouqué, P.; Bono, G.; Walker, A.; García, J.; 121, 23
Early Galaxy Evolution: Report on UVES Studies of a New Class of Quasar Absorbers; Péroux, C.;
Dessauges-Zavadsky, M.; D’Odorico, S.; Kim, T. S.; McMahon, R. G.; 121, 29
A New Einstein Ring (ESO Press Photo 20b+c/05); 121, 32Resolved Spectroscopy of a z = 5 Gravitationally Lensed Galaxy with the VIMOS IFU; Swinbank,
M.; Bower, R.; Smail, I.; Morris, S.; Smith, G.; 121, 33
Farthest Known Gamma-Ray Burst (based on ESO Press Release 22/05); 121, 35Surveying the High-Redshift Universe with the VIMOS IFU; Jarvis, M. J.; van Breukelen, C.;
Venemans, B. P.; Wilman, R. J.; 121, 38The zCOSMOS Redshift Survey; Lilly, S. and the zCOSMOS team; 121, 42Observing with the New High-Speed Camera ULTRACAM on Melipal (based on ESO Press
Release 17/05); 121, 46GOODS’ Look at Galaxies in the Young Universe; Vanzella, E.; Christiani, S.; Dickinson, M;
Kuntschner, H.; Rettura, A.; Moustakas, L. A.; Nonino, M.; Popesso, P; Rosati, P.; Stern, D.; Cesarsky, C.; Ferguson, H. C.; Fosbury, R. A. E.; Giavalisco, M.; Haase, J.; Renzini, A. and the GOODS Team; 122, 25
The Dynamics and Evolution of Luminous Galaxy Mergers: ISAAC Spectroscopy of ULIRGs;
Tacconi, L. J.; Dasyra, K.; Davies, R.; Genzel, R.; Lutz, D.; Burkert, A.; Naab, T.; Sturm, E., Veilleux, S.; Baker, A. J.; Sanders, D. B.; 122, 28
Supernova in NGC 1559 (ESO Press Photo 26/05); 122, 31Lithium Isotopic Abundances in Metal-Poor Stars: A Problem for Standard Big Bang Nucleosynthe-
sis?; Nissen, E. P.; Asplund, M.; Lambert, D. L.; Primas, F.; Smith, V. V.; 122, 32
The VLT-FLAMES Survey of Massive Stars; Evans, C.; Smartt, S.; Lennon, D.; Dufton, P.; Hunter, I.;
Mokiem, R.; de Koter, A.; Irwin, M.; 122, 36
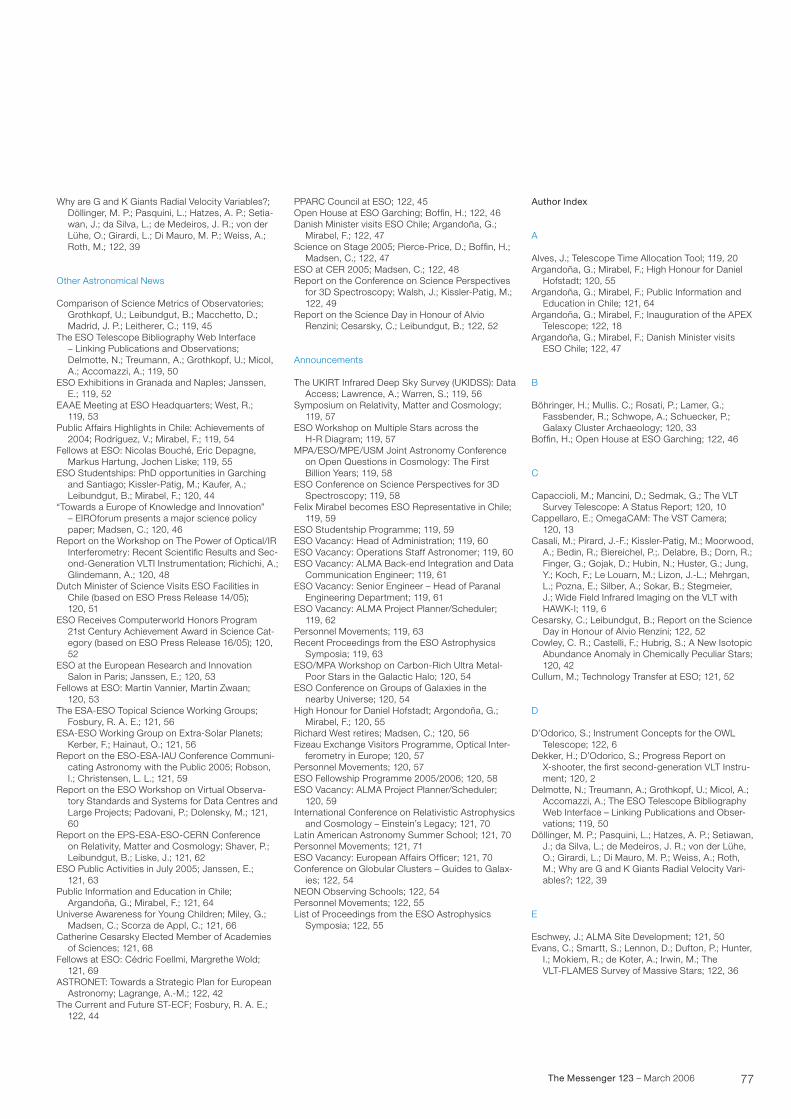
77The Messenger 123 – March 2006
Why are G and K Giants Radial Velocity Variables?; Döllinger, M. P.; Pasquini, L.; Hatzes, A. P.; Setia-
wan, J.; da Silva, L.; de Medeiros, J. R.; von der Lühe, O.; Girardi, L.; Di Mauro, M. P.; Weiss, A.; Roth, M.; 122, 39
Other Astronomical News
Comparison of Science Metrics of Observatories; Grothkopf, U.; Leibundgut, B.; Macchetto, D.;
Madrid, J. P.; Leitherer, C.; 119, 45The ESO Telescope Bibliography Web Interface – Linking Publications and Observations;
Delmotte, N.; Treumann, A.; Grothkopf, U.; Micol, A.; Accomazzi, A.; 119, 50
ESO Exhibitions in Granada and Naples; Janssen, E.; 119, 52EAAE Meeting at ESO Headquarters; West, R.; 119, 53Public Affairs Highlights in Chile: Achievements of 2004; Rodríguez, V.; Mirabel, F.; 119, 54Fellows at ESO: Nicolas Bouché, Eric Depagne, Markus Hartung, Jochen Liske; 119, 55ESO Studentships: PhD opportunities in Garching and Santiago; Kissler-Patig, M.; Kaufer, A.;
Leibundgut, B.; Mirabel, F.; 120, 44“Towards a Europe of Knowledge and Innovation” – EIROforum presents a major science policy
paper; Madsen, C.; 120, 46Report on the Workshop on The Power of Optical/IR Interferometry: Recent Scientific Results and Sec-
ond-Generation VLTI Instrumentation; Richichi, A.; Glindemann, A.; 120, 48
Dutch Minister of Science Visits ESO Facilities in Chile (based on ESO Press Release 14/05);
120, 51ESO Receives Computerworld Honors Program 21st Century Achievement Award in Science Cat-
egory (based on ESO Press Release 16/05); 120, 52
ESO at the European Research and Innovation Salon in Paris; Janssen, E.; 120, 53Fellows at ESO: Martin Vannier, Martin Zwaan; 120, 53The ESA-ESO Topical Science Working Groups; Fosbury, R. A. E.; 121, 56ESA-ESO Working Group on Extra-Solar Planets; Kerber, F.; Hainaut, O.; 121, 56Report on the ESO-ESA-IAU Conference Communi- cating Astronomy with the Public 2005; Robson,
I.; Christensen, L. L.; 121, 59Report on the ESO Workshop on Virtual Observa- tory Standards and Systems for Data Centres and
Large Projects; Padovani, P.; Dolensky, M.; 121, 60
Report on the EPS-ESA-ESO-CERN Conference on Relativity, Matter and Cosmology; Shaver, P.;
Leibundgut, B.; Liske, J.; 121, 62ESO Public Activities in July 2005; Janssen, E.; 121, 63Public Information and Education in Chile; Argandoña, G.; Mirabel, F.; 121, 64Universe Awareness for Young Children; Miley, G.; Madsen, C.; Scorza de Appl, C.; 121, 66Catherine Cesarsky Elected Member of Academies of Sciences; 121, 68Fellows at ESO: Cédric Foellmi, Margrethe Wold; 121, 69ASTRONET: Towards a Strategic Plan for European Astronomy; Lagrange, A.-M.; 122, 42The Current and Future ST-ECF; Fosbury, R. A. E.; 122, 44
PPARC Council at ESO; 122, 45Open House at ESO Garching; Boffin, H.; 122, 46Danish Minister visits ESO Chile; Argandoña, G.; Mirabel, F.; 122, 47Science on Stage 2005; Pierce-Price, D.; Boffin, H.; Madsen, C.; 122, 47ESO at CER 2005; Madsen, C.; 122, 48Report on the Conference on Science Perspectives for 3D Spectroscopy; Walsh, J.; Kissler-Patig, M.;
122, 49Report on the Science Day in Honour of Alvio Renzini; Cesarsky, C.; Leibundgut, B.; 122, 52
Announcements
The UKIRT Infrared Deep Sky Survey (UKIDSS): Data Access; Lawrence, A.; Warren, S.; 119, 56Symposium on Relativity, Matter and Cosmology; 119, 57ESO Workshop on Multiple Stars across the H-R Diagram; 119, 57MPA/ESO/MPE/USM Joint Astronomy Conference on Open Questions in Cosmology: The First
Billion Years; 119, 58ESO Conference on Science Perspectives for 3D Spectroscopy; 119, 58Felix Mirabel becomes ESO Representative in Chile; 119, 59ESO Studentship Programme; 119, 59ESO Vacancy: Head of Administration; 119, 60ESO Vacancy: Operations Staff Astronomer; 119, 60ESO Vacancy: ALMA Back-end Integration and Data Communication Engineer; 119, 61ESO Vacancy: Senior Engineer – Head of Paranal Engineering Department; 119, 61ESO Vacancy: ALMA Project Planner/Scheduler; 119, 62Personnel Movements; 119, 63Recent Proceedings from the ESO Astrophysics Symposia; 119, 63ESO/MPA Workshop on Carbon-Rich Ultra Metal- Poor Stars in the Galactic Halo; 120, 54ESO Conference on Groups of Galaxies in the nearby Universe; 120, 54High Honour for Daniel Hofstadt; Argondoña, G.; Mirabel, F.; 120, 55Richard West retires; Madsen, C.; 120, 56Fizeau Exchange Visitors Programme, Optical Inter- ferometry in Europe; 120, 57Personnel Movements; 120, 57ESO Fellowship Programme 2005/2006; 120, 58ESO Vacancy: ALMA Project Planner/Scheduler; 120, 59 International Conference on Relativistic Astrophysics and Cosmology – Einstein’s Legacy; 121, 70Latin American Astronomy Summer School; 121, 70Personnel Movements; 121, 71ESO Vacancy: European Affairs Officer; 121, 70Conference on Globular Clusters – Guides to Galax- ies; 122, 54NEON Observing Schools; 122, 54Personnel Movements; 122, 55List of Proceedings from the ESO Astrophysics Symposia; 122, 55
Author Index
A
Alves, J.; Telescope Time Allocation Tool; 119, 20Argandoña, G.; Mirabel, F.; High Honour for Daniel Hofstadt; 120, 55Argandoña, G.; Mirabel, F.; Public Information and Education in Chile; 121, 64Argandoña, G.; Mirabel, F.; Inauguration of the APEX Telescope; 122, 18Argandoña, G.; Mirabel, F.; Danish Minister visits ESO Chile; 122, 47
B
Böhringer, H.; Mullis. C.; Rosati, P.; Lamer, G.; Fassbender, R.; Schwope, A.; Schuecker, P.;
Galaxy Cluster Archaeology; 120, 33Boffin, H.; Open House at ESO Garching; 122, 46
C
Capaccioli, M.; Mancini, D.; Sedmak, G.; The VLT Survey Telescope: A Status Report; 120, 10Cappellaro, E.; OmegaCAM: The VST Camera; 120, 13Casali, M.; Pirard, J.-F.; Kissler-Patig, M.; Moorwood, A.; Bedin, R.; Biereichel, P.;. Delabre, B.; Dorn, R.;
Finger, G.; Gojak, D.; Hubin, N.; Huster, G.; Jung, Y.; Koch, F.; Le Louarn, M.; Lizon, J.-L.; Mehrgan, L.; Pozna, E.; Silber, A.; Sokar, B.; Stegmeier, J.; Wide Field Infrared Imaging on the VLT with HAWK-I; 119, 6
Cesarsky, C.; Leibundgut, B.; Report on the Science Day in Honour of Alvio Renzini; 122, 52Cowley, C. R.; Castelli, F.; Hubrig, S.; A New Isotopic Abundance Anomaly in Chemically Peculiar Stars;
120, 42Cullum, M.; Technology Transfer at ESO; 121, 52
D
D’Odorico, S.; Instrument Concepts for the OWL Telescope; 122, 6Dekker, H.; D’Odorico, S.; Progress Report on X-shooter, the first second-generation VLT Instru-
ment; 120, 2Delmotte, N.; Treumann, A.; Grothkopf, U.; Micol, A.; Accomazzi, A.; The ESO Telescope Bibliography
Web Interface – Linking Publications and Obser-vations; 119, 50
Döllinger, M. P.; Pasquini, L.; Hatzes, A. P.; Setiawan, J.; da Silva, L.; de Medeiros, J. R.; von der Lühe,
O.; Girardi, L.; Di Mauro, M. P.; Weiss, A.; Roth, M.; Why are G and K Giants Radial Velocity Vari-ables?; 122, 39
E
Eschwey, J.; ALMA Site Development; 121, 50Evans, C.; Smartt, S.; Lennon, D.; Dufton, P.; Hunter, I.; Mokiem, R.; de Koter, A.; Irwin, M.; The
VLT-FLAMES Survey of Massive Stars; 122, 36
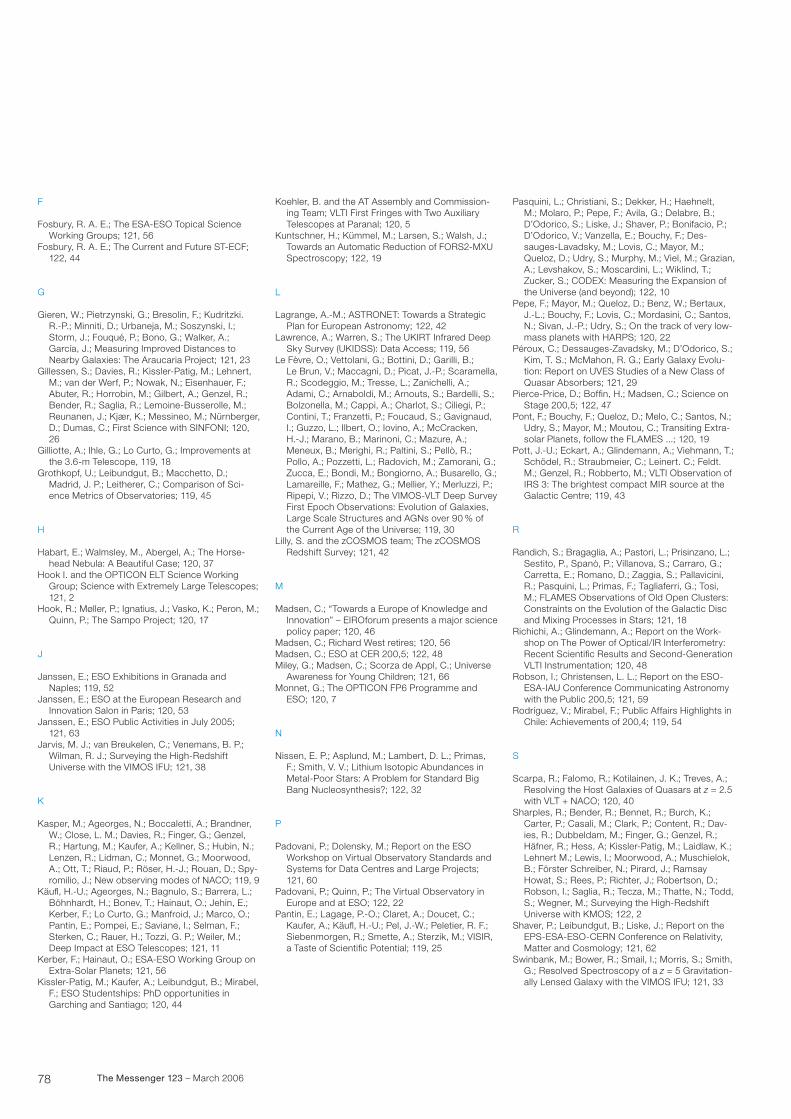
78 The Messenger 123 – March 2006
F
Fosbury, R. A. E.; The ESA-ESO Topical Science Working Groups; 121, 56Fosbury, R. A. E.; The Current and Future ST-ECF; 122, 44
G
Gieren, W.; Pietrzynski, G.; Bresolin, F.; Kudritzki. R.-P.; Minniti, D.; Urbaneja, M.; Soszynski, I.;
Storm, J.; Fouqué, P.; Bono, G.; Walker, A.; García, J.; Measuring Improved Distances to Nearby Galaxies: The Araucaria Project; 121, 23
Gillessen, S.; Davies, R.; Kissler-Patig, M.; Lehnert, M.; van der Werf, P.; Nowak, N.; Eisenhauer, F.;
Abuter, R.; Horrobin, M.; Gilbert, A.; Genzel, R.; Bender, R.; Saglia, R.; Lemoine-Busserolle, M.; Reunanen, J.; Kjær, K.; Messineo, M.; Nürnberger, D.; Dumas, C.; First Science with SINFONI; 120, 26
Gilliotte, A.; Ihle, G.; Lo Curto, G.; Improvements at the 3.6-m Telescope, 119, 18Grothkopf, U.; Leibundgut, B.; Macchetto, D.; Madrid, J. P.; Leitherer, C.; Comparison of Sci-
ence Metrics of Observatories; 119, 45
H
Habart, E.; Walmsley, M., Abergel, A.; The Horse- head Nebula: A Beautiful Case; 120, 37Hook I. and the OPTICON ELT Science Working Group; Science with Extremely Large Telescopes;
121, 2Hook, R.; Møller, P.; Ignatius, J.; Vasko, K.; Peron, M.; Quinn, P.; The Sampo Project; 120, 17
J
Janssen, E.; ESO Exhibitions in Granada and Naples; 119, 52Janssen, E.; ESO at the European Research and Innovation Salon in Paris; 120, 53Janssen, E.; ESO Public Activities in July 2005; 121, 63Jarvis, M. J.; van Breukelen, C.; Venemans, B. P.; Wilman, R. J.; Surveying the High-Redshift
Universe with the VIMOS IFU; 121, 38
K
Kasper, M.; Ageorges, N.; Boccaletti, A.; Brandner, W.; Close, L. M.; Davies, R.; Finger, G.; Genzel,
R.; Hartung, M.; Kaufer, A.; Kellner, S.; Hubin, N.; Lenzen, R.; Lidman, C.; Monnet, G.; Moorwood, A.; Ott, T.; Riaud, P.; Röser, H.-J.; Rouan, D.; Spy-romilio, J.; New observing modes of NACO; 119, 9
Käufl, H.-U.; Ageorges, N.; Bagnulo, S.; Barrera, L.; Böhnhardt, H.; Bonev, T.; Hainaut, O.; Jehin, E.;
Kerber, F.; Lo Curto, G.; Manfroid, J.; Marco, O.; Pantin, E.; Pompei, E.; Saviane, I.; Selman, F.; Sterken, C.; Rauer, H.; Tozzi, G. P.; Weiler, M.; Deep Impact at ESO Telescopes; 121, 11
Kerber, F.; Hainaut, O.; ESA-ESO Working Group on Extra-Solar Planets; 121, 56Kissler-Patig, M.; Kaufer, A.; Leibundgut, B.; Mirabel, F.; ESO Studentships: PhD opportunities in
Garching and Santiago; 120, 44
Koehler, B. and the AT Assembly and Commission- ing Team; VLTI First Fringes with Two Auxiliary
Telescopes at Paranal; 120, 5Kuntschner, H.; Kümmel, M.; Larsen, S.; Walsh, J.; Towards an Automatic Reduction of FORS2-MXU
Spectroscopy; 122, 19
L
Lagrange, A.-M.; ASTRONET: Towards a Strategic Plan for European Astronomy; 122, 42Lawrence, A.; Warren, S.; The UKIRT Infrared Deep Sky Survey (UKIDSS): Data Access; 119, 56Le Fèvre, O.; Vettolani, G.; Bottini, D.; Garilli, B.; Le Brun, V.; Maccagni, D.; Picat, J.-P.; Scaramella,
R.; Scodeggio, M.; Tresse, L.; Zanichelli, A.; Adami, C.; Arnaboldi, M.; Arnouts, S.; Bardelli, S.; Bolzonella, M.; Cappi, A.; Charlot, S.; Ciliegi, P.; Contini, T.; Franzetti, P.; Foucaud, S.; Gavignaud, I.; Guzzo, L.; Ilbert, O.; Iovino, A.; McCracken, H.-J.; Marano, B.; Marinoni, C.; Mazure, A.; Meneux, B.; Merighi, R.; Paltini, S.; Pellò, R.; Pollo, A.; Pozzetti, L.; Radovich, M.; Zamorani, G.; Zucca, E.; Bondi, M.; Bongiorno, A.; Busarello, G.; Lamareille, F.; Mathez, G.; Mellier, Y.; Merluzzi, P.; Ripepi, V.; Rizzo, D.; The VIMOS-VLT Deep Survey First Epoch Observations: Evolution of Galaxies, Large Scale Structures and AGNs over 90 % of the Current Age of the Universe; 119, 30
Lilly, S. and the zCOSMOS team; The zCOSMOS Redshift Survey; 121, 42
M
Madsen, C.; “Towards a Europe of Knowledge and Innovation” – EIROforum presents a major science
policy paper; 120, 46Madsen, C.; Richard West retires; 120, 56Madsen, C.; ESO at CER 200,5; 122, 48Miley, G.; Madsen, C.; Scorza de Appl, C.; Universe Awareness for Young Children; 121, 66Monnet, G.; The OPTICON FP6 Programme and ESO; 120, 7
N
Nissen, E. P.; Asplund, M.; Lambert, D. L.; Primas, F.; Smith, V. V.; Lithium Isotopic Abundances in
Metal-Poor Stars: A Problem for Standard Big Bang Nucleosynthesis?; 122, 32
P
Padovani, P.; Dolensky, M.; Report on the ESO Workshop on Virtual Observatory Standards and
Systems for Data Centres and Large Projects; 121, 60
Padovani, P.; Quinn, P.; The Virtual Observatory in Europe and at ESO; 122, 22Pantin, E.; Lagage, P.-O.; Claret, A.; Doucet, C.; Kaufer, A.; Käufl, H.-U.; Pel, J.-W.; Peletier, R. F.;
Siebenmorgen, R.; Smette, A.; Sterzik, M.; VISIR, a Taste of Scientific Potential; 119, 25
Pasquini, L.; Christiani, S.; Dekker, H.; Haehnelt, M.; Molaro, P.; Pepe, F.; Avila, G.; Delabre, B.;
D’Odorico, S.; Liske, J.; Shaver, P.; Bonifacio, P.; D’Odorico, V.; Vanzella, E.; Bouchy, F.; Des-sauges-Lavadsky, M.; Lovis, C.; Mayor, M.; Queloz, D.; Udry, S.; Murphy, M.; Viel, M.; Grazian, A.; Levshakov, S.; Moscardini, L.; Wiklind, T.; Zucker, S.; CODEX: Measuring the Expansion of the Universe (and beyond); 122, 10
Pepe, F.; Mayor, M.; Queloz, D.; Benz, W.; Bertaux, J.-L.; Bouchy, F.; Lovis, C.; Mordasini, C.; Santos,
N.; Sivan, J.-P.; Udry, S.; On the track of very low-mass planets with HARPS; 120, 22
Péroux, C.; Dessauges-Zavadsky, M.; D’Odorico, S.; Kim, T. S.; McMahon, R. G.; Early Galaxy Evolu-
tion: Report on UVES Studies of a New Class of Quasar Absorbers; 121, 29
Pierce-Price, D.; Boffin, H.; Madsen, C.; Science on Stage 200,5; 122, 47Pont, F.; Bouchy, F.; Queloz, D.; Melo, C.; Santos, N.; Udry, S.; Mayor, M.; Moutou, C.; Transiting Extra-
solar Planets, follow the FLAMES ...; 120, 19Pott, J.-U.; Eckart, A.; Glindemann, A.; Viehmann, T.; Schödel, R.; Straubmeier, C.; Leinert. C.; Feldt.
M.; Genzel, R.; Robberto, M.; VLTI Observation of IRS 3: The brightest compact MIR source at the Galactic Centre; 119, 43
R
Randich, S.; Bragaglia, A.; Pastori, L.; Prisinzano, L.; Sestito, P., Spanò, P.; Villanova, S.; Carraro, G.;
Carretta, E.; Romano, D.; Zaggia, S.; Pallavicini, R.; Pasquini, L.; Primas, F.; Tagliaferri, G.; Tosi, M.; FLAMES Observations of Old Open Clusters: Constraints on the Evolution of the Galactic Disc and Mixing Processes in Stars; 121, 18
Richichi, A.; Glindemann, A.; Report on the Work- shop on The Power of Optical/IR Interferometry:
Recent Scientific Results and Second-Generation VLTI Instrumentation; 120, 48
Robson, I.; Christensen, L. L.; Report on the ESO- ESA-IAU Conference Communicating Astronomy
with the Public 200,5; 121, 59Rodríguez, V.; Mirabel, F.; Public Affairs Highlights in Chile: Achievements of 200,4; 119, 54
S
Scarpa, R.; Falomo, R.; Kotilainen, J. K.; Treves, A.; Resolving the Host Galaxies of Quasars at z = 2.5
with VLT + NACO; 120, 40Sharples, R.; Bender, R.; Bennet, R.; Burch, K.; Carter, P.; Casali, M.; Clark, P.; Content, R.; Dav-
ies, R.; Dubbeldam, M.; Finger, G.; Genzel, R.; Häfner, R.; Hess, A; Kissler-Patig, M.; Laidlaw, K.; Lehnert M.; Lewis, I.; Moorwood, A.; Muschielok, B.; Förster Schreiber, N.; Pirard, J.; Ramsay Howat, S.; Rees, P.; Richter, J.; Robertson, D.; Robson, I.; Saglia, R.; Tecza, M.; Thatte, N.; Todd, S.; Wegner, M.; Surveying the High-Redshift Universe with KMOS; 122, 2
Shaver, P.; Leibundgut, B.; Liske, J.; Report on the EPS-ESA-ESO-CERN Conference on Relativity,
Matter and Cosmology; 121, 62Swinbank, M.; Bower, R.; Smail, I.; Morris, S.; Smith, G.; Resolved Spectroscopy of a z = 5 Gravitation-
ally Lensed Galaxy with the VIMOS IFU; 121, 33
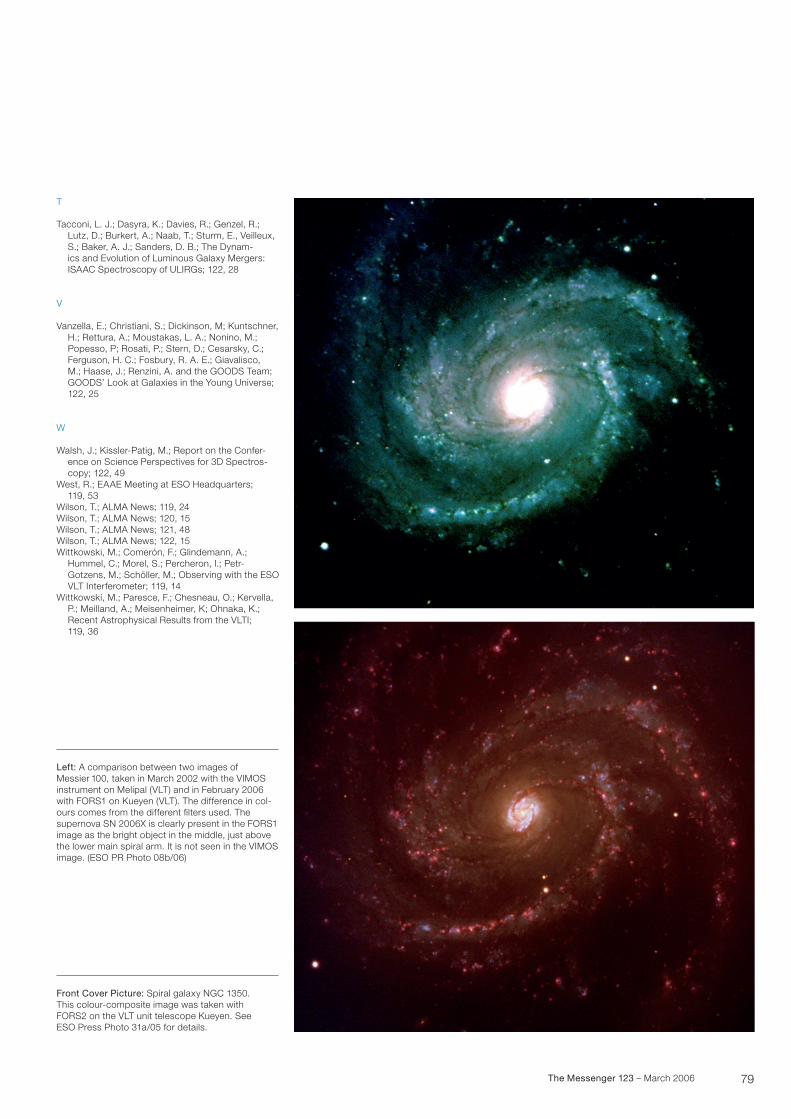
79The Messenger 123 – March 2006
T
Tacconi, L. J.; Dasyra, K.; Davies, R.; Genzel, R.; Lutz, D.; Burkert, A.; Naab, T.; Sturm, E., Veilleux,
S.; Baker, A. J.; Sanders, D. B.; The Dynam-ics and Evolution of Luminous Galaxy Mergers: ISAAC Spectroscopy of ULIRGs; 122, 28
V
Vanzella, E.; Christiani, S.; Dickinson, M; Kuntschner, H.; Rettura, A.; Moustakas, L. A.; Nonino, M.;
Popesso, P; Rosati, P.; Stern, D.; Cesarsky, C.; Ferguson, H. C.; Fosbury, R. A. E.; Giavalisco, M.; Haase, J.; Renzini, A. and the GOODS Team; GOODS’ Look at Galaxies in the Young Universe; 122, 25
W
Walsh, J.; Kissler-Patig, M.; Report on the Confer- ence on Science Perspectives for 3D Spectros-
copy; 122, 49West, R.; EAAE Meeting at ESO Headquarters; 119, 53Wilson, T.; ALMA News; 119, 24Wilson, T.; ALMA News; 120, 15Wilson, T.; ALMA News; 121, 48Wilson, T.; ALMA News; 122, 15Wittkowski, M.; Comerón, F.; Glindemann, A.; Hummel, C.; Morel, S.; Percheron, I.; Petr-
Gotzens, M.; Schöller, M.; Observing with the ESO VLT Interferometer; 119, 14
Wittkowski, M.; Paresce, F.; Chesneau, O.; Kervella, P.; Meilland, A.; Meisenheimer, K; Ohnaka, K.;
Recent Astrophysical Results from the VLTI; 119, 36
Front Cover Picture: Spiral galaxy NGC 1350.This colour-composite image was taken with FORS2 on the VLT unit telescope Kueyen. See ESO Press Photo 31a/05 for details.
Left: A comparison between two images of Messier 100, taken in March 2002 with the VIMOS instrument on Melipal (VLT) and in February 2006 with FORS1 on Kueyen (VLT). The difference in col- ours comes from the different filters used. The supernova SN 2006X is clearly present in the FORS1 image as the bright object in the middle, just above the lower main spiral arm. It is not seen in the VIMOS image. (ESO PR Photo 08b/06)
ESO is the European Organisation for Astronomical Research in the Southern Hemisphere. Whilst the Headquarters (comprising the scientific, technical and administrative centre of the organisa-tion) are located in Garching near Munich, Germany, ESO operates three observational sites in the Chilean Ata-cama desert. The Very Large Telescope (VLT), is located on Paranal, a 2 600 m high mountain south of Antofagasta. At La Silla, 600 km north of Santiago de Chile at 2 400 m altitude, ESO operates several medium-sized optical tele-scopes. The third site is the 5 000 m high Llano de Chajnantor, near San Pedro de Atacama. Here a new submil-limetre telescope (APEX) is in opera- tion, and a giant array of 12-m submil- limetre antennas (ALMA) is under development. Over 1600 proposals are made each year for the use of the ESO telescopes.
The ESO MESSENGER is published four times a year: normally in March, June, September and December. ESO also publishes Conference Proceedings and other material connected to its activi-ties. Press Releases inform the media about particular events. For further information, contact the ESO Public Affairs Department at the following ad-dress:
ESO HeadquartersKarl-Schwarzschild-Straße 285748 Garching bei MünchenGermanyPhone +49 89 320 06-0Fax +49 89 320 23 [email protected]
The ESO Messenger:Editor: Peter ShaverTechnical editor: Jutta Boxheimerwww.eso.org/messenger/
Printed by Peschke DruckSchatzbogen 3581805 MünchenGermany
© ESO 2006ISSN 0722-6691
Contents
Spain to Join ESO 3
Telescopes and InstrumentationG. Monnet, R. Gilmozzi – Status of the European ELT 4R. Arsenault et al. – The VLT Adaptive Optics Facility Project: Telescope Systems 6R. Arsenault et al. – The VLT Adaptive Optics Facility Project: Adaptive Optics Modules 11First Light for the VLT Laser Guide Star Facility 16S. Hubrig et al. – VLT-UVES Long-Slit Spectroscopy 17T. Wilson – ALMA News 19M. Hogerheijde – The ALMA Design Reference Science Plan 20
Reports from ObserversM. Kürster, M. Endl, F. Rodler – In Search of Terrestrial Planets in the Habitable Zone of M Dwarfs 21Low-Mass Exoplanet Found Using Microlensing 24R. Neuhäuser, M. Mugrauer, E. Guenther – Direct Imaging of Sub-Stellar Companions around Young Stars 25T. Henning et al. – The Formation and Early Evolution of Massive Stars 28E. Tolstoy et al. – The Dwarf galaxy Abundances and Radial-velocities Team (DART) Large Programme – A Close Look at Nearby Galaxies 33A. Koch et al. – The Age-Metallicity Degeneracy in the Dwarf Spheroidal Carina as Seen by FLAMES 38F. Hammer et al. – The Formation of Intermediate-Mass Galaxies over the Last 8 Gyrs 41A. van der Wel et al. – Masses and Mass-to-Light Ratios of Early-Type Galaxies at High Redshift – The Impact of Ultradeep FORS2 Spectroscopy 45H. Böhringer et al. – Unveiling the Structure of Galaxy Clusters with Combined ESO-VLT, WFI, and XMM-Newton Observations 49G. Chincarini et al. – Gamma-Ray Bursts: Learning about the Birth of Black Holes and Opening new Frontiers for Cosmology 54
Other Astronomical NewsP. Andreani, T. Wilson – The ALMA-Herschel Synergies 59C. Madsen – ESO at AAAS 61G. Argandoña, F. Mirabel – Latin American Summer School 62I. Saviane, V. D. Ivanov, J. Borissova – Report on the Conference on Groups of Galaxies in the Nearby Universe 63Fellows at ESO – G. Chauvin, E. Galliano 66Science in School launched 66
AnnouncementsS. Warren et al. – The UKIDSS Early Data Release 67R. Hook et al. – Scisoft VI 69Workshop on Deep Impact as a World Observatory Event 69MPA/ESO/MPE/USM Joint Astronomy Conference on Heating versus Cooling in Galaxies and Clusters of Galaxies 70Conference on Precision Spectroscopy in Astrophysics 70Science on Stage 2 71Euroscience Open Forum – ESOF2006 71ESO Studentship Programme 72Vacancies 73Personnel Movements 75List of Proceedings from the ESO Astrophysics Symposia 75
Annual Index 2005 76