Embed Size (px)
Citation preview

MET 112 Global Climate Change – Lecture 7
Observations ofObservations ofRecent Climate ChangeRecent Climate Change
Dr. Craig ClementsDr. Craig ClementsSan Jose State UniversitySan Jose State University
Outline How do we observe? Recent trends in temperature Recent trends in GHGs

What does ‘to observe’ mean?
Measurements– Of what?
Who compiles these measurements for governments and society?
IPCC: Intergovernmental Panel on Climate Change
www.ipcc.ch
Where do our observations come from?
- to watch and record.

Temperature stations
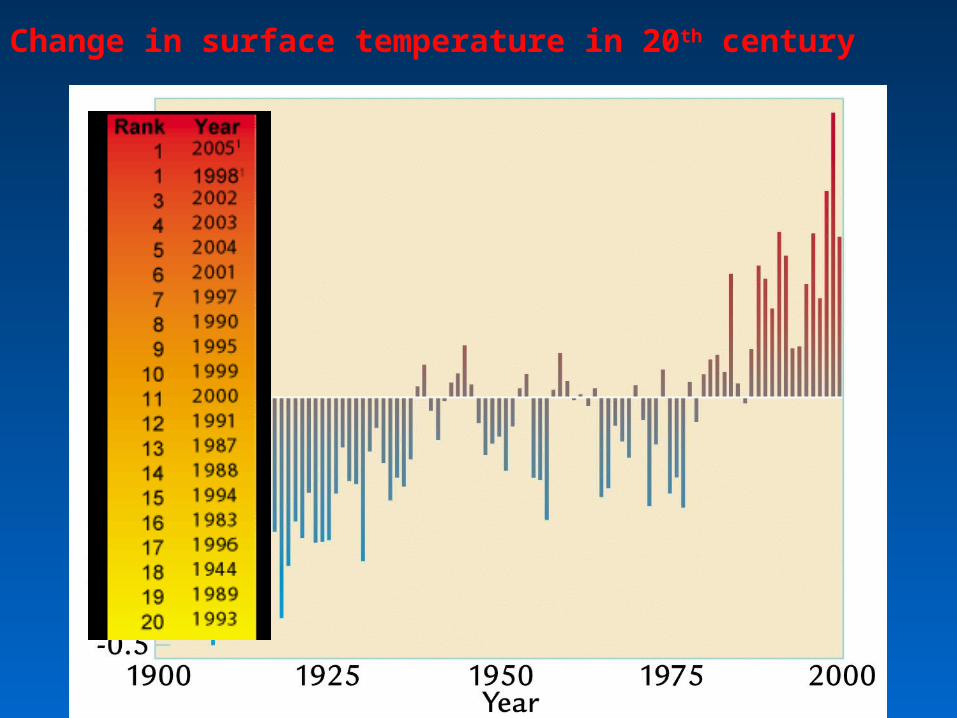
Change in surface temperature in 20th century

Bubbles Trapped in ice core
Petit, Jean-Robert, et al (1999). “Climate and atmospheric history of the past 420,000 years from the Vostok ice core, Antarctica”. Nature 399: 429-436.

Ice Core layers
•GISP2 ice core (Greenland Summit)
•Archived at the National Ice Core Laboratory in CO.
•from 1837-1838 meters in which annual layers are clearly visible.
•The appearance of layers results from differences in the size of snow crystals deposited in winter versus summer
•Counting such layers has been used (in combination with other techniques) to reliably determine the age of the ice.
•This ice was formed ~16250 years ago during the final stages of the last ice age and approximately 38 years are represented here.

Ice Cores

Coring Earth’s ice sheets

Coring mountain glaciers

Time Series Analysis: Examples of Temperature Change
Trends Periodic Oscillations Random Variations Jumps

Examples of Temperature Change
Draw the following:
1. Trend2. Oscillation3. Trend + Oscillation4. Random variations5. Random + trend6. Jump7. Random + jump

Trend
100806040200Time
Tem
pera
ture

This graphs represents
1. Trend
2. Oscillation
3. Trend+Oscillation
4. Random variation
5. Random+Trend
6. Jump
7. Random+Jump
100806040200Time
Tem
pera
ture

This graphs represents
1. Trend
2. Oscillation
3. Trend+Oscillation
4. Random variation
5. Random+Trend
6. Jump
7. Random+Jump
100806040200Time
Tem
per
atu
re

This graphs represents
1. Trend
2. Oscillation
3. Trend+Oscillation
4. Random variation
5. Random+Trend
6. Jump
7. Random+Jump
100806040200Time
Tem
per
atu
re

This graphs represents
1. Trend
2. Oscillation
3. Trend+Oscillation
4. Random variation
5. Random+Trend
6. Jump
7. Random+Jump
100806040200Time
Tem
per
atu
re

This graphs represents
1. Trend
2. Oscillation
3. Trend+Oscillation
4. Random variation
5. Random+Trend
6. Jump
7. Random+Jump
100806040200Time
Tem
pe
ratu
re

This graphs represents
1. Trend
2. Oscillation
3. Trend+Oscillation
4. Random variation
5. Random+Trend
6. Jump
7. Random+Jump
100806040200Time
Tem
per
atu
re
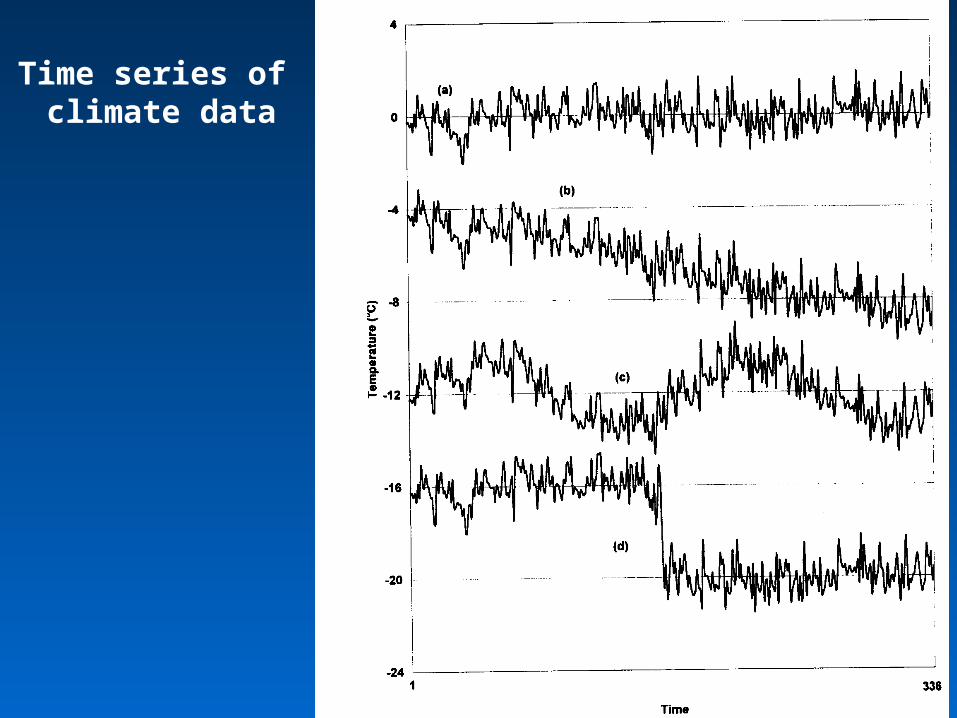
Time series of climate data

Time series of climate data

Time Frames -- Examples Seconds to minutes – Small-Scale Turbulence Hours – Diurnal Cycle (Caused by Earth’s
Rotation) Hours to Days – Weather Systems Months – Seasonal Cycle (Caused by tilt of
axis) Years – El Niño Decades -- Pacific Decadal Oscillation Centuries – Warming during 20th Century
(Increase in greenhouse gases?) Tens of thousands of Years – Irregularities in
Earth’s motions Millions of Years – Geologic Processes
Cli
mat
e C
hang
e
Cli
mat
e “V
aria
bili
ty”

Time Series Data: High Frequency (10 Hz = 10 samples/sec)

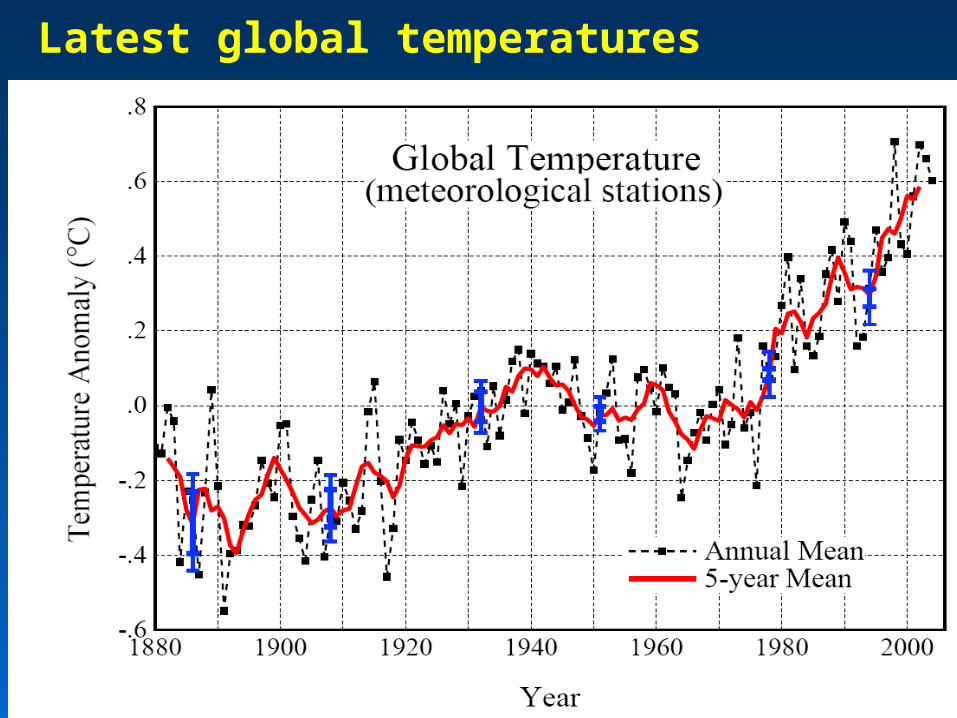
Latest global temperatures
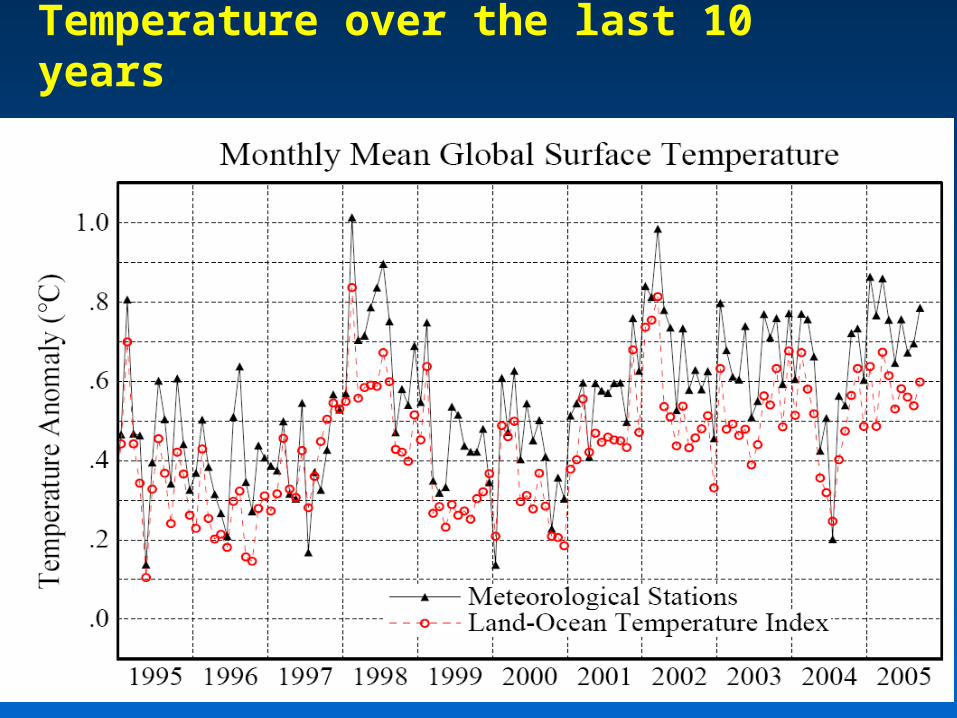
Temperature over the last 10 years

…“Over the last 140 years, the best estimate is that the global average surface temperature has increased by
0.7 ± 0.2°C” (IPCC 2007)
So the temperature trend is: 0.7°C ± 0.2°C
What does this mean?
Temperature trend is between 0.8°C and 0.4°C
The Uncertainty (± 0.2°C ) is critical component to the observed trend

Current CO2: ~383 ppm
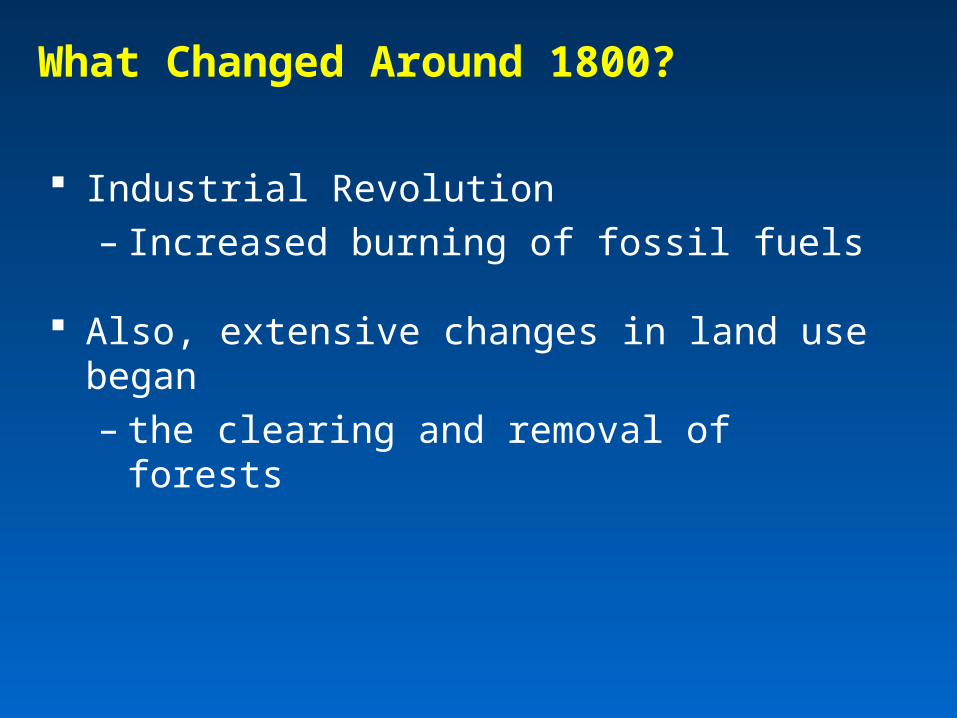
What Changed Around 1800?
Industrial Revolution– Increased burning of fossil fuels
Also, extensive changes in land use began– the clearing and removal of forests

Ice core record

Increase in ocean temperature causes a decrease in the solubility of CO2 in sea water (outgassing), which increases the atmospheric loading of CO2
(Stott et al. 2007).
In the Vostok Ice core, carbon dioxide concentrations lagged behind the temperature by about 600±400 years (Caillon et al. 1999).
What caused the large temperature changes?
Three cycles of the Earth’s orbit: called Milankovitch cycles

Milankovitch cycles: Eccentricity
Earth’s orbit around the Sun (Earth-Sun Distance)
The closest point to the Sun in a planet's orbit is called perihelion. The furthest point is called aphelion.
1. Eccentricity: “off-centerdness” of the orbit varies over time in a complicated way.
• Net result: two main cycles– one averages ~100,000 years and another about 400,000 years.
• When eccentricity is low there is little change through the year in the Earth-Sun distance.
• When eccentricity is high-the sunlight reaching Earth is ~20% stronger at perihelion than at aphelion.

Earth’s orbit around the Sun
Eccentricity
off-centerdness” of the orbit

Earth’s tilt: ranges from ~21.8º to 24.4º and changes over the course of ~41,000 years
When the tilt is most pronounced, it allows for stronger summer Sun and weaker winter Sun– especially at high latitudes.
Ice ages often set in as the tilt decreases:
Because the progressively cooler summers can’t melt the past winter’s snow. At the other extreme, it can bring the Earth out of an ice age.
Milankovitch cycles: Obliquity of the Earth’s Axis

Precession: Angular motion (wobble) of the Earth’s axis of rotation.
- varies ~26,000 years.
Milankovitch cycles: Precession of Earth’s Axis of Rotation.

0º
earth
Precession
Obliquity

Ice core CO2 record

Retreat of mountain glaciers: ‘visual inspection’
Boulder Glacier, Mt. Baker, Washington

Retreat of mountain glaciers

Melting of Greenland Icesheet

Global rise in sea level last 20,000 years
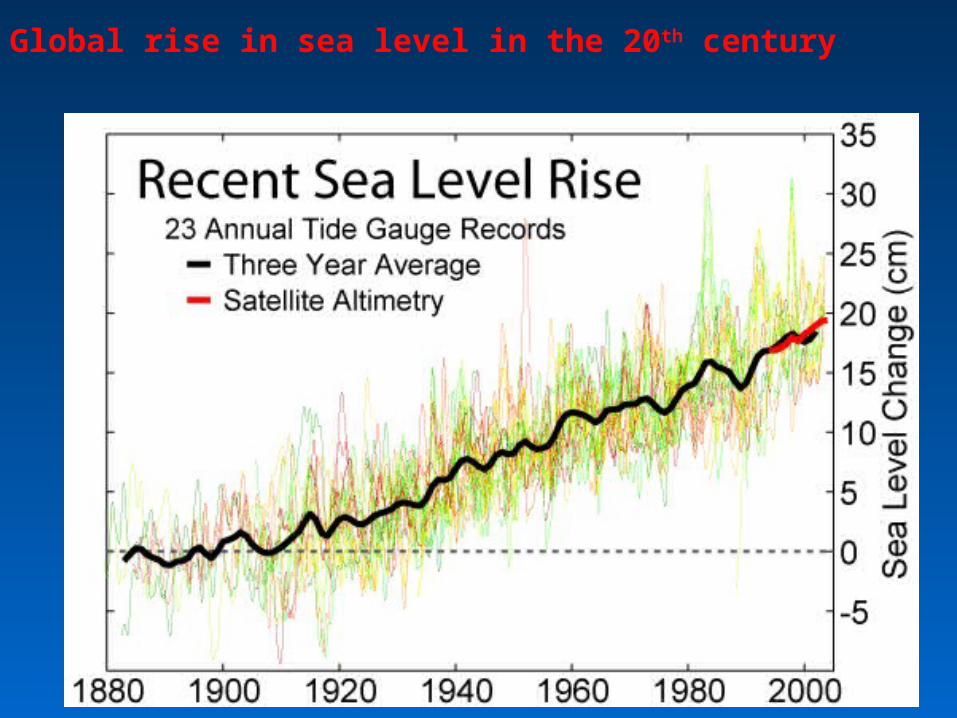
Global rise in sea level in the 20th century

Shorter winters in Alaska


Latest global temperatures

Instrumental Air Temperature Record
45
Averaged by decade

Current CO2: ~383 ppm

What Changed Around 1800?
Industrial Revolution– Increased burning of fossil fuels
Also, extensive changes in land use began– the clearing and removal of forests


Burning of Fossil Fuels
Fossil Fuels: Fuels obtained from the earth are part of the buried organic carbon “reservoir”– Examples: Coal, petroleum products,
natural gas The burning of fossil fuels is essentially
– A large acceleration of the oxidation of buried organic carbon

Land-Use Changes
Deforestation: – The intentional clearing of forests for
farmland and habitation This process is essentially an acceleration of
one part of the short-term carbon cycle: – the decay of dead vegetation
Also causes change in surface albedo (generally cooling)


Greenhouse Gases
Carbon Dioxide Methane Nitrous Oxide CFCs (Chlorofluorocarbons) Others

Methane

Anthropogenic Methane Sources
Leakage from natural gas pipelines and coal mines
Emissions from cattle Emissions from rice paddies

Nitrous Oxide N2O
Anthropogenic Sources of Nitrous Oxide
Agriculture Bacteria in Soils Nitrogen fertilizers

CFCs (Chlorofluorocarbons)
CFC-11
CFC-12
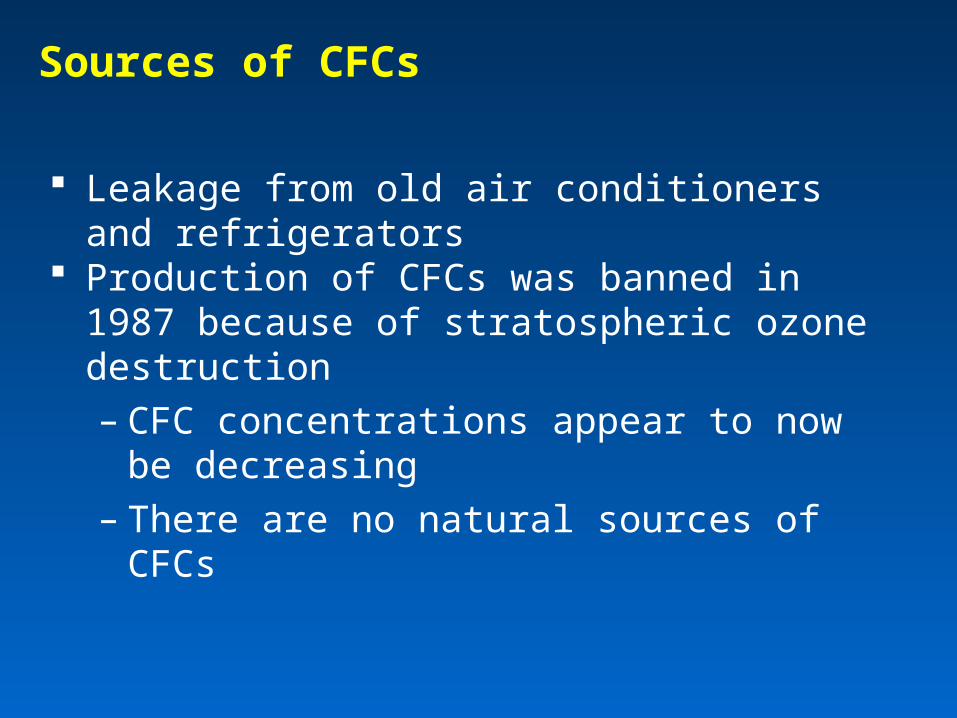
Sources of CFCs
Leakage from old air conditioners and refrigerators
Production of CFCs was banned in 1987 because of stratospheric ozone destruction– CFC concentrations appear to now be
decreasing – There are no natural sources of CFCs

The Land and Oceans have both warmed

Precipitation patterns have changed