Embed Size (px)
Citation preview
Meta Analyses and Meta Analyses and Systematic Reviews Systematic Reviews HINF 371 - Medical MethodologiesHINF 371 - Medical Methodologies
Session 12Session 12
Objective Objective
Understand what is meant by Understand what is meant by “evidence-based medicine”“evidence-based medicine”
Understand the types of research Understand the types of research informing evidenceinforming evidence
Understand meta-analyses and Understand meta-analyses and compare two meta analyses compare two meta analyses examplesexamples
ReadingReading
Ioannidis JPA and Lau J (2000) Chapter 4: Evidence Ioannidis JPA and Lau J (2000) Chapter 4: Evidence Based Medicine: A Quantitative Approach to Decision Based Medicine: A Quantitative Approach to Decision Making, in Decision Making In Health Care: Theory, Making, in Decision Making In Health Care: Theory, Psychology and Applications, Cambridge University Psychology and Applications, Cambridge University Press, USA Press, USA
Campbell CL, Smyth S, Montalescot G, Steinhubl SR. Campbell CL, Smyth S, Montalescot G, Steinhubl SR. (2007) Aspirin dose for the prevention of cardiovascular (2007) Aspirin dose for the prevention of cardiovascular disease: a systematic review, JAMA, 2007 May disease: a systematic review, JAMA, 2007 May 9;297(18):2018-24. 9;297(18):2018-24.
Clark RA, Inglis SC, McAlister FA, Cleland JG, Stewart S. Clark RA, Inglis SC, McAlister FA, Cleland JG, Stewart S. (2007) Telemonitoring or structured telephone support (2007) Telemonitoring or structured telephone support programmes for patients with chronic heart failure: programmes for patients with chronic heart failure: systematic review and meta-analysis, BMJ. 2007 May systematic review and meta-analysis, BMJ. 2007 May 5;334(7600):942. 5;334(7600):942.
Schechtman, E (2002) Odds Ratio, Relative Risk, Schechtman, E (2002) Odds Ratio, Relative Risk, Absolute Risk Reduction, and the Number Needed to Absolute Risk Reduction, and the Number Needed to Treat – Which of These Should We Use? Value In Health, Treat – Which of These Should We Use? Value In Health, Vol:5, No:5, pp.431 - 36Vol:5, No:5, pp.431 - 36
Evidence-based MedicineEvidence-based Medicine
To introduce more objective, To introduce more objective, quantifiable estimates of clinical quantifiable estimates of clinical variables to the practice of medicinevariables to the practice of medicine
Real data is better than speculation or Real data is better than speculation or opinion – application of formal opinion – application of formal synthesis of evidence complements synthesis of evidence complements traditional “experience based” traditional “experience based” medicinemedicine
Evidence-based Medicine = literature Evidence-based Medicine = literature based medicine based medicine
High quality, controlled experimental High quality, controlled experimental studies have long been preferable to studies have long been preferable to poor quality, uncontrolled studiespoor quality, uncontrolled studies

Clinical StudiesClinical Studies
Double blind (masked) both subjects and Double blind (masked) both subjects and evaluators, randomized, placebo controlled evaluators, randomized, placebo controlled studiesstudies
Single blind (masked) Subjects, randomized, Single blind (masked) Subjects, randomized, placebo controlled studiesplacebo controlled studies
Open-label (unmasked) randomized, Open-label (unmasked) randomized, placebo controlled studiesplacebo controlled studies
Non-randomized, controlled, observational Non-randomized, controlled, observational studies with concurrent groupsstudies with concurrent groups
Observational studies with historical control Observational studies with historical control groups – Framingham study groups – Framingham study
Uncontrolled observational studies, Uncontrolled observational studies, especially individual case reports, case especially individual case reports, case series, and descriptive reports based on series, and descriptive reports based on large databases and clinical registries.large databases and clinical registries.
Framingham StudyFramingham Study
The original study cohort consisted of The original study cohort consisted of respondents of a random sample of 2/3 of respondents of a random sample of 2/3 of adults, 30 to 62 years of age, residing in adults, 30 to 62 years of age, residing in Framingham, Massachusetts in 1948. Of the Framingham, Massachusetts in 1948. Of the original 5209, there are approximately 1095 original 5209, there are approximately 1095 known alive as of February 1998.known alive as of February 1998.
The Offspring Study was initiated in 1971 The Offspring Study was initiated in 1971 when the need for establishing a when the need for establishing a prospective epidemiologic study of young prospective epidemiologic study of young adults was recognized. A sample of 5135 adults was recognized. A sample of 5135 men and women, consisting of the offspring men and women, consisting of the offspring of the original cohort and their spouses was of the original cohort and their spouses was established. As of February 24, 1998, there established. As of February 24, 1998, there were approximately 4524 offspring surviving were approximately 4524 offspring surviving with only 20 lost to follow-up and 4 in whom with only 20 lost to follow-up and 4 in whom survival status was unknown.survival status was unknown.
Problems with StudiesProblems with Studies
Lack of concealment (open label, historical Lack of concealment (open label, historical controls) – amplification of effectscontrols) – amplification of effects
No controlled environment in observational No controlled environment in observational studies – hard to link cause and effectstudies – hard to link cause and effect
Studies without control groups – bias, Studies without control groups – bias, spurious claims of large treatment effectsspurious claims of large treatment effects
Length of time – Average randomized trial Length of time – Average randomized trial takes 5 to 7 years from conception to takes 5 to 7 years from conception to publishingpublishing
Characteristics of StudiesCharacteristics of Studies
Internal ValidityInternal Validity Robust comparison throughout the studyRobust comparison throughout the study Lack of adherenceLack of adherence Cross over to the other armCross over to the other arm Reduced number of follow-up patientsReduced number of follow-up patients Missing measurementsMissing measurements
External ValidityExternal Validity Study results must be generalizable to the Study results must be generalizable to the
populationpopulation More controlled the study is harder to generalizeMore controlled the study is harder to generalize Baseline risk of the population must be Baseline risk of the population must be
consideredconsidered Information about patient opt out of treatment is Information about patient opt out of treatment is
necessarynecessary
Measurement of End Measurement of End PointsPoints
Example:Example: Dyskinesia after Ropinirole (ROP) or Dyskinesia after Ropinirole (ROP) or
Levodopa (LD) for early Parkinson’s Levodopa (LD) for early Parkinson’s diseasedisease
17 out of 179 patients developed 17 out of 179 patients developed dyskinesia in the ROP armdyskinesia in the ROP arm
23 out of 89 patients developed 23 out of 89 patients developed dyskinesia in the LD armdyskinesia in the LD arm
Measurement of End PointsMeasurement of End PointsAbsolute Risk ReductionAbsolute Risk Reduction
Absolute risk: The observed or calculated Absolute risk: The observed or calculated probability of an event in the population probability of an event in the population under studyunder study
Absolute Risk Reduction (risk difference): Absolute Risk Reduction (risk difference): Is the risk of an event reduced by a Is the risk of an event reduced by a clinically meaningful amountclinically meaningful amount
The difference between the risk of an The difference between the risk of an event in the control group and the risk of event in the control group and the risk of an event in the treatment groupan event in the treatment group
Absolute risk: ROP arm 17/179=0.095Absolute risk: ROP arm 17/179=0.095 Absolute risk: LD arm 23/89=0.258Absolute risk: LD arm 23/89=0.258 Absolute risk reduction: 0.258-Absolute risk reduction: 0.258-
0.095=0.1630.095=0.163
Measurement of End PointsMeasurement of End PointsNumber needed to treat (NNT)Number needed to treat (NNT)
Based on Absolute risk reduction.Based on Absolute risk reduction. The number of patients that The number of patients that
need to be treated, to get the need to be treated, to get the desired outcome of in one desired outcome of in one patient who would not have patient who would not have benefited otherwisebenefited otherwise
NNT: 1/0.163=6.13NNT: 1/0.163=6.13 When negative than Number When negative than Number
needed to Harm (NNH)needed to Harm (NNH)
Measurement of End PointsMeasurement of End PointsRelative Risk and Relative Risk Relative Risk and Relative Risk
ReductionReduction
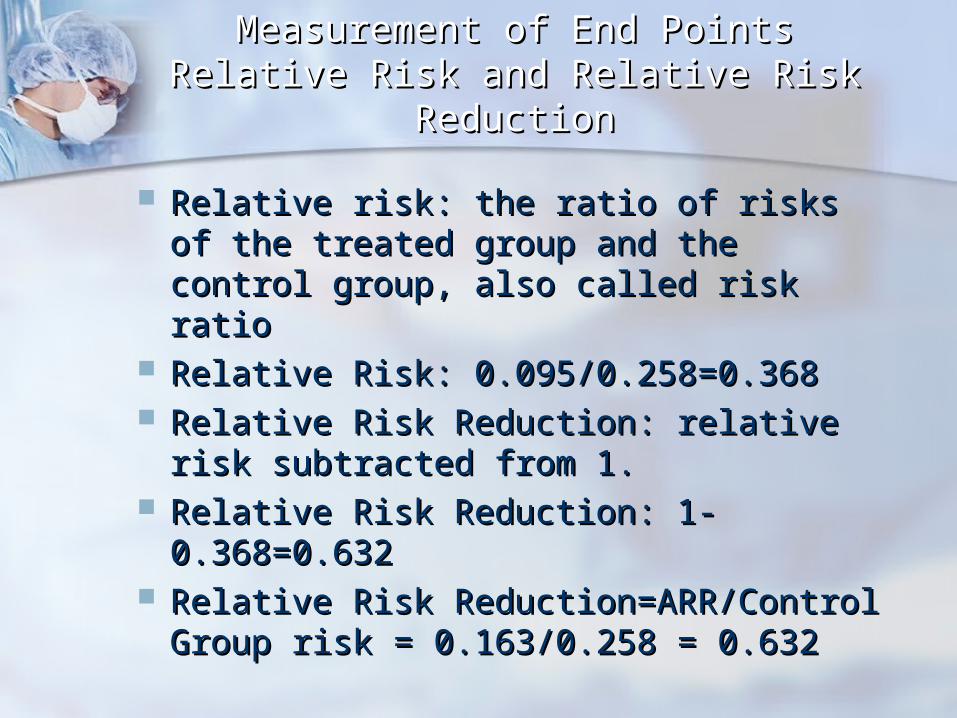
Relative risk: the ratio of risks of the Relative risk: the ratio of risks of the treated group and the control group, treated group and the control group, also called risk ratioalso called risk ratio
Relative Risk: 0.095/0.258=0.368Relative Risk: 0.095/0.258=0.368 Relative Risk Reduction: relative risk Relative Risk Reduction: relative risk
subtracted from 1.subtracted from 1. Relative Risk Reduction: 1-Relative Risk Reduction: 1-
0.368=0.6320.368=0.632 Relative Risk Reduction=ARR/Control Relative Risk Reduction=ARR/Control
Group risk = 0.163/0.258 = 0.632Group risk = 0.163/0.258 = 0.632

Measurement of End PointsMeasurement of End PointsOdds and Odds RatioOdds and Odds Ratio
Odds: a proportion in which the numerator Odds: a proportion in which the numerator contains the number of times an event occurs contains the number of times an event occurs and the denominator includes the number of and the denominator includes the number of times the event does not occurtimes the event does not occur
Odds of ROP arm:17/(179-17)=17/162=0.105Odds of ROP arm:17/(179-17)=17/162=0.105 Odds of LD arm: 23/(89-23)=23/89=0.348Odds of LD arm: 23/(89-23)=23/89=0.348 Odds ratio: is a common measure of the size of Odds ratio: is a common measure of the size of
and effect and the goal is to look at associations and effect and the goal is to look at associations rather than differences.rather than differences.
The ratio between the odds of the treated group The ratio between the odds of the treated group and the odds of the control groupand the odds of the control group
The Odds ratio (OR) less than 1 means that the The Odds ratio (OR) less than 1 means that the odds have decreased, and similarly OR greater odds have decreased, and similarly OR greater than 1 means that the odds have increased.than 1 means that the odds have increased.
Odds ratio: 0.105/0.348=0.302 – the odds of Odds ratio: 0.105/0.348=0.302 – the odds of dyskinesia is reduced for the ROP arm.dyskinesia is reduced for the ROP arm.
Measurement of End PointsMeasurement of End PointsIntention to Treat - CautionsIntention to Treat - Cautions Intention to treat: "Intention to treat" is a strategy for the Intention to treat: "Intention to treat" is a strategy for the
analysis of randomised controlled trials that compares patients analysis of randomised controlled trials that compares patients in the groups to which they were originally randomly assigned. in the groups to which they were originally randomly assigned. This is generally interpreted as including all patients, regardless This is generally interpreted as including all patients, regardless of whether they actually satisfied the entry criteria, the of whether they actually satisfied the entry criteria, the treatment actually received, and subsequent withdrawal or treatment actually received, and subsequent withdrawal or deviation from the protocol. deviation from the protocol.
Better measure of EffectivenessBetter measure of Effectiveness Intention to treat gives a pragmatic estimate of the benefit of a
change in treatment policy rather than of potential benefit in patients who receive treatment exactly as planned
Full application of intention to treat is possible only when complete outcome data are available for all randomised subjects
About half of all published reports of randomised controlled trials stated that intention to treat was used, but handling of deviations from randomised allocation varied widely
Many trials had some missing data on the primary outcome variable, and methods used to deal with this were generally inadequate, potentially leading to bias
Intention to treat analyses are often inadequately described and inadequately applied
Other CharacteristicsOther Characteristics
Adjustment – may be required in non Adjustment – may be required in non randomized studiesrandomized studies
Sub-group analyses – may distort the Sub-group analyses – may distort the results, especially not intended in the results, especially not intended in the original studyoriginal study
Stratification – must happen before Stratification – must happen before the randomizationthe randomization
Multiple and Secondary end points – Multiple and Secondary end points – must be defined before the studymust be defined before the study
Significance – not a good indicator – Significance – not a good indicator – confidence intervals are better confidence intervals are better because they allow for sensitivity because they allow for sensitivity analysesanalyses
Systematic Review of Systematic Review of EvidenceEvidence
Meta-AnalysesMeta-Analyses Meta analysis: a set of qualitative Meta analysis: a set of qualitative
methods for statistically combining the methods for statistically combining the results of different studies on the same results of different studies on the same topic to explore the degree of and topic to explore the degree of and reasons for heterogeneity and bias in reasons for heterogeneity and bias in the combined results and to provide a the combined results and to provide a quantitative synthesis of these resultsquantitative synthesis of these results
Example: Cochrane collaborationExample: Cochrane collaboration Meta analyses are Meta analyses are
Important for clinical decision makingImportant for clinical decision making Conducted if there is better than average Conducted if there is better than average
quality researchquality research Conducted if adequate information Conducted if adequate information
availableavailable
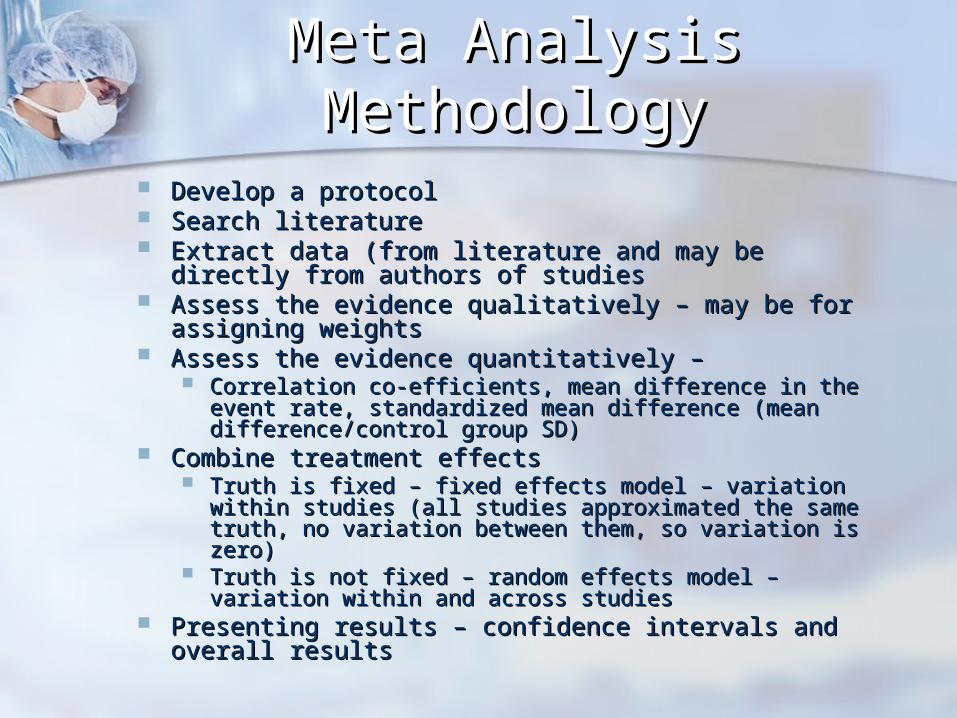
Meta Analysis Meta Analysis MethodologyMethodology
Develop a protocolDevelop a protocol Search literatureSearch literature Extract data (from literature and may be directly Extract data (from literature and may be directly
from authors of studiesfrom authors of studies Assess the evidence qualitatively – may be for Assess the evidence qualitatively – may be for
assigning weightsassigning weights Assess the evidence quantitatively – Assess the evidence quantitatively –
Correlation co-efficients, mean difference in the event Correlation co-efficients, mean difference in the event rate, standardized mean difference (mean rate, standardized mean difference (mean difference/control group SD)difference/control group SD)
Combine treatment effectsCombine treatment effects Truth is fixed – fixed effects model – variation within Truth is fixed – fixed effects model – variation within
studies (all studies approximated the same truth, no studies (all studies approximated the same truth, no variation between them, so variation is zero)variation between them, so variation is zero)
Truth is not fixed – random effects model – variation Truth is not fixed – random effects model – variation within and across studieswithin and across studies
Presenting results – confidence intervals and overall Presenting results – confidence intervals and overall resultsresults
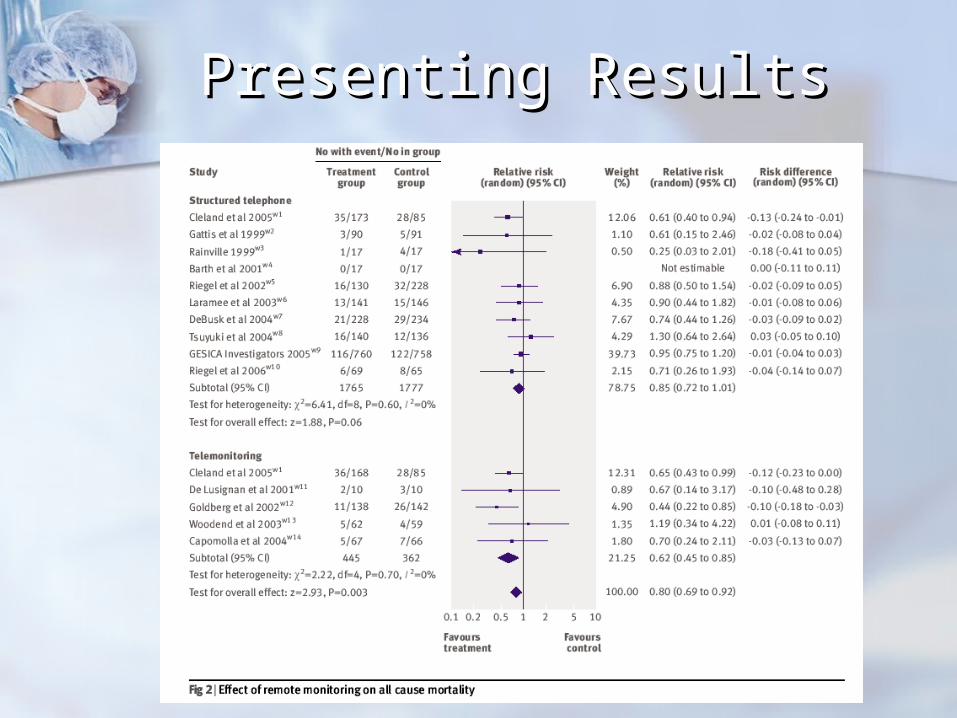
Presenting ResultsPresenting Results
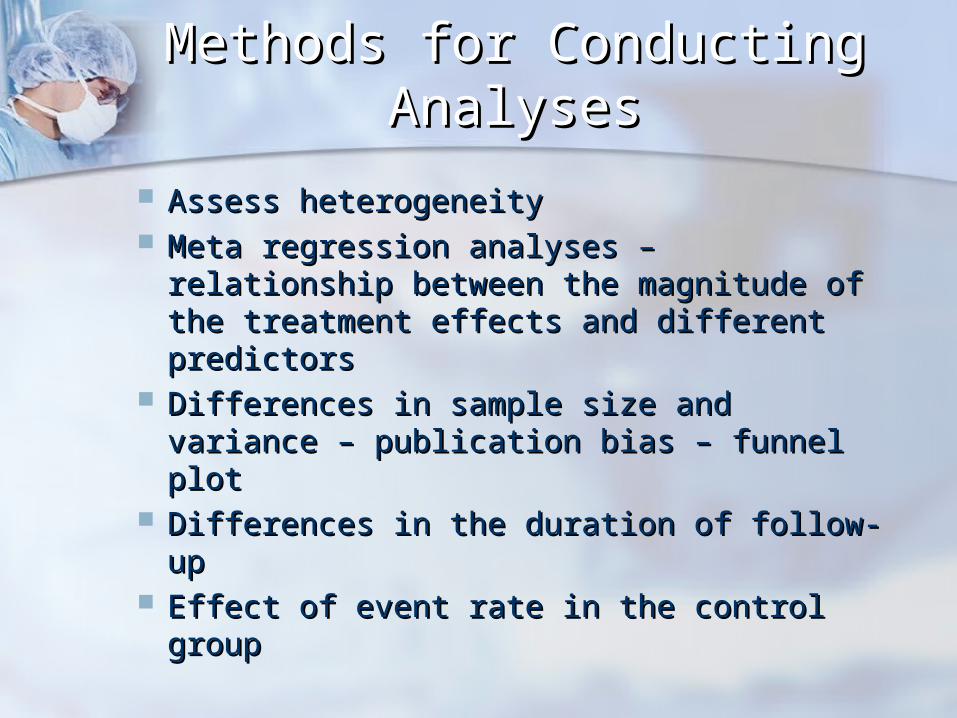
Methods for Conducting Methods for Conducting AnalysesAnalyses
Assess heterogeneityAssess heterogeneity Meta regression analyses – relationship Meta regression analyses – relationship
between the magnitude of the treatment between the magnitude of the treatment effects and different predictorseffects and different predictors
Differences in sample size and variance – Differences in sample size and variance – publication bias – funnel plot publication bias – funnel plot
Differences in the duration of follow-upDifferences in the duration of follow-up Effect of event rate in the control group Effect of event rate in the control group
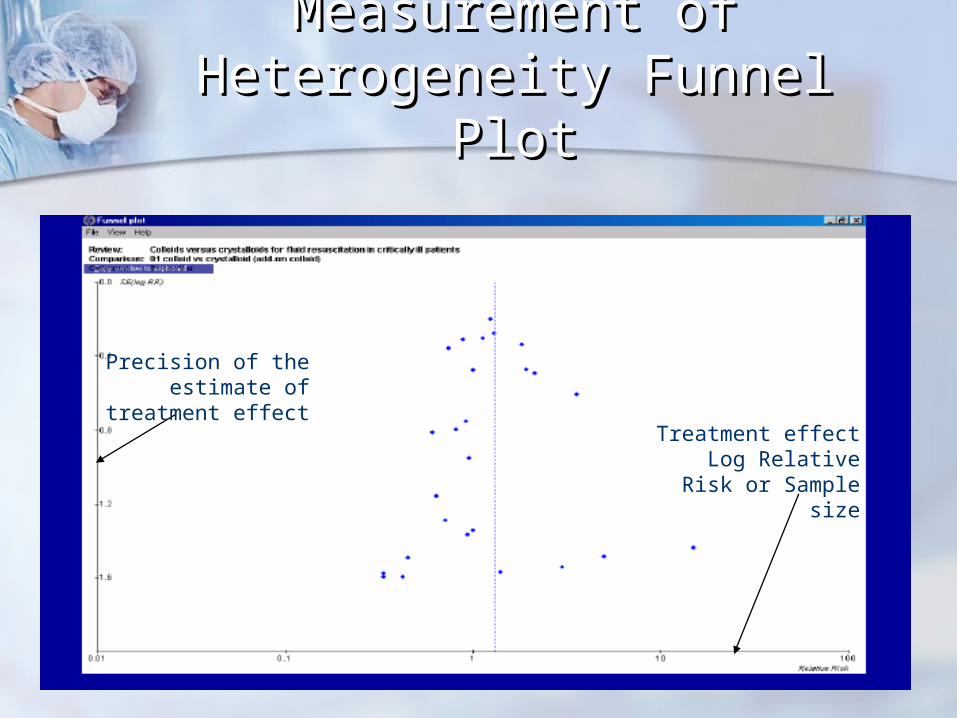
Measurement of Measurement of Heterogeneity Funnel PlotHeterogeneity Funnel Plot
Precision of the estimate of treatment effect
Treatment effectLog Relative Risk or
Sample size
Meta AnalysisMeta AnalysisSpecific typesSpecific types
Meta-analyses of diagnostic tests – Meta-analyses of diagnostic tests – receiver operating characteristics receiver operating characteristics = trade off between sensitivity and = trade off between sensitivity and specificityspecificity
Meta-analyses of individual Meta-analyses of individual patientspatients More detailed time to event analysesMore detailed time to event analyses Ability to generate individual based Ability to generate individual based
predictive modelspredictive models But retrieval bias and cumbersomeBut retrieval bias and cumbersome
Other concernsOther concerns
Non-statistically significant results - Non-statistically significant results - our concern is magnitude of our concern is magnitude of treatment effects or the strength of treatment effects or the strength of the associationthe association
Use in public policy – averages Use in public policy – averages might be good but identifying might be good but identifying specific populations are also very specific populations are also very usefuluseful
Sensitivity analysis - might be Sensitivity analysis - might be necessary to identify the most necessary to identify the most beneficial patient groupbeneficial patient group