Embed Size (px)
Citation preview

Meta-Regression & Mixed Effects
Ti ~ N(qi,si2)
qi ~ N( ,m t2)

There’s a Grand Mean.Everything else is noise.

A First Stab at a Model: Fixed Effects
• Starting model: there is only one grand mean, everything else is error
Ti ~ (N qi, si2)
where
qi = m

Assessing Heterogeneity
• Qt follows a c2 distribution with K-1 DF
Test for Heterogeneity: Q(df = 24) = 45.6850, p-val = 0.0048

Solutions to Heterogeneity
Heterogeneity
Allow Variation in qRandom Effects Model
Model Drivers of Heterogeneity (Fixed)
Model Drivers &Allow Variation in qMixed Effects Model

There is a Grand MeanStudy Means are from a
distributionAlso, there’s additional error…

The Random Effects Model
• Each study's mean is drawn from a distribution, everything else is error
Ti ~ (N qi, si2)
qi ~ (N m,t2)

Adding group structure to a Fixed Effects Model

A Fixed Effect Group Model
• Starting model: there are group means, everything else is error
Ti ~ (N qim, si2)
where
qim = mm

So…Does Group Structure Matter?
•Qt = Qm + Qe
• We can now partition total variation into that driven by the model versus residual heterogeneity
• Kinda like ANOVA, no?

Solutions to Heterogeneity
Heterogeneity
Allow Variation in qRandom Effects Model
Model Drivers of Heterogeneity (Fixed)
Model Drivers &Allow Variation in qMixed Effects Model

A Mixed Effect Group Model
• Group means, random study effect, and then everything else is error
Ti ~ (N qim, si2)
where
qim ~ (N mm,t2)

Simple Random Effects t2
• Qt, wi, etc. are all from the fixed model
• This formula varies with model structure
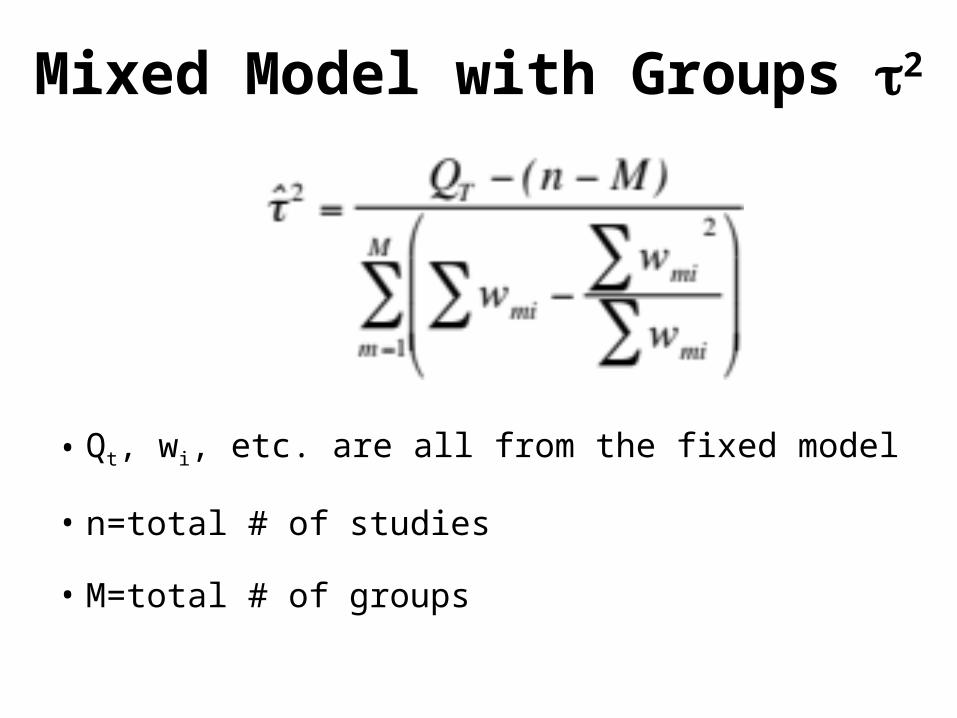
Mixed Model with Groups t2
• Qt, wi, etc. are all from the fixed model
• n=total # of studies
• M=total # of groups

Our Question!
Male mating history and female fecundity in the Lepidoptera: do male virgins make better partners?
Torres-Villa and Jennions 2005
Agrotis segetum - wikipedia

What if we have group variation & study variation driving excessive
Heterogeneity?
Moths (Heterocera) Butterflies (Rhopalocera)

Mixed Effects Model in R
> rma(Hedges.D ~ Suborder, Var.D, data=lep, method="DL")

Comparing Fixed v. Mixed
Fixed Model Results:
estimate se zval pval ci.lb ci.ub
intrcpt 0.3875 0.0496 7.8179 <.0001 0.2903 0.4846SuborderR -0.0540 0.1281 -0.4218 0.6732 -0.3050 0.1970
Mixed Model Results:
estimate se zval pval ci.lb ci.ub
intrcpt 0.3356 0.0777 4.3162 <.0001 0.1832 0.4880SuborderR 0.0335 0.1723 0.1947 0.8456 -0.3042 0.3713

Solutions to Heterogeneity
Heterogeneity
Allow Variation in qRandom Effects Model
Model Drivers of Heterogeneity (Fixed)
Model Drivers &Allow Variation in qMixed Effects Model

Meta-Regression
• X is a covariate, can be extended to multiple covariates
Ti = qi+ ei
whereqi = b0 + b1Xi
ei ~ N(0,si2)

Mixed Model Meta-Regression
Ti = qi+ ei
Where
qi = b0 + b1Xi
b0 ~ (N bfixed,t2)
ei ~ N(0,si2)

Additional Considerations for Meta-Regression
• Qm is calculated using bs
• Q tests as normal
• Formula for t2 depends on model structure, and can be quite complex
• Can be fixed or mixed effects model

Exploring Polyandry
Is advantage by virgin males is this modified by polyandry within a species?
Torres-Villa and Jennions 2005
Agrotis segetum - wikipedia

Two Least Squares Meta-Regressions
> polyandry_mod <- rma(Hedges.D ~ X..Polyandry, Var.D, data=lep, method="FE")
> polyandry_mod_r <- rma(Hedges.D ~ X..Polyandry, Var.D, data=lep, method="DL")

Fixed Output
Fixed-Effects with Moderators Model (k = 22)
Test for Residual Heterogeneity: QE(df = 20) = 34.9105, p-val = 0.0206
Test of Moderators (coefficient(s) 2): QM(df = 1) = 10.2021, p-val = 0.0014
Model Results:
estimate se zval pval ci.lb ci.ub intrcpt 0.1263 0.0927 1.3635 0.1727 -0.0553 0.3080 X..Polyandry 0.0060 0.0019 3.1941 0.0014 0.0023 0.0097 **
---Signif. codes: 0 ‘***’ 0.001 ‘**’ 0.01 ‘*’ 0.05 ‘.’ 0.1 ‘ ’ 1

Funnel Plots with Adjusted Values
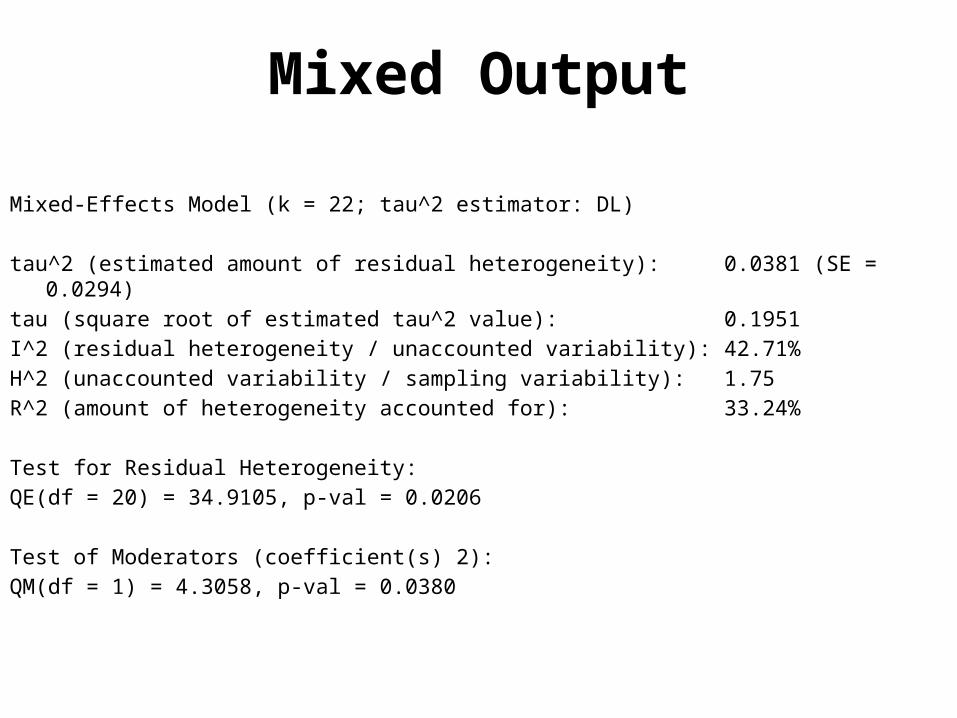
Mixed Output
Mixed-Effects Model (k = 22; tau^2 estimator: DL)
tau^2 (estimated amount of residual heterogeneity): 0.0381 (SE = 0.0294)
tau (square root of estimated tau^2 value): 0.1951I^2 (residual heterogeneity / unaccounted variability): 42.71%H^2 (unaccounted variability / sampling variability): 1.75R^2 (amount of heterogeneity accounted for): 33.24%
Test for Residual Heterogeneity: QE(df = 20) = 34.9105, p-val = 0.0206
Test of Moderators (coefficient(s) 2): QM(df = 1) = 4.3058, p-val = 0.0380
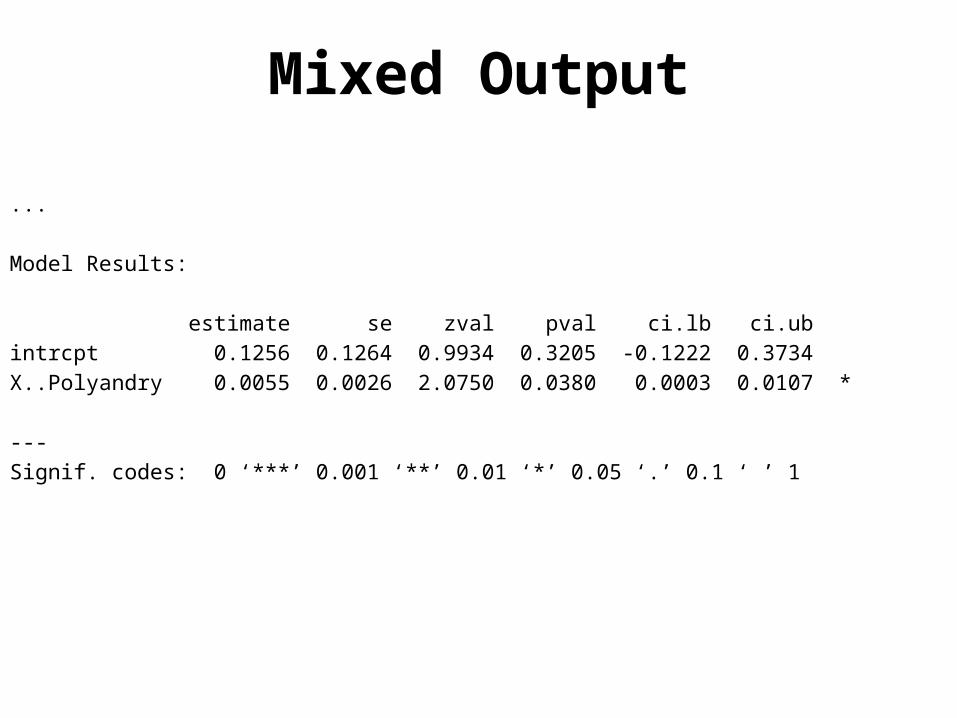
Mixed Output
...
Model Results:
estimate se zval pval ci.lb ci.ub intrcpt 0.1256 0.1264 0.9934 0.3205 -0.1222 0.3734 X..Polyandry 0.0055 0.0026 2.0750 0.0380 0.0003 0.0107 *
---Signif. codes: 0 ‘***’ 0.001 ‘**’ 0.01 ‘*’ 0.05 ‘.’ 0.1 ‘ ’ 1

Comparing Fixed and Random Effects

Assumptions!
• All of these models still make assumptions
• These are least squares linear Gaussian models – same as ANOVA, linear regression, etc.
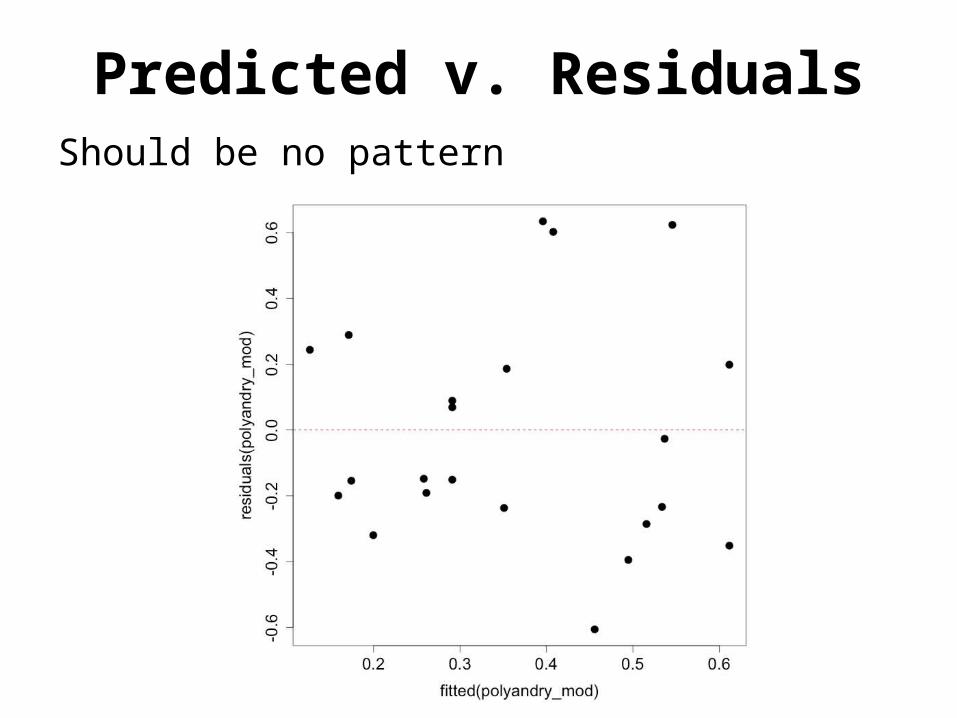
Predicted v. ResidualsShould be no pattern

qqnorm(polyandry_mod)

plot(influence(polyandry_mod)

Influence as Measured by Cook’s D

Baujat Plots for Sources of Residual Heterogeneity
> baujat(polyandry_mod)

Exercise
• Open load_marine_data.R
• Load the marine meta-analysis data
• Explore & Share

![Lecture 07 Multiple linear regression I - Wikimedia€¦ · Multiple Linear Regression I 2 1. Howitt & Cramer (2014): – Regression: Prediction with precision [Ch 9] [Textbook/UCLearn](https://img.pdfslide.net/doc/110x75/5f0921477e708231d4255ee9/lecture-07-multiple-linear-regression-i-wikimedia-multiple-linear-regression-i.jpg)


![[width=3.3cm]images/LogoMOA.jpg .5cm Regressionabifet/523/Regression-Slides.pdf · I Regression Gain = SD(before Split) SD(after split) StandardDeviation (SD) = qX (y yi)2=N. Numeric](https://img.pdfslide.net/doc/110x75/5f06e0f57e708231d41a3040/width33cmimages-5cm-regression-abifet523regression-slidespdf-i-regression.jpg)