Embed Size (px)
Citation preview

METABOLIC ENGINEERING OF RAFFINOSE-FAMILY OLIGOSACCHARIDES IN THE
PHLOEM REVEALS ALTERATIONS IN PATTERNS OF CARBON PARTITIONING AND
ENHANCES RESISTANCE TO GREEN PEACH APHID
Te Cao
Thesis Prepared for the Degree of
MASTER OF SCIENCE
UNIVERSITY OF NORTH TEXAS
August 2010
APPROVED:
Brian G. Ayre, Major Professor Jyoti Shah, Committee Member Douglas D. Root, Committee Member Art J. Goven, Chair of the Department of
Biological Sciences James D. Meernik, Acting Dean of the
Robert B. Toulouse School of Graduate Studies
Cao, Te. Metabolic engineering of raffinose-family oligosaccharides in the phloem
reveals alterations in patterns of carbon partitioning and enhances resistance to green peach
aphid. Master of Science (Biochemistry), August 2010, 66 pp., 6 tables, 22 illustrations,
references, 49 titles.
Phloem transport is along hydrostatic pressure gradients generated by differences in
solute concentration between source and sink tissues. Numerous species accumulate raffinose-
family oligosaccharides (RFOs) in the phloem of mature leaves to accentuate the pressure
gradient between source and sinks. In this study, metabolic engineering was used to generate
RFOs at the inception of the translocation stream of Arabidopsis thaliana, which transports
predominantly sucrose. To do this, three genes, GALACTINOL SYNTHASE, RAFFINOSE
SYNTHASE and STACHYOSE SYNTHASE, were expressed from promoters specific to the
companion cells of minor veins. Two transgenic lines homozygous for all three genes (GRS63
and GRS47) were selected for further analysis. Sugars were extracted and quantified by high
performance anion exchange chromatography with pulsed amperometric detection (HPAEC-
PAD), and 21-day old plants of both lines had levels of galactinol, raffinose, and stachyose
approaching 50% of total soluble sugar. All three exotic sugars were also identified in phloem
exudates from excised leaves of transgenic plants whereas levels were negligible in exudates
from wild type leaves. Differences in starch accumulation or degradation between wild type and
GRS63 and GRS47 lines were not observed. Similarly, there were no differences in vegetative
growth between wild type and engineered plants, but engineered plants flowered earlier. Finally,
since the sugar composition of the phloem translocation stream is altered in these plants, we
tested for aphid feeding. When green peach aphids were given a choice between WT and
transgenic plants, WT plants were preferred. When aphids were reared on only WT or only

transgenic plants, aphid fecundity was reduced on the transgenic plants. When aphids were fed
on artificial media with and without RFOs, aphid reproduction did not show differences,
suggesting the aphid resistance is not a direct effect of the exotic sugars.

ii
Copyright 2010
By
Te Cao
iii
ACKNOWLEDGEMENTS
First and foremost, I would like to thank my major professor, Dr. Brian Ayre. Without his
support and guidance, I would never have extended myself so far. I would also like to thank my
other graduate committee members, Dr. Jyoti Shah and Dr. Douglas Root. I am grateful for Dr.
Shah’s warm guidance and his graduate students’ assistance in aphid experiments. I am thankful
to Dr. Root for his encouragement and help. Thanks to my lab mates (old and new). I would also
like to thank my friends such as Arland and Xiaoyu Shi for their wonderful friendship and
companionship. I am indebted to my grandmother, mother and sister for their undivided belief in
me.
Finally, I would like to extend a special thanks to the Department of Biological Sciences
at UNT and to the National Science Foundation (IOS 0344088 and 0922546 to BGA) for
supporting aspects of this research. Thank you to all.

iv
TABLE OF CONTENTS
ACKNOWLEDGEMENTS .......................................................................................................... iii LIST OF TABLES ......................................................................................................................... vi LIST OF FIGURES ...................................................................................................................... vii Chapter
1. INTRODUCTION .................................................................................................. 1
1.1 Phloem Loading .......................................................................................... 2
1.1.1 Apoplastic Phloem Loading ............................................................ 2
1.1.2 Symplastic Phloem Loading ........................................................... 3
1.2 Raffinose Family Oligosaccharides (RFOs): .............................................. 4
1.2.1 Biosynthesis of RFOs ..................................................................... 4
1.2.2 Catabolism of RFOs ........................................................................ 5
1.2.3 Physiological Roles of RFOs .......................................................... 6
1.3 Objectives ................................................................................................... 7 2. MATERIALS AND METHODS .......................................................................... 16
2.1 Plasmid Construction ................................................................................ 16
2.2 Plant Materials: ......................................................................................... 17
2.3 Plant Transformation and Selection .......................................................... 18
2.4 Sugar Analysis .......................................................................................... 19
2.5 Starch Analysis ......................................................................................... 20
2.5.1 Starch Staining with Iodine and Microscopy ................................ 20
2.5.2 Starch Assay.................................................................................. 20
2.6 EDTA Exudates Analysis ......................................................................... 21
2.7 Growth Rate Analysis ............................................................................... 22
2.8 Flowering Time Analysis .......................................................................... 22
2.9 Aphid Feeding Experiments ..................................................................... 23
2.9.1 No-choice Aphid Feeding Test for Fecundity .............................. 23
2.9.2 Choice Aphid Test ........................................................................ 23
2.9.3 Artificial Aphid Diet Test ............................................................. 23 3. RESULTS ............................................................................................................. 28

v
3.1 Identification of Homozygous (CmGAS1/CmGAS1; CsRFS/CsRFS; AmSTS1/AmSTS1) Plants .......................................................................... 28
3.2 Carbohydrate Steady State Analysis in Mature Leaves ............................ 29
3.3 Analysis of Soluble Sugars in Phloem Exudates ...................................... 31
3.4 Growth Rate Analysis ............................................................................... 32
3.5 Flowering Time Analysis .......................................................................... 32
3.6 Aphid Experiments ................................................................................... 32 4. DISCUSSION ....................................................................................................... 52
4.1 The Effect of RFOs Synthesis in Transgenic Arabidopsis ....................... 52
4.2 Hexoses Transport in Transgenic Arabidopsis ......................................... 54
4.3 Galactinol Transport in Transgenic Arabidopsis ...................................... 55
4.4 RFOs Transport in Transgenic Arabidopsis ............................................. 56
4.5 RFOs Metabolism in Transgenic Arabidopsis .......................................... 58
4.6 New Function of RFOs to Protect Plants from Aphids............................. 59
BIBLIOGRAPHY……………………………………………………………………………….63

vi
LIST OF TABLES
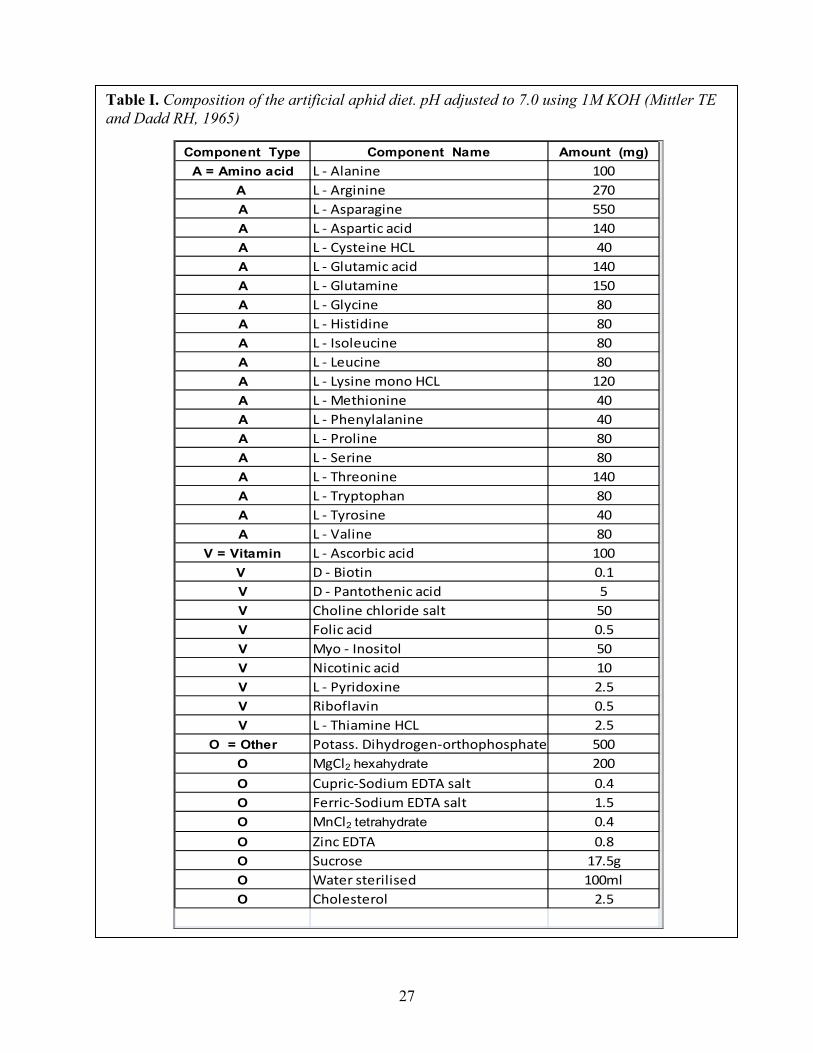
Table I: Composition of the artificial aphid diet. .......................................................................... 27
Table II: Summary for different antibiotic-resistant seedlings ..................................................... 36
Table III: Galactose in phloem exudates from wild type and transgenic plants with exudation rate (pmoles sugar exuded / leaf mg fwt / hour) by using 10 mM or 50 mM NaOH eluent ................ 44
Table IV: Sugars in phloem exudates from wild type and transgenic plants with exudation rate (pmoles sugar exuded / leaf mg fwt / hour). ................................................................................. 61
Table V: Percentage of sugars in leaves from wild type and transgenic plants ............................ 62
Table VI: Percentage of sugars in phloem exudates from wild type and transgenic plants ......... 62

vii
LIST OF FIGURES
Figure 1: Overview of phloem anatomy and osmotically-generated-pressure flow between source and sink tissues ............................................................................................................................... 9
Figure 2: Apoplastic phloem loading mediated by sucrose-proton symporters ........................... 10
Figure 3: The polymer trap model for symplastic phloem loading .............................................. 11
Figure 4: Chemical structure of RFOs .......................................................................................... 12
Figure 5: Biosynthetic pathway of RFOs in plants. ...................................................................... 13
Figure 6: Catabolic pathway of RFOs in plants. ........................................................................... 14
Figure 7: Proposed metabolic engineering strategy in source and sinks to target phloem transport to specific tissues.. ........................................................................................................................ 15
Figure 8: Schematic diagram of three gene constructs ................................................................ 25
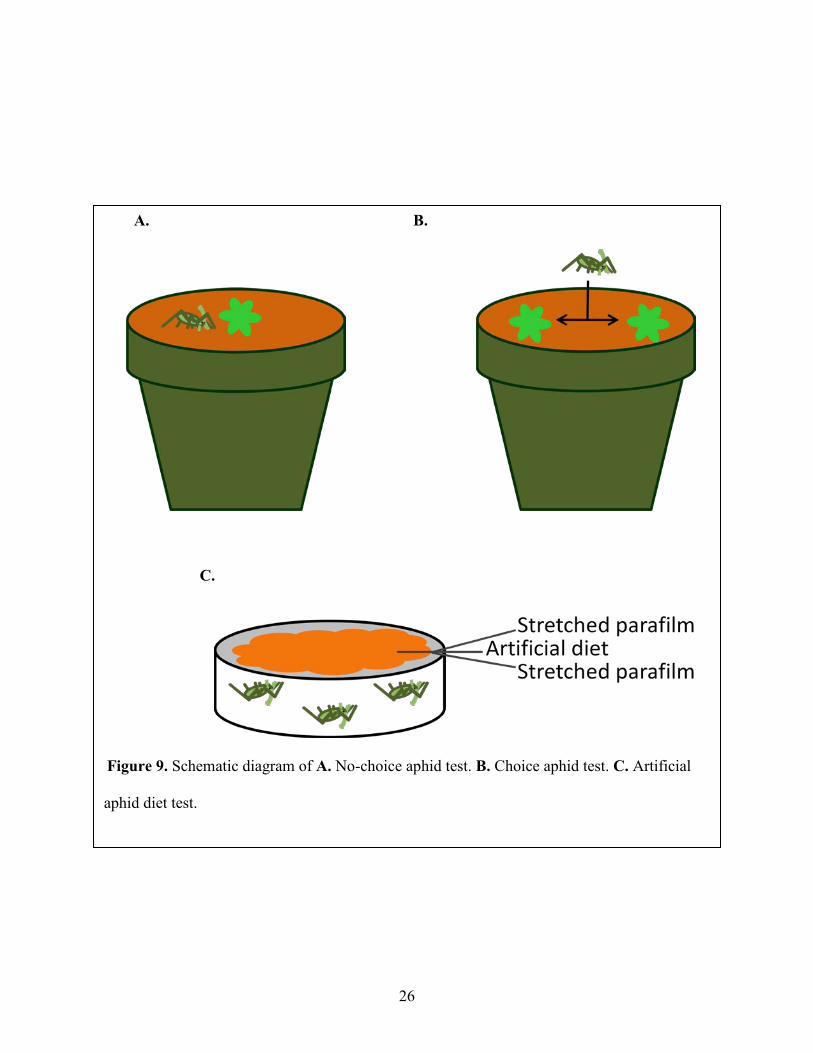
Figure 9: Schematic diagram of A. No-choice aphid test. B. Choice aphid test. C. Artificial aphid diet test. ......................................................................................................................................... 26
Figure 10: Selection of seedlings based on antibiotic/herbicide resistance.. ................................ 35
Figure 11: Comparison of sugar concentrations extracted from fresh tissue and from tissue frozen and ground in liquid nitrogen ........................................................................................................ 37
Figure 12: Representative chromatograms of sugar extracts from high performance anion exchange chromatography with pulsed amperometric detection (HPAEC-PAD) ............... 38&389
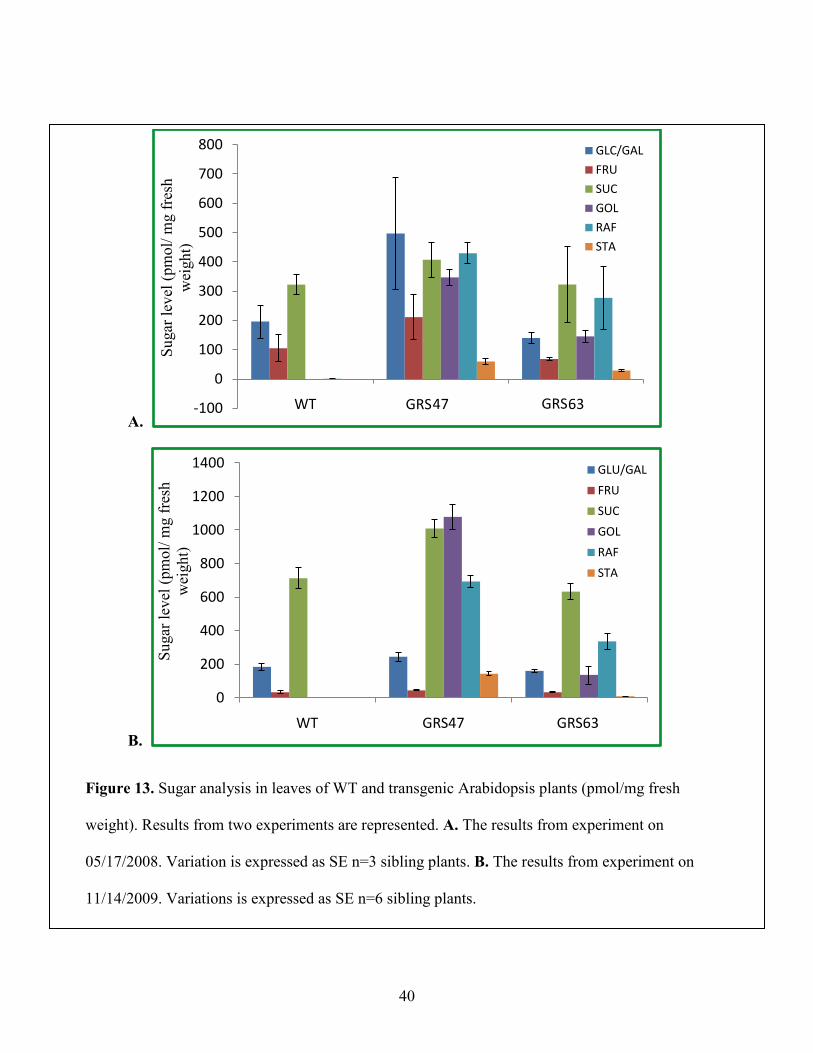
Figure 13: Sugar analysis in leaves of WT and transgenic Arabidopsis plants ............................ 40
Figure 14: Comparison of sugar components between 10 hours dark treatment and 8 hours light treatment ....................................................................................................................................... 41
Figure 15: Starch staining and starch assay in wild type (WT) and transgenic plants (GRS63 and GRS47) after 10 hours of dark treatment and 8 hours of light treatment. .................................... 42
Figure 16: Transport carbohydrates in phloem exudates from wild type and transgenic plants. . 43
Figure 17: Rosette growth analysis. .............................................................................................. 45
Figure 18: Flowering time analysis............................................................................................... 46
Figure 19: GRS63, WT and GRS47 lines 36 days after germination. .......................................... 47
Figure 20: No-choice test comparison of aphid growth for wild type (WT) and homozygous lines GRS63 and GRS47. ...................................................................................................................... 48

viii
Figure 21: Choice test comparison of aphid preference for wild type (WT) and homozygous lines GRS63 and GRS47. ...................................................................................................................... 49
Figure 22: Artificial aphid diet test. .............................................................................................. 51

1
CHAPTER 1
INTRODUCTION
Photosynthesis converts solar energy into chemical energy. In this process, light energy
drives the synthesis of carbohydrates from carbon dioxide and water with oxygen as the
byproduct. These carbohydrates can be stored or transported and used for biosynthesis or as an
energy source during respiration. Mature leaves are the most active photosynthetic tissue in most
plants. Two vascular systems - the xylem and the phloem- extend throughout the plant body:
The xylem transports water and minerals from the soil to photosynthetic leaves of the plant, and
the phloem transports water, minerals, and organic solutes from mature leaves to the sink tissues.
The phloem is the vascular tissue that translocates the carbohydrates generated by
photosynthesis from mature leaves to regions of growth or storage. Since it is responsible for
distributing biomass, the phloem is an important determinant of plant productivity. Phloem tissue
contains parenchyma cells, sieve elements, and companion cells. Parenchyma cells store starch,
protein, oils and water for plants. Sieve elements are the conducting cells that allow movement
of sugars and other organic materials throughout the plant. Mature sieve elements lack nearly all
organelles and are connected end to end to allow transport between cells (Taiz and Zeiger, 2006).
Companion cells are cytoplasmically dense and are connected to sieve elements by
plasmodesmata-pore units to form the sieve element-companion cell complex (SE-CCC)
(Haritatos et al., 2000). These two cells are derived from the same mother cell. Figure 1
illustrates the anatomy of a sieve element and companion cell in the SE-CCC.
Mature leaves are referred to as source tissues and regions of growth and storage are
termed sink tissues. The pressure-flow model was proposed (Ernst Munch in 1930) to explain
phloem transport mechanism. According to the pressure-flow model, phloem transport is driven
2
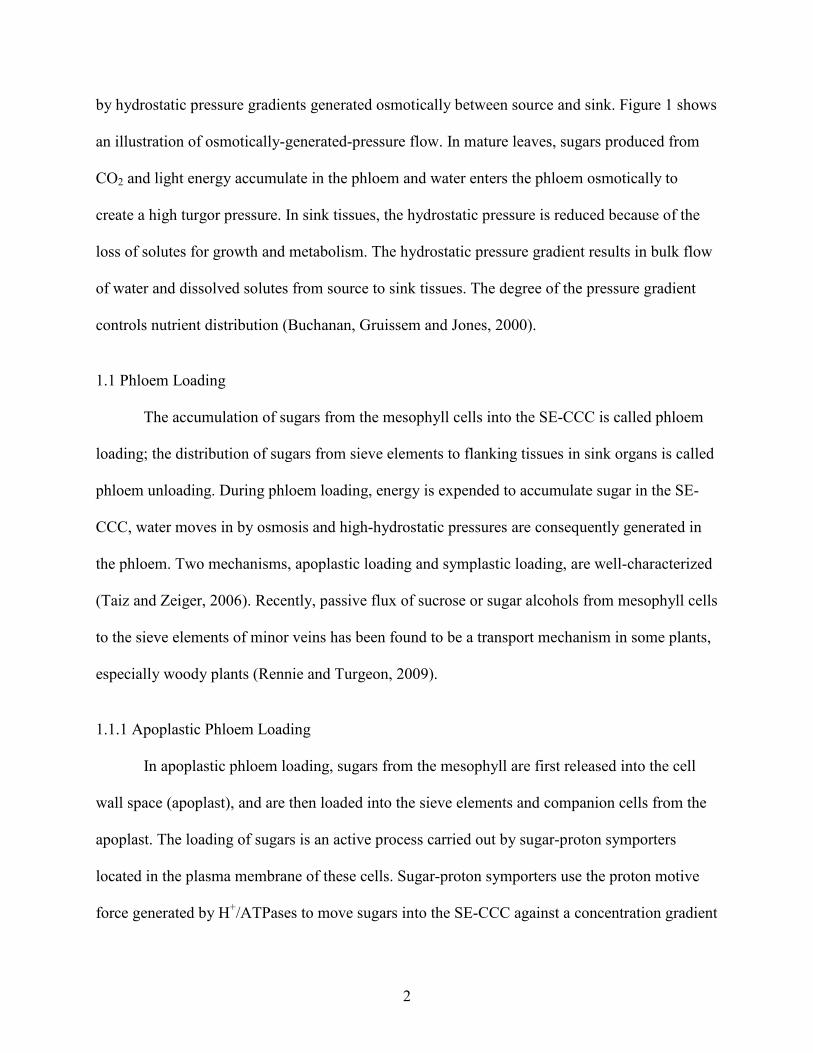
by hydrostatic pressure gradients generated osmotically between source and sink. Figure 1 shows
an illustration of osmotically-generated-pressure flow. In mature leaves, sugars produced from
CO2 and light energy accumulate in the phloem and water enters the phloem osmotically to
create a high turgor pressure. In sink tissues, the hydrostatic pressure is reduced because of the
loss of solutes for growth and metabolism. The hydrostatic pressure gradient results in bulk flow
of water and dissolved solutes from source to sink tissues. The degree of the pressure gradient
controls nutrient distribution (Buchanan, Gruissem and Jones, 2000).
1.1 Phloem Loading
The accumulation of sugars from the mesophyll cells into the SE-CCC is called phloem
loading; the distribution of sugars from sieve elements to flanking tissues in sink organs is called
phloem unloading. During phloem loading, energy is expended to accumulate sugar in the SE-
CCC, water moves in by osmosis and high-hydrostatic pressures are consequently generated in
the phloem. Two mechanisms, apoplastic loading and symplastic loading, are well-characterized
(Taiz and Zeiger, 2006). Recently, passive flux of sucrose or sugar alcohols from mesophyll cells
to the sieve elements of minor veins has been found to be a transport mechanism in some plants,
especially woody plants (Rennie and Turgeon, 2009).
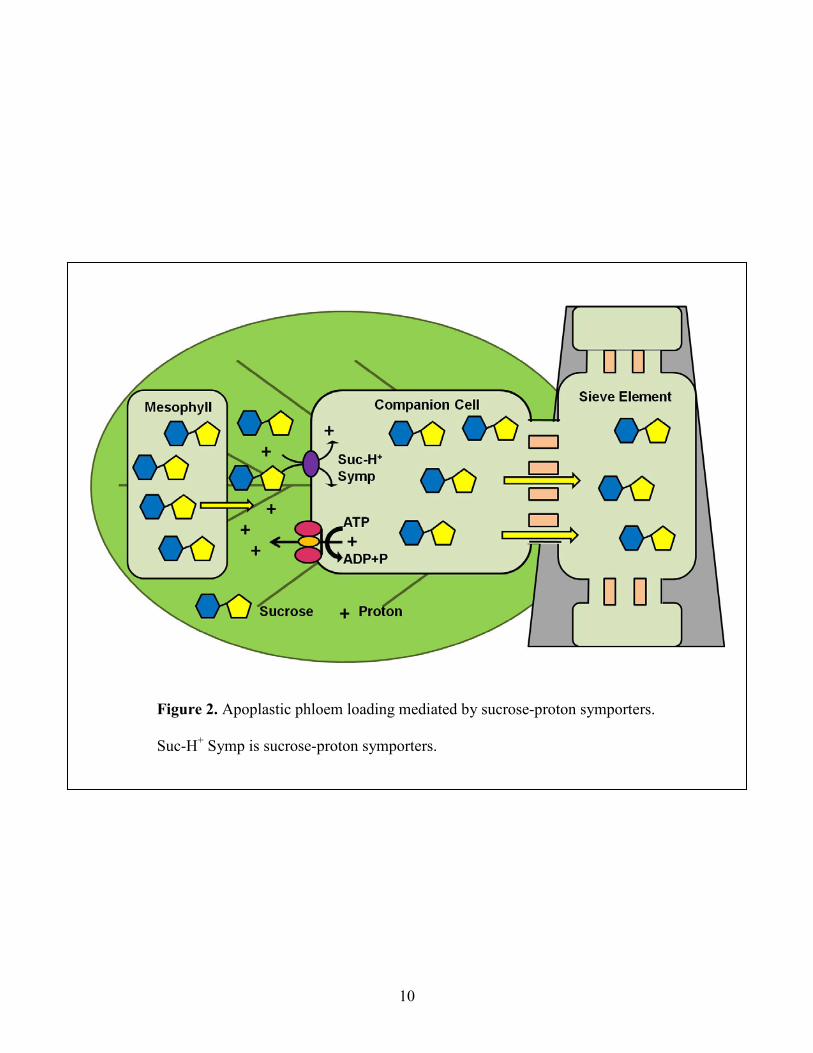
1.1.1 Apoplastic Phloem Loading
In apoplastic phloem loading, sugars from the mesophyll are first released into the cell
wall space (apoplast), and are then loaded into the sieve elements and companion cells from the
apoplast. The loading of sugars is an active process carried out by sugar-proton symporters
located in the plasma membrane of these cells. Sugar-proton symporters use the proton motive
force generated by H+/ATPases to move sugars into the SE-CCC against a concentration gradient

3
(Taiz and Zeiger, 2006). In most plants that use apoplastic phloem loading, sucrose is utilized as
the main transport sugar. Sucrose-H+ symporters (sucrose transporters) which mediate the
transport of sucrose from apoplast into the SE-CCC, have been found in many plants. Figure 2
illustrates the mechanism of apoplastic phloem loading. Sucrose transporters have important
regulatory roles in the distribution and partitioning of assimilates in plants. To date, five sucrose
transporter families have been identified and characterized for a variety of plants (Fan, et al.,
2009).
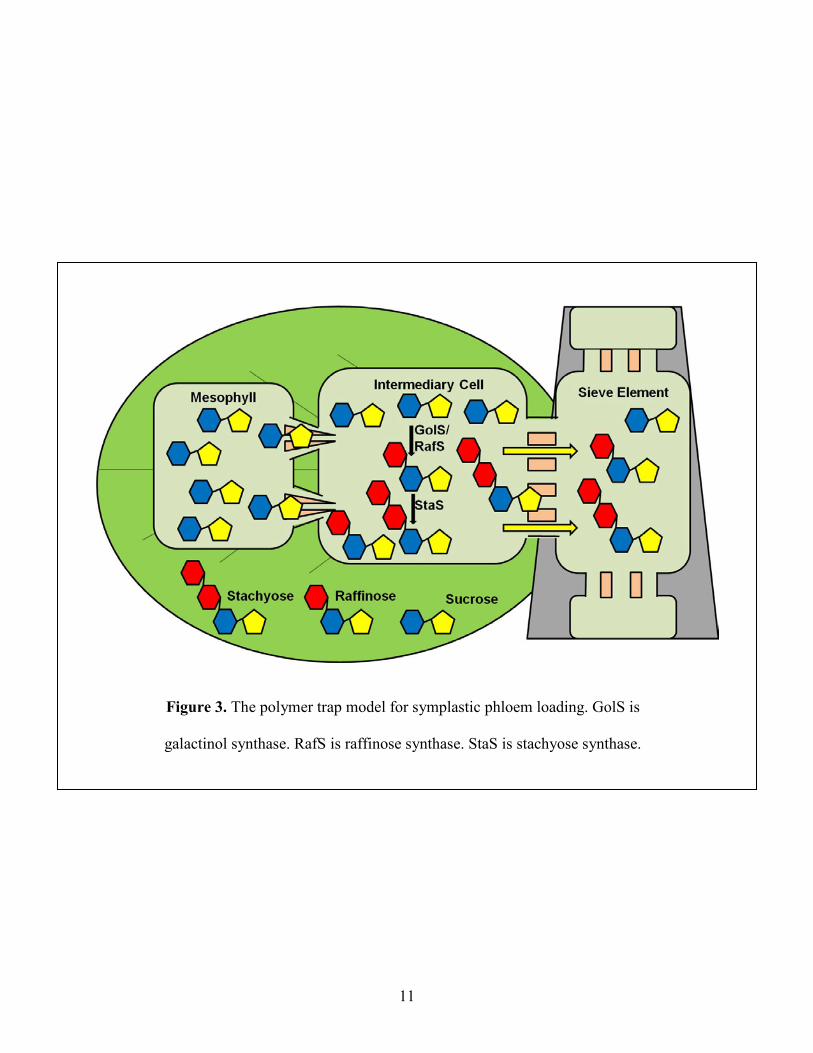
1.1.2 Symplastic Phloem Loading
Sucrose derivatives such as raffinose, stachyose and verbascose are prominent transport
sugars in plants that use the symplastic phloem loading mechanism. The polymer trap model was
proposed to explain the mechanism of symplastic phloem loading (Turgeon, 1996). In the
polymer trap mechanism (Figure 3), sucrose diffuses into intermediary cells (specialized
companion cells) from mesophyll cells through narrow and highly branched plasmodesmata. The
high number of plasmodesmata that connect intermediary cells to surrounding mesophyll cells is
a distinguishing feature of intermediary cells (Oparka and Turgeon, 1999). Inside intermediary
cells, sucrose is polymerized to raffinose family oligosaccharides (RFOs). This conversion from
sucrose to RFOs reduces the concentration of sucrose to maintain the sucrose diffusion gradient
from mesophyll cells to intermediary cells and allows continued diffusion. RFOs are predicted to
be unable to diffuse back to the mesophyll cells because of the larger size and consequently
accumulate to increase the overall solute concentration, and generate hydrostatic pressure. RFOs
then enter the sieve elements through the wider plasmodesmata-pore units that connect these two
cells (Turgeon and Ayre, 2005).

4
1.2 Raffinose Family Oligosaccharides (RFOs):
The occurrence of RFOs in plants is widespread and their physiological functions include
carbon transport, carbon storage, and protection against various stresses, such as salt, drought,
and cold stresses (Keller and Pharr, 1996). RFOs are α-galactosylated derivatives of sucrose,
which differ in the number of galactosyl moieties. Raffinose is a trisaccharide (αD-Gal-(1-6)-
αD-Glc-(1-2)-βD-Fru), stachyose is a tetrasaccharides (αD-Gal-(1-6)- αD-Gal-(1-6)-αD-Glc-(1-
2)-βD-Fru), and verbascose is a pentasaccharide (αD-Gal-(1-6)- αD-Gal-(1-6)- αD-Gal-(1-6)-
αD-Glc-(1-2)-βD-Fru ). RFOs are naturally found in many seeds, numerous vegetables (green
beans, soybeans, etc.) (Nakakuki, 2002) and numerous trees and herbs (Catalpa speciosa, Coleus
blumei, etc.) (Turgeon, 2004). Figure 4 shows the chemical structure of RFOs. RFOs are the
main transport sugars in symplastic phloem loading, with stachyose being the most dominating.
Their synthesis is proposed to be as part of the polymer trap mechanism for symplasmic phloem
loading (Turgeon, 1996).
1.2.1 Biosynthesis of RFOs
RFOs are synthesized from sucrose by the sequential addition of galactose moieties by α-
galactosyltransferases. The biosynthetic pathway of the RFOs is well-characterized (Keller and
Pharr, 1996). The three-step reaction leading to the tetrasaccharide stachyose is illustrated in
Figure 5. The committed step of RFOs synthesis is catalyzed by galactinol synthase (GolS; UDP-
galactose:myo-inositol-galactosyl transferase; EC 2.4.1.123). Galactinol (α-D-galactosyl-(1-3)-
1D-myo-inositol) is generated from myo-inositol and UDP-galactose, with UDP as the leaving
group. In the remaining steps of RFOs biosynthesis, galactinol serves as the donor of the
galactosyl moiety. Raffinose (Raf; α-D-Gal-(1-6)-α-D-Glc-(1-2)-β-D-Fru) is synthesized from
sucrose and galactinol by raffinose synthase (RafS; Galactinol:sucrose galactosyl transferase; EC

5
2.4.1.82) and myo-inositol is produced as the leaving group; Stachyose (Sta; α-D-Gal-(1-6)-α-D-
Gal-(1-6)-α-D-Glc-(1-2)-β-D-Fru) is produced from raffinose and galactinol by stachyose
synthase (StaS; Galactinol:raffinose galactosyl transferase; EC 2.4.1.67) and myo-inositol is
produced as the leaving group. Further extensions of the chain of galactosyls lead to generation
of other members of RFOs.
1.2.2 Catabolism of RFOs
The distribution of sugars from sieve elements in sink tissues is called phloem unloading.
Generally, sugars move from sieve elements to the surrounding post-phloem tissues through
plasmodesmata (Lalonde et al., 2003). RFO catabolism in plants has received relatively little
attention. Figure 6 illustrates possible catabolic pathways of RFOs. RFOs are digested by α-
galactosidases (αGal; EC 3.2.1.22) to generate sucrose and galactose. Sucrose may be digested to
fructose and glucose by invertase or to fructose and UDP-Glucose by sucrose synthase. Fructose,
glucose and UDP-Glucose can then readily enter other metabolic pathways. For digestion of
galactose, ATP is used to convert galactose to Galactose-1-P by galactokinase (EC 2.7.1.6).
Galactose-1-P can be digested by two different pathways, one of which is the Lelior pathway. In
the Lelior pathway, which is used in many organisms, hexose-1-P uridylytransferase (EC
2.7.7.12) catalyzes Galactose-1-P to form Glucose-1-P with UDP transfer from UDP-Glucose to
Galactose-1-P. However, plants use another way to digest Galactose-1-P. Pyrophosphorylase
(EC 2.7.7.64) is used to form UDP-Galactose and PPi from Galactose-1-P and UTP. UDP-
Galactose is converted to UDP-Glucose, which readily enters metabolism, by UDP-4-Glucose
epimerase (EC 5.1.3.2) (Keller and Pharr, 1996).

6
1.2.3 Physiological Roles of RFOs
The occurrence of RFOs in plants is nearly ubiquitous and is implicated in carbon
transport. In over 500 species, belonging to almost 100 families, sucrose is found in phloem
exudates, and RFOs were in two-thirds of these. In some species tested, RFOs are the main
transport sugars and their synthesis was proposed to be as part of the polymer trap mechanism
for symplasmic phloem loading (Turgeon, 1996). RFOs were proposed to play a role in reducing
solute leakage during long-distance transport (Ayre et al., 2003).
Plants are frequently exposed to environmental stresses in both natural and agricultural
conditions. Stress tolerance is the plant’s fitness to cope with an unfavorable environment. RFOs
play important roles in tolerance to different stresses, including salt, drought, and cold stresses.
Raffinose in particular, and to a lesser extent stachyose, accumulate during seed development
and is thought to play roles in desiccation tolerance of seeds (Bailly et al., 2001). Galactinol
synthase in numerous species is stress-inducible and is proposed to play a key role in the
accumulation of galactinol and raffinose during abiotic stress, and galactinol and raffinose may
function as osmoprotectants in drought-stress tolerance of plants (Taji et al., 2002). Sucrose and
RFOs, particularly raffinose, functions as compatible solutes during drought stress in the leaves
of the resurrection plant Xerophvta viscose (Peters et al., 2007). The accumulation of raffinose
was associated with increased freezing tolerance of the leaves (Pennycooke et al., 2003).
Although ostensibly beneficial, raffinose is not essential for basic freezing tolerance for cold
acclimation of Arabidopsis thaliana (Zuther et al., 2004). Recently, RFOs have been suggested
to play a protective role in the natural frost tolerance of the evergreen labiate Ajuga reptans
(Peters et al., 2009). In addition, Galactinol and RFOs were found to protect plant cells from
oxidative stress and may scavenge hydroxyl radicals as novel intracellular antioxidants in plants

7
under several types of stress (Nishizawa et al., 2008). Galactinol has been suggested to be a
signaling component of the induced systemic resistance caused by pathogens (Kim et al., 2008).
RFOs have been found in different plant organs, such as leaves, stems, tubers, bulbs,
fruit, and seeds and may function as long- or short-term storage reserves. RFOs accumulate to
serve the dual purposes of carbon storage and stress tolerance in most plants (Kellar and Pharr,
1996). In seeds, RFOs are one of the most prominent soluble sugars. RFOs may be an essential
source of rapidly metabolizable carbon in early germination (Downie and Bewley, 2000).
1.3 Objectives
The main goal of this project for our lab is to manipulate the hydrostatic pressure
gradients that control phloem transport between source and sink tissues to favor biomass
distribution to organs that are harvested. Brian Ayre proposed that plant carbon partitioning can
be targeted to desired organs by altering hydrostatic pressure gradients between source leaves
and desired sinks. To test this hypothesis, metabolic engineering was used to generate RFOs in
the phloem of mature leaves of Arabidopsis thaliana to increase hydrostatic pressure in source
leaves. Simultaneously, in order to decrease hydrostatic pressure in sink tissues, metabolic
engineering will be employed to degrade RFOs in specific recipient tissues. By increasing the
hydrostatic pressure gradients between source leaves and target sinks, directed nutrient transport
to favor specific target organs may occur (Figure 7).
Three genes, GALACTINOL SYNTHASE, RAFFINOSE SYNTHASE and STACHYOSE
SYNTHASE, were expressed to make RFOs in the companion cells of minor veins. Companion-
cell-specific promoters were used to express the three genes in the companion cells.
GALACTINOL SYNTHASE (CmGAS1) from melon (Cucumis melo) and the RAFFINOSE
SYNTHASE (CsRFS) from cucumber (Cucumis sativus) were expressed from the CmGAS1

8
promoter, which confers gene expression to the minor veins (Haritatos et al., 2000; Ayre et al.,
2003). STACHYSOSE SYNTHASE (AmSTS1) from Alonsoa (Alonsoa meridionalis) was
expressed from the Mature Minor Vein Element1 (MMVE1) promoter, which was identified as
being specific to companion cells (McGarry et al., 2008). Previous students transformed
Arabidopsis plants with the three biosynthetic genes. Each had a different marker for selection of
transgenic plants.
My objectives in this work were to 1) select transgenic homozygous plants for the three
genes required for production of stachyose; 2) quantify RFOs with high performance anion
exchange chromatography with pulsed amperometric detection (HPAEC-PAD); 3) analyze
carbon distribution and mobilization; 4) analyze vegetative growth rate and transition to
reproductive growth; 5) test the impact of engineered RFOs on phloem-feeding aphids.
9
Figure 1. Overview of phloem anatomy and osmotically-generated-pressure flow
between source and sink tissues.
10
Figure 2. Apoplastic phloem loading mediated by sucrose-proton symporters.
Suc-H+ Symp is sucrose-proton symporters.
11
Figure 3. The polymer trap model for symplastic phloem loading. GolS is
galactinol synthase. RafS is raffinose synthase. StaS is stachyose synthase.

12
Figure 4. Chemical structure of RFOs.

13
Figure 5. Biosynthetic pathway of RFOs in plants.

14
Figure 6. Catabolic pathway of RFOs in plants.

15
Figure 7. Proposed metabolic engineering strategy in source and sinks to target phloem transport to specific tissues. Sucrose loading from the apoplast with Suc/H+ symporters is converted to RFO in companion cells of source leaves (middle green leaf). RFO are efficiently metabolized in engineered target sink tissues, reducing the solute concentration and promoting phloem transport (top: red fruit). Tissues not engineered for RFO degradation accumulate RFO, inhibiting phloem transport (bottom: gray root). This thesis composes a portion of these large objectives and tested the impact of engineered RFOs on phloem-feeding aphids.

16
CHAPTER 2
MATERIALS AND METHODS
2.1 Plasmid Construction
The pGPTV-Hyg-CmGAS1p-CmGAS1 construct to express CmGAS1, encoding
galactinol synthase, was previously described (Ayre et al.,2003) and consists of a 5 kb genomic
sequence from Cucumis melo subcloned in the EcoRI restriction endonuclease recognition site of
pCambia1301. Hygromycin phosphotransferase (hpt) was used as the selection marker (Figure
8A).
The plasmid pGPTV-Kan-CmGAS1p-CsRFS was constructed by a former researcher in
Brian Ayre’s laboratory to express Raffinose Synthase in the minor veins of transgenic
Arabidopsis. In brief, a phloem specific Raffinose Synthase (RFS; NCBI accession no.
AF073744) cDNA was generated from Cucumis sativum mRNA by RT-PCR, digested with
KpnI and SacI restriction enzymes and inserted into the same sites of pUC-GUT-CO (Ayre et al.,
2004), and then the CmGAS1 promoter – RFS cDNA cassette was inserted into pGPTV-Kan as a
SbfI – SacI cassette (Becker et al., 1992). Neomycin phosphotransferase (nptII) was used as the
selection marker (Figure 8B).
The plasmid pGPTV-bar-MMVE1p-AmSTS was similarly constructed by a prior
researcher to express Stachyose Synthase in the minor veins of transgenic plants in Ayre’s lab.
The sequence for Cucumis Stachyose Synthase (STS1) is not available. However, the sequence
for STS1 from Alonsoa meridionalis (NCBI Genbank accession no. AJ487030) is available.
Alonsoa meridionalis also loads from the symplasm and translocates stachyose predominantly.
STS1 cDNA was generated from mRNA by RT-PCR and then digested with restriction enzymes
and inserted into pGPTV-bar. The MMVE1 promoter element (McGarry et al., 2008) was used to
17
express AmSTS1 specifically in minor-veins of transgenic Arabidopsis and phosphinothricin
acetyl transferase (bar) resistance marker was used to facilitate selection (Figure 8C).
2.2 Plant Materials
Arabidopsis, which possesses endogenous RFO metabolism in seeds and during stress,
but not as a transport sugar, was chosen as a model for this research. Numerous lines of
transgenic plants potentially transformed with the three biosynthetic genes to produce stachyose
in the phloem were generated previously by Dr. Ayre and colleagues. Transformed Arabidopsis
seeds were selected on Murashige-Skoog (MS) medium (Murashige and Skoog, 1962) with 1%
Suc and appropriate antibiotics. To make 1000 ml of MS medium, 10 g of sucrose and 4.44 g
MS modified Basal Medium with Gamborg Vitamins (PhytoTechnology Laboratories, Shawnee
Mission, KS) were dissolved in 800 ml distilled H2O. The pH was adjusted to 5.8 by using 1 M
KOH and the final volume was adjusted to 1000 ml with distilled H2O. 2.8 g/L Gel-rite gellan
gum (Fisher Scientific, Fair Lawn, New Jersey) was added to solidify. The medium was
sterilized by autoclaving for 20 minutes at 15 psi on liquid cycle. The medium was cooled to
about 60 °C after autoclaving. 100 mg/L Kanamyicn (PhytoTechnology Laboratories), 10 mg/L
Glufosinate ammonium (PhytoTechnology Laboratories), and 40 mg/L Hygromycin B
(PhytoTechnology Laboratories) were used for selecting transformed Arabidopsis seedlings, and
200 mg/L Timentin (Ticarcillin Disodium Salt/Potassium Clavulanate mixture 15:1)
(PhytoTechnology Laboratories,) was used to suppress bacteria growth.
Approximately 50 Arabidopsis seeds for each line in a 2 mL microtube were surface-
sterilized with chlorine bleach (30 mL bleach and 1 mL concentrated HCl) for 6 hours in a
vacuum sealed jar (Martinez-Zapater and Salinas, 1998). The sterilized seeds were distributed
evenly on MS medium with 1% sucrose and selection. In order to identify transformants for

18
resistance to hygromycin, kanamycin and glufosinate ammonium, seeds were stratified for 2
days in the dark at 4°C and were then illuminated for 4-8 hours to stimulate germination. Seeds
were germinated in the darkness at room temperature for four days to promote hypocotyl
elongation, and scored for antibiotic resistance after two days growth with 14 / 10 light / dark
cycles (Harrison et al., 2006). Seedlings which resisted all three antibiotics were transferred to
soil and grown in a growth chamber under appropriate conditions for different experiments.
Seeds from mature plants were harvested manually and separated from the chaff by
passing through a sieve. Cleaned seeds were stored in microfuge tubes with small holes in the
lids in a sealed dessicator with desiccant for seven days for thorough drying, moved to -80 °C for
3 days to kill any insect eggs, returned to the dessicator for 1 day, and then placed in a sealed,
seed-storage chamber with desiccant for long term storage.
2.3 Plant Transformation and Selection
Plasmid vectors harboring appropriate DNA constructs were introduced to
Agrobacterium tumefaciens by electroporation (Sambrook et al., 2001). Agrobacterium
tumefaciens containing constructs were transformed into wild type Arabidopsis (Col-0) by using
the Floral Dip transformation procedure (Clough and Bent, 1998). This work was carried out by
previous students in Dr. Brian Ayre’s lab. In order to select transformants for all three genes,
seeds were germinated on MS medium with 1% sucrose containing hygromycin, kanamycin and
glufosinate ammonium. After 2 days cold treatment at 4°C, 4-8 hours light treatment and 4 days
dark treatment, seedlings which resisted all three antibiotics had green, open, expanded
cotyledons with long hypocotyls and were transferred to soil and grown under 12 hours light/12
hours dark cycle at 21°C. The lines with all seedlings resistant to all three antibiotics, and that
did not show segregation in subsequent generations, were considered homozygous

19
(CmGAS1/CmGAS1; CsRFS/CsRFS; AmSTS1/AmSTS1). The homozygous lines are GRS63 and
GRS47.
2.4 Sugar Analysis
GRS63 and GRS47 were grown for 21 days under 14 / 10 light / dark cycles (The light
intensity is 110-150 μmol photons m2s-1). The samples were collected at two different times:
8:00 am after 10 hours of dark and 4:00 pm after 8 hours of light. Sugar extraction was
performed on either fresh tissues or tissues frozen and ground in liquid N2 to establish which
method is superior. Leaves of plants were bisected and fresh weight of each half was established.
One half was immediately immersed in 1 mL of ice-cold MCW extraction solution (methanol:
chloroform: water, 12:5:3) containing 10 μM lactose as an internal standard and extracted for 15
minutes in a 50°C water bath (Srivastava et al., 2008). The other half was crushed in liquid N2 in
a 2 mL microtube with a glass rod, followed by adding 1 mL ice-cold MCW extraction solution
with 10 μM lactose, and extracted for 15 minutes in a 50°C water bath. The volume of MCW
extraction solution was at least five volumes per unit fresh weight for each extraction. Tissues
were extracted twice, and extracts combined. The residue of tissues after sugar extractions were
measured for starch levels. Water was added to the combined extract (three parts water per five
parts extract) to separate the aqueous and organic phases. After centrifugation, the aqueous phase
was collected and dried down to approximately 200 μL in a centrifugal concentrator. To collect
the neutral fraction containing sugars of interest, the concentrated extracts were passed through
ion exchange columns composed of, from bottom to top, 250 μL of AG1-X8 anion-exchange
resin (Bio-Rad, Hercules, CA; Formate Form), 150 μL of polyvinylpolypyrolidone (Sigma, St.
Louis, MO), and 250 μL of AG50-X8 cation-exchange resin (Bio-Rad, Hercules, CA; Hydrogen
Form) and the columns were washed with 1 mL H2O. Sugars were separated and quantified
20
using a CarboPac PA-20 column using high performance anion exchange chromatography with
pulsed amperometric detection (HPAEC-PAD) (Dionex, Sunnyvale CA). Six plants of each line
were used to establish variation in this experiment.
2.5 Starch Analysis
2.5.1 Starch Staining with Iodine and Microscopy
GRS63 and GRS47 were grown for 21 days under 14 / 10 light / dark cycles (The light
intensity is 110-150 μmol photons m2s-1). The samples were collected at two different times:
8:00 am after 10 hours of dark and at 4:00 pm after 8 hours of light. After 10 hours of dark, the
4th leaf from individual plants were excised and incubated in 70% ethanol at 37°C for 24 h to
clear chlorophyll. The tissues were rehydrated in a graded ethanol series until they were in water
(60% ethanol for 2 minutes, 30% ethanol for 2 minutes, and water for 2 minutes twice). The
tissues were immersed in 10% I-KI staining solution and staining proceeded for 30 minutes. The
tissues were washed twice with water for 5 minutes to remove excess stain. Stained leaves were
recorded with a Nikon SMZ1500 stereo microscope equipped with a Nikon Digital camera
DXM1200F (Melville, NY). For digital photography, exposure time and settings were equivalent
for all samples (exposure time was 1/25 sec.; magnification was 1.5X). After eight hours light,
the 5th leaf from the same plants was collected and the same procedures were used for starch
staining with iodine. These experiments were repeated twice and there were 9 replicates in the
first experiment and 6 replicates in the second experiment.
2.5.2 Starch Assay
Quantitative starch analysis was performed on the residual tissues after sugar extractions
with a starch assay kit according to the manufacturer’s instructions (Megazyme, Bray, Ireland;

21
myloglucosidase/α-amylase method). 1 mL of 80% ethanol was added to remove chloroform
from MCW treated leaves in 2 mL microtubes. After centrifugation, the supernatant was
discarded and 70 μL of 80% ethanol was added and tissues dispersed by vortexing. 1 mL of α-
amylase solution (prepared as described by the kit manufacturer) was added and the tubes were
incubated in a boiling water bath for 6 minutes. 50 μL of amyloglucosidase was added and the
tubes were incubated at 50°C for 30 minutes after mixing. After centrifuging at 13,000 rpm for
10 minutes, 1000 μL supernatant was transferred to a clean tube. 200 μL of supernatant was
transferred to 13х100 mm glass test tubes, 2000 μL of GOPOD Reagent (Glucose Determination
Reagent including GOPOD Reagent Buffer and GOPOD Reagent Enzymes) was added and
incubated at 50°C for 20 minutes. D-Glucose controls consisted of 0.1 mL of D-glucose standard
solution (1 mg/mL) and 2000 μL of GOPOD Reagent. Reagent Blank solutions consist of 0.1
mL of water and 2000 μL of GOPOD Reagent. The absorbance for each sample was read at 510
nm against the reagent blank.
2.6 EDTA Exudates Analysis
An EDTA-exudation method was used to collect phloem sap from cut leaves (King et al.,
1974). EDTA is used to enhance phloem exudation by chelating Ca2+ that is required for sieve-
tube plugging. GRS63 and GRS47 were grown for 30 days under the conditions described above.
After 7 hours light treatment, the 6th through11th leaves from individual plants were excised at
the stem and their fresh weights measured. Leaves were cut again under 10 mM EDTA and
arranged into a small chamber (Coulter Counter, Pittsburgh, U.S.A.) containing 2 ml of 10 mM
EDTA, such that the cut petioles were submerged. The chambers were capped to maintain near
100% humidity and minimize the amount of solution drawn into the leaves by transpiration and
xylem transport. Phloem exudates from the first twenty minutes were discarded because there

22
may be some contamination from the contents of cut cells. Subsequently, exudates from each of
two two-hour periods were collected. The neutral fraction of exudates was obtained and sugars
analyzed by HPAEC-PAD and described above. Twelve samples for each line were tested to
establish variation in this experiment.
2.7 Growth Rate Analysis
Seeds of the two independent transformed lines homozygous for each transgene, GRS63
and GRS47, were put out on soil and after two days cold treatment at 4 °C, were grown under 14
hours light/10 hours dark cycle at 21°C. Plants were well spaced with one plant in each cell of a
36-cell growth tray so as not to impact each other’s growth. The seeds from wild type
Arabidopsis plants were put out as growth controls and grown under same conditions. After 18
days germination, rosettes of both transgenic and wild type Arabidopsis plants were
photographed and the total rosette area was measured by using ImageJ software (Rasband,
2007). Twelve plants of each line were used to establish variation in this experiment.
2.8 Flowering Time Analysis
Seeds from wild type Arabidopsis plants and two independent transformed lines
homozygous for each transgene, GRS47 and GRS63, were put out on soil and after two days
cold treatment at 4°C, were grown under 14 hours light/10 hours dark cycle at 21°C. 36 plants
of each line were used to measure the flowering time with one plant in each cell of a 36-cell
growth tray. The position of the three flats and orientation of each flat were exchanged daily to
compensate for any potential microclimates in the growth chamber. Plants were monitored for
flowering and documented daily as the percentage of plants with a visible inflorescence. In
addition, the number of rosette leaves at flowering was recorded. Thirty six plants of each line
were used to establish variation in this experiment.

23
2.9 Aphid Feeding Experiments
2.9.1 No-choice Aphid Feeding Test for Fecundity
GRS63, GRS47 and wild type Arabidopsis were grown under standard conditions. Plants
were 30-days old when used. A “no-choice” experiment was used to test aphid fecundity on test
plants, and measured reproductive rates (Pegadaraju et al., 2005). 20 adult aphids were put on the
rosette of each plant from both wild type and transgenic lines GRS63 and GRS47. After two
days, the plants were harvested and the number of aphids residing on each plant was counted
(Figure 9A). 12 plants of each line were used to test variation in this experiment.
2.9.2 Choice Aphid Test
In “choice” experiments, aphids were placed equidistant between control and
experimental plants, and the distribution of aphids determined 24 hours later to establish if a
feeding preference existed (Pegadaraju et al., 2007). For choice aphid experiments, 20 adult
aphids were placed on the soil between WT and transgenic plants growing in the same 15 cm
diameter pot. The number of aphids on each plant was monitored after 24 hours (Figure 9B).
Nine plants of each line were used to test variation in this experiment.
2.9.3 Artificial Aphid Diet Test
An artificial aphid diet (Mittler and Dadd 1965) was used to test aphid fecundity and its
components are listed in Table 1. The concentration of sucrose in this diet is 500 mM. This diet
was mixed with 50 mM of additional sugar, including sucrose, glucose, fructose, galactinol,
raffinose or stachyose, to test if the exotic sugars affect aphid fecundity directly. Three adult
aphids were transferred with a fine paintbrush into a feeding chamber (a 3.5 cm Petridish;
Falcon, Primaria, NJ, U.S.A.). A layer of stretched parafilm (Parafilm “M”; American National

24
Can, Greenwich, CT, U.S.A.) was covered over the chamber to capture the three aphids. 500 μL
of artificial diet or diet with 50 mM test sugar was added on the first layer of parafilm and
another layer of stretched parafilm was placed on the first layer to spread diet and form a feeding
sachet from which the aphids could feed on the diet (Figure 9C) (Louis et al., 2010). Aphid
numbers including adults and nymphs were counted after four days later. Three replicates were
included for treatment.

25
Figure 8. Schematic diagram of A. The Galactinol Synthase construct and B. the
Raffinose Synthase construct and C. the Stachyose Synthase construct. (Not drawn to
scale).
B.
CmGAS1 Promoter npt II CsRFS
A.
hpt CmGAS1 CmGAS1 Promoter
C.
bar MMVE1 Promoter AmSTS1
26
A. B.
C.
Figure 9. Schematic diagram of A. No-choice aphid test. B. Choice aphid test. C. Artificial
aphid diet test.
27
Table I. Composition of the artificial aphid diet. pH adjusted to 7.0 using 1M KOH (Mittler TE and Dadd RH, 1965)
Component Type Component Name Amount (mg)A = Amino acid L - Alanine 100
A L - Arginine 270A L - Asparagine 550A L - Aspartic acid 140A L - Cysteine HCL 40A L - Glutamic acid 140A L - Glutamine 150A L - Glycine 80A L - Histidine 80A L - Isoleucine 80A L - Leucine 80A L - Lysine mono HCL 120A L - Methionine 40A L - Phenylalanine 40A L - Proline 80A L - Serine 80A L - Threonine 140A L - Tryptophan 80A L - Tyrosine 40A L - Valine 80
V = Vitamin L - Ascorbic acid 100V D - Biotin 0.1V D - Pantothenic acid 5V Choline chloride salt 50V Folic acid 0.5V Myo - Inositol 50V Nicotinic acid 10V L - Pyridoxine 2.5V Riboflavin 0.5V L - Thiamine HCL 2.5
O = Other Potass. Dihydrogen-orthophosphate 500O MgCl2 hexahydrate 200O Cupric-Sodium EDTA salt 0.4O Ferric-Sodium EDTA salt 1.5O MnCl2 tetrahydrate 0.4O Zinc EDTA 0.8O Sucrose 17.5gO Water sterilised 100mlO Cholesterol 2.5

28
CHAPTER 3
RESULTS
3.1 Identification of Homozygous (CmGAS1/CmGAS1; CsRFS/CsRFS; AmSTS1/AmSTS1) Plants
The plasmid pGPTV-Hyg-CmGAS1p-CmGAS1, pGPTV-Kan-CmGAS1p-CsRFS and
pGPTV-bar-MMVE1p-AmSTS were transformed into Agrobacterium tumefaciens competent
cells by electroporation (Sambrook et al., 2001). Wild type Arabidopsis thaliana Col-0 plants
were used for transformation using the floral dip method (Clough et al., 1998). Agrobacterium
cultures harboring the plasmid pGPTV-Hyg-CmGAS1p-CmGAS1 and the plasmid pGPTV-Kan-
CmGAS1p-CsRFS were grown separately and subsequently combined for the floral dip
procedure. Transgenic plants were selected on sterile MS media with kanamycin and
hygromycin, and were subsequently transformed by floral dip with the T-DNA of pGPTV-Bar-
MMVE1p-AmSTS. Seedlings transformed with all three constructs were selected on sterile MS
media with 1% sucrose and Hygromycin, Kanamycin and Glufosinate ammonium
(phosphinothricin) at appropriate concentrations. Seedlings which resisted all three antibiotics
were transferred to soil and seeds harvested for segregation analysis in the next generation.
Hygromycin was used as the selection marker for the Galactinol Synthase construct using
a selection technique of germinating the seedlings in darkness. Transformed seedlings grown in
medium containing hygromycin (40 mg/L) had elongated hypocotyls of approximately 0.8-1.0
cm (typical of dark grown seedlings), whereas non-resistant seedlings had short hypocotyls (0.2-
0.4 cm) (Figure 10, A and B). In Figure 10, A and B, seedlings designated ‘a’, ‘b’ and ‘c’ have
long hypocotyls (about 0.8-1.0 cm), indicating these three are hygromycin-resistant plants.
Seedlings ‘d’, ‘e’ and ‘f’ have short hypocotyls (0.2-0.5 cm) and are hygromycin susceptible.

29
Kanamycin was used as the selection marker for the Raffinose Synthase construct. Kanamycin-
resistant transformants have green, open, expanded cotyledons and kanamycin-sensitive
seedlings have yellow cotyledons. Seedlings from ‘b’ and ‘e’ in Figure 10, A and B show yellow
cotyledons, which means seedling ‘b’ and seedling ‘e’ are kanamycin-sensitive seedlings.
Finally, a glufosinate ammonium resistance marker was used to facilitate selection for the
Stachyose Synthase transformants. In the presence of 10 mg/L glufosinate ammonium, resistant
transformants have green, open, expanded cotyledons, whereas susceptible seedlings have pale
unexpanded cotyledons. In Figure 10, A and B, seedlings ‘c’ and ‘f’ show pale unexpanded
cotyledons, indicating these two are glufosinate ammonium susceptible. The seedling ‘a’ in
Figure 10, A and B shows long hypocotyls (about 1.0 cm) and green, open and expanded
cotyledons, indicating this seedling is transgenic with all three selectable marker genes.
Characteristics of different antibiotic-resistant seedlings are summarized in Table 2. All
offsprings from homozygous plants (CmGAS1/CmGAS1; CsRFS/CsRFS; AmSTS1/AmSTS1)
should resist all three antibiotics. Ultimately, transgenic homozygous lines GRS63 and GRS47
from T7 generation were selected for further analysis.
3.2 Carbohydrate Steady State Analysis in Mature Leaves
Wild type, GRS47 and GRS63 lines were analyzed for sugar content in leaves by high
performance anion exchange chromatography with pulsed amperometric detection (HPAEC-
PAD), which can detect picomole quantities of sugar. Sugars in leaves are removed in MCW
extracts (methanol: chloroform: water solvent in the ratio 12:5:3 [v/v]). This solvent extracts
most low molecular weight compounds including sugars, amino, nucleic and organic acids, and
lipids. Chloroform is an organic solvent for lipids and only able to solubilize relatively small
amounts of water and remain in a single phase in MCW solvents. Aqueous and organic phases
30
are separated after water is added to the extract (0.6 volumes). Sugars were analyzed after
extraction from fresh tissues and after freezing and grinding in liquid nitrogen. No significant
difference was observed between extractions from fresh and frozen tissues (Figure 11).
Representative chromatograms are shown in Figure 12. A Dionex CarboPac PA-20 column with
50 mM NaOH as HPAEC eluent was used and under these conditions, Glc and Gal co-elute
(Figure 12). Glc and Gal can be readily separated by using a different eluent or by using a
CarboPac MA-1 column. Standards containing sugars of known concentration were run with the
samples (Figure 12A). Prominent peaks for galactinol (1.4 minutes), raffinose (10.7 minutes) and
stachyose (12.0 minutes) are present in extracts from GRS47 and GRS63, but not in WT (Figure
12B, C and D). In Figure 13, sugars are expressed as pmol/mg fresh weight and it is apparent
that transgenic homozygous lines GRS63 and GRS47 accumulate substantial levels of galactinol,
raffinose and stachyose in leaf tissues (more than 50% of total soluble sugar relative to wild type
plants). It is also evident that this accumulation is not at the expense of Glc, Fru, and Suc, but in
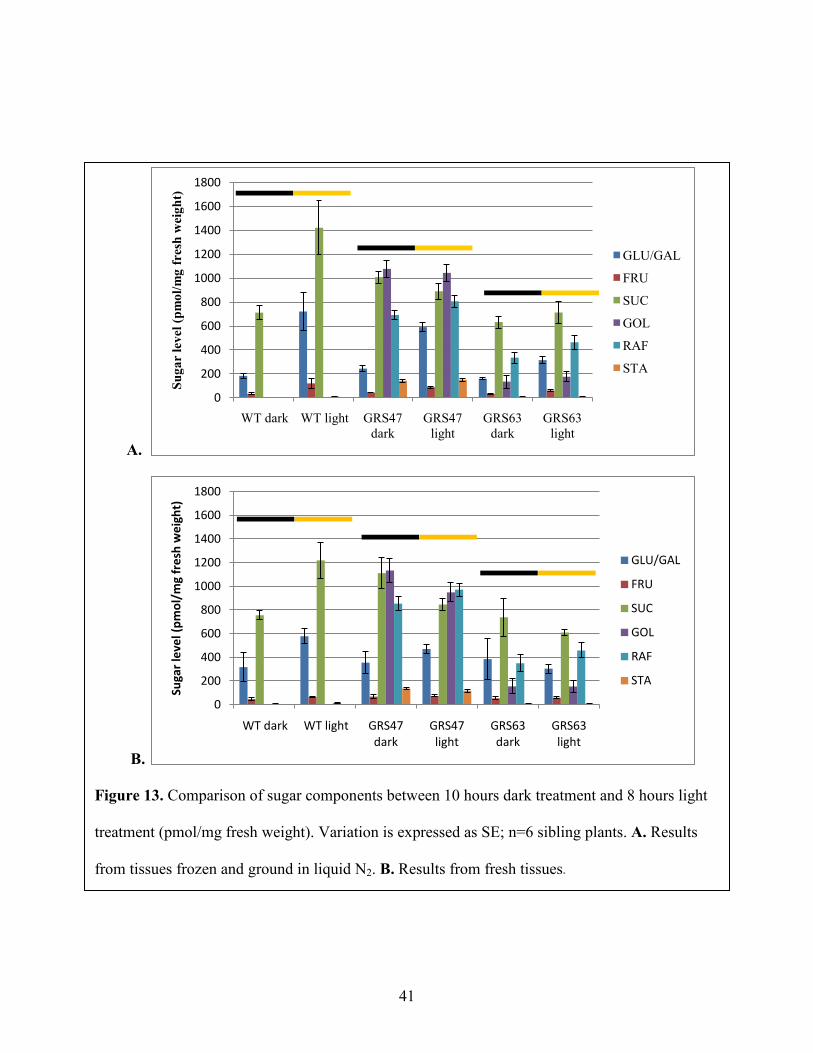
addition to them. To further analyze carbon metabolism, tissues from wild type and transgenic
plants were collected at two different times: after 10 hours of dark treatment and 8 hours of light
treatment. Figure 14 shows comparison of sugar components at these two times among WT,
GRS47 and GRS63. For wild type plants, Suc, Glc and Fru were increased at least two fold after
8 hours of photosynthesis. However, for transgenic GRS47 and GRS63 lines, Suc, Gol, Raf and
Sta levels remained nearly constant after 8 hours photosynthesis and Glc and Fru increased about
two-fold after 8 hours of light treatment. Starch analysis by qualitative starch staining with
iodine and a quantitative starch assay was also conducted to investigate starch levels between
wild type and transgenic plants. Iodine staining showed that there was no difference in starch
accumulation between wild type and transgenic plants at two different times: after 10 hours of

31
dark and 8 hours of light (Figure 15A). In addition, there was more starch accumulation in the
leaves after 8 hours of light compared to 10 hours of dark treatment (Figure 15 compare A+B).
Quantitative analysis of starch using an enzymatic procedure confirmed the qualitative starch
staining experiments: there was no significant difference in starch levels between wild type and
transgenic plants after 10 hours of darkness and 8 hours of photosynthesis (P> 0.1) (Figure 15B).
As expected, starch reserves were nearly depleted after 10 hours of darkness, and there was
substantial accumulation after 8 hours of photosynthesis (Figure 15A+B).
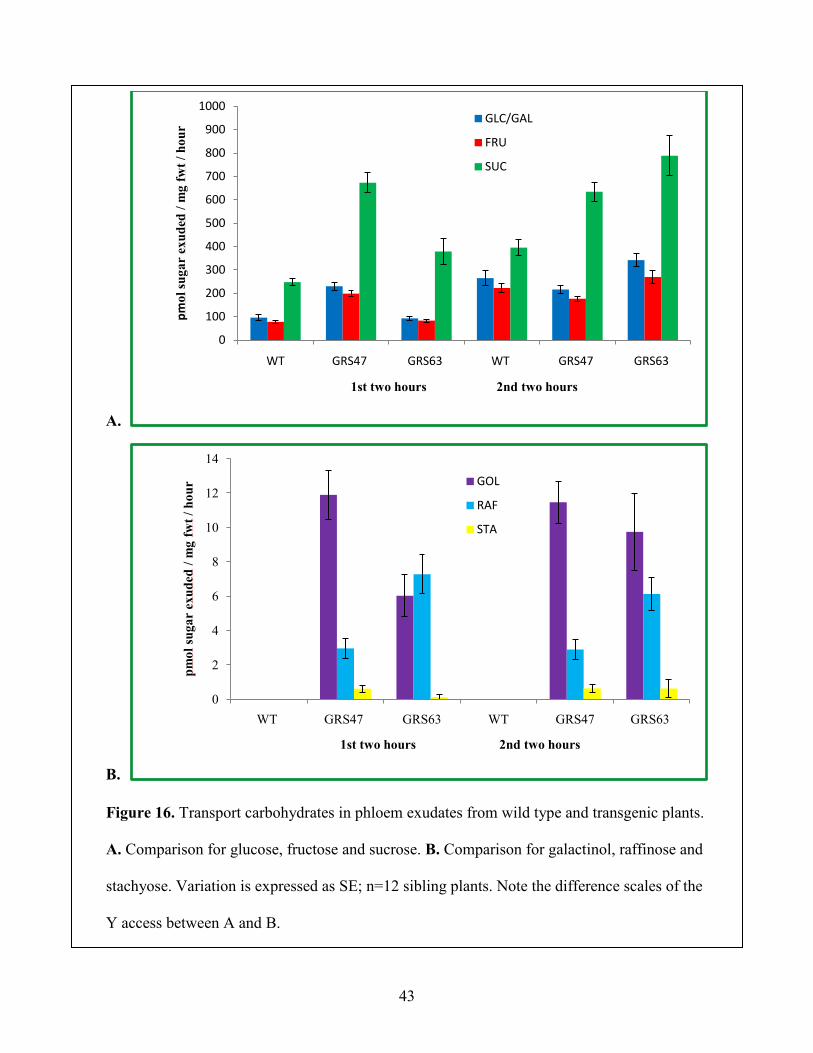
3.3 Analysis of Soluble Sugars in Phloem Exudates
In order to investigate RFOs transport efficiency, phloem exudates from cut leaves were
collected and analyzed. Exudates were collected for two, two-hour intervals and analyzed by
HPAEC-PAD (Figure 16). Carbohydrates in exudates from wild type and transgenic plants were
compared as exudation rate (pmol/mg fwt/hour). Suc is the major transport sugar in both wild
type and transgenic Arabidopsis plants (Figure 16A). RFOs were identified in phloem exudates
from excised leaves of transgenic plants, whereas levels were negligible in exudates from wild
type leaves (Figure 16B). Therefore, RFOs are phloem mobile in transgenic Arabidopsis plants.
In addition, total rates of Glc, Fru and Suc exudates from transgenic plants are greater than that
of wild type plants, especially for Suc which is present in exudates of GRS47 and GRS63 at
nearly twice the level of exduates from wild type plants. In order to test if RFOs are degraded to
Suc in phloem, Gal in phloem exudates was separated from Glc by using 10 mM NaOH eluent
instead of 50 mM eluent. Table 3 shows there is no difference for Gal in phloem exudates
between wild type and transgenic lines, limiting the possibility of degradation of RFOs in
phloem. It is possible that transgenic plants producing RFOs transport more sugars through the

32
phloem than wild type plants because production of RFOs in source tissue increases the
hydrostatic pressure.
3.4 Growth Rate Analysis
The total rosette area of the two independent homozygous lines GRS63 and GRS47 and
wild type plants was measured using ImageJ software (Rasband, 2007). Transgenic Arabidopsis
plants producing RFOs did not show significant differences in vegetative growth (Figure 17).
3.5 Flowering Time Analysis
In addition to growth rate analysis, flowering time was monitored to analyze transition to
reproductive growth between wild type and transgenic plants. Transgenic lines, GRS47 and
GRS63, were observed to flower earlier than wild type plants (Figure 18). Under long-day
conditions, 50% of 36 wild type plants started to grow inflorescence from rosettes 23 days after
germination. In contrast, under identical conditions transgenic GRS47 and GRS63 lines started to
grow inflorescence from rosettes 21 days after germination (Figure 18A): this difference is
significant (T-test P<0.01, n=36). Furthermore, the number of rosette leaves produced at
flowering in transgenic GRS47 and GRS63 lines is less than wild type plants and shows
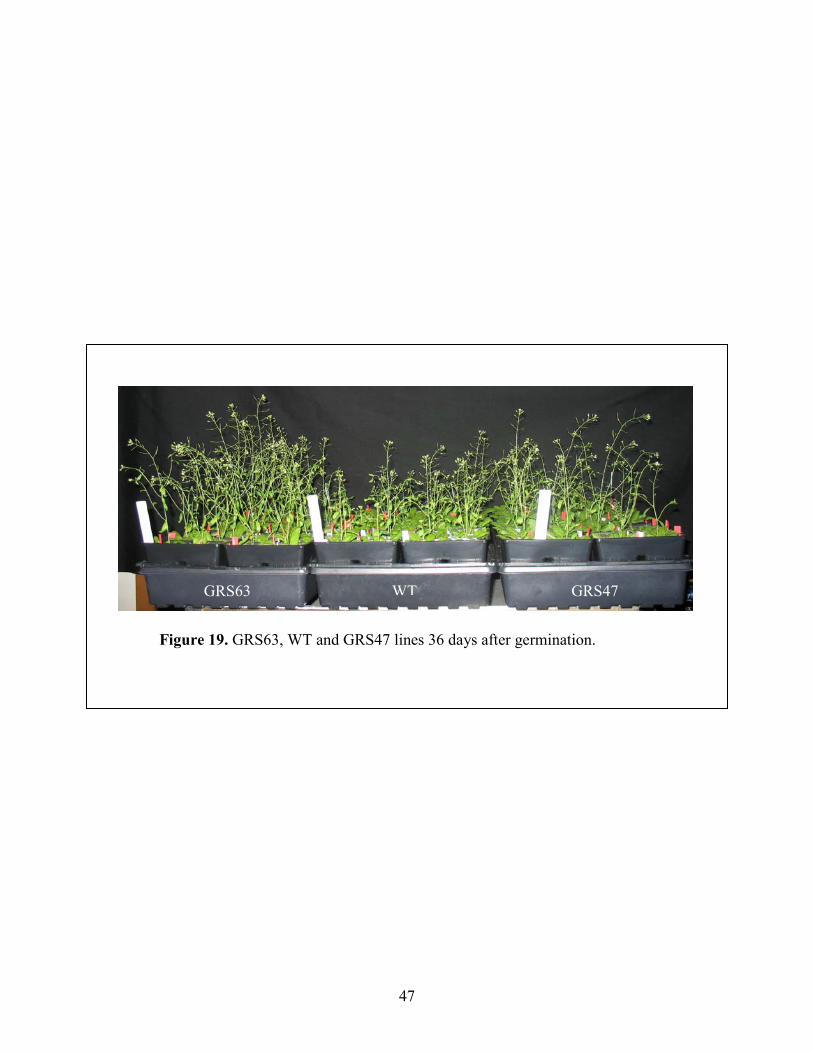
significant difference (P< 0.01, n=36) (Figure 18B). GRS63 and GRS47 lines 36 days after
germination had longer primary inflorescence stems than WT because of earlier flowering
(Figure 19).
3.6 Aphid Experiments
Recently, RFOs were shown to play an important role in stress tolerance, including
drought-stress tolerance, cold-stress tolerance and oxidative-stress tolerance (Bailly et al., 2001;
Taji et al., 2002; Peters et al., 2007; Nishizawa et al., 2008). Galactinol has been suggested to be

33
a signaling component of the induced systemic resistance caused by pathogens (Kim et al.,
2008). In order to test whether the RFOs also impact resistance against aphid damage, “no-
choice” aphid experiments and “choice” aphid experiments were performed by using wild type
Arabidopsis and transgenic Arabidopsis plants producing RFOs. In order to determine if
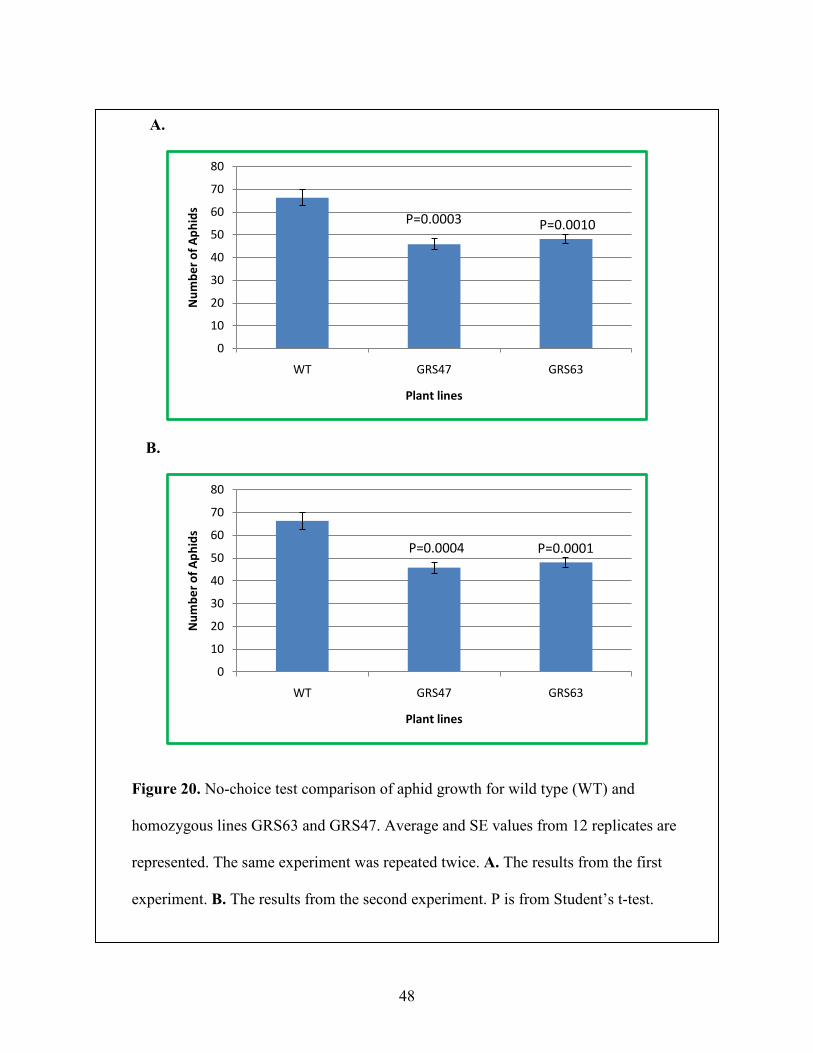
transgenic plants producing RFOs can influence aphid growth, we compared aphid growth on
wild type and transgenic plants in “no-choice” aphid bioassays. 20 adult aphids were put on each
wild type and transgenic plant (n = 12). After 48 hours, the plants were harvested and the number
of aphids residing on each plant was counted. Aphids on plants producing RFOs had a lower
reproduction rate than WT (P<0.05) (Figure 20).
To investigate further the role of RFOs in aphid feeding, choice aphid experiments were
also performed. Adult aphids were given the choice of feeding on WT or transgenic plants by
releasing 20 aphids equidistant from WT and transgenic plants grown in the same pot. The
number of aphids that had settled on each plant was determined after 8 h and 24 h. The results
presented in Figure 21 A and B show that aphids have a significant preference for WT plants
(P<0.001) over RFO producing plants after 24 h aphid release. However, there is no significant
preference after only 8 h aphid release (Figure 21C). This indicates that aphids did not show
preference until they were feeding on different plants (i.e., there appears to be no difference in
the initial attraction to either plant). In addition, as a control for the choice aphid bioassays,
aphids were given a choice between two plants of the same kind (i.e., WT#1 and WT#2 or
GRS63#1 and GRS63#2) in the same pot, and no feeding preference was observed (P > 0.2)
(Figure 22). To summarize, the results from no-choice aphid experiments and choice aphid
experiments indicate that RFO-producing plants negatively impact aphid feeding and fecundity.

34
To test if this resistance to aphid feeding is a direct or indirect effect of the exotic sugars,
aphid fecundity on artificial media with and without RFOs was performed. The artificial diet
used consisted of amino-acids, mineral salts, vitamins and 500 mM sucrose (Table I). To this
basic diet, 50 mM of one of sucrose, fructose, glucose, galactinol, raffinose or stachyose was
added. After 4 days, no difference in aphid populations were observed among treatments (P> 0.1,
n=3) (Figure 23). These results indicate that the resistance to aphid feeding is an indirect effect
of the exotic sugars. The synthesis of RFOs may contribute other defense responses, such as
secondary metabolism, which provides the resistance to aphid feeding.

35
A. B.
Figure 10. Selection of seedlings based on antibiotic/herbicide resistance. A. Phenotype
of seedlings based on antibiotic resistance. B. Phenotype of segregating population of
seedlings based on their antibiotic resistance. “a” seedling is transformed with all three
selectable markers; “b” seedling is resistant to phosphinothricin and hygromycin, but not
to kanamycin; “c” seedling is resistant to hygromycin only; “d” seedling is resistant to
both kanamycin and glufosinate ammonium, but is susceptible to hygromycin; “e”
seedling is resistant to only phosphosphinothricin, and “f” seedling is susceptible to all
three antibiotic.

36
Table II. Summary for different antibiotic-resistant seedlings
Hygromycin Kanamycin Phosphosphinothricin
Resistant long hypocotyls green, open, expanded cotyledon green, open, expanded cotyledons
Susceptible short hypocotyls yellow cotyledons pale unexpanded
a seedling Resistant Resistant Resistant
b seedling Resistant Susceptible Resistant
c seedling Resistant Susceptible Susceptible
d seedling Susceptible Resistant Resistant
e seedling Susceptible Susceptible Resistant
f seedling Susceptible Susceptible Susceptible

37
Figure 11. Comparison of sugar concentrations extracted from fresh tissue (labeled as plant line
names) and from tissue frozen and ground in liquid nitrogen (labeled as plant line names with N2
in parentheses) (pmol/mg fresh weight). Variation is expressed as SE; n=6 sibling plants.
0.00
200.00
400.00
600.00
800.00
1000.00
1200.00
1400.00
Suga
r lev
el (p
mol
/ m
g fr
esh
wei
ght)
GLU/GAL
FRU
SUC
GOL
RAF
STA

38
A.
B.
0.0 2.0 4.0 6.0 8.0 10.0 12.0 15.0-50
100
200
300
400 09-03-23 CAO sugar for leaves age again #8 IntAmp_1nC
min
GOL
TRE
GLU/GAL
FRU SUC
LAC
RAF STA
0.0 2.0 4.0 6.0 8.0 10.0 12.0 15.0-5.0
10.0
20.0
30.0
40.0
55.0 09-03-23 CAO sugar for leaves age again #17 IntAmp_1nC
min
GOL
TRE
GLU/GAL
FRU
SUC
LAC
RAF
Figure 12. Representative chromatograms of sugar extracts from high performance anion
exchange chromatography with pulsed amperometric detection (HPAEC-PAD). X axis,
elution time; Y axis, nano coulombs. A. Sugar standard. B. Wild type Arabidopsis plants.
C. Transgenic line GRS47. D. Transgenic line GRS63. A Dionex CarboPac PA20
analytical column was used and the eluent was 50 mM NaOH.

39
C.
D.
0.0 2.0 4.0 6.0 8.0 10.0 12.0 15.0-20
25
50
75
100
140 09-03-23 CAO sugar for leaves age again #18 IntAmp_1nC
min
GOL
TRE
GLU/GAL
FRU
SUC
LAC
RAF
STA
0.0 2.0 4.0 6.0 8.0 10.0 12.0 15.0-5.0
10.0
20.0
30.0
40.0
55.0 09-03-23 CAO sugar for leaves age again #20 IntAmp_1nC
min
GOL
TRE
GLU/GAL
FRU
SUC
LAC
RAF
STA
40
A.
B.
-100
0
100
200
300
400
500
600
700
800
WT 47 63
Suga
r lev
el (p
mol
/ mg
fres
h w
eigh
t)
GLC/GAL
FRU
SUC
GOL
RAF
STA
GRS
0
200
400
600
800
1000
1200
1400
WT GRS47 GRS63
Suga
r lev
el (p
mol
/ mg
fres
h w
eigh
t)
GLU/GAL
FRU
SUC
GOL
RAF
STA
Figure 13. Sugar analysis in leaves of WT and transgenic Arabidopsis plants (pmol/mg fresh
weight). Results from two experiments are represented. A. The results from experiment on
05/17/2008. Variation is expressed as SE n=3 sibling plants. B. The results from experiment on
11/14/2009. Variations is expressed as SE n=6 sibling plants.
GRS
41
A.
B.
Figure 13. Comparison of sugar components between 10 hours dark treatment and 8 hours light
treatment (pmol/mg fresh weight). Variation is expressed as SE; n=6 sibling plants. A. Results
from tissues frozen and ground in liquid N2. B. Results from fresh tissues.
0
200
400
600
800
1000
1200
1400
1600
1800
WT dark WT light GRS47 dark
GRS47 light
GRS63 dark
GRS63 light
Suga
r le
vel (
pmol
/mg
fres
h w
eigh
t)
GLU/GAL
FRU
SUC
GOL
RAF
STA
0
200
400
600
800
1000
1200
1400
1600
1800
WT dark WT light GRS47 dark
GRS47 light
GRS63 dark
GRS63 light
Suga
r le
vel (
pmol
/mg
fres
h w
eigh
t)
GLU/GAL
FRU
SUC
GOL
RAF
STA

42
WT GRS63GRS47 WT GRS47 GRS63
0
10
20
30
40
50
60
70
WT GRS47 GRS63 WT GRS47 GRS63
Glc
equ
ival
ents
(nm
ol/
mg
fres
h w
eigh
t)
Plant line
10 hours dark treatment 8 hours light treatment
Figure 15. Starch staining and starch assay in wild type (WT) and transgenic plants
(GRS63 and GRS47) after 10 hours of dark treatment and 8 hours of light treatment. A.
Pictures from starch staining experiment. B. Chart from starch assay. Exposure time
and settings were equivalent for all samples.
A.
B.
43
A.
B.
0
100
200
300
400
500
600
700
800
900
1000
WT GRS47 GRS63 WT GRS47 GRS63
pmol
suga
r ex
uded
/ mg
fwt/
hou
r
1st two hours 2nd two hours
GLC/GAL
FRU
SUC
0
2
4
6
8
10
12
14
WT GRS47 GRS63 WT GRS47 GRS63
pmol
suga
r ex
uded
/ mg
fwt/
hou
r
1st two hours 2nd two hours
GOL
RAF
STA
Figure 16. Transport carbohydrates in phloem exudates from wild type and transgenic plants.
A. Comparison for glucose, fructose and sucrose. B. Comparison for galactinol, raffinose and
stachyose. Variation is expressed as SE; n=12 sibling plants. Note the difference scales of the
Y access between A and B.

44
Table III. Galactose in phloem exudates from wild type and transgenic plants with exudation rate
(pmoles sugar exuded / leaf mg fwt / hour) by using 10 mM or 50 mM NaOH eluent. Variation is
expressed as SE; n = 12 sibling plants
1st 2 hours 2nd 2 hours
WT GRS47 GRS63 WT GRS47 GRS63
Gal (10 mM) 2.1±0.6 2.7±1.0 2.0±1.0 1.4±0.6 3.0±0.7 4.6±0.8 Glc (10 mM) 130.1±10.2 206.9±24.9 68.8±18.0 194.5±31.7 196.8±20.6 282.2±27.2
Glc/Gal (10 mM) 132.2±10.8 209.6±25.8 70.8±19.0 195.9±32.3 199.7±21.3 286.9±28.0 Glc/Gal (50 mM) 96.2±11.5 230.0±17.2 92.8±9.1 264.8±30.8 216.4±17.6 341.9±28.2

45
A.
B.
0
50
100
150
200
250
300
350
400
WT GRS47 GRS63
Ros
ette
Are
a (m
m2 )
Figure 17. Rosette growth analysis. A. Qualitative analysis (Phenotypic comparison
between transgenic and wild type plants); Scale bar = 1 cm. B. Quantitative analysis and
comparison of total rosette area of wild type and transgenic plants. Average and SE
values from 12 replicates are represented.

46
A.
B.
Figure 18. Flowering time analysis. A. Percentage of plants flowering relative to days post
germination. B. Number of rosette leaves at the time of flowering. Average and SE values from
36 replicates are represented. The same experiment was repeated twice. P is from Student’s t-
test.
0%
20%
40%
60%
80%
100%
120%
17 18 19 20 21 22 23 24 25 26 27
% o
f pla
nts
flow
erin
g
Days after germination
WT
GRS47
GRS63
P<0.001
0
2
4
6
8
10
12
14
16
18
WT GRS47 GRS63
Num
ber o
f ros
ette
leav
es
P=0.001
P=0.0009 P<0.0001
47
Figure 19. GRS63, WT and GRS47 lines 36 days after germination.
GRS63 WT GRS47
48
A.
B.
0
10
20
30
40
50
60
70
80
WT GRS47 GRS63
Num
ber o
f Aph
ids
Plant lines
P=0.0003 P=0.0010
0
10
20
30
40
50
60
70
80
WT GRS47 GRS63
Num
ber o
f Aph
ids
Plant lines
P=0.0001
Figure 20. No-choice test comparison of aphid growth for wild type (WT) and
homozygous lines GRS63 and GRS47. Average and SE values from 12 replicates are
represented. The same experiment was repeated twice. A. The results from the first
experiment. B. The results from the second experiment. P is from Student’s t-test.
P=0.0004

49
A.
B.
Figure 21. Choice test comparison of aphid preference for wild type (WT) and homozygous
lines GRS63 and GRS47. A. The results after 24 hours aphid release from first experiment. B.
The results after 24 hours aphid release from second experiment. C. The results after 8 hours
aphid release from second experiments. Average and SE values from 9 replicates are
represented. P is from Student’s t-test.
0
2
4
6
8
10
12
14
16
WT GRS63 WT GRS47 WT WT GRS63 GRS63
Num
ber o
f Aph
ids
Plant lines
P=0.0017 P<0.0001
P=0.2066 P=0.3498
0
2
4
6
8
10
12
14
16
WT GRS63 WT GRS47 WT WT GRS63 GRS63
Num
ber o
f Aph
ids
Plant lines
P<0.0001P<0.0001
P=0.85 P=0.69

50
C.
0
2
4
6
8
10
12
WT GRS63 WT GRS47 WT WT GRS63 GRS63
Num
ber o
f Aph
ids
Plant lines
P=0.62P=0.15
P=0.55 P=0.88

51
A.
B.
Figure 22. Artificial aphid diet test. Average and SE values from 3 replicates are represented.
Experiment was conducted twice with similar results each time. A. Results from first
experiment. B. Results from second experiment. P is from Student’s t-test.
0
5
10
15
20
25
30
35
Control Suc Fru Glc Gol Raf Sta
Aph
id #
P=0.62P=0.46 P=0.26
P=0.84P=0.63
0
5
10
15
20
25
30
Control Suc Fru Glc Gol Raf Sta
Aph
id #
P=0.63
P=0.60
P=0.90 P=0.55 P=0.93 P=0.51 P=0.63

52
CHAPTER 4
DISCUSSION
4.1 The Effect of RFOs Synthesis in Transgenic Arabidopsis
One of the purposes of this study was to generate novel sugars specifically in the minor
veins of source leaves and analyze carbon catabolism. Introducing genes encoding GolS, RafS,
and StaS driven by phloem-specific promoters had a dramatic impact on the levels of RFOs.
Sugars in two lines are expressed as pmol/mg fwt in Figure 13 and are compared with wild type
Arabidopsis. It is apparent that RFOs accumulated to as much as 50% of the soluble
carbohydrate without a compensating decreasing in Suc, Glc, or Fru. In these studies, suc
produced in mesophyll cells through photosynthesis is used to produce RFOs in the phloem.
However, the levels of RFOs observed suggest they are not confined to the SE-CCC since the
phloem constitutes only a minor portion of the leaf. RFOs are likely distributed throughout the
leaf and stored in vacuoles or accumulated in the apoplast. Coleus blumei is an archetype for
RFOs translocation (Turgeon et al., 1990). As a positive control in this study, Coleus was
detected to produce about 1835 pmol/mg fwt Glc/Gal, 802 pmol/mg fwt Fru, 1044 pmol/mg fwt
Suc, 195 pmol/mg fwt Gol, 988 pmol/mg fwt Raf and 250 pmol/mg fwt Sta in green leaves (data
not shown). In previous study, Haritatos et al detected radiolabel distribution in source leaves of
Coleus after exposure to 14CO2 and radiolabel was found in Suc (100), Sta (118), Raf (37) and
Gol (40) (Haritatos et al., 2000).
Plants generally do not store carbohydrate in the form of soluble sugars, but rather as
starch, and starch levels can fluctuate significantly as levels of soluble sugar remain relatively
constant. In response to salinity stress, coleus has been shown to build temporary carbon reserves

53
as the synthesis of high-degree of polymerization RFOs to replace the normal starch storage
reserves, which are greatly reduced during the initial phases of salinity stress (Gilbert et al.,
1997). Comparing starch levels between WT and transgenic lines revealed no significant
difference either dawn or dusk (Figure 15). The production of 50% the soluble carbohydrate in
transgenic plants was not from degradation of starch in source leaves.
Another purpose of this study was to analyze the impact of increasing RFOs on plant
vegetative growth and reproductive growth. How do plants respond to increasing levels of novel
sugars, mainly RFOs? In order to answer this question, growth rates were analyzed. From the
results of rosette area measurements, homozygous lines GRS63 and GRS47 did not show
alterations in rosette area at eighteen days post germination (Figure 17). This result shows that
RFOs synthesis does not affect vegetative growth rate. However, GRS47 and GRS63 lines
flowered earlier than wild type (Figure 18 and Figure 19). It is possible that increasing export of
sugars in transgenic plants caused earlier flowering, since it is well known that elevated sugar-
levels either endogenous to the plant or add exogenously can accelerate the transition to
flowering (Corbesier et al., 1998). Sugars are important in the accomplishment of sexual
reproduction in the grapevine because they are the main source of energy and also signal
molecules involved in the regulation of reproductive development (Lebon et al., 2008). In
addition, StSUT4-RNAi (sucrose transporter from potato) led to early flowering at least 6 days
before wild-type flowering and had significantly fewer leaves at flowering time than wild-type
plants because Suc export from phloem exudates in StSUT4-RNAi plants was twice as much as
in wild type plants at the end of the light period (Chincinska et al., 2008). StSUT4 has been
shown to express prominently in sink tissues and play an important role in flowering by
interacting with StSUT1 to regulate carbon availability. StSUT4 was an inhibitor of StSUT1

54
highly expressed in source leaves, the most important Suc transporter for Suc efflux from mature
leaves. Suc efflux from leaves of StSUT4-RNAi plants was increased by the missing StSUT4-
mediated StSUT1 inhibition.
4.2 Hexoses Transport in Transgenic Arabidopsis
EDTA exudation was used to assess sugar transport out of leaves. The HPAEC-PAD
system was applied to quantify which sugars are being transported as a result of metabolic
engineering. Sugars in EDTA exudations show Suc, Glc and Fru, with Suc predominating (Table
IV). Glc and Fru were present at almost equal concentration (Table IV). It has previously been
concluded that transport sugars in the phloem are non-reducing sugars, like Suc, alcohol sugars
(sorbitol, mannitol) and RFO, because reducing sugars are too reactive. The presence of Glc and
Fru in phloem exudates, although commonly observed, was thought to be due to Suc degradation
(Corbesier et al., 1998). More recently, however, hexose was proposed to be legitimate phloem
transport sugars (van Bel et al., 2008). van Bel and colleagues measured sugars from EDTA
phloem exudates from a large number of plant families, and found that the Ranunculaceae and
Papaveraceae translocated more than 80% of carbohydrates in the form of hexoses. They
proposed that hexose translocation is a normal mode of carbohydrate transfer by phloem in these
lineages because the rate of Suc cleavage is too low to explain the large proportions of hexoses.
By contrast, Asteraceae and Fabaceae, two families used as controls, showed low hexose:
sucrose ratios in the exudates with high sucrose concentrations in phloem sap. For example,
Dahlia hybrid from Asteraceae family has been shown that the hexose: sucrose ratio in exudates
is 0.13, which means 11.5% hexose and 88.5% sucrose in phloem. For another example,
Galinsoga parviflora also from Asteraceae family had 0.71 as hexose: sucrose ratio in exudates,
which means 41.5% hexose and 58.5% sucrose in phloem exudates. The authors suggested that

55
higher hexose: sucrose ratios in exudates compared to leaf extracts would lend credibility to the
view that hexoses act as a prominent phloem translocate. Comparing Table V and Table VI, it is
obvious that hexoses are transport sugars because of higher hexoses: sucrose ratios in exudates
than in leaves. van Bel and colleagues did not study Arabidopsis thaliana. However, Haritatos
and colleagues reported most of the translocated sugar in Arabidopsis thaliana is sucrose without
mentioning hexose translocation (Haritatos et al., 2000). Hexose translocation in Arabidopsis
thaliana needs further analysis in the future.
4.3 Galactinol Transport in Transgenic Arabidopsis
Wild type Arabidopsis normally transports sucrose, but not galactinol nor RFOs.
However, an endogenous RFOs metabolism exists in Arabidopsis and is often induced during
stress. During the biosynthesis of RFOs, galactinol serves as the donor of the galactosyl moiety.
At 3 hours after oxidative stress by treatment with 50 µM methylviologen (an enhancer of the
production of O2-), the levels of galactinol and raffinose in leaves of Arabidopsis were 32.2 ± 3.6
and 44.5 ± 9.8 nmol/ g fresh weight, respectively, and 130.7 ± 10.5 and 177.2 ± 46.5 nmol/ g
fresh weight after 6 hours treatment, respectively, whereas galactinol and raffinose were hardly
detectable in the untreated plants (Nishizawa et al., 2008). Therefore, galactinol is found to
accumulate to substantial amounts in leaves of Arabidopsis in response to oxidative stress and
gradually converted to RFOs. From Figure13B, 1078 pmol/mg fwt of galactinol for GRS47 and
136 pmol/mg fwt for GRS63 were accumulated in leaf tissues. Despite 33.6% of total sugar
being galactinol for GRS47 and 10.4% of total sugar being galactinol for GRS63 (Table V), the
relative amount of galactinol in phloem exudates from excised leaves of transgenic plants was
negligible: 1.1% for GRS47 and 0.7% for GRS63 (Table VI). A similar result was also reported
by Ayre et al (2003). Tobacco plants with companion cell specific expression of galactinol

56
synthase were shown to accumulate galactinol in the leaf, but only limited levels of galactinol
were transported in phloem (Ayre et al., 2003). In a subsequent study, Hannah et al produced
raffinose in potato companion cells by using either the rolC promoter or the CaMV 35S
promoter and found that galactinol accumulated to similar high levels in the leaves from both
rolC: GS and 35S: GS plants due to the majority of GS being expressed in the companion cell,
with less translocation of galactinol (about 1%) into phloem (Hannah et al., 2006). In this paper,
the rolC promoter was used to drive direct companion cell specific expression for Galactinol
Synthase (GS) from C. sativus to produce transgenic line “rolC: GS”, while 35S promoter was
used as control for constitutive non-specific overexpression to produce “35S: GS”. Similarly,
coleus, which synthesizes and translocates RFOs naturally, also produces substantial galactinol
in leaves, which cannot be detected in phloem exudates (Gilbert et al., 1997).
4.4 RFOs Transport in Transgenic Arabidopsis
High levels of RFOs (about 50% of total soluble sugars) accumulated in leaf tissues in
transgenic Arabidopsis (Figure13). This accumulation is not at the expense of Glc, Fru, and Suc,
but in addition to them. In Figure 16B, RFOs were identified in phloem exudates from leaves of
transgenic plants, whereas levels of RFOs were negligible in exudates from wild type leaves.
Therefore, RFOs are phloem mobile in transgenic Arabidopsis plants. This observation was also
reported in previous papers. Labeled sucrose, raffinose, and stachyose were transported from
green to nonchlorophyllous regions of detached Coleus blumei leaves after exposure to 14CO2
(Turgeon et al., 1990). In addition, labeled stachyose, sucrose and raffinose were detected in
phloem exudates after labeling treatment in leaves of Coleus blumei with 14CO2 (Gilbert et al.,
1997). Transgenic potato, which produced raffinose in potato companion cells by using the rolC
promoter, had significant amounts of raffinose in phloem exudates (Hannah et al., 2006). In this

57
paper, the rolC promoter was used to drive direct companion cell specific expression for
Galactinol Synthase (GS) from C. sativus to produce transgenic line “rolC: GS”, while 35S
promoter was used as control for constitutive non-specific overexpression to produce “35S: GS”.
rolC: GS 25 and 31, and 35S: GS 41expressing Galactinol Synthase, were selected to
retransform with Raffinose Synthase from C. sativus by using the same promoter (rolC promoter
or control promoter 35S) to produce “rolC: GS/RS” and “35S: GS/RS” lines. Raffinose in “rolC:
GS/RS” line accumulated to only 20-30% of that in “35S: GS/RS” lines presumably because the
35S promoter expresses in most plant organs and not only in company cells. Raffinose was
shown to translocate from source tissues to sink tissues through phloem by using grafting
experiments. Higher raffinose in sink tissue (tubers) was detected in rolC:GS/RS self grafts than
rolC:GS/RS stocks grafted to WT scions indicating a contribution of shoot supplied raffinose
(Hannah et al., 2006). However, in our studies, the proportion of RFOs identified in phloem
exudates from excised leaves of transgenic plants was much lower than the proportions observed
in whole-leaf samples (Figure 16). This implies that RFOs are not confined to the companion
cells. In previous study, Arabidopsis has been shown to be Suc-transporting “type 1-2a” plants
and small amounts raffinose are also transported (Haritatos et al., 2000). Through labeling
experiment with 14CO2 to source leaves of Arabidopsis, radiolabel was found in sucrose,
raffinose and galactinol in source leaves, which were translocated to sink leaves. Coleus was
used as positive control and was found to synthesize and translocate substantial raffinose and
stachyose, but little galactinol. “Type 1-2a” plants have relatively abundant plasmodesmata
between minor-vein phloem and surrounding cells, such as vascular parenchyma cells and
bundle sheath cells. It is possible that RFOs produced in transgenic lines are transported into the
vacuole, which functions as storage, waste disposal, protection, and growth. If so, how are RFOs

58
translocated from companion cells to vacuole? Are there RFOs transporters in plants
membranes? Sugar transporters for Suc and hexoses have been identified and characterized for a
variety of plants. However, RFOs transporters have received little attention. RFOs were
proposed to be transported through plasmodesmata as part of the polymer-trap mechanism for
symplasmic phloem loading (Turgeon, 1996). Furthermore, RFOs may leak from phloem and
return to the leaf in the xylem stream. 14C-Sucrose labeling experiment, with distribution analysis
of labeled sugars in phloem exudates and sink tissues, can be used to resolve this question. If
labeled RFOs exist in phloem exudates, but not detected in sink tissues, RFOs may leak from
phloem and return to the leaf in the xylem stream.
4.5 RFOs Metabolism in Transgenic Arabidopsis
RFOs appear to be stable in transgenic plants because of quantitative analysis for
galactose, one product from RFOs degradation by α-galactosidases, between WT and transgenic
plants. Sugar analysis in leaves showed that for total hexoses, including Glc, Gal and Fru, there
are 217 pmol/ mg fwt from WT, 288 pmol/ mg fwt from GRS47 and 193 pmol/ mg fwt from
GRS63 (Figure 13). In addition, the total amount of Glc, Fru and Suc in phloem exudates of
transgenic plants (1101 pmol/ mg fwt/ hour for GRS47 and 555 pmol/ mg fwt/ hour for GRS63
in first two-hour phloem exudates) are more than the total amount of Glc, Fru and Suc in phloem
exudates of wild type plants (421 pmol/ mg fwt/ hour) (Figure 16), raising the possibility that
RFOs are degraded to Glc, Fru and Suc in phloem. Measurement of galactose in phloem
exudates can answer whether RFOs are degraded. In table 3, there is no significant difference for
galactose in phloem exudates between wild type and transgenic lines arguing against degradation
of RFOs in phloem. There are four acidic α-galactosidases in Arabidopsis, three of which are cell
wall enzymes and one is a vacuolar enzyme. In addition, two alkaline cytoplasmic α-
59
galactosidases were elucidated to play a potential role in degrading RFOs during germination.
The acidic α-galactosidases are most likely to degrade RFOs in the cell wall compartments and
the vacuole. Because RFOs accumulate to high levels in the existing transgenic plants, it is not
clear if any of these enzymes are acting on RFOs. RFOs are produced as compatible solutes
during stress and seed maturation, and are degraded during germination (Taji et al., 2002; Peters
et al., 2007; Nishizawa et al., 2008; Downie et al., 2000; Blochl et al., 2007). However, the fate
of RFO after recovery from stress is not addressed.
4.6 New Function of RFOs to Protect Plants from Aphids
The occurrence of RFOs in plants is nearly ubiquitous. In some species, it is for carbon
transport and is thought to function in carbon storage in many seeds (Keller and Pharr, 1996;
Turgeon, 1996; Ayre et al., 2003). GALACTINOL SYNTHASE in numerous species is stress-
inducible to function in the accumulation of galactinol and raffinose during drought, high salinity
and cold stress. AtGOLS2-overexpressing transgenic Arabidopsis plants showed drought-stress
tolerance due to increasing galactinol and raffinose as osmoprotectants (Taji et al., 2002).
Sucrose and RFOs, particularly raffinose, function as compatible solutes during drought stress in
the leaves of the resurrection plant Xerophyta viscosa (Peters et al., 2007). Furthermore,
galactinol and raffinose have been shown as novel intracellular antioxidants in plants by
scavenging hydroxyl radicals as under oxidative stress (Nishizawa et al., 2008). In addition,
Galactinol has been suggested to be a signaling component of the induced systemic resistance
caused by pathogens, supporting a role in defense against biotic stresses (Kim et al., 2008).
Aphids are phloem-feeding insects that constitute a biotic stress since they extract nutrients and
reduce plant vigor. To test for an impact of RFO production on aphid feeding, “no choice”
fecundity tests and “choice” feeding preferences were conducted. In this study, transgenic
60
Arabidopsis producing RFOs were a less preferred host for aphids, and aphid reproduction was
reduced on transgenic plants (Figure 20 and 21). There were no significant preferences between
WT and transgenic plants 8 h after aphid release, suggesting that the resistance to aphids is
unlikely to result from chemicals released at the surface of plants (Figure 21C). The preferences
after 24 h can result from RFOs increasing in transgenic plants or due to presence of a metabolite
that adversely impacts insect reproduction. We are unaware of RFOs levels increasing in direct
response to aphid feeding. However, since the carbohydrate content of the phloem stream is
altered in the transgenic plants, we rationalized that aphid feeding preferences may also be
altered. It is worth noting that many animals cannot digest the αGal1-6 linkage of RFOs, and
RFOs can cause bloating particularly in mammals. Aphid feeding on synthetic media was used to
test if RFOs directly impacted aphid behavior. Aphids did not show differences in reproduction
four days after they were fed on synthetic media with or without RFOs (Figure 22). This result
indicates that the resistance to aphid feeding is an indirect effect of the exotic sugars. The aphid
resistance can result from higher hydrostatic pressure produced in our engineered source tissue
which could make aphids lose body water to the gut as they feed. RFOs may be as signaling
components of the systemic resistance for protecting plants against aphids. Another possibility is
that RFO accumulation in transgenic Arabidopsis promotes a general stress response which in
turn results in compounds that resist aphids. The synthesis of RFOs may contribute the
secondary metabolism which provides the resistance to aphid feeding. For example,
glucosinolates, as a secondary metabolite, were reported to accumulate in the phloem sap to
serve as reservoirs for the release of toxic cyanates and nitriles to defend against herbivores and
pathogens (Halkier et al., 2006). Toxic breakdown products of glucosinolates can also deter
aphid feeding (Kim et al., 2008).
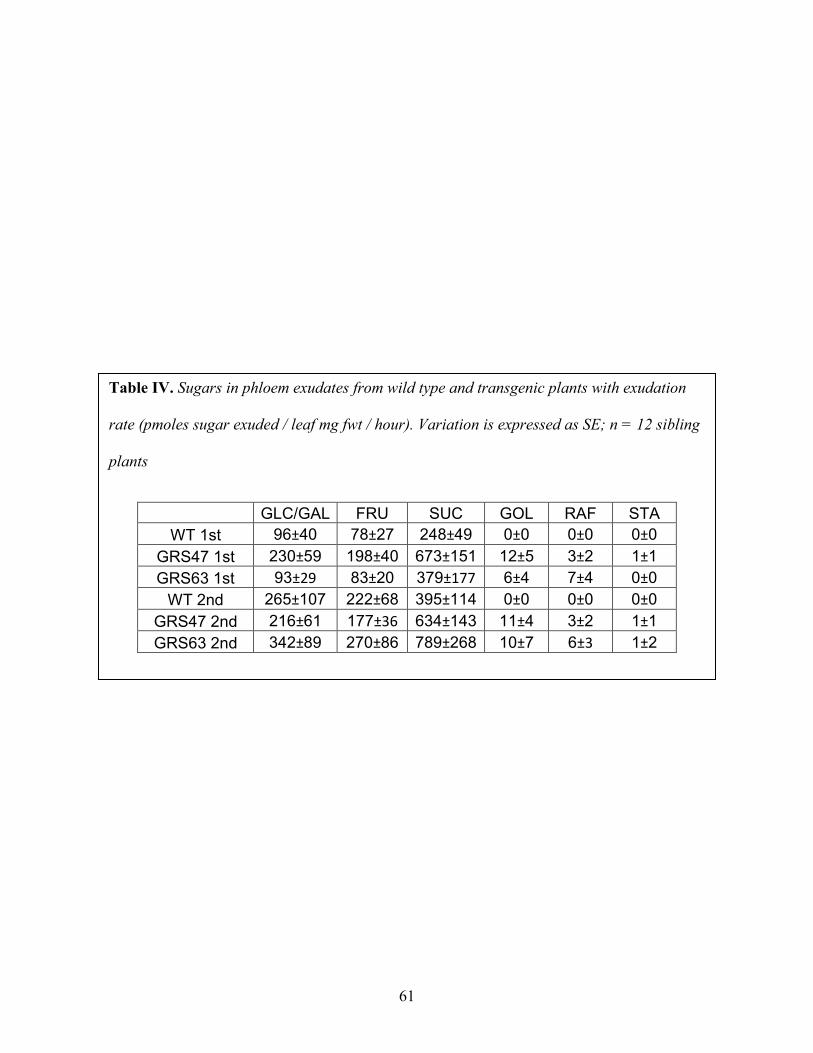
61
Table IV. Sugars in phloem exudates from wild type and transgenic plants with exudation
rate (pmoles sugar exuded / leaf mg fwt / hour). Variation is expressed as SE; n = 12 sibling
plants
GLC/GAL FRU SUC GOL RAF STA WT 1st 96±40 78±27 248±49 0±0 0±0 0±0
GRS47 1st 230±59 198±40 673±151 12±5 3±2 1±1 GRS63 1st 93±29 83±20 379±177 6±4 7±4 0±0
WT 2nd 265±107 222±68 395±114 0±0 0±0 0±0 GRS47 2nd 216±61 177±36 634±143 11±4 3±2 1±1 GRS63 2nd 342±89 270±86 789±268 10±7 6±3 1±2

62
Table V. Percentage of sugars in leaves from wild type and transgenic plants
GLU/GAL FRU SUC GOL RAF STA Hexoses WT 19.7% 3.5% 76.3% 0.1% 0.4% 0.0% 23.2%
GRS47 7.6% 1.4% 31.4% 33.6% 21.6% 4.4% 9.0% GRS63 12.2% 2.5% 48.5% 10.4% 25.7% 0.6% 14.8%
Table VI. Percentage of sugars in phloem exudates from wild type and transgenic plants
GLC/GAL FRU SUC GOL RAF STA Hexoses WT 1st 22.8% 18.4% 58.7% 0.0% 0.0% 0.0% 41.3%
GRS47 1st 20.6% 17.8% 60.3% 1.1% 0.3% 0.1% 38.4% GRS63 1st 16.3% 14.7% 66.6% 1.1% 1.3% 0.0% 31.0%
WT 2nd 30.0% 25.2% 44.8% 0.0% 0.0% 0.0% 55.2% GRS47 2nd 20.8% 17.0% 60.9% 1.1% 0.3% 0.1% 37.7% GRS63 2nd 24.1% 19.0% 55.7% 0.7% 0.4% 0.0% 43.2%

63
BIBLIOGRAPHY
Ayre BG, Keller F, Turgeon R (2003) Symplastic continuity between companion cells and the translocation stream: long-distance transport is controlled by retention and retrieval mechanisms in the phloem. Plant Physiol 131: 1518-1528
Ayre BG, Blair JE, Turgeon R (2003) Functional and phylogenetic analyses of a conserved regulatory program in the phloem of minor veins. Plant Physiol 133: 1229-1239
Ayre BG, Turgeon R (2004) Graft transmission of a floral stimulant derived from CONSTANS. Plant Physiol 135: 2271-2278
Bailly C, Audigier C, Ladonne F, Wagner MH, Coste F, Corbineau F, Come D (2001) Changes in oligosaccharide content and antioxidant enzyme activities in developing bean seeds as related to acquisition of drying tolerance and seed quality. J Exp Bot 52: 701-708
Becker D, Kemper E, Schell J, Masterson R (1992) New plant binary vectors with selectable markers located proximal to the left T-DNA border. Plant Molecular Biology 20: 1195-1197
Blochl A, Peterbauer T, Richter A (2007) Inhibition of raffinose oligosaccharide breakdown delays germination of pea seeds. J Plant Physiol 164: 1093-1096
Fisher DB (2000) Long-distance transport. In Biochemistry and Molecular Biology of Plants (Buchanan BB, Gruissem W, Jones RL, eds), 730-784, John Wiley & Sons Inc
Chincinska IA, Liesche J, Krugel U, Michalska J, Geigenberger P, Grimm B, Kuhn C (2008) Sucrose transporter StSUT4 from potato affects flowering, tuberization, and shade avoidance response. Plant Physiol 146: 515-528
Clough SJ, Bent AF (1998) Floral dip: a simplified method for Agrobacterium-mediated transformation of Arabidopsis thaliana. Plant J 16: 735-743
Corbesier L, Lejeune P, Bernier G (1998) The role of carbohydrates in the induction of flowering in Arabidopsis thaliana: comparison between the wild type and a starchless mutant. Planta 206: 131-137
Downie B, Bewley JD (2000) Soluble sugar content of white spruce (Picea glauca) seeds during and after germination. Physiologia Plantarum 110: 1-12
Fan RC, Peng CC, Xu YH, Wang XF, Li Y, Shang Y, Du SY, Zhao R, Zhang XY, Zhang LY, Zhang DP (2009) Apple sucrose transporter SUT1 and sorbitol transporter SOT6 interact with cytochrome b5 to regulate their affinity for substrate sugars. Plant Physiol 150: 1880-1901

64
Gilert GA, Wilson C, Madore MA (1997) Root-zone salinity alters raffinose oligosaccharide metabolism and transport in coleus. Plant Physiol 115: 1267-1276
Halkier BA, Gershenzon J (2006) Biology and biochemistry of glucosinolates. Annu. Rev. Plant Biol 57: 303-333
Hannah MA, Zuther E, Buchel K, Heyer AG (2006) Transport and metabolism of raffinose family oligosaccharides in transgenic potato. J Exp Bot 57: 3801-3811
Haritatos E, Medville R, Turgeon R (2000) Minor vein structure and sugar transport in Arabidopsis thaliana. Planta 211: 105-111
Haritatos E, Ayre BG, Turgeon R (2000) Identification of phloem involved in assimilate loading in leaves by the activity of the galactinol synthase promoter. Plant Physiol 123, 927-937
Harrison SJ, Mott EK, Parsley K, Aspinall S, Gray JC, Cottage A (2006) A rapid and robust method of identifying transformed Arabidopsis thaliana seedlings following floral dip transformation. Plant Methods 2: 19
Hendrix JE (1977) Phloem loading in Squash. Plant physiol 60, 567-569
Joe L, Queena L, Venkatramana P, John R, Jyoti S (2010) PAD4-dependent antibiosis contributes to the ssi2-conferred hyper-resistance to the green peach aphid. MPMI 23: 618-627
Keller F, Pharr DM (1996) Metabolism of carbohydrates in sinks and sources: galactosyl-sucrose oligosaccharides. In Photoassimilate Distribution in Plants and Crops: Source-Sink Relationships (Zamski E, Schacherer AA, eds), 157-183, Marcel Dekker
Kim JH, Lee BW, Schroeder FC, Jander G (2008) Identification of indole glucosinolate breakdown products with antifeedant effects on Myzus persicae (green peach aphid). The Plant Journal 54: 1015-1026
Kim MS, Cho SM, Kang EY, Im YJ, Hwangbo H, Kim YC, Ryu CM, Yang KY, Chung GC, Cho BH (2008) Galactinol is a signaling component of the induced systemic resistance caused by Pseudomonas chlororaphis O6 root colonization. Mol Plant Microbe Interact 21: 1643-1653
King RW, Zeevaart JA (1974) Enhancement of phloem exudation from cut petioles by chelating agents. Plant Physiol 53: 96-103
Lalonde S, Tegeder M, Throne-Holst M, Frommer WB, Patrick JW (2003) Phloem loading and unloading of sugars and amino acids. Plant Cell Environ 26: 37-56
Lebon G, Wojnarowiez G, Holzapfel B, Fontaine F, Gaveau NV, Clement C (2008) Sugars and flowering in the grapevine (Vitis vinifera L.). J Exp Bot 59: 2565-2578
65
Martinez-Zapater JM, Salinas J (1998) Methods in Molecular Biology. Volume 82 Arabidopsis protocols. No. 2 of Part І. Humana Press
McGarry RC, Ayre BG (2008) A DNA element between At4g28630 and At4g28640 confers companion-cell specific expression following the sink-to-source transition in mature minor vein phloem. Planta 228, 839-849
Mittler TE and Dadd RH (1965) Differences in the probing responses of Myzus persicae (Sulzer) elicited by different feeding solutions behind a parafilm membrane. Entomol 8: 107-122
Nishizawa A, Yabuta Y, Shigeoka S (2008) Galactinol and raffinose constitute a novel function to protect plants from oxidative damage. Plant Physiol 147: 1251-1263
Oparka KJ, Turgeon R (1999) Sieve elements and companion cells-traffic control centers of the phloem. Plant Cell 11: 739-750
Pegadaraju V, Knepper C, Reese J, Shah J (2005) Premature leaf senescence modulated by the Arabidopsis PHYTOALEXIN DEFICIENT4 gene is associated with defense against the phloem-feeding green peach aphid. Plant Physiol 139: 1927-1934
Pegadaraju V, Louis J, Singh V, Reese JC, Bautor J, Feys BJ, Cook G, Parker JE, Shah J (2007) Phloem-based resistance to green peach aphid is controlled by Arabidopsis PHYTOALEXIN DEFICIENT4 without its signaling partner ENHANCED DISEASE SUSCEPTIBILITY1. Plant J 52: 332-341
Pennycooke JC, Jones ML, Stushnoff C (2003) Down-regulating α-galactosidase enhances freezing tolerance in transgenic petunia. Plant Physiol 133: 901-909
Peters S, Keller F (2009) Frost tolerance in excised leaves of the common bugle (Ajuga reptans L.) correlates positively with the concentrations of raffinose family oligosaccharides (RFOs). Plant Cell Environ 32: 1099-1107
Peters S, Mundree SG, Thomson JA, Farrant JM, Keller F (2007) Protection mechanisms in the resurrection plant Xerophyta viscosa (Baker): both sucrose and raffinose family oligosaccharides (RFOs) accumulate in leaves in response to water deficit. J Exp Bot 58: 1947-1956
Rasband WS (2007) ImageJ. http://rsb.info.nih.gov/ij/
Rennie EA, Turgeon R (2009) A comprehensive picture of phloem loading strategies. Proc Natl Acad Sci U S A 106: 14162-14167
Sambrook J, Russel DW (2001) Molecular Cloning, Ed 3. Cold Spring Harbor Laboratory Press, Cold Spring Harbor, New York
Srivastava AC, Ganesan S, Ismail IO, Ayre BG (2008) Functional characterization of the Arabidopsis AtSUC2 Sucrose/H+ symporter by tissue-specific complementation reveals

66
an essential role in phloem loading but not in long-distance transport. Plant Physiol 148: 200-211
Taiz L, Zeiger E (2006) Plant Physiology, Ed 4. Sinauer Associates, Inc., Sunderland, Mass
Taji T, Ohsumi C, Iuchi S, Seki M, Kasuga M, Kobayashi M, Yamaguchi-Shinozaki K, Shinozaki K (2002) Important roles of drought- and cold-inducible genes for galactinol synthase in stress tolerance in Arabidopsis thaliana. Plant J 29: 417-426
Teruo Nakakuki (2002) Present status and future of functional oligosaccharide development in Japan. Pure Appl. Chem 74: 1245-1251
Turgeon R, Gowan E (1990) Phloem loading in Coleus blumei in the absence of carrier-mediated uptake of export sugar from the apoplast. Plant Physiol 94: 1244-1249
Turgeon R (1996) Phloem loading and plasmodesmata. Trends Plant Sci 1: 418-423
Turgeon R, Ayre BG (2005) Pathways and mechanisms of phloem loading. In Vascular Transport in Plants (Holbrook NM, Zwieniecki MA, eds), 45-67, Elsevier Academic Press
Turgeon R. Medville R (2004) Phloem loading. A reevaluation of the relationship between plasmodesmatal frequencies and loading strategies. Plant Physiol 136: 3795-3803
van Bel AJ, Hess PH (2008) Hexoses as phloem transport sugars: the end of a dogma? J Exp Bot 59: 261-272
Zuther E, Buchel K, Hundertmark M, Stitt M, Hincha DK, Heyer AG (2004) The role of raffinose in the cold acclimation response of Arabidopsis thaliana. FEBS Lett 576: 169-173
![[SWI ], the Prion Formed by the Chromatin Remodeling ... · source. Growth of [SWI+], but not [swi2], cells is greatly impaired on such medium because raffinose transport into cells](https://img.pdfslide.net/doc/110x75/5f099baa7e708231d427a5c1/swi-the-prion-formed-by-the-chromatin-remodeling-source-growth-of-swi.jpg)