Embed Size (px)
Citation preview
2504 Kathrin Renner et al. Eur. J. Immunol. 2015. 45: 2504–2516DOI: 10.1002/eji.201545473
Metabolic plasticity of human T cells: Preservedcytokine production under glucose deprivationor mitochondrial restriction, but 2-deoxy-glucoseaffects effector functionsKathrin Renner1,2, Anna-Lena Geiselhoringer1,2, Matthias Fante1,Christina Bruss1, Stephanie Farber1,2, Gabriele Schonhammer1,2,Katrin Peter1, Katrin Singer1, Reinhard Andreesen1,2, Petra Hoffmann1,2,Peter Oefner3, Wolfgang Herr1,2 and Marina Kreutz1,2
1 Department of Internal Medicine III, University Hospital Regensburg, Regensburg, Germany2 Regensburg Center for Interventional Immunology (RCI), Regensburg, Germany3 Institute of Functional Genomics, University Hospital of Regensburg, Regensburg, Germany
The strong link between T-cell metabolism and effector functions is well characterizedin the murine system but hardly investigated in human T cells. Therefore, we ana-lyzed glycolytic and mitochondrial activity in correlation to function in activated humanCD4 and CD8 T cells. Glycolysis was barely detectable upon stimulation but acceleratedbeyond 24 h, whereas mitochondrial activity was elevated immediately in both T-cellpopulations. Glucose deprivation or mitochondrial restriction reduced proliferation, hadonly a transient impact on “on-blast formation” and no impact on viability, IFN-γ, IL-2,IL-4, and IL-10 production, whereas TNF was reduced. Similar results were obtained inbulk T cells and T-cell subsets. Elevated respiration under glucose restriction demon-strated metabolic flexibility. Administration of the glycolytic inhibitor 2-deoxy-glucosesuppressed both glycolysis and respiration and exerted a strong impact on cytokine pro-duction that persisted for IFN-γ after removal of 2-deoxy-glucose. Taken together, gly-colytic or mitochondrial restriction alone compromised proliferation of human T cells,but barely affected their effector functions. In contrast, effector functions were severelyaffected by 2-deoxy-glucose treatment.
Keywords: 2-deoxy-glucose � ATP � Cytokines � Glucose deprivation � Human CD4 T cells �
Human CD8 T cells � Metabolism � Mitochondrial inhibition
See accompanying Commentary by Finlay
� Additional supporting information may be found in the online version of this article at thepublisher’s web-site
Introduction
The transition from quiescent to effector lymphocytes increasesthe metabolic demands of T cells, as growth, proliferation and
Correspondence: Dr. Kathrin Rennere-mail: [email protected]
effector functions depend on ATP and biomolecule synthesis[1–4]. Numerous studies have investigated metabolic alterationsof murine T cells upon stimulation. Murine T-cell activationleads to increased glucose metabolism that drives proliferationand effector functions [5–8]. Most studies agree, that prolifer-ation depends on glucose and glutamine uptake and a stronglink between glycolytic activity and IFN-γ production has beenreported [7, 9, 10]. Pearce and colleagues have demonstrated
C© 2015 WILEY-VCH Verlag GmbH & Co. KGaA, Weinheim www.eji-journal.eu
Eur. J. Immunol. 2015. 45: 2504–2516 Cellular immune response 2505
that glucose is especially important for the initiation of IFN-γtranslation. Glucose triggers the dissociation of glyderaldehyde-3-phosphate dehydrogenase (GAPDH) from the 3′ UTR of IFN-γ mRNA thereby allowing cytokine production [11]. In con-trast, production of other cytokines such as IL-2 appears notto depend on glucose [6, 7]. Beside similarities, as activa-tion of glucose metabolism upon stimulation, murine T-cellsubpopulations adopt distinct metabolic pathways to differentextents. CD4 T cells remain more oxidative and CD8 T cellsmore glycolytic, thereby exhibiting a higher proliferative capacity[12].
Many studies have used the glycolytic inhibitor 2-deoxy-glucose (2-DG) to prove the importance of glucose metabolismfor T-cell function. However, glucose deprivation and 2-DG treat-ment do not always result in the same effects. Cham and Gajewskyshowed that IL-2 production was not affected by glucose depri-vation but reduced by 2-DG treatment [6]. Further, MacDonaldand colleagues suggested that 2-DG altered cytolysis and conju-gate formation of murine T cells with target cells independent ofenergy depletion [13]. Interestingly, a direct inhibitory effect of2-DG on cell respiration has been shown in adipocytes [14]. Thisis of special importance considering that mitochondrial oxidativephosphorylation (OXPHOS) and reactive oxygen species produc-tion are involved in proliferation and IL-2 production, respectively[11, 15].
Data in the human system are rather sparse. Elevated glu-cose and glutamine uptake has been observed upon activation ofhuman lymphocytes and linked to proliferation and cytokine pro-duction [16–18]. However, glycolytic or mitochondrial activitywas dispensable during the early phase of PMA/ionomycin stimu-lation of human CD4 T cells [19]. Nevertheless, an early glycolyticswitch has been related to an accelerated production of IFN-γ inhuman memory CD8 T cells [20].
A detailed understanding of the relationship betweenmetabolism and human T-cell function is mandatory also in lightof newly developed protocols for cancer therapy targeting gly-colytic or mitochondrial activity. Such protocols might dispropor-tionally affect the adaptive immune system [21] and thereby theanti-tumor immune response, which is regarded as important forpatient outcome [22].
In this study, we characterized and directly compared theactivation-induced metabolic reprogramming of isolated stim-ulated and restimulated human CD4 and CD8 T cells andinvestigated the impact of metabolic restriction. As our keyfinding, we demonstrate that glucose metabolism and mitochon-drial function are important for CD4 and CD8 T-cell prolif-eration, but of minor importance for cytokine production andviability. Administration of 2-DG, in contrast, severely compro-mised glycolytic and mitochondrial activity and cytokine pro-duction in CD4 and CD8 bulk populations and related subsets.Taken together, we show that important effector functions of Tcells are barely affected by inhibiting separately glucose or mito-chondrial activity, however, they are severely compromised by2-DG.
Results
Glucose metabolism in human CD4 and CD8 T cells
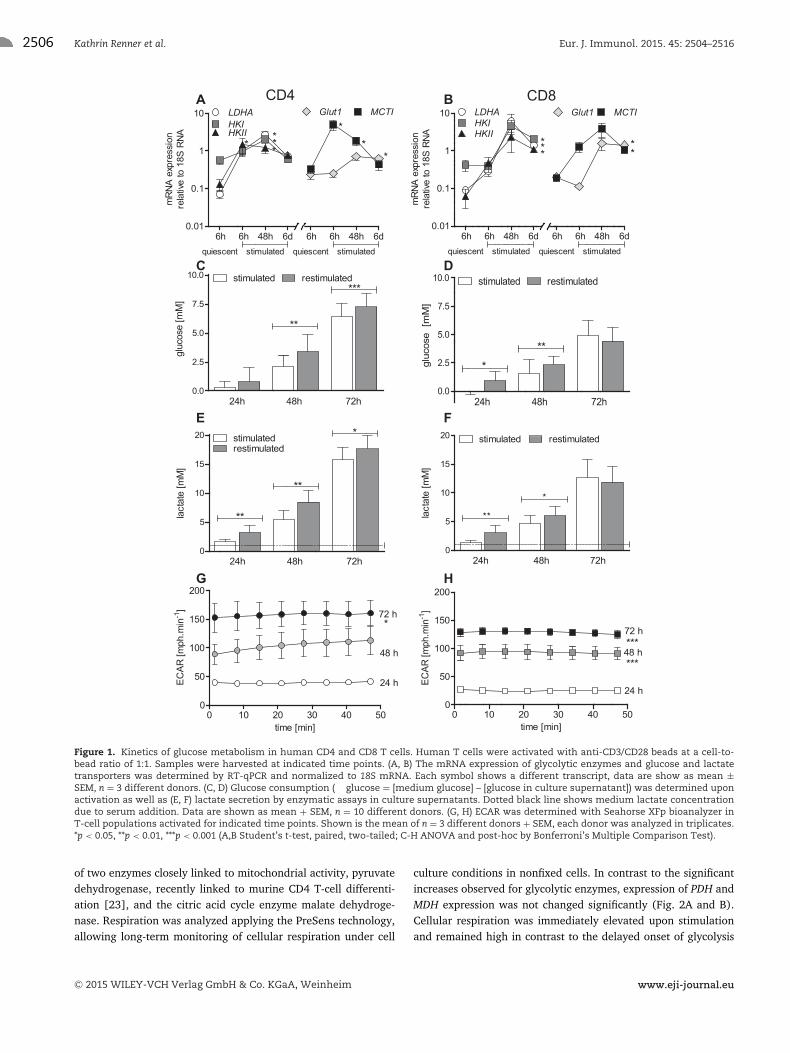
CD4 and CD8 T cells were stimulated for 6 days (denominatedstimulated). After 6 days cells were collected, diluted and stimu-lated again (denominated restimulated). The restimulation proce-dure was thought to reflect the in vivo situation, where T cells thatevaded from the lymph node are restimulated at the site of inflam-mation. We analyzed the mRNA expression kinetics of importantproteins involved in glycolysis. In both T-cell populations, mRNAlevels of glycolytic enzymes and transporters were increasedupon stimulation albeit the initial kinetics were different (Fig. 1Aand B). In CD4 T cells, mRNA expression of lactate dehydrogenaseA (LDHA), hexokinase (HK) I and II and monocarboxylate trans-porter 1 (MCT1) was strongly elevated after the first 6 h, whereasin CD8 T cells expression was moderately increased after 6h buthighly elevated after 48 h (Fig. 1A and B). Glucose transporter 1(GLUT1) expression remained increased beyond 6 h in both T-cellpopulations (Fig. 1A and B). High levels of mRNA expression weremaintained during restimulation (data not shown).
Glucose metabolism was investigated by measuring glucoseuptake and lactate secretion. Glucose metabolism was almost notdetected in quiescent T cells cultivated in medium supplementedwith the same concentration of IL-2 as activated T cells (Sup-porting Information Fig. 1). Activated T-cell populations showedlimited glycolytic activity as shown by the secretion of low lev-els of [2,3-13C]lactate converted from labeled glucose (Support-ing Information Fig. 1). Increased glycolytic activity was foundbeyond 24 h, especially in CD4 T cells (Fig. 1C–F). To furtherinvestigate glucose metabolism, we determined extracellular acid-ification rates (ECAR) by T cells activated for 24, 48 and 72 h. Inline with the observed elevated lactate levels, the glycolytic activitywas also reflected by an increased ECAR in the course of activation(Fig. 1G and H). CD4 T cells stimulated for 24 h were significantlymore active compared to CD8 T cells (40 ± 4 versus 26 ± 3**,p < 0.001, respectively).
It has been reported that memory T cells have an increasedglucose metabolism in the early phase of stimulation. However,we could not find any correlation between lactate secretion andthe percentage of CD95-positive T cells in our bulk population,which are regarded as memory T cells.
T cells maintained a high glycolytic activity during the wholestimulation period of 6 days (data not shown). RestimulatedT cells, displayed a significantly higher initial glucose metabolismin both T-cell populations (Fig. 1C–F). Again, glucose metabolismshowed a higher level in restimulated CD4 T cells.
Mitochondrial activity in human CD4 and CD8 T cells
We analyzed mitochondrial function in the course of human CD4and CD8 T-cell activation. Here we determined the expression
C© 2015 WILEY-VCH Verlag GmbH & Co. KGaA, Weinheim www.eji-journal.eu
2506 Kathrin Renner et al. Eur. J. Immunol. 2015. 45: 2504–2516
CD8CD4A
C
B
D
E F
G H
0.01
0.1
1
10
6h 6h 48h 6dstimulatedquiescent
Glut1LDHAHKIHKII
6h 6h 48h 6dstimulatedquiescent
*
***
***
MCTI
mRN
A ex
pres
sion
rela
tive
to 1
8S R
NA
0.01
0.1
1
10
6h 6h 48h 6dstimulatedquiescent
6h 6h 48h 6dstimulatedquiescent
LDHAHKIHKII
Glut1 MCTI
**** *
mRN
A ex
pres
sion
rela
tive
to 1
8S R
NA
0 10 20 30 40 500
50
100
150
200
24 h
48 h
72 h*
time [min]
ECAR
[mph
.min
-1]
0 10 20 30 40 500
50
100
150
200
24 h
48 h
72 h
***
***
time [min]
ECAR
[mph
.min
-1]
0.0
2.5
5.0
7.5
10.0
24h 48h 72h
stimulated restimulated***
**
glu
cose
[mM
]
0.0
2.5
5.0
7.5
10.0 stimulated restimulated
***
24h 48h 72h
glu
cose
[m
M]
0
5
10
15
20 stimulatedrestimulated
**
*
**
24h 48h 72h
lact
ate
[mM
]
0
5
10
15
20
**
restimulatedstimulated
24h 48h 72h
*
lact
ate
[mM
]
Figure 1. Kinetics of glucose metabolism in human CD4 and CD8 T cells. Human T cells were activated with anti-CD3/CD28 beads at a cell-to-bead ratio of 1:1. Samples were harvested at indicated time points. (A, B) The mRNA expression of glycolytic enzymes and glucose and lactatetransporters was determined by RT-qPCR and normalized to 18S mRNA. Each symbol shows a different transcript, data are show as mean ±SEM, n = 3 different donors. (C, D) Glucose consumption (� glucose = [medium glucose] – [glucose in culture supernatant]) was determined uponactivation as well as (E, F) lactate secretion by enzymatic assays in culture supernatants. Dotted black line shows medium lactate concentrationdue to serum addition. Data are shown as mean + SEM, n = 10 different donors. (G, H) ECAR was determined with Seahorse XFp bioanalyzer inT-cell populations activated for indicated time points. Shown is the mean of n = 3 different donors + SEM, each donor was analyzed in triplicates.*p < 0.05, **p < 0.01, ***p < 0.001 (A,B Student’s t-test, paired, two-tailed; C-H ANOVA and post-hoc by Bonferroni’s Multiple Comparison Test).
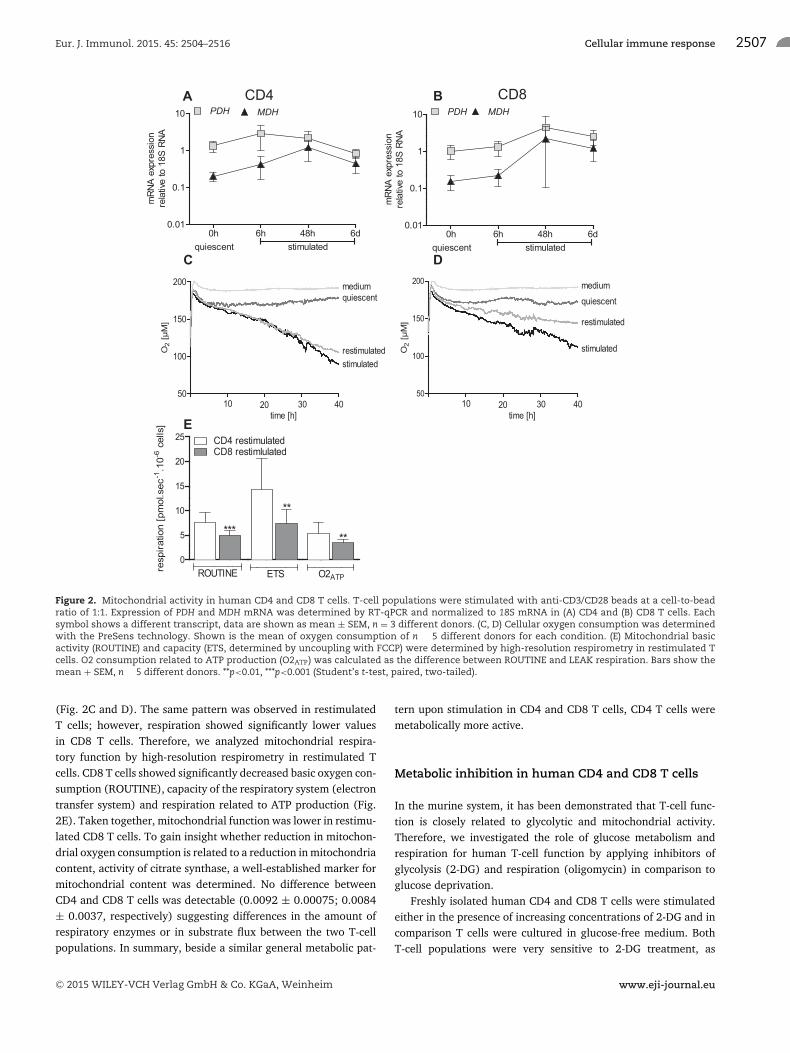
of two enzymes closely linked to mitochondrial activity, pyruvatedehydrogenase, recently linked to murine CD4 T-cell differenti-ation [23], and the citric acid cycle enzyme malate dehydroge-nase. Respiration was analyzed applying the PreSens technology,allowing long-term monitoring of cellular respiration under cell
culture conditions in nonfixed cells. In contrast to the significantincreases observed for glycolytic enzymes, expression of PDH andMDH expression was not changed significantly (Fig. 2A and B).Cellular respiration was immediately elevated upon stimulationand remained high in contrast to the delayed onset of glycolysis
C© 2015 WILEY-VCH Verlag GmbH & Co. KGaA, Weinheim www.eji-journal.eu
Eur. J. Immunol. 2015. 45: 2504–2516 Cellular immune response 2507
50
100
150
200
time [h]10 4020 30
medium
quiescent
restimulated
stimulatedO2
[μM
]
CD8CD4
50
100
150
200
time [h]10 4020 30
mediumquiescent
restimulatedstimulated
O2
[μM
]
0
5
10
15
20
25
ROUTINE ETS
CD4 restimulatedCD8 restimlulated
O2ATP
***
**
**
resp
iratio
n [p
mol
.sec
-1.1
0-6 c
ells
]
0.01
0.1
1
10
0h 6h 48h 6dstimulated
PDH MDH
quiescent
mRN
A ex
pres
sion
rela
tive
to 1
8S R
NA
0.01
0.1
1
10 PDH MDH
0h 6h 48h 6dstimulatedquiescent
mRN
A ex
pres
sion
rela
tive
to 1
8S R
NA
A
C
B
D
E
Figure 2. Mitochondrial activity in human CD4 and CD8 T cells. T-cell populations were stimulated with anti-CD3/CD28 beads at a cell-to-beadratio of 1:1. Expression of PDH and MDH mRNA was determined by RT-qPCR and normalized to 18S mRNA in (A) CD4 and (B) CD8 T cells. Eachsymbol shows a different transcript, data are shown as mean ± SEM, n = 3 different donors. (C, D) Cellular oxygen consumption was determinedwith the PreSens technology. Shown is the mean of oxygen consumption of n � 5 different donors for each condition. (E) Mitochondrial basicactivity (ROUTINE) and capacity (ETS, determined by uncoupling with FCCP) were determined by high-resolution respirometry in restimulated Tcells. O2 consumption related to ATP production (O2ATP) was calculated as the difference between ROUTINE and LEAK respiration. Bars show themean + SEM, n � 5 different donors. **p<0.01, ***p<0.001 (Student’s t-test, paired, two-tailed).
(Fig. 2C and D). The same pattern was observed in restimulatedT cells; however, respiration showed significantly lower valuesin CD8 T cells. Therefore, we analyzed mitochondrial respira-tory function by high-resolution respirometry in restimulated Tcells. CD8 T cells showed significantly decreased basic oxygen con-sumption (ROUTINE), capacity of the respiratory system (electrontransfer system) and respiration related to ATP production (Fig.2E). Taken together, mitochondrial function was lower in restimu-lated CD8 T cells. To gain insight whether reduction in mitochon-drial oxygen consumption is related to a reduction in mitochondriacontent, activity of citrate synthase, a well-established marker formitochondrial content was determined. No difference betweenCD4 and CD8 T cells was detectable (0.0092 ± 0.00075; 0.0084± 0.0037, respectively) suggesting differences in the amount ofrespiratory enzymes or in substrate flux between the two T-cellpopulations. In summary, beside a similar general metabolic pat-
tern upon stimulation in CD4 and CD8 T cells, CD4 T cells weremetabolically more active.
Metabolic inhibition in human CD4 and CD8 T cells
In the murine system, it has been demonstrated that T-cell func-tion is closely related to glycolytic and mitochondrial activity.Therefore, we investigated the role of glucose metabolism andrespiration for human T-cell function by applying inhibitors ofglycolysis (2-DG) and respiration (oligomycin) in comparison toglucose deprivation.
Freshly isolated human CD4 and CD8 T cells were stimulatedeither in the presence of increasing concentrations of 2-DG and incomparison T cells were cultured in glucose-free medium. BothT-cell populations were very sensitive to 2-DG treatment, as
C© 2015 WILEY-VCH Verlag GmbH & Co. KGaA, Weinheim www.eji-journal.eu
2508 Kathrin Renner et al. Eur. J. Immunol. 2015. 45: 2504–2516
0
6
12
18
24 stimulated restimulated
1 w/o102-DG [mM]
***
***
***
***##
##
glucose
*** ***
++
******
5
##
_
lact
ate
[mM
]
0
6
12
18
24
***
***
**
*****
stimulated restimulated
**
++
1 w/o102-DG [mM] glucose
5_
lact
ate
[mM
]0
6
12
18
24
oligo oligo 24 oligo 48
***
**
**## #
stimulated restimulated
_
lact
ate
[mM
]
0
6
12
18
24
oligo oligo 24 oligo 48
**
stimulated restimulated
#
_la
ctat
e [m
M]
CD8CD4A
C
B
D
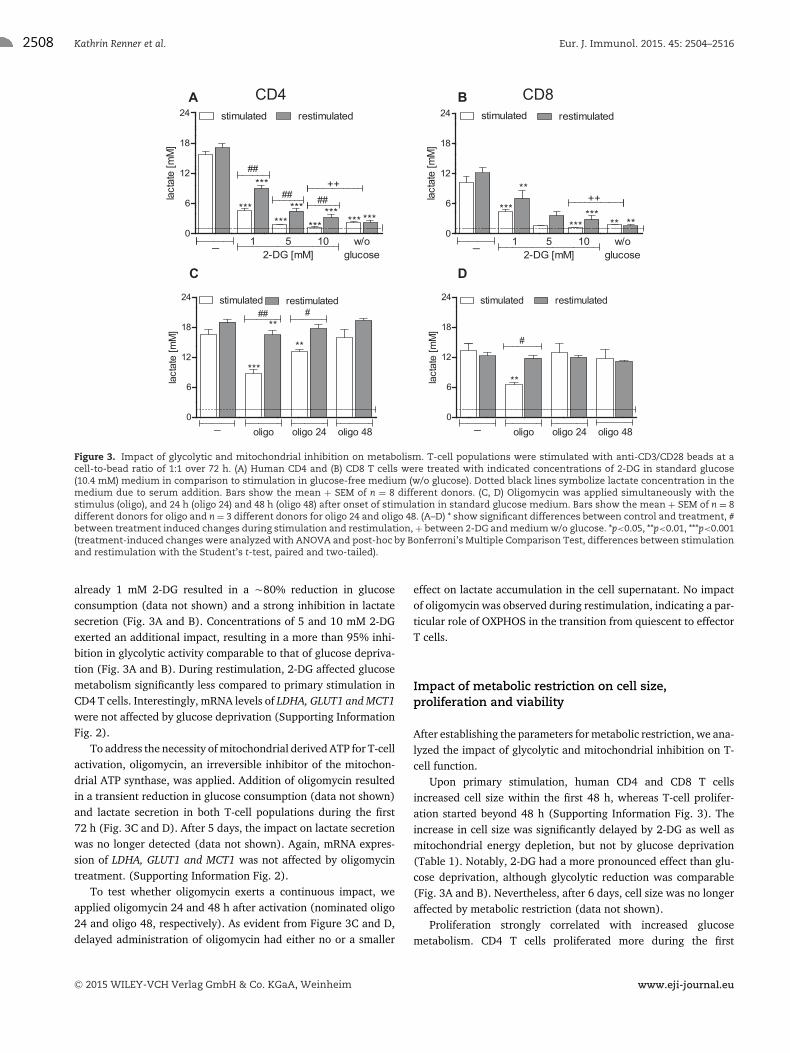
Figure 3. Impact of glycolytic and mitochondrial inhibition on metabolism. T-cell populations were stimulated with anti-CD3/CD28 beads at acell-to-bead ratio of 1:1 over 72 h. (A) Human CD4 and (B) CD8 T cells were treated with indicated concentrations of 2-DG in standard glucose(10.4 mM) medium in comparison to stimulation in glucose-free medium (w/o glucose). Dotted black lines symbolize lactate concentration in themedium due to serum addition. Bars show the mean + SEM of n = 8 different donors. (C, D) Oligomycin was applied simultaneously with thestimulus (oligo), and 24 h (oligo 24) and 48 h (oligo 48) after onset of stimulation in standard glucose medium. Bars show the mean + SEM of n = 8different donors for oligo and n = 3 different donors for oligo 24 and oligo 48. (A–D) * show significant differences between control and treatment, #between treatment induced changes during stimulation and restimulation, + between 2-DG and medium w/o glucose. *p<0.05, **p<0.01, ***p<0.001(treatment-induced changes were analyzed with ANOVA and post-hoc by Bonferroni’s Multiple Comparison Test, differences between stimulationand restimulation with the Student’s t-test, paired and two-tailed).
already 1 mM 2-DG resulted in a �80% reduction in glucoseconsumption (data not shown) and a strong inhibition in lactatesecretion (Fig. 3A and B). Concentrations of 5 and 10 mM 2-DGexerted an additional impact, resulting in a more than 95% inhi-bition in glycolytic activity comparable to that of glucose depriva-tion (Fig. 3A and B). During restimulation, 2-DG affected glucosemetabolism significantly less compared to primary stimulation inCD4 T cells. Interestingly, mRNA levels of LDHA, GLUT1 and MCT1were not affected by glucose deprivation (Supporting InformationFig. 2).
To address the necessity of mitochondrial derived ATP for T-cellactivation, oligomycin, an irreversible inhibitor of the mitochon-drial ATP synthase, was applied. Addition of oligomycin resultedin a transient reduction in glucose consumption (data not shown)and lactate secretion in both T-cell populations during the first72 h (Fig. 3C and D). After 5 days, the impact on lactate secretionwas no longer detected (data not shown). Again, mRNA expres-sion of LDHA, GLUT1 and MCT1 was not affected by oligomycintreatment. (Supporting Information Fig. 2).
To test whether oligomycin exerts a continuous impact, weapplied oligomycin 24 and 48 h after activation (nominated oligo24 and oligo 48, respectively). As evident from Figure 3C and D,delayed administration of oligomycin had either no or a smaller
effect on lactate accumulation in the cell supernatant. No impactof oligomycin was observed during restimulation, indicating a par-ticular role of OXPHOS in the transition from quiescent to effectorT cells.
Impact of metabolic restriction on cell size,proliferation and viability
After establishing the parameters for metabolic restriction, we ana-lyzed the impact of glycolytic and mitochondrial inhibition on T-cell function.
Upon primary stimulation, human CD4 and CD8 T cellsincreased cell size within the first 48 h, whereas T-cell prolifer-ation started beyond 48 h (Supporting Information Fig. 3). Theincrease in cell size was significantly delayed by 2-DG as well asmitochondrial energy depletion, but not by glucose deprivation(Table 1). Notably, 2-DG had a more pronounced effect than glu-cose deprivation, although glycolytic reduction was comparable(Fig. 3A and B). Nevertheless, after 6 days, cell size was no longeraffected by metabolic restriction (data not shown).
Proliferation strongly correlated with increased glucosemetabolism. CD4 T cells proliferated more during the first
C© 2015 WILEY-VCH Verlag GmbH & Co. KGaA, Weinheim www.eji-journal.eu
Eur. J. Immunol. 2015. 45: 2504–2516 Cellular immune response 2509
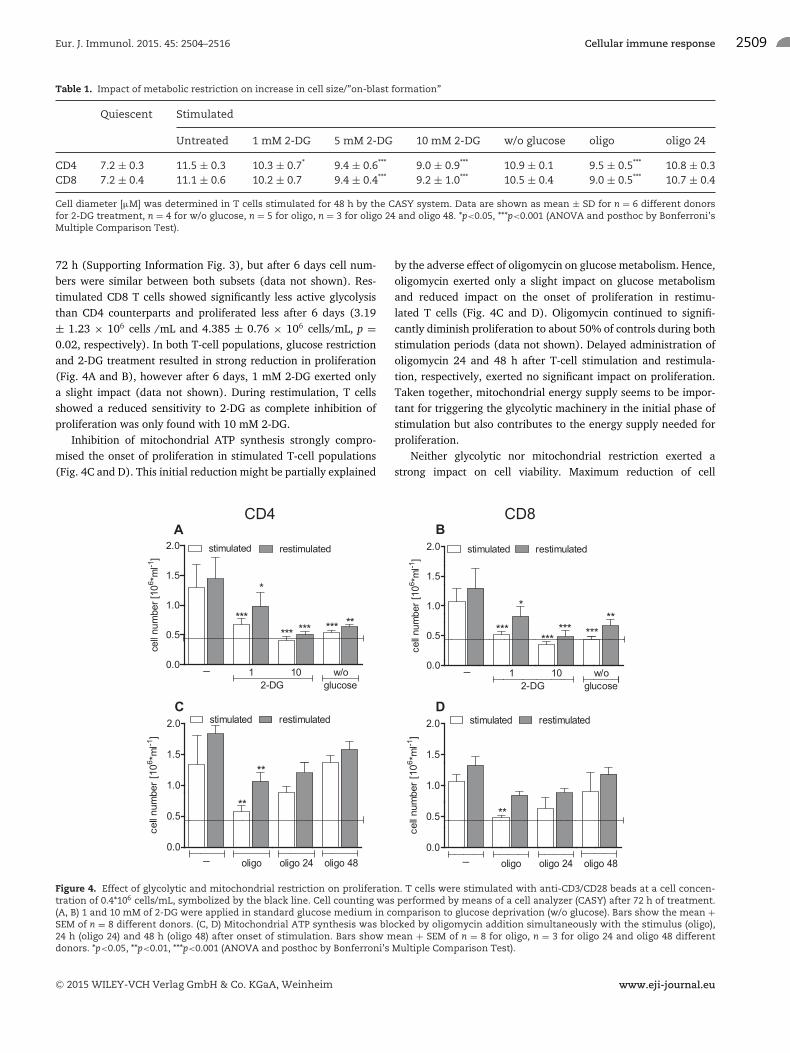
Table 1. Impact of metabolic restriction on increase in cell size/”on-blast formation”
Quiescent Stimulated
Untreated 1 mM 2-DG 5 mM 2-DG 10 mM 2-DG w/o glucose oligo oligo 24
CD4 7.2 ± 0.3 11.5 ± 0.3 10.3 ± 0.7* 9.4 ± 0.6*** 9.0 ± 0.9*** 10.9 ± 0.1 9.5 ± 0.5*** 10.8 ± 0.3CD8 7.2 ± 0.4 11.1 ± 0.6 10.2 ± 0.7 9.4 ± 0.4*** 9.2 ± 1.0*** 10.5 ± 0.4 9.0 ± 0.5*** 10.7 ± 0.4
Cell diameter [μM] was determined in T cells stimulated for 48 h by the CASY system. Data are shown as mean ± SD for n = 6 different donorsfor 2-DG treatment, n = 4 for w/o glucose, n = 5 for oligo, n = 3 for oligo 24 and oligo 48. *p<0.05, ***p<0.001 (ANOVA and posthoc by Bonferroni’sMultiple Comparison Test).
72 h (Supporting Information Fig. 3), but after 6 days cell num-bers were similar between both subsets (data not shown). Res-timulated CD8 T cells showed significantly less active glycolysisthan CD4 counterparts and proliferated less after 6 days (3.19± 1.23 × 10⁶ cells /mL and 4.385 ± 0.76 × 10⁶ cells/mL, p =0.02, respectively). In both T-cell populations, glucose restrictionand 2-DG treatment resulted in strong reduction in proliferation(Fig. 4A and B), however after 6 days, 1 mM 2-DG exerted onlya slight impact (data not shown). During restimulation, T cellsshowed a reduced sensitivity to 2-DG as complete inhibition ofproliferation was only found with 10 mM 2-DG.
Inhibition of mitochondrial ATP synthesis strongly compro-mised the onset of proliferation in stimulated T-cell populations(Fig. 4C and D). This initial reduction might be partially explained
by the adverse effect of oligomycin on glucose metabolism. Hence,oligomycin exerted only a slight impact on glucose metabolismand reduced impact on the onset of proliferation in restimu-lated T cells (Fig. 4C and D). Oligomycin continued to signifi-cantly diminish proliferation to about 50% of controls during bothstimulation periods (data not shown). Delayed administration ofoligomycin 24 and 48 h after T-cell stimulation and restimula-tion, respectively, exerted no significant impact on proliferation.Taken together, mitochondrial energy supply seems to be impor-tant for triggering the glycolytic machinery in the initial phase ofstimulation but also contributes to the energy supply needed forproliferation.
Neither glycolytic nor mitochondrial restriction exerted astrong impact on cell viability. Maximum reduction of cell
0.0
0.5
1.0
1.5
2.0
**
**
stimulated restimulated
oligo oligo 24 oligo 48_
cell
num
ber
[106 *m
l-1]
0.0
0.5
1.0
1.5
2.0
**
stimulated restimulated
oligo oligo 24 oligo 48_
cell
num
ber
[106 *m
l-1]
0.0
0.5
1.0
1.5
2.0 stimulated restimulated
_ 1 10 w/o2-DG glucose
*** *** *** *****
cell
num
ber [
106 *m
l-1]
*
0.0
0.5
1.0
1.5
2.0
_ 1 102-DG
stimulated restimulated
******
*
*** *****
w/oglucose
cell n
umbe
r [10
6 *ml-1
]
A
C
B
D
CD8CD4
Figure 4. Effect of glycolytic and mitochondrial restriction on proliferation. T cells were stimulated with anti-CD3/CD28 beads at a cell concen-tration of 0.4*106 cells/mL, symbolized by the black line. Cell counting was performed by means of a cell analyzer (CASY) after 72 h of treatment.(A, B) 1 and 10 mM of 2-DG were applied in standard glucose medium in comparison to glucose deprivation (w/o glucose). Bars show the mean +SEM of n = 8 different donors. (C, D) Mitochondrial ATP synthesis was blocked by oligomycin addition simultaneously with the stimulus (oligo),24 h (oligo 24) and 48 h (oligo 48) after onset of stimulation. Bars show mean + SEM of n = 8 for oligo, n = 3 for oligo 24 and oligo 48 differentdonors. *p<0.05, **p<0.01, ***p<0.001 (ANOVA and posthoc by Bonferroni’s Multiple Comparison Test).
C© 2015 WILEY-VCH Verlag GmbH & Co. KGaA, Weinheim www.eji-journal.eu
2510 Kathrin Renner et al. Eur. J. Immunol. 2015. 45: 2504–2516
CD8CD4A
C
B
D
E F
G H
0.0001
0.001
0.01
0.1
1
10
6h 6h 48h 6d 6h 48h 6d
stimulated restimulated
IFNγ
quiescent
mRN
A ex
pres
sion
rela
tive
to 1
8S R
NA
0.0001
0.001
0.01
0.1
1
10
6h 6h 48h 6d 6h 48h 6d
IFNγ
mRN
A ex
pres
sion
rela
tive
to 1
8S R
NA
stimulated restimulatedquiescent
1
10
100
1000
10000
*** ***
_ 10glucose
oligow/o 12-DG [mM]
5
#######**
IFNγ
[pg/
ml]
1
10
100
1000
10000
** ***
_ 10glucose
oligow/o 12-DG [mM]
5
#
IFNγ
[pg/
ml]
0.00
0.25
0.50
0.75
1.00
_**
***1 5 1/- 5/-
2-DG [mM]2-DG [mM]
IFNγ
norm
alize
d to
con
trol
1
10
100
1000
10000
1 5 oligow/oglucose
CMEMnaive
_2-DG [mM]
IFNγ
[pg/
ml]
0.00
0.25
0.50
0.75
1.00
**
***
*
1 5 1/- 5/-2-DG [mM]
_2-DG [mM]
IFNγ
norm
alize
d to
con
trol
*
1
10
100
1000
10000
1 52-DG [mM]
oligow/oglucose
naive EM
_
IFNγ
[pg/
ml]
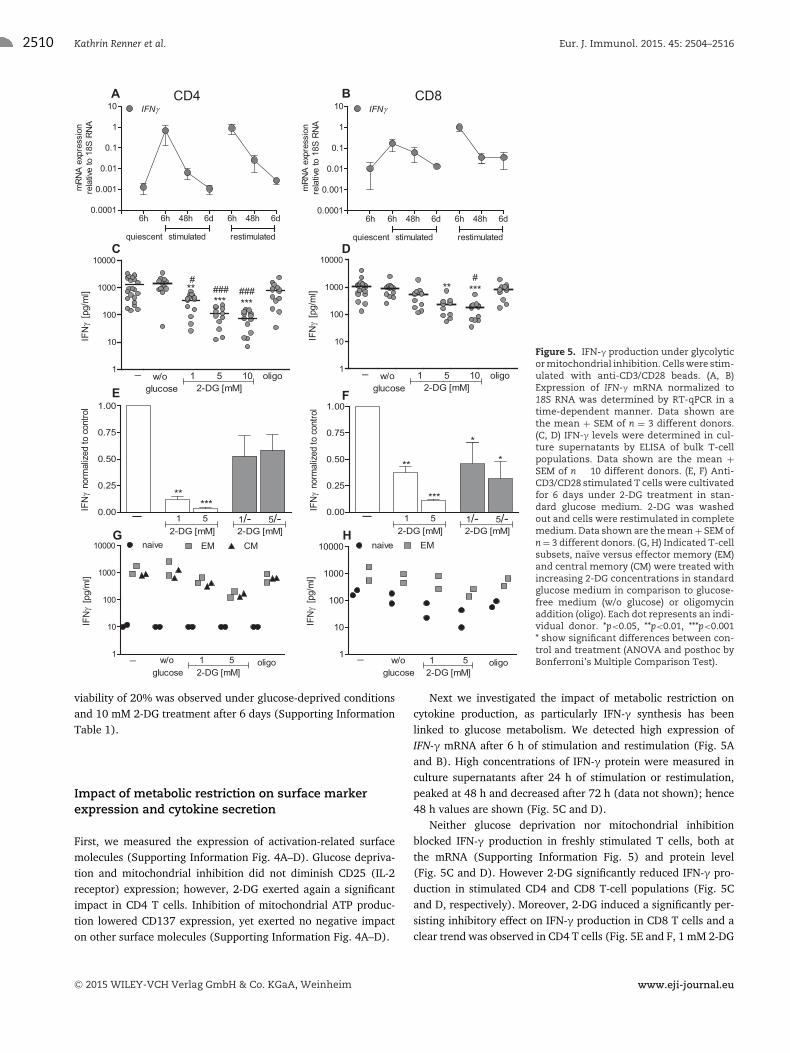
Figure 5. IFN-γ production under glycolyticor mitochondrial inhibition. Cells were stim-ulated with anti-CD3/CD28 beads. (A, B)Expression of IFN-γ mRNA normalized to18S RNA was determined by RT-qPCR in atime-dependent manner. Data shown arethe mean + SEM of n = 3 different donors.(C, D) IFN-γ levels were determined in cul-ture supernatants by ELISA of bulk T-cellpopulations. Data shown are the mean +SEM of n � 10 different donors. (E, F) Anti-CD3/CD28 stimulated T cells were cultivatedfor 6 days under 2-DG treatment in stan-dard glucose medium. 2-DG was washedout and cells were restimulated in completemedium. Data shown are the mean + SEM ofn = 3 different donors. (G, H) Indicated T-cellsubsets, naıve versus effector memory (EM)and central memory (CM) were treated withincreasing 2-DG concentrations in standardglucose medium in comparison to glucose-free medium (w/o glucose) or oligomycinaddition (oligo). Each dot represents an indi-vidual donor. *p<0.05, **p<0.01, ***p<0.001* show significant differences between con-trol and treatment (ANOVA and posthoc byBonferroni’s Multiple Comparison Test).
viability of 20% was observed under glucose-deprived conditionsand 10 mM 2-DG treatment after 6 days (Supporting InformationTable 1).
Impact of metabolic restriction on surface markerexpression and cytokine secretion
First, we measured the expression of activation-related surfacemolecules (Supporting Information Fig. 4A–D). Glucose depriva-tion and mitochondrial inhibition did not diminish CD25 (IL-2receptor) expression; however, 2-DG exerted again a significantimpact in CD4 T cells. Inhibition of mitochondrial ATP produc-tion lowered CD137 expression, yet exerted no negative impacton other surface molecules (Supporting Information Fig. 4A–D).
Next we investigated the impact of metabolic restriction oncytokine production, as particularly IFN-γ synthesis has beenlinked to glucose metabolism. We detected high expression ofIFN-γ mRNA after 6 h of stimulation and restimulation (Fig. 5Aand B). High concentrations of IFN-γ protein were measured inculture supernatants after 24 h of stimulation or restimulation,peaked at 48 h and decreased after 72 h (data not shown); hence48 h values are shown (Fig. 5C and D).
Neither glucose deprivation nor mitochondrial inhibitionblocked IFN-γ production in freshly stimulated T cells, both atthe mRNA (Supporting Information Fig. 5) and protein level(Fig. 5C and D). However 2-DG significantly reduced IFN-γ pro-duction in stimulated CD4 and CD8 T-cell populations (Fig. 5Cand D, respectively). Moreover, 2-DG induced a significantly per-sisting inhibitory effect on IFN-γ production in CD8 T cells and aclear trend was observed in CD4 T cells (Fig. 5E and F, 1 mM 2-DG
C© 2015 WILEY-VCH Verlag GmbH & Co. KGaA, Weinheim www.eji-journal.eu

Eur. J. Immunol. 2015. 45: 2504–2516 Cellular immune response 2511
Table 2. Impact of metabolic restriction on TNF production in themain related CD4 and CD8 T-cell subsets, naıve, effector memory (EM)and central memory (CM)
TNF [pg/mL]
untreated[pg/mL]
w/oglucose
1 mM2-DG
5 mM2-DG
oligo
CD4Naıve I 728 2.3 0.86 0.91 1.23Naıve II 242 1.30 0.78 0.72 0.91EM I 9242 0.44 0.39 0.42 0.73EM II 3614 0.49 0.46 0.34 0.54CM I 3532 2.05 1.00 0.92 1.06CM II 2312 0.81 0.54 0.34 0.56CD8Naıve I 1576 0.38 0.07 0.05 0.05Naıve II 123 0.44 0.21 0.34 0.36EM I 3702 0.44 0.50 0.35 0.53EM II 487 0.73 0.64 0.59 0.69
Absolute values for TNF secretion of two different donors stimulated for48 h without any treatment are shown. Impact of metabolic restrictionon TNF production was calculated relative to untreated control cells.
p = 0.053; 5 mM 2-DG p = 0.06). However glucose metabolismand proliferation were completely restored when 2-DG pretreatedT-cell cultures were washed and restimulated in the absence of2-DG (Supporting Information Fig. 6A–D).
Next we determined the production of other cytokines undermetabolic restriction and obtained similar results. 2-DG alsodiminished TNF secretion, IL-10 and IL-4 in stimulated T cells
(Supporting Information Fig. 7A–D). In contrast, IL-2 productionwas not affected by 2-DG (Supporting Information Fig. 7E and F).Again an impact of glucose deprivation or mitochondrial inhibi-tion was not detected on these cytokines. A strong impact of 2-DGbut hardly no impact of glycolytic or mitochondrial restriction wasobserved also in restimulated T cells, with the only difference thatIFN-γ production was 50% reduced by glucose deprivation in CD4T cells (data not shown).
Different metabolic demands have been reported for CD4 andCD8 T-cell subsets. Therefore we measured cytokine productionunder the various treatments in the major CD4 and CD8 T-cellsubsets of two donors. Despite differences in the total amountof cytokine production, metabolic restriction had comparableeffects on cytokine production in bulk cultures and T-cell subsets(Fig. 5G and H, Supporting Information Fig. 8 and Table 2). More-over, proliferation was comparably affected in T-cell bulk andrelated subsets (data not shown).
Figure 2C and D shows that mitochondrial respiration wasimmediately elevated upon stimulation. We analyzed cellular res-piration of T cells subjected to glucose-free medium in comparisonto 2-DG treatment. T cells were able to transiently increase respi-ration in the absence of glucose (Fig. 6A and B). However, 1 mM2-DG blocked this compensatory mechanism (data not shown).Moreover, higher 2-DG concentrations exerted a concentration-dependent decrease in mitochondrial respiration (Fig. 6C and D).Glucose deprivation might be compensated by increased respira-tion, which is blocked by 2-DG. An inhibition of both pathwayscould result in severely compromised ATP levels thereby affectingcytokine production. Surprisingly, we detected even higher ATP
0
50
100
150
200
time [h]9 4527 36
medium
w/o glucose
w glucose
18
O2
[μM
]
50
100
150
200
medium
w/o glucose
w glucose
time [h]9 4527 3618
O2
[μM
]
A
C
B
D
CD8CD4
50
100
150
200
stimulated
10mM 2-DG
medium.
5mM 2-DG
time [h]9 4527 3618
O2
[μM
]
50
100
150
200
stimulated
10mM 2-DG
medium.
5mM 2-DG
time [h]9 4527 3618
O2
[μM
]
Figure 6. Mitochondrial respiration in glucose-free medium in comparison to 2-DG treatment. Cellular respiration was determined with thePreSens technology in freshly stimulated CD4 and CD8 T cells at a concentration of 2 × 10⁶ cells/mL. (A, B) Human CD4 and CD8 T cells werecultivated in glucose-free medium (w/o glucose) or (C, D) with 2-DG in standard glucose medium. Data are shown as mean of n = 6 different donorsfor glucose deprivation, one representative experiment for 2-DG treatment.
C© 2015 WILEY-VCH Verlag GmbH & Co. KGaA, Weinheim www.eji-journal.eu
2512 Kathrin Renner et al. Eur. J. Immunol. 2015. 45: 2504–2516
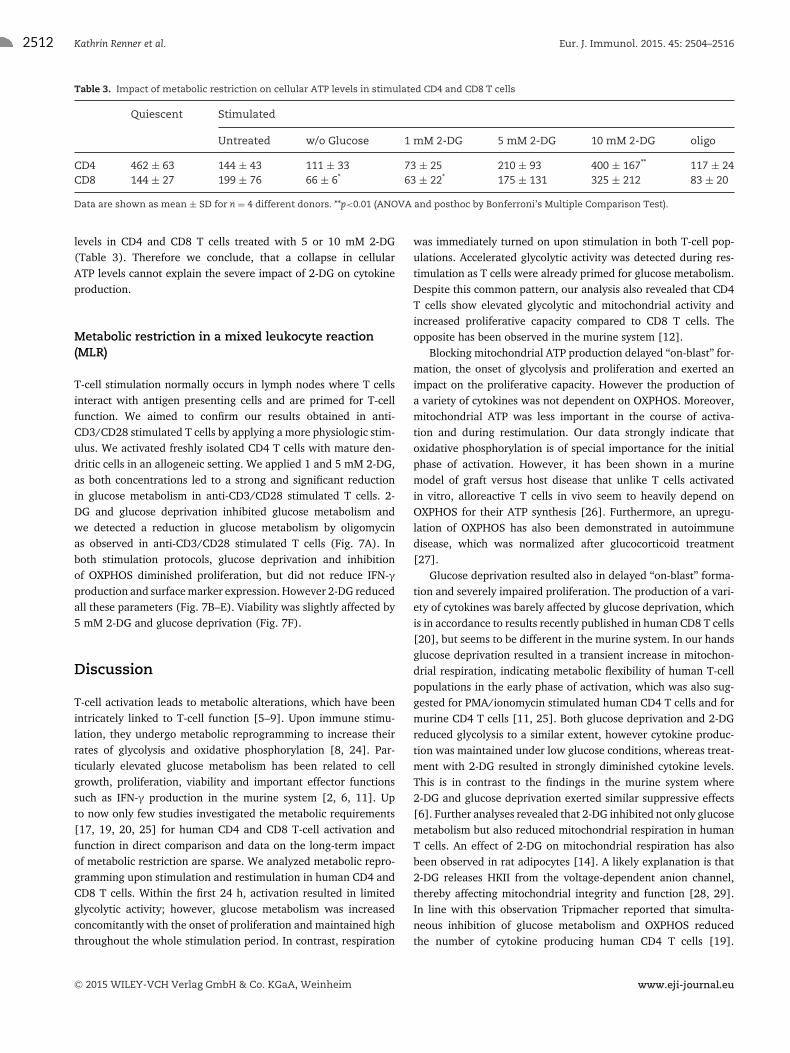
Table 3. Impact of metabolic restriction on cellular ATP levels in stimulated CD4 and CD8 T cells
Quiescent Stimulated
Untreated w/o Glucose 1 mM 2-DG 5 mM 2-DG 10 mM 2-DG oligo
CD4 462 ± 63 144 ± 43 111 ± 33 73 ± 25 210 ± 93 400 ± 167** 117 ± 24CD8 144 ± 27 199 ± 76 66 ± 6* 63 ± 22* 175 ± 131 325 ± 212 83 ± 20
Data are shown as mean ± SD for n = 4 different donors. **p<0.01 (ANOVA and posthoc by Bonferroni’s Multiple Comparison Test).
levels in CD4 and CD8 T cells treated with 5 or 10 mM 2-DG(Table 3). Therefore we conclude, that a collapse in cellularATP levels cannot explain the severe impact of 2-DG on cytokineproduction.
Metabolic restriction in a mixed leukocyte reaction(MLR)
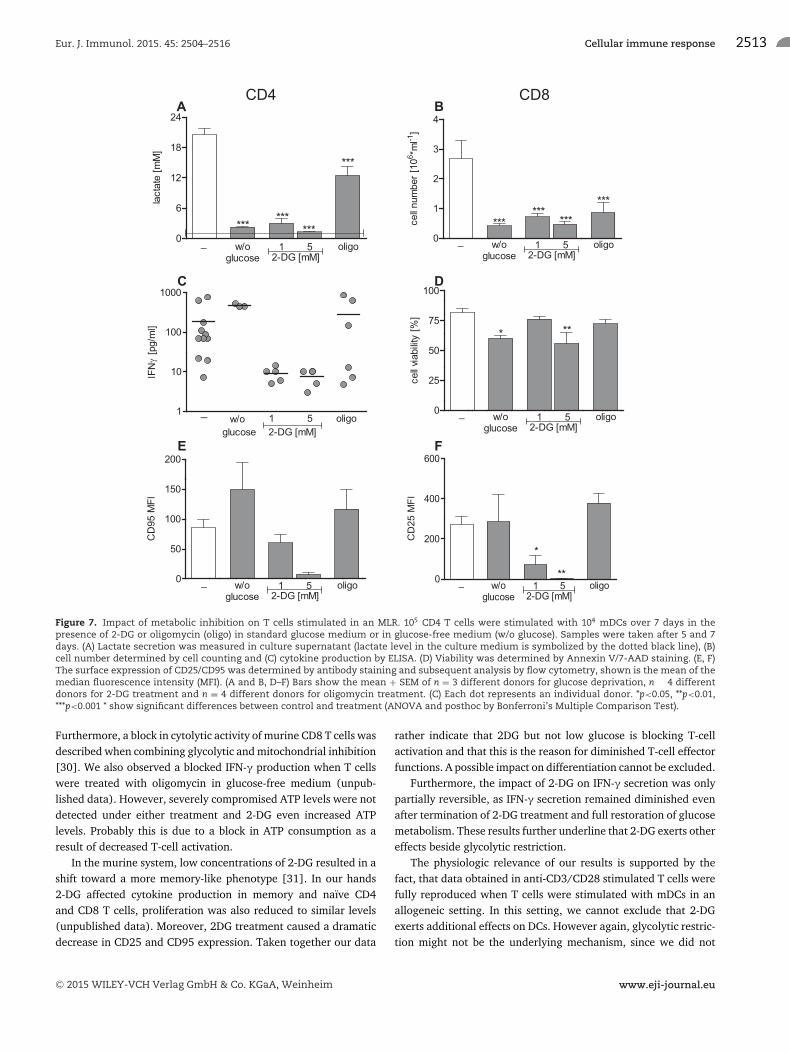
T-cell stimulation normally occurs in lymph nodes where T cellsinteract with antigen presenting cells and are primed for T-cellfunction. We aimed to confirm our results obtained in anti-CD3/CD28 stimulated T cells by applying a more physiologic stim-ulus. We activated freshly isolated CD4 T cells with mature den-dritic cells in an allogeneic setting. We applied 1 and 5 mM 2-DG,as both concentrations led to a strong and significant reductionin glucose metabolism in anti-CD3/CD28 stimulated T cells. 2-DG and glucose deprivation inhibited glucose metabolism andwe detected a reduction in glucose metabolism by oligomycinas observed in anti-CD3/CD28 stimulated T cells (Fig. 7A). Inboth stimulation protocols, glucose deprivation and inhibitionof OXPHOS diminished proliferation, but did not reduce IFN-γproduction and surface marker expression. However 2-DG reducedall these parameters (Fig. 7B–E). Viability was slightly affected by5 mM 2-DG and glucose deprivation (Fig. 7F).
Discussion
T-cell activation leads to metabolic alterations, which have beenintricately linked to T-cell function [5–9]. Upon immune stimu-lation, they undergo metabolic reprogramming to increase theirrates of glycolysis and oxidative phosphorylation [8, 24]. Par-ticularly elevated glucose metabolism has been related to cellgrowth, proliferation, viability and important effector functionssuch as IFN-γ production in the murine system [2, 6, 11]. Upto now only few studies investigated the metabolic requirements[17, 19, 20, 25] for human CD4 and CD8 T-cell activation andfunction in direct comparison and data on the long-term impactof metabolic restriction are sparse. We analyzed metabolic repro-gramming upon stimulation and restimulation in human CD4 andCD8 T cells. Within the first 24 h, activation resulted in limitedglycolytic activity; however, glucose metabolism was increasedconcomitantly with the onset of proliferation and maintained highthroughout the whole stimulation period. In contrast, respiration
was immediately turned on upon stimulation in both T-cell pop-ulations. Accelerated glycolytic activity was detected during res-timulation as T cells were already primed for glucose metabolism.Despite this common pattern, our analysis also revealed that CD4T cells show elevated glycolytic and mitochondrial activity andincreased proliferative capacity compared to CD8 T cells. Theopposite has been observed in the murine system [12].
Blocking mitochondrial ATP production delayed “on-blast” for-mation, the onset of glycolysis and proliferation and exerted animpact on the proliferative capacity. However the production ofa variety of cytokines was not dependent on OXPHOS. Moreover,mitochondrial ATP was less important in the course of activa-tion and during restimulation. Our data strongly indicate thatoxidative phosphorylation is of special importance for the initialphase of activation. However, it has been shown in a murinemodel of graft versus host disease that unlike T cells activatedin vitro, alloreactive T cells in vivo seem to heavily depend onOXPHOS for their ATP synthesis [26]. Furthermore, an upregu-lation of OXPHOS has also been demonstrated in autoimmunedisease, which was normalized after glucocorticoid treatment[27].
Glucose deprivation resulted also in delayed “on-blast” forma-tion and severely impaired proliferation. The production of a vari-ety of cytokines was barely affected by glucose deprivation, whichis in accordance to results recently published in human CD8 T cells[20], but seems to be different in the murine system. In our handsglucose deprivation resulted in a transient increase in mitochon-drial respiration, indicating metabolic flexibility of human T-cellpopulations in the early phase of activation, which was also sug-gested for PMA/ionomycin stimulated human CD4 T cells and formurine CD4 T cells [11, 25]. Both glucose deprivation and 2-DGreduced glycolysis to a similar extent, however cytokine produc-tion was maintained under low glucose conditions, whereas treat-ment with 2-DG resulted in strongly diminished cytokine levels.This is in contrast to the findings in the murine system where2-DG and glucose deprivation exerted similar suppressive effects[6]. Further analyses revealed that 2-DG inhibited not only glucosemetabolism but also reduced mitochondrial respiration in humanT cells. An effect of 2-DG on mitochondrial respiration has alsobeen observed in rat adipocytes [14]. A likely explanation is that2-DG releases HKII from the voltage-dependent anion channel,thereby affecting mitochondrial integrity and function [28, 29].In line with this observation Tripmacher reported that simulta-neous inhibition of glucose metabolism and OXPHOS reducedthe number of cytokine producing human CD4 T cells [19].
C© 2015 WILEY-VCH Verlag GmbH & Co. KGaA, Weinheim www.eji-journal.eu
Eur. J. Immunol. 2015. 45: 2504–2516 Cellular immune response 2513
0
1
2
3
4
*********
***
_ 1 52-DG [mM]
oligow/oglucose
cell n
umbe
r [10
6 *ml-1
]
0
6
12
18
24
******
***
***_ 1 5
2-DG [mM]oligow/o
glucose
lact
ate
[mM
]
1
10
100
1000
_
glucoseoligow/o 1
2-DG [mM]5
IFNγ
[pg/
ml]
0
25
50
75
100
**
_ 1 52-DG [mM]
oligow/oglucose
cell v
iabi
lity [%
]
*
0
200
400
600
**_ 1 5
2-DG [mM]oligow/o
glucose
CD
25 M
FI
*
0
50
100
150
200
_ 1 52-DG [mM]
oligow/oglucose
CD
95 M
FI
CD8CD4A
C
B
D
E F
Figure 7. Impact of metabolic inhibition on T cells stimulated in an MLR. 105 CD4 T cells were stimulated with 104 mDCs over 7 days in thepresence of 2-DG or oligomycin (oligo) in standard glucose medium or in glucose-free medium (w/o glucose). Samples were taken after 5 and 7days. (A) Lactate secretion was measured in culture supernatant (lactate level in the culture medium is symbolized by the dotted black line), (B)cell number determined by cell counting and (C) cytokine production by ELISA. (D) Viability was determined by Annexin V/7-AAD staining. (E, F)The surface expression of CD25/CD95 was determined by antibody staining and subsequent analysis by flow cytometry, shown is the mean of themedian fluorescence intensity (MFI). (A and B, D–F) Bars show the mean + SEM of n = 3 different donors for glucose deprivation, n � 4 differentdonors for 2-DG treatment and n = 4 different donors for oligomycin treatment. (C) Each dot represents an individual donor. *p<0.05, **p<0.01,***p<0.001 * show significant differences between control and treatment (ANOVA and posthoc by Bonferroni’s Multiple Comparison Test).
Furthermore, a block in cytolytic activity of murine CD8 T cells wasdescribed when combining glycolytic and mitochondrial inhibition[30]. We also observed a blocked IFN-γ production when T cellswere treated with oligomycin in glucose-free medium (unpub-lished data). However, severely compromised ATP levels were notdetected under either treatment and 2-DG even increased ATPlevels. Probably this is due to a block in ATP consumption as aresult of decreased T-cell activation.
In the murine system, low concentrations of 2-DG resulted in ashift toward a more memory-like phenotype [31]. In our hands2-DG affected cytokine production in memory and naıve CD4and CD8 T cells, proliferation was also reduced to similar levels(unpublished data). Moreover, 2DG treatment caused a dramaticdecrease in CD25 and CD95 expression. Taken together our data
rather indicate that 2DG but not low glucose is blocking T-cellactivation and that this is the reason for diminished T-cell effectorfunctions. A possible impact on differentiation cannot be excluded.
Furthermore, the impact of 2-DG on IFN-γ secretion was onlypartially reversible, as IFN-γ secretion remained diminished evenafter termination of 2-DG treatment and full restoration of glucosemetabolism. These results further underline that 2-DG exerts othereffects beside glycolytic restriction.
The physiologic relevance of our results is supported by thefact, that data obtained in anti-CD3/CD28 stimulated T cells werefully reproduced when T cells were stimulated with mDCs in anallogeneic setting. In this setting, we cannot exclude that 2-DGexerts additional effects on DCs. However again, glycolytic restric-tion might not be the underlying mechanism, since we did not
C© 2015 WILEY-VCH Verlag GmbH & Co. KGaA, Weinheim www.eji-journal.eu
2514 Kathrin Renner et al. Eur. J. Immunol. 2015. 45: 2504–2516
observe an impact on cytokine production and surface markerexpression by glucose deprivation.
Taken together, effector functions in human T-cell populationsare hardly affected under conditions of restricted glycolytic ormitochondrial activity, but suppression of both pathways resultsin severely compromised T-cell function. This is of physiologic rele-vance as limited oxygen tension and nutrient availability occur alsoin vivo in inflamed tissues or in the tumor microenvironment. Via-bility of anti-CD3/CD28 stimulated T cells was maintained undercomplete metabolic restriction. In contrast to PMA/ionomycinstimulated human CD4 T cells which undergo apoptosis under sim-ilar metabolic conditions [25]. This might be explained by immedi-ate and stronger glycolytic activity of PMA/ionomycin stimulatedT cells (Supporting Information Fig. 1). Analysis of the relationbetween metabolism and human T-cell function in comparison tothe murine system is of consequence for the testing in mice ofanti-metabolic drugs for the treatment of autoimmune and malig-nant diseases [32]. The application of anti-glycolytic drugs is anemerging strategy in cancer treatment, affecting tumor cells itselfand simultaneously reducing the secretion of immunosuppres-sive metabolites such as lactic acid [33]. Based on our findingsit seems conceivable to sustain T-cell effector function when tar-geting either glycolysis or respiration. However caution is advisedwhen protocols are developed to inhibit both pathways simulta-neously [34, 35], hence the sequential application of metabolicinhibitors could preserve T-cell function.
Materials and methods
T-cell isolation, stimulation and cultivation
The study was approved by the local ethical committee; all humanparticipants gave written informed consent. Human T cells andmonocytes were isolated from PBMCs of healthy donors. CD4and CD8 subpopulations were enriched by Miltenyi ((MiltenyiBiotec GmbH, Bergisch Gladbach, Germany) magnetic bead sep-aration, achieving more than 98% purity. Naıve, central mem-ory and effector memory T cells were isolated by specific sur-face marker staining and cell sorting with the FACSAria (detailsare given in the Supporting Information Fig. 9). Stimulation ofT cells was performed either with anti-CD3/CD28 beads (Gibco,Life Technologies, Darmstadt, Germany) at a cell-to-bead ratio of1:1 or with PMA (20 nM) and ionomycin (1 μM) or in mixed lym-phocyte reaction (MLR) with allogeneic mature dendritic cells.T cells were cultured in RPMI 1640 medium supplemented with10% human AB serum, 2 mM glutamine (PAN-Biotech GmbH,Aidenbach, Germany), essential and nonessential vitamins, pyru-vate, β-mercapthoethanol, penicillin and streptomycin (all GibcoLife Technologies, Darmstadt, Germany) and 100IU/mL rhIL-2(PeproTech, Hamburg, Germany) in a humidified atmosphere (5%CO2, 95% air) at 37°C (Heraeus Incubator). Cell number and cellsize were determined using the CASY system (Roche Innovartis,Bielefeld, Germany).
Metabolic restriction
Glucose metabolism was inhibited by applying 2-DG or stimula-tion in glucose-free RPMI 1640 supplemented with all additiveslisted above including 10% AB serum, which resulted in a finalconcentration of 0.4 mM glucose in comparison to 10.4 mM instandard RPMI. Mitochondrial ATP production was inhibited bycomplex V inhibitor oligomycin (final concentration 5 μM). Stabil-ity over time was controlled in preliminary experiments revealingblocked mitochondrial respiration over 7 days.
Flow cytometry
T cells were stained with anti-CD137 (eBioscience, Frankfurt amMain, Germany), anti-CD25 and anti-CD95 (both BD Pharmingen,Heidelberg, Germany), quiescent cells were stained as negativecontrols. Apoptosis was determined by Annexin V/7-AAD stain-ing (BD Pharmingen, Heidelberg, Germany). Flow cytometry wasperformed using BD FACS Calibur instrument (Becton Dickinson,San Jose, CA, USA), data were analyzed with the FlowJo software.Gating strategies are shown in the Supporting Information Figures10 and 11.
Determination of cytokines
Cytokine secretion was determined in culture supernatants bycommercially available enzyme-linked immunosorbent assays(ELISA; R&D Systems, Minneapolis, MN, USA) according to themanufacturer’s protocol.
Determination of glycolytic and mitochondrial activity
Medium glucose concentration was measured by a commerciallyavailable kit (R-Biopharm, Darmstadt, Germany). Lactate con-centration was determined enzymatically using an ADVIA 1650instrument (Bayer, Tarrytown, NY, USA) and specific reagents(Roche, Mannheim, Germany). Extracellular acidification rate(ECAR, mpH/min) was measured in nonbuffered RPMI-1640medium (Sigma Aldrich) using an XFp extracellular flux ana-lyzer (Seahorse Bioscience, Billerica, MA, USA). CD4 and CD8T cells were immobilized onto Seahorse cell plates (0.3 × 10⁶cells per well) coated with Corning R© Cell-TakTM Cell and Tis-sue Adhesive referring to the manufacturer’s protocol. Glycolyticactivity was determined as the conversion of [1,2-13C2]glucose(10 mM) to [2,3-13C]lactate in culture supernatants (see Sup-porting Information Data). Respiration was determined under cellculture conditions by the PreSens technology (PreSens PrecisionSensing GmbH, Regensburg, Germany) and with the oxygraphO2-k (Oroboros Instruments, Innsbruck, Austria). Detailed infor-mation is given in Supporting Information Data. Citrate synthaseactivity was determined as described [36].
C© 2015 WILEY-VCH Verlag GmbH & Co. KGaA, Weinheim www.eji-journal.eu
Eur. J. Immunol. 2015. 45: 2504–2516 Cellular immune response 2515
ATP measurement
Cellular ATP levels were determined by a commercial kit (ATPdetermination kit, Life Technologies) according to the manufac-turer’s protocol.
Reverse transcription–quantitative real-time PCR(RT-qPCR)
Total RNA was isolated from T cells using RNeasy Spin Columns(Qiagen, Hilden, Germany). Reverse transcription was performedwith 500 ng RNA in a total volume of 20 μL using M-MLV ReverseTranscriptase (Promega, Mannheim, Germany). To quantify geneexpression, the Mastercyler Ep Realplex (Eppendorf, Hamburg,Germany) was used. For RT-qPCR 1 μL cDNA, 1 μL of specificprimers or 0.5 μL of 18S primers (10 μM) and 5 μL QuantiFastSYBR Green PCR Kit (Qiagen, Hilden, Germany) in a total of10 μL were applied. Primer sequences are listed in SupportingInformation Table 1. All data were normalized to 18S RNA, whichwas stably expressed.
Chemicals
Unless noted otherwise, all chemicals were purchased from Sigma(Deisenhofen, Germany).
Statistical analysis
Statistics were performed using the GraphPad 5 software. Signif-icance was determined by ANOVA and posthoc by Bonferroni’sMultiple Comparison Test as well as the Students t-test paired andtwo-tailed.
Acknowledgements: The study was supported by the Regens-burg Center for Interventional Immunology (RCI, principal fund-ing recipient Prof. Marina Kreutz) and the KFO262 (DFG, princi-pal funding recipients Prof. Wolfgang Herr, Dr. Kathrin Renner-Sattler).
Conflict of interest: The authors declare no financial or commer-cial conflict of interest.
References
1 Finlay, D. and Cantrell, D. A., Metabolism, migration and memory in
cytotoxic T cells. Nat. Rev. Immunol. 2011. 11: 109–117.
2 Pearce, E. L., Poffenberger, M. C., Chang, C. H. and Jones, R. G., Fueling
immunity: insights into metabolism and lymphocyte function. Science
2013. 342: 1242454.
3 van der Windt, G. J. and Pearce, E. L., Metabolic switching and fuel choice
during T-cell differentiation and memory development. Immunol. Rev.
2012. 249: 27–42.
4 Wang, R. and Green, D. R., Metabolic checkpoints in activated T cells.
Nat. Immunol. 2012. 13: 907–915.
5 Marko, A. J., Miller, R. A., Kelman, A. and Frauwirth, K. A., Induc-
tion of glucose metabolism in stimulated T lymphocytes is regulated
by mitogen-activated protein kinase signaling. PLoS One 2010. 5: e15425.
6 Cham, C. M. and Gajewski, T. F., Glucose availability regulates IFN-
gamma production and p70S6 kinase activation in CD8+ effector T cells.
J. Immunol. 2005. 174: 4670–4677.
7 Jacobs, S. R., Herman, C. E., Maciver, N. J., Wofford, J. A., Wieman, H.
L., Hammen, J. J. and Rathmell, J. C., Glucose uptake is limiting in T cell
activation and requires CD28-mediated Akt-dependent and independent
pathways. J. Immunol. 2008. 180: 4476–4486.
8 Wang, R., Dillon, C. P., Shi, L. Z., Milasta, S., Carter, R., Finkelstein, D.,
McCormick, L. L. et al., The transcription factor Myc controls metabolic
reprogramming upon T lymphocyte activation. Immunity 2011. 35: 871–
882.
9 Carr, E. L., Kelman, A., Wu, G. S., Gopaul, R., Senkevitch, E., Aghvanyan,
A., Turay, A. M. et al., Glutamine uptake and metabolism are coordinately
regulated by ERK/MAPK during T lymphocyte activation. J. Immunol. 2010.
185: 1037–1044.
10 Macintyre, A. N., Gerriets, V. A., Nichols, A. G., Michalek, R. D., Rudolph,
M. C., Deoliveira, D., Anderson, S. M. et al., The glucose transporter Glut1
is selectively essential for CD4 T cell activation and effector function. Cell
Metab. 2014. 20: 61–72.
11 Chang, C. H., Curtis, J. D., Maggi, L. B., Jr., Faubert, B., Villarino, A. V.,
O’Sullivan, D., Huang, S. C. et al., Posttranscriptional control of T cell
effector function by aerobic glycolysis. Cell 2013. 153: 1239–1251.
12 Cao, Y., Rathmell, J. C. and Macintyre, A. N., Metabolic reprogramming
towards aerobic glycolysis correlates with greater proliferative ability
and resistance to metabolic inhibition in CD8 versus CD4 T cells. PLoS
One 2014. 9: e104104.
13 MacDonald, H. R. and Cerottini, J. C., Inhibition of T cell-mediated cytol-
ysis by 2-deoxy-D-glucose:dissociation of the inhibitory effect from gly-
coprotein synthesis. Eur. J. Immunol. 1979. 9: 466–470.
14 Chandramouli, V. and Carter, J. R., Jr., Metabolic effects of 2-deoxy-D-
glucose in isolated fat cells. Biochim. Biophys. Acta 1977. 496: 278–291.
15 Sena, L. A., Li, S., Jairaman, A., Prakriya, M., Ezponda, T., Hildeman, D.
A., Wang, C. R. et al., Mitochondria are required for antigen-specific T
cell activation through reactive oxygen species signaling. Immunity 2013.
38: 225–236.
16 Newsholme, E. A., Crabtree, B. and Ardawi, M. S., Glutamine metabolism
in lymphocytes: its biochemical, physiological and clinical importance.
Q. J. Exp. Physiol.1985. 70: 473–489.
17 Frauwirth, K. A., Riley, J. L., Harris, M. H., Parry, R. V., Rathmell, J. C.,
Plas, D. R., Elstrom, R. L. et al., The CD28 signaling pathway regulates
glucose metabolism. Immunity 2002. 16: 769–777.
18 Chang, W. K., Yang, K. D. and Shaio, M. F., Effect of glutamine on Th1
and Th2 cytokine responses of human peripheral blood mononuclear
cells. Clin. Immunol. 1999. 93: 294–301.
19 Tripmacher, R., Gaber, T., Dziurla, R., Haupl, T., Erekul, K., Grutzkau,
A., Tschirschmann, M. et al., Human CD4(+) T cells maintain specific
functions even under conditions of extremely restricted ATP production.
Eur. J. Immunol. 2008. 38: 1631–1642.
C© 2015 WILEY-VCH Verlag GmbH & Co. KGaA, Weinheim www.eji-journal.eu
2516 Kathrin Renner et al. Eur. J. Immunol. 2015. 45: 2504–2516
20 Gubser, P. M., Bantug, G. R., Razik, L., Fischer, M., Dimeloe, S., Hoenger,
G., Durovic, B. et al., Rapid effector function of memory CD8+ T cells
requires an immediate-early glycolytic switch. Nat. Immunol. 2013. 14:
1064–1072.
21 Altman, B. J. and Dang, C. V., Normal and cancer cell metabolism: lym-
phocytes and lymphoma. FEBS J. 2012. 279: 2598–2609.
22 Galon, J., Costes, A., Sanchez-Cabo, F., Kirilovsky, A., Mlecnik, B.,
Lagorce-Pages, C., Tosolini, M. et al., Type, density, and location of
immune cells within human colorectal tumors predict clinical outcome.
Science 2006. 313: 1960–1964.
23 Gerriets, V. A., Kishton, R. J., Nichols, A. G., Macintyre, A. N., Inoue,
M., Ilkayeva, O., Winter, P. S. et al., Metabolic programming and PDHK1
control CD4+ T cell subsets and inflammation. J. Clin. Invest. 2015. 125:
194–207.
24 Finlay, D. K., Rosenzweig, E., Sinclair, L. V., Feijoo-Carnero, C., Hukel-
mann, J. L., Rolf, J., Panteleyev, A. A. et al., PDK1 regulation of mTOR and
hypoxia-inducible factor 1 integrate metabolism and migration of CD8+T cells. J. Exp. Med. 2012. 209: 2441–2453.
25 Dziurla, R., Gaber, T., Fangradt, M., Hahne, M., Tripmacher, R., Kolar, P.,
Spies, C. M. et al., Effects of hypoxia and/or lack of glucose on cellular
energy metabolism and cytokine production in stimulated human CD4+T lymphocytes. Immunol. Lett. 2010. 131: 97–105.
26 Gatza, E., Wahl, D. R., Opipari, A. W., Sundberg, T. B., Reddy, P., Liu, C.,
Glick, G. D. et al., Manipulating the bioenergetics of alloreactive T cells
causes their selective apoptosis and arrests graft-versus-host disease.
Sci. Transl. Med. 2011. 3: 67ra68.
27 Kuhnke, A., Burmester, G. R., Krauss, S. and Buttgereit, F., Bioenerget-
ics of immune cells to assess rheumatic disease activity and efficacy of
glucocorticoid treatment. Annal. Rheumatic Dis. 2003. 62: 133–139.
28 Eberhart, K., Renner, K., Ritter, I., Kastenberger, M., Singer, K., Heller-
brand, C., Kreutz, M. et al., Low doses of 2-deoxy-glucose sensitize
acute lymphoblastic leukemia cells to glucocorticoid-induced apoptosis.
Leukemia 2009. 23: 2167–2170.
29 Gottlob, K., Majewski, N., Kennedy, S., Kandel, E., Robey, R. B. and Hay,
N., Inhibition of early apoptotic events by Akt/PKB is dependent on the
first committed step of glycolysis and mitochondrial hexokinase. Genes
Dev. 2001. 15: 1406–1418.
30 MacDonald, H. R. and Koch, C. J., Energy metabolism and T-cell-mediated
cytolysis. I. Synergism between inhibitors of respiration and glycolysis.
J. Exp. Med. 1977. 146: 698–709.
31 Sukumar, M., Liu, J., Ji, Y., Subramanian, M., Crompton, J. G., Yu, Z.,
Roychoudhuri, R. et al., Inhibiting glycolytic metabolism enhances CD8+T cell memory and antitumor function. J. Clin. Invest. 2013. 123: 4479–4488.
32 Murray, C. M., Hutchinson, R., Bantick, J. R., Belfield, G. P., Benjamin, A.
D., Brazma, D., Bundick, R. V. et al., Monocarboxylate transporter MCT1
is a target for immunosuppression. Nat. Chem. Biol. 2005. 1: 371–376.
33 Fischer, K., Hoffmann, P., Voelkl, S., Meidenbauer, N., Ammer, J., Edinger,
M., Gottfried, E. et al., Inhibitory effect of tumor cell-derived lactic acid
on human T cells. Blood 2007. 109: 3812–3819.
34 Doherty, J. R., Yang, C., Scott, K. E., Cameron, M. D., Fallahi, M., Li, W.,
Hall, M. A. et al., Blocking lactate export by inhibiting the Myc target
MCT1 disables glycolysis and glutathione synthesis. Cancer Res. 2014. 74:
908–920.
35 Marchiq, I., Le Floch, R., Roux, D., Simon, M. P. and Pouyssegur, J.,
Genetic disruption of lactate/H+ symporters (MCTs) and their subunit
CD147/BASIGIN sensitizes glycolytic tumor cells to phenformin. Cancer
Res. 2015. 75: 171–180.
36 Bergmeier, H. U., Methoden der enzymatischen Analyse. Akademie Verlag,
Berlin: 1970.
Abbreviations: 2-DG: 2-deoxy-glucose · ECAR: extracellular acidification
rate · ETS: electron transfer system · GAPDH: glyceraldehyde-3 phos-
phate dehydrogenase · GLUT: glucose transporter · HK: hexokinase ·LDHA: lactate dehydrogenase A · MCT: monocarboxylate transporter ·oligo: oligomycin · ROX: residual oxygen consumption · OXPHOS: oxida-
tive phosphorylation
Full correspondence: Dr. Kathrin Renner, Department of InternalMedicine III, University Hospital Regensburg, D-93053, Regensburg,GermanyFax: +49-941-944-5593e-mail: [email protected]
See accompanying Commentary:http://dx.doi.org/10.1002/eji.201545885
Received: 14/1/2015Revised: 18/6/2015Accepted: 24/6/2015Accepted article online: 26/6/2015
C© 2015 WILEY-VCH Verlag GmbH & Co. KGaA, Weinheim www.eji-journal.eu


![cover prosiding xiii 2504[1]](https://img.pdfslide.net/doc/110x75/615702d5a097e25c765010ad/cover-prosiding-xiii-25041.jpg)