Embed Size (px)
Citation preview
1
Metabolome variability in crop plant species – when, where, how much and
so what?
Howard V. Davies*,1, Louise V. T. Shepherd1, Derek Stewart1, Thomas Frank2, Richard
Röhlig2, Karl-Heinz Engel2
1Plant Products and Food Quality Programme, Scottish Crop Research Institute, Invergowrie,
Dundee DD2 5DA, Scotland.
2Technische Universität München, Lehrstuhl für Allgemeine Lebensmitteltechnologie,
Maximus-von-Imhof-Forum 2, D-85350 Freising-Weihenstephan, Germany.
*Corresponding author; Email [email protected]; Tel: +44(0) 1382 568513; Fax:
+44(0) 1382 568503

2
Abstract
“Omics” technologies provide coverage of gene, protein and metabolite analysis that is
unsurpassed compared with traditional targeted approaches. There are a growing number of
examples indicating that profiling approaches can be used to expose significant sources of
variation in the composition of crop and model plants caused by genetic background, breeding
method, growing environment (site, season), genotype X environment interactions and crop
cultural practices to name but a few. Whilst breeders have long been aware of such variation
from tried and tested targeted analytical approaches, the broad-scale, so called “unbiased“
analysis of the metabolome now possible, offers a major upside to our understanding of the
true extent of variation in a plethora of metabolites relevant to human and animal health and
nutrition. Metabolomics is helping to provide targets for plant breeding by linking gene
expression, and allelic variation to variation in metabolite complement (functional genomics),
and is also being deployed to better assess the potential impacts of climate change and
reduced input agricultural systems on crop composition. This review will provide examples
of the factors driving variation in the metabolomes of crop species.
Keywords: Potato, metabolomics, biodiversity, life cycle analysis, food quality and safety.

3
Introduction
Plant breeding in its many guises, be it conventional, marker assisted, or genetically
modified (GM) drives the production of new varieties required to compete successfully in the
complex global agricultural marketplace, with increasing emphasis on the use of early
landrace varieties and wild species to introduce the new genes and alleles required to improve
pest and disease resistance, quality and yield (Fernie et al., 2006 and references therein).
There are also growing demands for germplasm adapted to deal with changing climates and
which are effective under a range of cultural practices including low input and organic
systems. In addition, there are clearly demands from the market for foods with higher
nutritional value and which do not compromise high safety standards present in the current
food chain.
Targeted analysis of specific key compounds, using well established and validated
protocols, has provided the cornerstone for assessing the nutritional value and safety of
cultivated crop species. Thus we have accumulated a significant body of data on natural
variation in nutrients and anti-nutrient contents for crops and cultivars with a history of safe
use (see International Life Science Institute (ILSI) at www.cropcomposition.org; Ridley et al.,
2004). Such information provides a benchmark against which the new generations of crops
and advances in production systems can be evaluated. Genetic background, growing
environment (geographical, seasonal) and crop management practices are major factors
underpinning this variation. Genetic changes induced by selective breeding are such that
major domesticated crops are typically represented by hundreds, even thousands, of unique
cultivars specialised for production in a wide variety of geographic regions. Thus databases
will be representative and never complete.
Non-Targeted Approaches and Detection of Unintended Effects

4
A fuller evaluation of the compositional variation of raw agricultural commodities and
downstream products will emerge through the development of comparative metabolomics
databases which can be expanded and modified by the international community. This
information can be used to benchmark any measured differences between a particular crop
against the extent of "acceptable" variation within the framework of a history of safe use
of the crop species in question. There is an ongoing debate over the potential value of much
broader scale, more unbiased analytical approaches including metabolomics in risk
assessment which, through the quantity of data they generate, may help to identify effects
which could stimulate the need for further risk assessment, and reduce the level of uncertainty
that unintended effects have occurred. Most of this debate has clearly focused on GM crops
but it is already clear from metabolomic analyses that significant natural variation exists
within crop gene pools, accentuated by interactions with the prevailing environment.
Metabolomics clearly has much to offer in developing new insights into the regulation of
plant metabolism but it must be recognised that the technology has limitations. The plant
kingdom may contain between 90,000 and 200,000 metabolites (Dixon and Strack, 2003),
although for a single species the number may approach a few thousand (the estimate for
Arabidopsis is ca. 5000). Thus full coverage of the metabolome is a real challenge. Analysis
is also challenging as the technology produces vast amounts of data. Various data mining
approaches are being used to analyze these large data sets (e.g. cluster analysis, principal
component analysis [PCA]). PCA can be used to assist the researcher in identifying non-
random patterns that can be further explored (possibly using targets analytical approaches). A
number of initiatives have looked towards developing standards for metabolomics data in
addition to a range of technology-specific and general data formats (see Hardy and Taylor,
2007; Davies, 2010 and references therein).
This paper reviews the use of metabolomics to assess natural variation and also focuses on
some case studies in more detail. The review includes reference to the use of metabolomics

5
to compare GM crops with their conventional comparators as this is an important debating
point for the conference. The review will not cover the various metabolomic technologies
and the reader is referred to Schauer and Fernie (2006), Hall (2006) and Davies (2009).
General Observations - The UK Food Standards Agency GO2 Programme
Probably one of the largest publically funded programmes commissioned to assess the
potential use of “omics” approaches in comparative analysis and their relevance to risk
assessment was the GO2 programmed launched by the UK Food Standards Agency. The full
report can be found at http://www.food.gov.uk/multimedia/pdfs/g02report. This three-year
research programme was launched in September 2001, with funding of £5.5M provided by
the UK Treasury Department, focusing on the applicability and practicality of a variety of
existing and emerging techniques for the safety assessment procedures for the next generation
of GM foods. The programme examined the use of transcriptomic, proteomic and
metabolomic techniques in a number of different plant species including potato, barley,
tomato and Arabidopsis.
With regard to metabolomics, Nuclear Magnetic Resonance (NMR) spectroscopy proved
to be a rapid, reproducible and robust technique for metabolite profiling and detected one
unidentified, possibly novel, metabolite in barley which was increased in all 5 transgenic lines
studied. However, there were fewer overall changes seen in the metabolome of GM wheat
than of GM barley, possibly due to barley having a diploid genome, whereas wheat is
hexaploid (i.e. the more genome copies present in a plant the more likely it is that other alleles
compensate). It was considered unlikely that this level of difference would be detected with
targeted analytical methods. One research group identified a number of metabolites in non-
GM potatoes that had not previously been described in crop plants, indicating the potential
value of untargeted metabolomic analysis (Parr et al., 2005). Metabolomics publications
arising from the FSA projects observed that the differences between standard varieties were

6
always significantly greater than the differences between the wild-types and their respective
transgenics (Defernez et al., 2004; Catchpole et al., 2005); this despite the fact that some GM
lines had very distinct morphological phenotypes.
The review concluded that methods developed in this extensive research programme were
successful at detecting unintended changes resulting from transgene insertion into plants
However, the vast majority of these changes were small (ca. 2-fold or less) with evidence
provided that at least some of these changes may be due to somaclonal variation resulting
from the in vitro manipulation of plants rather than the presence of an inserted transgene per
se. It is also clear that differences in the metabolome between plants grown in different
environments, and even different cultivars of the same species grown in the same
environment, were often greater than the effect of the transgene itself. However, the studies
focused on transgenic plants with specific genes and modified traits, and one cannot
generalise about the potential for unintended effects in all GM organisms (GMOs). A case-
by-case approach remains pragmatic.
Specific Case Studies
1. Maize
Targeted studies of maize kernels have demonstrated the impact of factors such as
developmental stage (Seebauer et al., 2004), environment and farming practice (Harrigan et
al., 2007a,b), and genetic background and growing seasons (Reynolds et al., 2005; Ridley et
al., 2004) on the natural variability of metabolites. In addition to the targeted analyses of
individual compounds, metabolite profiling techniques have been shown to be useful tools for
the investigation of complex plant matrices (Lozovaya et al., 2006; Castro and Manetti,
2007). More recently, the EU project SAFEFOODS (www.safefoods.nl) has used maize as

7
one target species to assess the use of metabolomics to assess the major drivers of natural
variation. Some of the data arising from this project are provided below.
1.1 Differentiation of Maize Varieties
Metabolites from four maize cultivars (cv. Flavi, Lukas, Pontos and Shorty), grown over
three seasons (2004, 2005 and 2006) at one location (Frankendorf) in Bavaria (Germany),
were profiled using methodology described by Röhlig et al. (2009). This procedure results in
four fractions containing fatty acid methyl esters and hydrocarbons (fraction I), free fatty
acids, alcohols and sterols (fraction II), sugars and sugar alcohols (fraction III), acids, amino
acids and amines (fraction IV). Metabolite profiling data from the combined four fractions I-
IV obtained for the four cultivars were statistically assessed via PCA to determine the major
sources of variation within the dataset (Figure 1). On the basis of the data from all four
fractions, each genotype could be clearly distinguished in 2004 (Figure 1A) but in subsequent
years cv. Pontos was not easily discriminated (Figures 1B and 1C). The combined data from
all three growing seasons (2004-2006) did not allow a separation of cultivars (Figure 1D) but
revealed a clear clustering according to growing season (Figure 1E). The data therefore
indicate a more pronounced impact of growing season than of genetic background on the
natural variability of metabolites.
The metabolic variability, expressed by the number of statistically significant (p < 0.05)
differences in metabolite levels between the four cultivars (20% in 2004, 15% in 2005 and
25% in 2006) was in the same order of magnitude as observed for low phytic acid maize
mutants. Application of a Gas Chromatography-Mass Spectrometry (GC-MS) metabolite
profiling approach revealed 11% to 30 % of the detected compounds to be statistically
significantly different (p < 0.05) between wild-type maize and low phytic acid maize mutants
(Hazebroek et al., 2007). A study investigating the nutritional and metabolic profiles of
8
different maize hybrids via targeted analyses of 47 analytes revealed statistically significant
differences ranging from 33% to 47% of total comparisons (Reynolds et al., 2005).
1.2 Influence of Growing Location
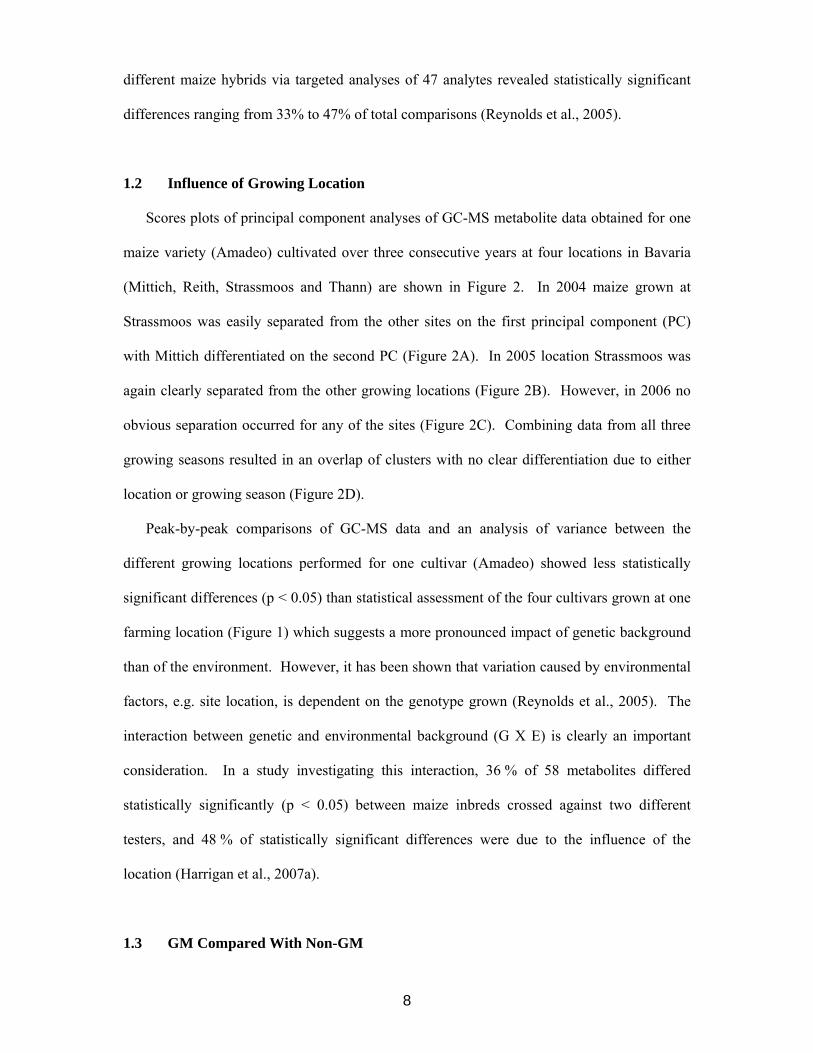
Scores plots of principal component analyses of GC-MS metabolite data obtained for one
maize variety (Amadeo) cultivated over three consecutive years at four locations in Bavaria
(Mittich, Reith, Strassmoos and Thann) are shown in Figure 2. In 2004 maize grown at
Strassmoos was easily separated from the other sites on the first principal component (PC)
with Mittich differentiated on the second PC (Figure 2A). In 2005 location Strassmoos was
again clearly separated from the other growing locations (Figure 2B). However, in 2006 no
obvious separation occurred for any of the sites (Figure 2C). Combining data from all three
growing seasons resulted in an overlap of clusters with no clear differentiation due to either
location or growing season (Figure 2D).
Peak-by-peak comparisons of GC-MS data and an analysis of variance between the
different growing locations performed for one cultivar (Amadeo) showed less statistically
significant differences (p < 0.05) than statistical assessment of the four cultivars grown at one
farming location (Figure 1) which suggests a more pronounced impact of genetic background
than of the environment. However, it has been shown that variation caused by environmental
factors, e.g. site location, is dependent on the genotype grown (Reynolds et al., 2005). The
interaction between genetic and environmental background (G X E) is clearly an important
consideration. In a study investigating this interaction, 36 % of 58 metabolites differed
statistically significantly (p < 0.05) between maize inbreds crossed against two different
testers, and 48 % of statistically significant differences were due to the influence of the
location (Harrigan et al., 2007a).
1.3 GM Compared With Non-GM

9
Current safety assessment procedures developed for GM crops are primarily based on a
targeted compositional analysis of specific safety and nutrition-related compounds (OECD,
1993; FAO/WHO, 2000). Non-targeted metabolite profiling approaches could represent an
additional tool to be used in the risk assessment of GM crops (see Davies 2009 and references
therein). In such cases metabolite profiles of the GM should not only be compared with the
corresponding parental line, but should also be assessed in the light of natural variability of
metabolic profiles of conventional crop material (see EFSA guidance document).
To assess the influence of genetic modification under different environmental conditions,
a GM maize line (Bt-maize) was grown together with its near isogenic line at three locations
in South Africa (Petit, Potchefstroom, Lichtenburg) in 2004. At Petit and Lichtenburg,
Roundup ready-maize was also grown together with the Bt-maize and the isogenic line. In
addition, the maize lines were grown for two additional years (2005 and 2006) at Petit.
Statistical assessment (via PCA) of the metabolite profiling data from the samples grown at
the three locations in 2004 revealed clear separations of the GM line(s) from the respective
isogenic line at Potchefstroom and Lichtenburg (Figure 3). For the maize lines grown over
three years at Petit, a distinct separation of both GM lines was observed for the location Petit
in 2006; the separation of GM lines from the isogenic maize line was less pronounced for this
location in 2004 and 2005. However, despite partly obvious differences between GM lines
and isogenic maize determined for one location / year, no separations of the different maize
lines were detectable when combining the metabolite profiling data obtained from GM lines
and isogenic maize for all growing locations/years (Figure 3). This confirms that, at least in
the case of the specific GMOs analysed, the effect of environment (location, year) was more
pronounced than that of the genetic background (GM, non-GM).
Similar data have been presented for wheat where Baker et al (2006) showed that
differences observed between GM and the control lines were generally within the same range

10
as the differences observed between the control lines grown on different sites and in different
years.
2. Rice (Mutated, Low Phytate)
A range of crops (e.g. rice, maize, barley, wheat) have been developed with lowered
contents of the anti-nutrient phytic acid (Raboy, 2007). Low phytic acid (lpa) crops have
been produced by genetic engineering (Shi et al., 2007) and by mutation breeding through
chemical mutagenesis (Wilcox et al., 2000) and γ-irradiation (Yuan et al., 2007). Low phytic
acid crop mutants are typically selected on the basis of their altered levels of inorganic
phosphorous (Pi). However, in addition to altered levels of phytic acid and Pi, the induced
mutations were shown to result in further metabolic changes in these crops (Hitz et al., 2002;
Frank et al., 2007, 2009).
Metabolomic analysis has been carried out on two lpa rice mutants (Os-lpa-XS110-1 and
Os-lpa-XS110-2), generated by γ-irradiation of the corresponding wild-type rice (Xiushui
110) and grown at five field trials in China in 2005/2006. PCA of the polar fractions III
(sugars and sugar alcohols) and IV (acids, amino acids and amines) are shown in Figure 4.
The mutant Os-lpa-XS110-1 is separated consistently from the wild-type Xiushui 110 in all
field trials indicating a strong influence of the mutation on the polar metabolite profiles in this
mutant. Whilst the variance between the mutant Os-lpa-XS110-2 and the wild-type is less
pronounced, the rice lines were well differentiated by growing location. Samples grown at
different locations, e.g. Hainan and Jiaxing, were clearly separated from each other which
confirms the influence of the environment-related biological / natural variability of the
metabolite spectrum in the rice wild-types and the lpa mutants.
To identify the compositional differences only caused by the mutations, a univariate
analysis was performed. Results obtained by the comparative univariate assessment of the lpa
mutant and the corresponding wild-type metabolites are shown in Table 1. For the

11
comparison of the wild-type Xiushui 110 and the lpa mutants Os-lpa-XS110-1 and Os-lpa-
XS110-2, on average, a total of 126 and 113 peaks were included for comparison of which
40% and 26% were statistically significantly different in each field trial. The percentages of
statistically significant differences in metabolites between the two lpa mutants and the wild-
type for each field trial are within the same order of magnitude as those determined for
comparable GC-based metabolite profiling studies on lpa mutants of maize and soybean
(Hazebroek et al., 2007; Frank et al., 2009).
Results obtained by the comparative univariate assessment of the rice lpa mutant and the
corresponding wild-type metabolites revealed that the vast majority of differences observed
are related to biological variability rather than to the mutation event. Only five metabolites
were consistently statistically different between Xiushui 110 and Os-lpa-XS110-1 at all five
field trials. The compounds were identified as trimethylsilyl (TMS) derivatives of the methyl
pentadecanoate, myo-inositol, galactose and raffinose and phosphate. For Os-lpa-XS110-2,
only the two TMS derivatives of phosphate and myo-inositol were significantly and
consistently different at the five field trials. These metabolites are related to the biosynthetic
pathways leading to phytic acid (Frank et al., 2007).
3. Potato
3.1 Genetic and Phytochemical Diversity in Wild Populations
The Scottish Crop Research Institute houses the Commonwealth Potato Collection of 83
species and ca. 1600 accessions. This is a valuable germplasm collection used to identify
new sources of genes for pest and disease resistance and quality traits. Wild Solanum species
(73 accessions representing several taxonomic groups) have been grown from seed and tubers
and analysed using metabolomics (Davies, 2006). Metabolomics (GC-MS) with data
analysed by PCA was able to separate group series Pinnatisecta from the other taxonomic
groups. The compounds driving the difference were both polar and non-polar metabolites.

12
Metabolite fingerprinting using Direct Infusion-Mass Spectrometry (DI-MS; positive ion
mode) was particularly effective in discriminating taxonomic groups based on mass ions
associated with specific glycoalkaloids demissine, dehydro-demissine commersonine α-
tomatine, α-solanine and α-chaconine.
In a similar study Dobson et al (2008) used metabolomic approaches to analyse 29
genetically diverse potato cultivars and landraces. Material included 27 tetraploid cultivars
and landraces - 20 x Solanum tuberosum ssp. Tuberosum (16 with known introgression of a
variety of useful traits from a variety of wild species, and 4 with no introgressed disease
resistance), 7 Chilean landraces, and 2 x diploid cultivars (Solanum phureja) using GC-MS.
Metabolomics was again able to discriminate between some (but not all) of the germplasm.
Beckmann et al (2007) used flow infusion electrospray ionization mass spectrometry
(FIE-MS) and GC-MS, to assess compositional differences in potato cultivars (5 x S.
tuberosum cultivars – Agria, Desiree, Granola, Linda and Solara) with no prior genetic,
biochemical, or analytical chemistry data available. Data from the FIE-MS suggested large
differences existed between tubers of individual cultivars. GC-MS analysis highlighted the
fact that many of the identified metabolites that contributed significantly to compositional
differences between the cultivars were linked closely to quality traits in potato tubers. For
example, levels of the amino acids isoleucine, tyrosine and phenylalanine were higher in
certain cultivars.
3.2 GM Compared With Non-GM
Roessner et al (2001) used GC-MS analysis to phenotype previously characterised GM
potato with altered sucrose catabolism. Analysis of these lines allowed detection of 88
metabolites (61 known) including sugars, sugar alcohols, amino acids, organic acids and
several miscellaneous compounds. The majority of compounds detected were increased in
the transgenic lines compared with the non GM control, with metabolites associated with

13
several metabolic pathways increasing in tandem. Nine of the 88 compounds in the GM
tubers were below detectable limits in the WT tubers.
Deferenez et al (2004) applied NMR and Liquid Chromatography (LC)-MS protocols to
GM potato lines with modifications in a range of metabolic pathways. Whilst some
differences were observed the GM lines and their controls the largest differences occurred
between the non-GM parental material used to generate the GM lines.
Similarly, Catchpole et al (2005) used GC-Time of Flight (ToF)-MS and FIE-MS to
provide a comprehensive comparison of total metabolites in field-grown potato genetically
modified to induce fructan biosynthesis. With the exception of the predicted intended effects
of up-regulated fructans and their expected derivatives, the levels of metabolites detected
were very similar in the GM and its control. Importantly, metabolite levels in the GM lines
fell within the range of the 5 non-GM commercial cultivars used as reference material. In fact,
a major finding from the study was the large variation in the metabolite profile between the 5
conventional cultivars
Whilst assessing potato tubers for compositional changes occurring after genetic
modifications to different metabolic pathways, Parr et al (2005) positively identified
kukoamine A, and related phenolics compounds, in wild type tubers. These were
subsequently detected in tomato (Lycopersicon esculentum) and Nicotiana sylvestris, but were
not detectable in Arabidopsis thaliana or Beta vulgaris. This surprising discovery in a range
of Solanaceous species, including potato, provides evidence for the potential of non-targeted
analysis such as metabolomics in studying plant metabolites, as such metabolites would not
have been discovered using a targeted approach.
4. Soft Fruit
As with many crop species, soft fruit such as blueberry, raspberry, strawberry and
blackcurrant are characterised by a wide range of metabolite classes which influence both

14
quality and nutrition value. These include sugars, acids, amino acids, carotenoids and simple
to complex polyphenolics to name but a few. Subclass diversity is also evident with the
polyphenol group including anthocyanins, flavonols, (iso)flavones, flavanones, catechins,
ellgaitannins, cinnamates and hydroxyl benzoic acids and stillbenes (Pietta et al., 2003;
D'Archivio et al., 2007; Mullen et al., 2007). These subclasses are further populated by
differential levels and pattern of polyphenol polymerization, glycosylation, methylation and
acylation (Clifford, 2000; Reed et al., 2005; Xie and Dixon, 2005; Prior and Wu, 2006).
Metabolite diversity in soft fruit is accompanied by a significantly broad and dynamic
content range. For example, total anthocyanin content can be virtually undetectable in fruit
such as banana but can reach levels of 2-10 mg.g-1 fresh weight in blackcurrant, raspberry,
blueberry, elderberry, and the lesser researched fruit choke berry (Clifford, 2000). Similarly,
other metabolites impacting upon organolepsis (sugars and organic acids), nutrition (vitamins
C, A etc) and putative bioactive components (flavonoids) also display similar levels of
variation (Anon 2003; Anon 2009a,b).
The combination of all of the above factors have meant that applications of true
metabolomics (i.e. an untargeted study of metabolite changes either by GC-MS, LC-MS,
NMR etc) to fruit is at a very early stage and have been limited to melon (Biais et al., 2009,
2010), raspberry (McDougall et al., 2008; Stewart et al., 2007) and strawberry (Fait et al.,
2008). The approach taken by Biais et al (2009, 2010) focused on establishing within fruit
spatial variation in primary metabolites using a cross comparative approach mining 1H NMR
and GC-ToF-MS data for metabolite trends at a spatial level using independently performed
PCA and multi-block hierarchical PCA (HPCA). . In general, the analytical systems yielded
similar spatial trends in metabolites. Confirmation of this cross-comparability was revealed
by a correlation-based superblock HPCA for direct comparison of both analytical data sets.
The HPCA approach allowed different source data sets, with different levels of sensitivity, to
be confidently cross-compared thereby extending the validity of the multi-analytical approach

15
to metabolomics. For melon at least this has been extended to determine the underlying
factors impacting upon shelf life and associated spoilage via hypoxia related fermentation.
For strawberries, fruit development has been studied using a combined GC-MS and
UPLC-QTOF-MS (Fait et al., 2008) covering not only primary metabolites but also 105
secondary metabolites including phenylpropanoid derivatives. This represents a significant
step beyond the state-of-the-art which has generally confined itself to reporting on differences
in specific chemical classes such as flavonoids (Wang et al., 2003; Panico et al., 2009) and
amino acids (Keutgen and Pawelzik, 2008) due to genetic variation or stress (Capocasa et al.,
2008).
The application of metabolomics to study trait inheritance or the influence of the
environment on primary and secondary changes is in its infancy with respect to soft fruit.
This approach has been hampered, at least with respect to fruit breeding, by the sheer
numbers of samples (distinct lines, replication) to be analysed in a standard segregating
population. Methods to manage this have been developed by Stewart et al (2007) and
McDougall et al (2008) who have truncated standard LC-MS to give a short column method
that is closer to DI-MS (S-DI-MS). Their study employed the same segregating raspberry
population in two distinct growing environments, one a low fertiliser site with minimal
standard agronomic management and the other one classified as a high health site with
standard and regular inputs of fertiliser and agronomic management. Mature fruit from these
sites showed clear differences in global metabolites but year-on-year variation was likely to
be the key driver of metabolite variation observed between the sites. Interestingly, the PCA
data for one of the years was clearly differentiated with regard to the high and low input
systems the reason for which is most likely the dry weather experienced during fruit
development and the differential soil water retention capacities between sites.
When each site and season were analysed independently, segregation of chemical classes
within the breeding population was evident. A wide range of polyphenols were characterised

16
but the most evident amongst these were the following: cyanidin 3-glucoside, cyanidin 3-
sophoroside, cyanidin 3-glucosylrutinoside cyaniding 3-rutinoside, pelargonidin 3-
sophoroside, pelargonidin 3-glucosylrutinoside and quercetin acetylrutinoside. Analysis
using PCA indicated segregation within the population for the cyanidin-3-sophoroside and
cyanidin-3-rutinoside groups. This is informative and means that the SC-DI-MS approach
could facilitate a rapid screen to identify progeny elevated in these compounds. This
approach has subsequently been validated as a “near-quantitative” approach, for
(poly)phenolic metabolites at least, by McDougall et al (2008) and is currently being
expanded to include strawberry and blackcurrant populations with the aim of correlating
metabolomic data with sensory properties. .
Conclusions
The characterisation of natural diversity in plant metabolites using unbiased metabolite
profiling approaches is already providing us with a deeper knowledge of food composition
and its variable nature both within and between species. This baseline approach is already
being applied in comparisons of GM crops with non GM comparators with a history of safe
use, but metabolomic data are not specifically requested in the risk assessment process (at
least not to date). Some argue that these unbiased analytical techniques should indeed be
applied to detect unintended effects and reduce uncertainty. However, the potential use of
these approaches in food safety and quality assessment need not be confined to GMOs.
Consideration should be given to their use in a much broader context, for example with regard
to novel non- GM food and feed. This should however, be on a case by case basis.
Acknowledgements
H. V .Davies, L. V. T. Shepherd and D. Stewart acknowledge financial support from the
Scottish Executive Environment and Rural Affairs Department (SEERAD), the European

17
Commission (Contract No. Food-CT-2004-506446) and the U.K Food Standards Agency
(GO2) programme.
References
Anon., 2009a. USDA compositional data base.
http://www.ars.usda.gov/SP2UserFiles/Place/12354500/Data/SR22/reports/sr22fg09.pdf.
Accessed on 04/11/2009.
Anon., 2009b. Fineli® - Finnish food composition database. http://www.fineli.fi/, accessed
on 11/4/2009.
Anon., 2003. USDA Database for the flavonoid content of selected foods.
http://www.nal.usda.gov/fnic/foodcomp/Data/Flav/flav.pdf, accessed on 11/4/2009.
Baker, J.M., Hawkins, N.D., Ward, J.L., Lovegrove, A., Napier, J.A., Shewry, P.R., Beale,
M.H., 2006. A metabolomic study of substantial equivalence of field-grown genetically
modified wheat. Plant Biotechnology Journal 4, 381–392.
Biais, B., Allwood, J.W., Deborde, C., Xu, Y., Maucourt, M., Beauvoit, B., Dunn, W.B.,
Jacob, D., Goodacre, R., Rolin, D., Moing, A., 2009. 1H NMR, GC-EI-TOFMS, and data
set correlation for fruit metabolomics: application to spatial metabolite analysis in melon.
Analytical Chemistry 81, 2884-2894.
Biais, B., Beauvoit, B., William Allwood, J., Deborde, C., Maucourt, M., Goodacre, R.,
Rolin, D., Moing, A., 2010. Metabolic acclimation to hypoxia revealed by metabolite
gradients in melon fruit. Journal of Plant Physiology 167, 242-245.
Beckmann, M., Enot, D.P., Overy, D.P., Draper, J., 2007. Representation, Comparison and
interpretation of metabolome fingerprint data for total composition analysis and quality
trait investigation in potato cultivars. Journal of Agricultural and Food Chemistry 55,
3444-3451.

18
Capocasa, F., Scalzo, J., Mezzetti, B., Battino, M., 2008. Combining quality and antioxidant
attributes in the strawberry: The role of genotype. Food Chemistry 111, 872-878.
Catchpole, G.S., Beckmann, M., Enot, D.P., Mondhe, M., Zywicki, B., Taylor, J., Hardy, N.,
Smith, A., King, R.D., Kell, D.B., Fiehn, O., Draper. J., 2005. Hierarchical metabolomics
demonstrates substantial compositional similarity between genetically modified and
conventional potato crops. Proceedings of the National Academy of Science 102, 14458–
14462.
Castro, C., Manetti, C.A., 2007. Multiway approach to analyze metabonomic data: a study of
maize seeds development. Analytical Biochemistry 371, 194-200.
Clifford, M.N., 2000. Anthocyanins – nature, occurrence and dietary burden. Journal of the
Science of Food and Agriculture 80, 1063-1072.
D'Archivio, M., Filesi, C., Di Benedetto, R., Gargiulo, R., Giovannini, C., Masella, R., 2007.
Polyphenols, dietary sources and bioavailability. Annual Ist Super Sanita. 43, 348-61.
Davies, H.V., 2006. Metabolomics: Applications in functional biodiversity analysis in potato.
International Solanaceae Conference and Solanaceae Genomics Network, Madison,
Wisconsin, 23–27 July 2006.
Davies, H.V., 2009. A role for “omics” technologies in food safety assessment. Food
Control (in press). doi:10.1016/j.foodcont.2009.03.002
Defernez, M., Gunning, Y.M., Parr, A.J., Shepherd, L.V.T., Davies, H.V., Colquhoun, I.J.,
2004. NMR and HPLC-UV profiling of potatoes with genetic modifications to metabolic
pathways. Journal of Agricultural and Food Chemistry 52, 6075-6085.
Dobson, G., Shepherd, T., Verrall, S.R., Conner, S., McNicol, J.W., Ramsay, G., Shepherd,
L.V.T., Davies, H.V., Stewart, D., 2008. Phytochemical diversity in tubers of potato
cultivars and landraces using a GC-MS metabolomics approach. Journal of Agricultural
and Food Chemistry 56, 10280-10291.

19
Dixon, R.A., Strack, D., 2003. Phytochemistry meets genome analysis, and beyond.
Phytochemistry 62, 815–816.
FAO/WHO. Food and Agriculture Organization / World Health Organization., 2000. Safety
aspects of genetically modified foods of plant origin. Geneva, Switzerland.
Fait, A., Hanhineva, K., Beleggia, R., Dai, N., Rogachev, I., Nikiforova, V.J., Fernie, A.R.,
Aharoni, A., 2008. Reconfiguration of the achene and receptacle metabolic networks
during strawberry fruit development. Plant Physiology 148, 730-750.
Fernie A.R., Tadmor, Y., Zamir, D., 2006. Natural genetic variation for improving crop
quality. Current Opinions in Plant Biology 9, 196–202.
Frank, T. Meuleye Seumo, B. Miller, A. Shu, Q.Y. Engel, K.-H., 2007. Metabolite profiling
of two low phytic acid (lpa) rice mutants. Journal of Agricultural and Food Chemistry
55, 11011-11019.
Frank, T., Nörenberg, S., Engel, K.-H., 2009. Metabolite profiling of two novel low phytic
acid (lpa) soybean mutants. Journal of Agricultural and Food Chemistry 57, 6408-6416.
Fruit Flavours, Biogenesis, Characterisation and Authentication., 1995. Eds. Rouse, R.L. and
Leavh, M.M. ACS Symposium Series No. 596. American Chemical Society, Washington
DC.
Hardy, N.W., Taylor, C.F., 2007. A roadmap for the establishment of standard data exchange
structures for metabolomics. Metabolomics 3, 243–248.
Hall, R.D., 2006. Plant metabolomics: from holistic hope, to hype, to hot topic. Tansley
Review 169, 453–468.
Harrigan, G.G., Stork, L.G., Riordan, S.G., Ridley, W.P., Macisaac, S., Halls, S.C., Orth, R.,
Rau, D., Smith, R.G., Wen, L., Brown, W.E., Riley, R., Sun, D., Modiano, S., Pester, T.,
Lund, A., Nelson, D., 2007a. Metabolite analyses of grain from maize hybrids grown in
the United States under drought and watered conditions during the 2002 field season.
Journal of Agricultural and Food Chemistry 55, 6169-6176.

20
Harrigan, G.G., Stork, L.G., Riordan, S.G., Reynolds, T.L, Ridley, W.P., Masucci, J.D.,
Macisaac, S., Halls, S.C., Orth, R., Smith, R.G., Wen, L., Brown, W.E., Welsch. M.,
Riley, R., McFarland, D., Pandravada, A., Glenn, K.C., 2007b. Impact of genetics and
environment on nutritional and metabolite components of maize grain. Journal of
Agricultural and Food Chemistry 55, 6177-6185.
Hazebroek, J., Harp, T., Shi, J., Wang, H., 2007. Metabolomic analysis of low phytic acid
maize kernels. In Concepts in Plant Metabolomics; Nikolau, B. J., Wurtele, E. S., Eds.
Springer, Berlin, Germany, p 221-237.
Hitz, W.D., Carlson, T.J., Kerr, P.S., Sebastian, S.A., 2002. Biochemical and molecular
characterization of a mutation that confers a decreased raffinosaccharide and phytic acid
phenotype on soybean seeds. Plant Physiology 128, 650-660.
Keutgen, A.J., Pawelzik, E., 2008. Contribution of amino acids to strawberry fruit quality and
their relevance as stress indicators under NaCl salinity. Food Chemistry 111, 642-647.
Lozovaya, V. Ulanov, A. Lygin, A. Duncan, D. Widholm, J., 2006. Biochemical features of
maize tissues with different capacities to regenerate plants. Planta 224, 1385-1399.
McDougall, G., Martinussen, I., Stewart, D., 2008. Towards fruitful metabolomics: high
throughput analyses of polyphenol composition in berries using direct infusion mass
spectrometry. Journal of Chromatography B-Analytical Technologies in the Biomedical
and Life Sciences 871, 362-369.
Mullen, W., Marks, S.C., Crozier, A., 2007. Evaluation of phenolic compounds in
commercial fruit juices and fruit drinks. Journal of Agricultural and Food Chemistry 55,
3148–3157.
Noteborn, H.P.J.M., Lommen, A., van der Jagt, R.C., Weseman, J.M., 2000. Chemical
fingerprinting for the evaluation of unintended secondary metabolic changes in transgenic
food crops. Journal of Biotechnology 77, 103-114.

21
OECD Organisation for Economic Cooperation and Development. Safety evaluation of foods
derived by modern biotechnology: concept and principles. 1993.
Panico, A.M., Garufi, F., Nitto, S., Di Mauro, R., Longhitano, R.C., Magrì, G., Catalfo, A.,
Serrentino, M.E., De Guidi, G., 2009. Antioxidant activity and phenolic content of
strawberry genotypes from Fragaria x ananassa. Pharmacological Biology 47, 203-208.
Parr, A., Mellon, F., Colquhoun, I., Davies H.V., 2005. Dihydrocaffeoyl polyamines
(kukoamine and allies) in potato (Solanum tuberosum) tubers detected during metabolite
profiling. Journal of Agricultural and Food Chemistry 53, 5461 -5466.
Pietta, P., Minoggio, M., Bramati, L., 2003. Plant polyphenols: Structure, occurrence and
bioactivity. Studies in Natural Products Chemistry 28, 257-312.
Prior, R.L., Wu, X., 2006. Anthocyanins: structural characteristics that result in unique
metabolic patterns and biological activities. Free Radical Research 40, 1014-1028.
Raboy, V., 2007. Seed phosphorus and the development of low-phytate crops. In Inositol
Phosphates. Linking Agriculture and the Environment; B. L. Turner, A. E. Richardson, E.
J. Mullaney, Eds. Wallingford, Oxfordshire, UK: CAB International, pp. 111-132.
Reed, J.D., Krueger, C.G., Vestling, M.M., 2005. MALDI-TOF mass spectrometry of
oligomeric food polyphenols. Phytochemistry 66, 2248-2263.
Reynolds, T.L., Nemeth, M.A., Glenn, K.C., Ridley, W.P., Astwood, J.D., 2005. Natural
variability of metabolites in maize grain: differences due to genetic background. Journal
of Agricultural and Food Chemistry 53, 10061-10067.
Ridley, W.P., Shillito, R.D., Coats, I., Steiner H.-Y., Shawgo, Phillips, M.A., Dussold, P.,
Kurtyka, L., 2004. Development of the International Life Sciences Institute Crop
Composition Database. Journal of Food Composition and Analysis.17, 423-438.
Roessner, U., Luedemann, A., Brust, D., Fiehn, O., Thomas, L., Willmitzer, L., Fernie, A.R.,
2001. Metabolic Profiling Allows Comprehensive Phenotyping of Genetically or
Environmentally Modified Plant Systems. The Plant Cell 13, 11-29.

22
Röhlig R.M., Eder, J., Engel, K.-H., 2009. Metabolite profiling of maize grain: differentiation
due to genetics and environment. Metabolomics, DOI 10.1007/s11306-009-0171-5.
Schauer, S., Fernie, A.R., 2006. Plant metabolomics: towards biological function and
mechanism. Trends in Plant Science 11, 508-516.
Seebauer, J.R., Moose, S.P., Fabbri, B.J., Crossland, L.D., Below, F.E., 2004. Amino acid
metabolism in maize earshoots. Implications for assimilate preconditioning and nitrogen
signaling. Plant Physiology 136, 4326-4334.
Shi, J., Wang, H., Schellin, K., Li, B., Faller, M., Stoop, J.M., Meeley, R.B., Ertl, D.S.,
Rachn, J.P., Glassman, K., 2007. Embryo-specific silencing of a transporter reduces
phytic acid content of maize and soybean seeds. Nature Biotechnology 25, 930-937.
Stewart, D., McDougall, G.J., Sungurtas, J., Verrall, S., Graham, J., Martinussen, I., 2007.
Metabolomic approach to identifying bioactive compounds in berries: advances toward
fruit nutritional enhancement. Molecular Nutrition and Food Research 51, 645-651.
Wang, S.Y, Bunce, J.A., Maas, J.L., 2003. Elevated Carbon Dioxide Increases Contents of
Antioxidant Compounds in Field-Grown Strawberries. Journal of Agricultural and Food
Chemistry 51, 4315–4320.
Wilcox, J.R. Isolation of High Seed Inorganic P, Low-Phytate Soybean Mutants., 2000. Crop
Science 40, 1601-1605.
Xie, D.Y., Dixon, R.A., 2005. Proanthocyanidin biosynthesis--still more questions than
answers? Phytochemistry 66, 2127-2144.
Yuan, F.J., Zhao, H.J., Ren, X.L., Zhu, S.L., Fu, X.J., Shu, Q.Y., 2007. Generation and
characterization of two novel low phytate mutations in soybean (Glycine max L. Merr.).
Theoretical and. Applied Genetics 115, 945-957.

23
Table 1. Peak-based comparison of chromatograms obtained by metabolite profiling of wild-
type Xiushui 110 and mutant lines Os-lpa-XS110-1 and Os-lpa-XS110-2 grown in
2005/2006.
Field Trial
Hainan Jiaxing Hangzhou 1 Fuzhou Guangzhou
wild-type vs. mutant totala diff.b total diff. total diff. total diff. total diff. consistent
diff.c
XS110 vs. lpa-XS110-1 144 58 121 47 118 50 135 51 111 48 5
XS110 vs. lpa-XS110-2 128 32 107 21 107 28 121 44 101 24 2
a Number of peaks included for comparison in fractions I-IV (peak height > 1000 µV)
b Number of peaks statistically significant different between wild-type and mutant line in fractions I-
IV (p < 0.05)
c Number of peaks statistically significantly different between wild-type and mutant line at all five
analyzed field trials
where diff. = difference(s)

24
B C
D E
A-10 0 10 20
PC1
-10
-5
0
5
10
PC2
-10 0 10 20PC1
-10
-5
0
5
10
PC2
-10 -5 0 5 10 15PC1
-10
-5
0
5
10
PC2
ShortyPontosLukasFlavi
CULTIVAR
-10 0 10 20PC1
-10
0
10
20
PC2
200620052004
YEAR
200620052004
YEAR
-10 0 10 20PC1
-10
0
10
20
PC2
B C
D E
A-10 0 10 20
PC1
-10
-5
0
5
10
PC2
-10 0 10 20PC1
-10
-5
0
5
10
PC2
-10 -5 0 5 10 15PC1
-10
-5
0
5
10
PC2
ShortyPontosLukasFlavi
CULTIVAR
-10 0 10 20PC1
-10
0
10
20
PC2
200620052004
YEAR
200620052004
YEAR
-10 0 10 20PC1
-10
0
10
20
PC2
Figure 1. Principal components analysis of metabolite profiling data from fractions I-IV in
growing seasons 2004 (A), 2005 (B), 2006 (C) and from combined data of 2004-2006 (D, E)
at farming location Frankendorf, Bavaria.

25
A B C
D
-10 0 10 20PC1
-10
-5
0
5
10
PC2
-20 -10 0 10PC1
-10
-5
0
5
10
15
PC2
-20 -10 0 10PC1
-10
-5
0
5
10
PC2
-30 -20 -10 0 10PC1
-10
-5
0
5
10
PC2
ThannStrassmoosReithMittich
LOCATION
A B C
D
-10 0 10 20PC1
-10
-5
0
5
10
PC2
-20 -10 0 10PC1
-10
-5
0
5
10
15
PC2
-20 -10 0 10PC1
-10
-5
0
5
10
PC2
-30 -20 -10 0 10PC1
-10
-5
0
5
10
PC2
ThannStrassmoosReithMittich
LOCATION
Figure 2. Principal components analysis of metabolite profiling data from fractions I-IV of
cultivar Amadeo in growing seasons 2004 (A), 2005 (B), 2006 (C) and combined 2004-2006
(D) at the four locations Mittich, Reith, Strassmoos and Thann.

26
-20 -10 0 10PC1
-10
-5
0
5
10
PC
2
-20 -10 0 10PC1
-10
-5
0
5
10
PC
2
-20 -10 0 10PC1
-10
-5
0
5
10
PC
2
-20 -10 0 10PC1
-10
-5
0
5
10
PC
2
-20 -10 0 10PC1
-10
-5
0
5
10
PC
2
-20 -10 0 10PC1
-10
-5
0
5
10
PC
2
-20 -10 0 10PC1
-10
-5
0
5
10
PC
2
-20 -10 0 10PC1
-10
-5
0
5
10
PC
2
-20 -10 0 10PC1
-10
-5
0
5
10
PC
2
-20 -10 0 10PC1
-10
-5
0
5
10
PC
2
-20 -10 0 10PC1
-10
-5
0
5
10
PC2
20042004 2004
2005
2006
PotchefstroomPetit Lichtenburg
Petit
Petit
all locations
2004–2006
Roundup ready-maizeisogenic maize Bt-maize
-20 -10 0 10PC1
-10
-5
0
5
10
PC
2
-20 -10 0 10PC1
-10
-5
0
5
10
PC
2
-20 -10 0 10PC1
-10
-5
0
5
10
PC
2
-20 -10 0 10PC1
-10
-5
0
5
10
PC
2
-20 -10 0 10PC1
-10
-5
0
5
10
PC
2
-20 -10 0 10PC1
-10
-5
0
5
10
PC
2
-20 -10 0 10PC1
-10
-5
0
5
10
PC
2
-20 -10 0 10PC1
-10
-5
0
5
10
PC
2
-20 -10 0 10PC1
-10
-5
0
5
10
PC
2
-20 -10 0 10PC1
-10
-5
0
5
10
PC
2
-20 -10 0 10PC1
-10
-5
0
5
10
PC2
20042004 2004
2005
2006
PotchefstroomPetit Lichtenburg
Petit
Petit
all locations
2004–2006
Roundup ready-maizeisogenic maize Bt-maize
Figure 3. Principal components analysis of GC/MS metabolite profiling data obtained by
triplicate analysis of three maize lines ( GM Bt, GM RR, non-GM). The material was
grown at different environments in South Africa differing in location and growing season
(Potchefstroom 2004, Petit 2004-2006, Lichtenburg 2004). For Petit 2005 three technical
replicates were analyzed.

27
-6
-4
-2
0
2
4
6
-6 -4 -2 0 2 4 6 8-10
-5
0
5
10
15
20
25
-15 -10 -5 0 5 10 15 20 25
A
PC1
PC2
PC1
PC2
BHN
JX
JX
HN
HN
JXJX
-
-
-
- - --
-
- - --6
-4
-2
0
2
4
6
-6 -4 -2 0 2 4 6 8-10
-5
0
5
10
15
20
25
-15 -10 -5 0 5 10 15 20 25
A
PC1
PC2
PC1
PC2
BHN
JX
JX
HN
HN
JXJX
-
-
-
- - --
-
- - -
Figure 4. Principal components analysis of standardized GC-FID metabolite profiling data
from the polar fractions III (A) and IV (B) of the japonica wild-type rice Xiushui 110 (●) and
the low phytic acid mutants Os-lpa-XS110-1 (●) and Os-lpa-XS110-2 (●) grown at five field
trials in 2005/2006; marked field trials: HN, Hainan; JX, Jiaxing.


![Variability of the Ratio of Alfalfa to Grass Reference ... · crop reference evapotranspiration by the crop coefficients [12,13]. Reference evapotranspiration is the rate at which](https://img.pdfslide.net/doc/110x75/5f0b108c7e708231d42eacda/variability-of-the-ratio-of-alfalfa-to-grass-reference-crop-reference-evapotranspiration.jpg)