Embed Size (px)
Citation preview
Metabolomics in PISCINA IIpart of the EXPOsOMICS project
Karin van VeldhovenImperial College London
Investigators meetingEXPOsOMICS
26/11/2014
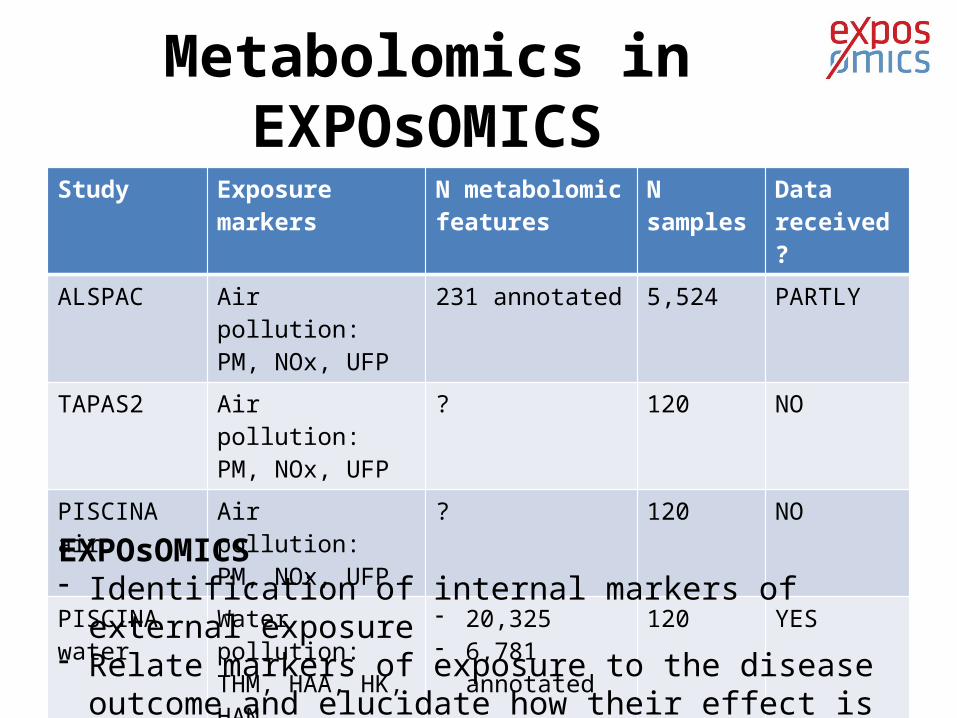
Metabolomics in EXPOsOMICSStudy Exposure markers N metabolomic
featuresN samples Data
received?ALSPAC Air pollution:
PM, NOx, UFP231 annotated 5,524 PARTLY
TAPAS2 Air pollution:PM, NOx, UFP
? 120 NO
PISCINA air Air pollution:PM, NOx, UFP
? 120 NO
PISCINA water Water pollution:THM, HAA, HK, HAN
- 20,325 - 6,781 annotated
120 YES
EXPOsOMICS- Identification of internal markers of external exposure- Relate markers of exposure to the disease outcome and
elucidate how their effect is mediated
PISCINA study• Ongoing experimental study of swimmers in pools
• Exposure to water disinfection by-products (DBPs) and their short-term effects
• Extensive identification of DBPs in swimming pool water and air as well as biological samples (exhaled breath, blood and urine) and identify:
• Mutagenicity• Genotoxicity• Short-term respiratory health
effects
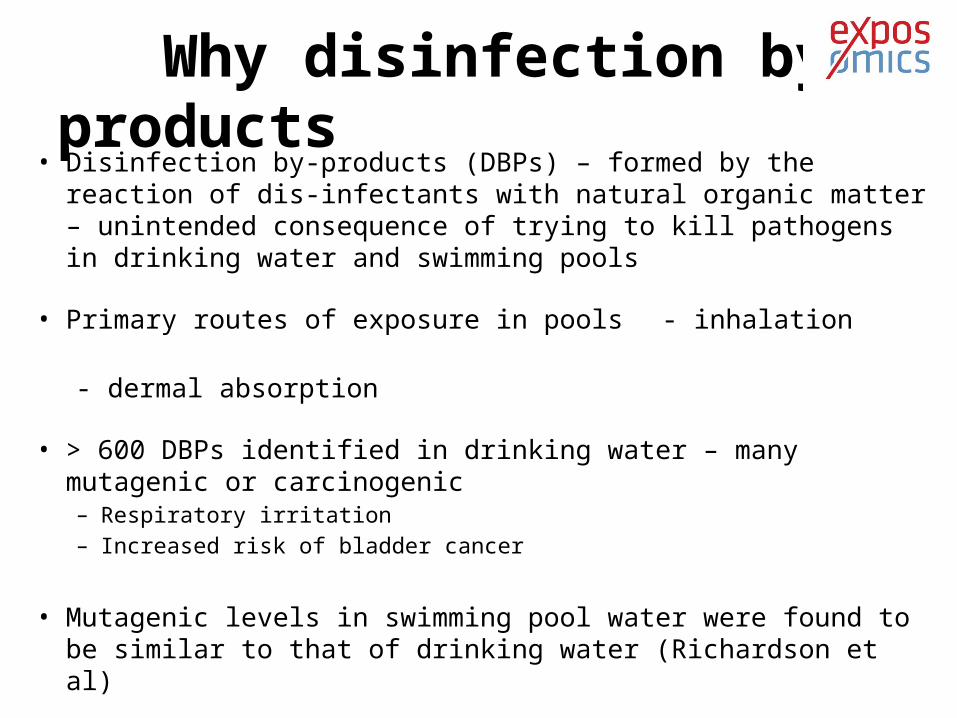
Why disinfection by-products • Disinfection by-products (DBPs) – formed by the reaction of dis-
infectants with natural organic matter – unintended consequence of trying to kill pathogens in drinking water and swimming pools
• Primary routes of exposure in pools - inhalation - dermal absorption
• > 600 DBPs identified in drinking water – many mutagenic or carcinogenic– Respiratory irritation– Increased risk of bladder cancer
• Mutagenic levels in swimming pool water were found to be similar to that of drinking water (Richardson et al)
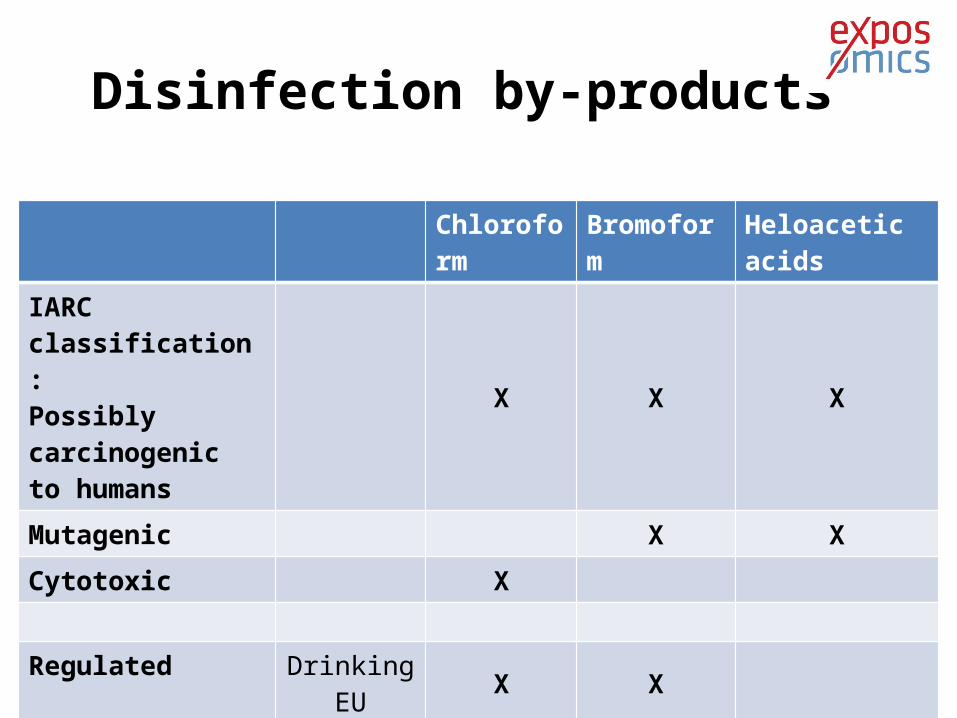
Disinfection by-products
Chloroform Bromoform Heloacetic acidsIARC classification:Possibly carcinogenic to humans
X X X
Mutagenic X XCytotoxic X
Regulated Drinking EU X XDrinking US X X X
Pools
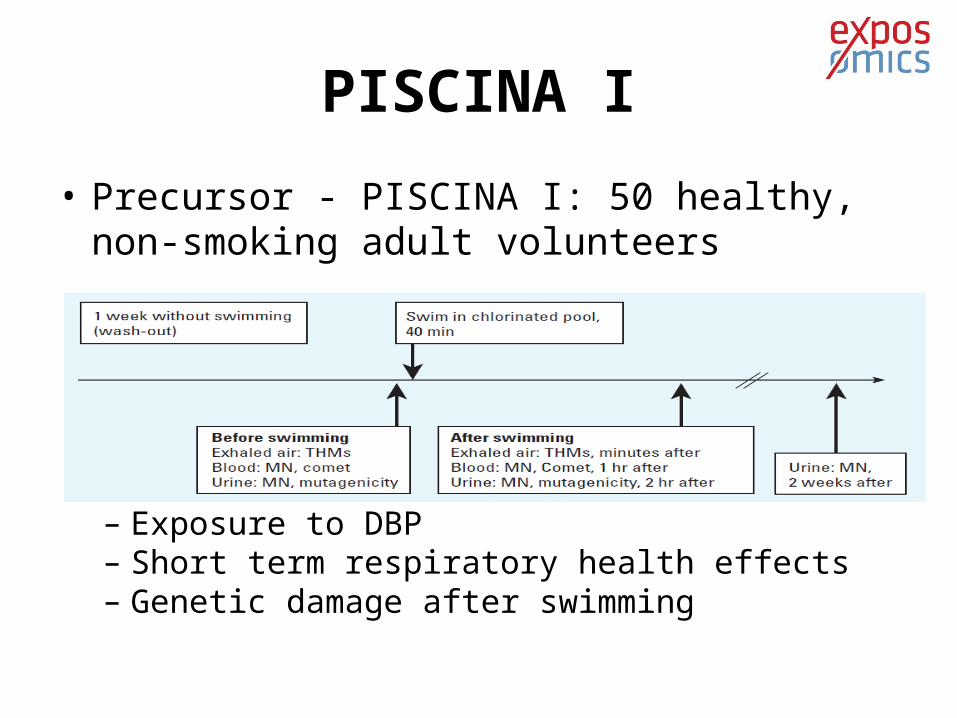
PISCINA I
• Precursor - PISCINA I: 50 healthy, non-smoking adult volunteers
– Exposure to DBP– Short term respiratory health effects– Genetic damage after swimming
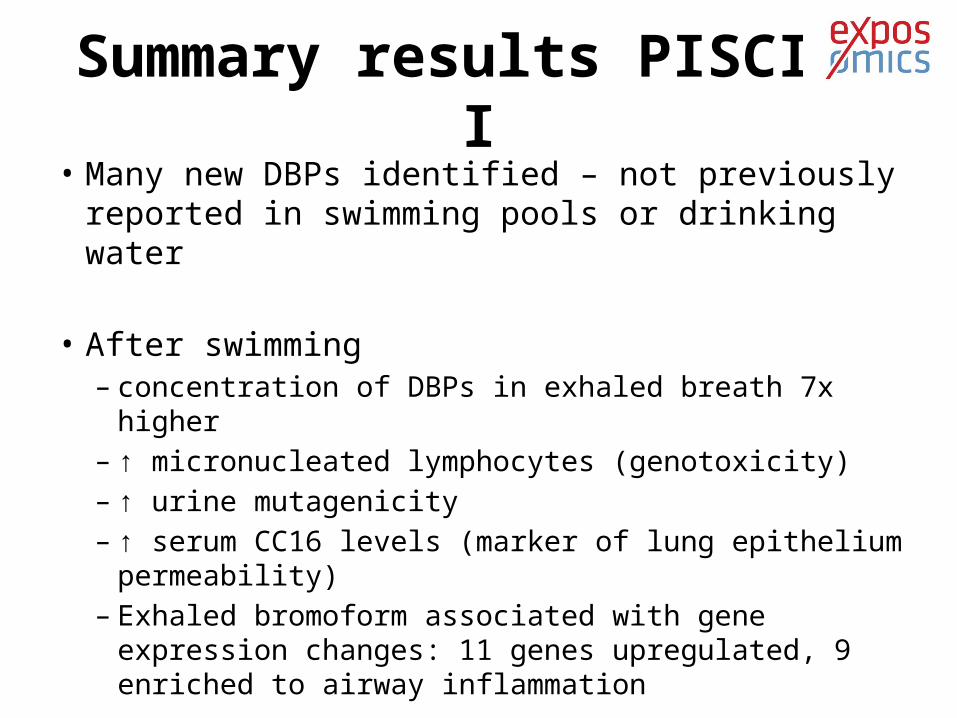
Summary results PISCINA I• Many new DBPs identified – not previously reported
in swimming pools or drinking water
• After swimming– concentration of DBPs in exhaled breath 7x higher– ↑ micronucleated lymphocytes (genotoxicity)– ↑ urine mutagenicity– ↑ serum CC16 levels (marker of lung epithelium
permeability)– Exhaled bromoform associated with gene expression
changes: 11 genes upregulated, 9 enriched to airway inflammation
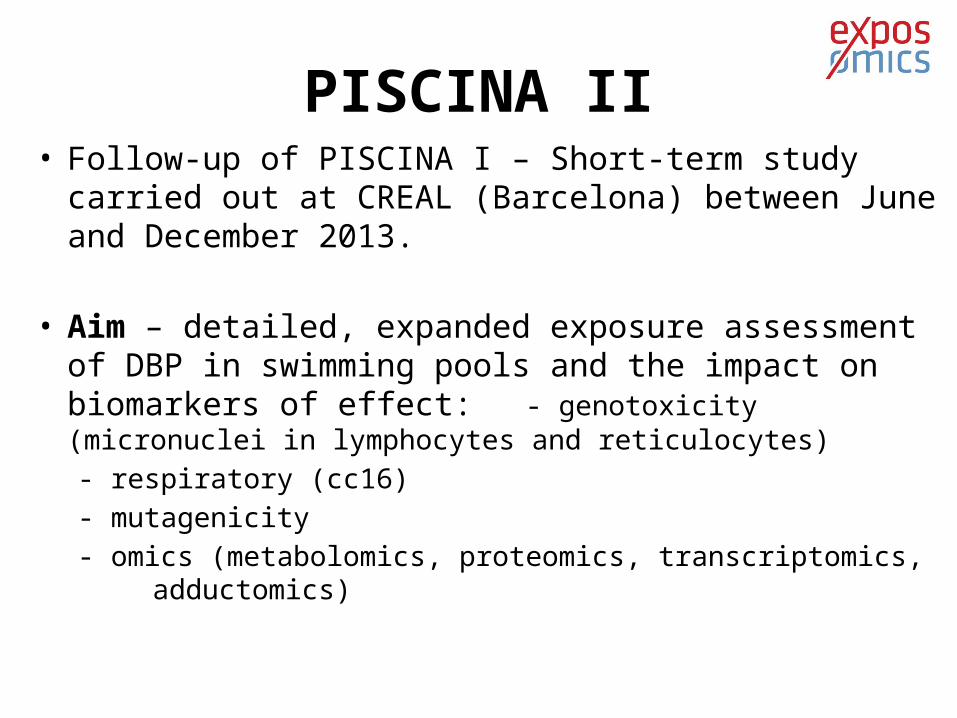
PISCINA II• Follow-up of PISCINA I – Short-term study carried out at
CREAL (Barcelona) between June and December 2013.
• Aim – detailed, expanded exposure assessment of DBP in swimming pools and the impact on biomarkers of effect: - genotoxicity (micronuclei in lymphocytes and reticulocytes)
- respiratory (cc16)- mutagenicity- omics (metabolomics, proteomics, transcriptomics, adductomics)
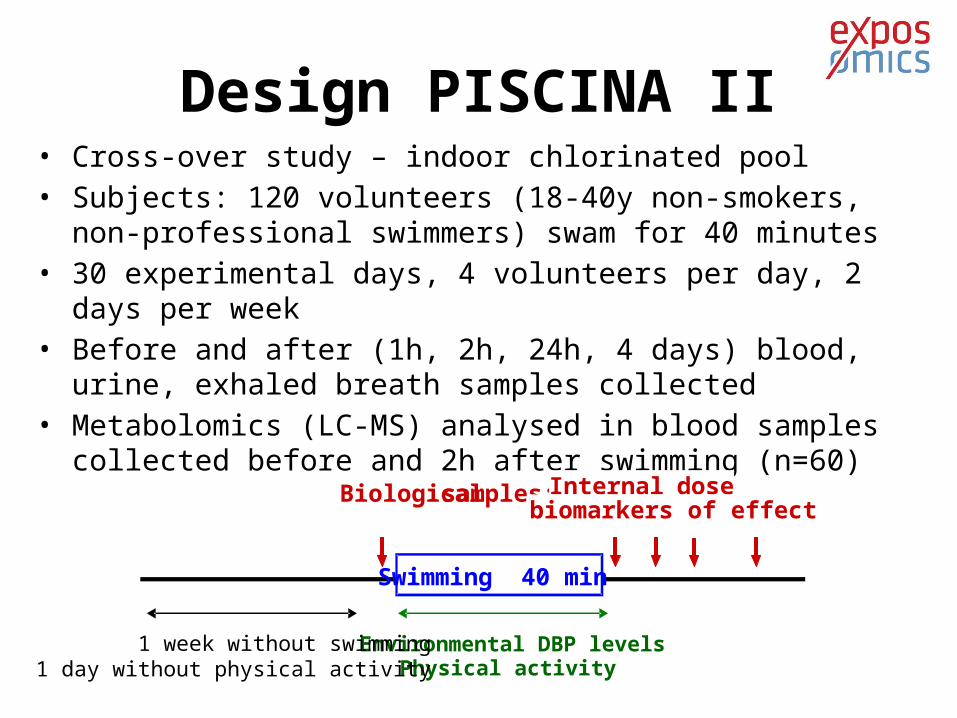
Design PISCINA II• Cross-over study – indoor chlorinated pool• Subjects: 120 volunteers (18-40y non-smokers, non-professional
swimmers) swam for 40 minutes• 30 experimental days, 4 volunteers per day, 2 days per week• Before and after (1h, 2h, 24h, 4 days) blood, urine, exhaled breath
samples collected• Metabolomics (LC-MS) analysed in blood samples collected before and
2h after swimming (n=60)
Environmental DBP levelsPhysical activity
Biological samples: -Internal dose-biomarkers of effect
Swimming 40 min
1 week without swimming1 day without physical activity
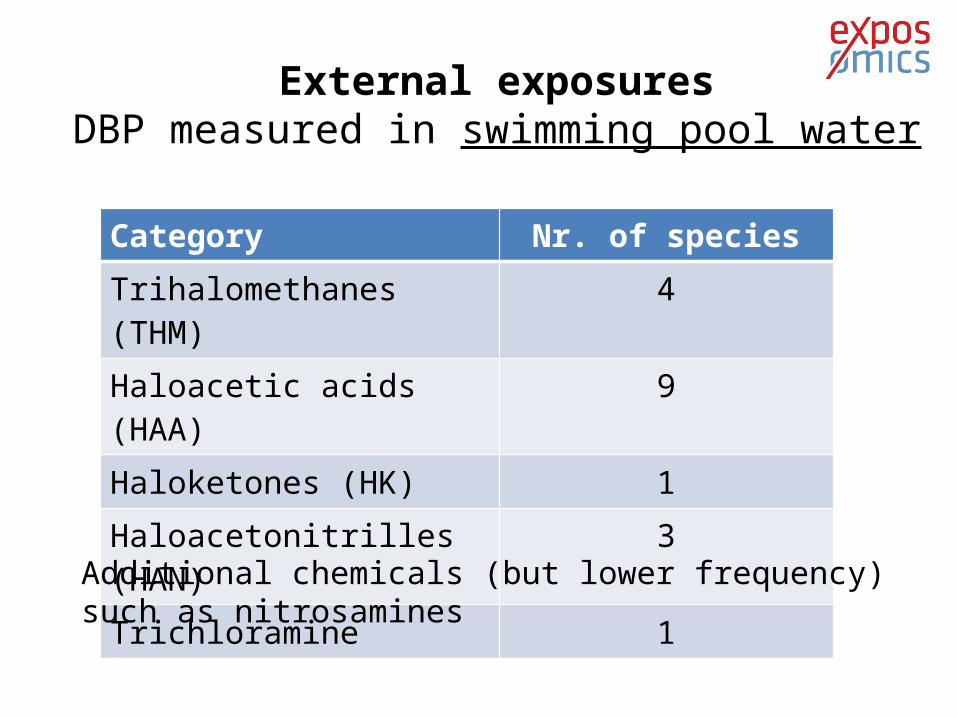
External exposuresDBP measured in swimming pool water
Category Nr. of speciesTrihalomethanes (THM) 4Haloacetic acids (HAA) 9Haloketones (HK) 1Haloacetonitrilles (HAN) 3Trichloramine 1
Additional chemicals (but lower frequency) such as nitrosamines
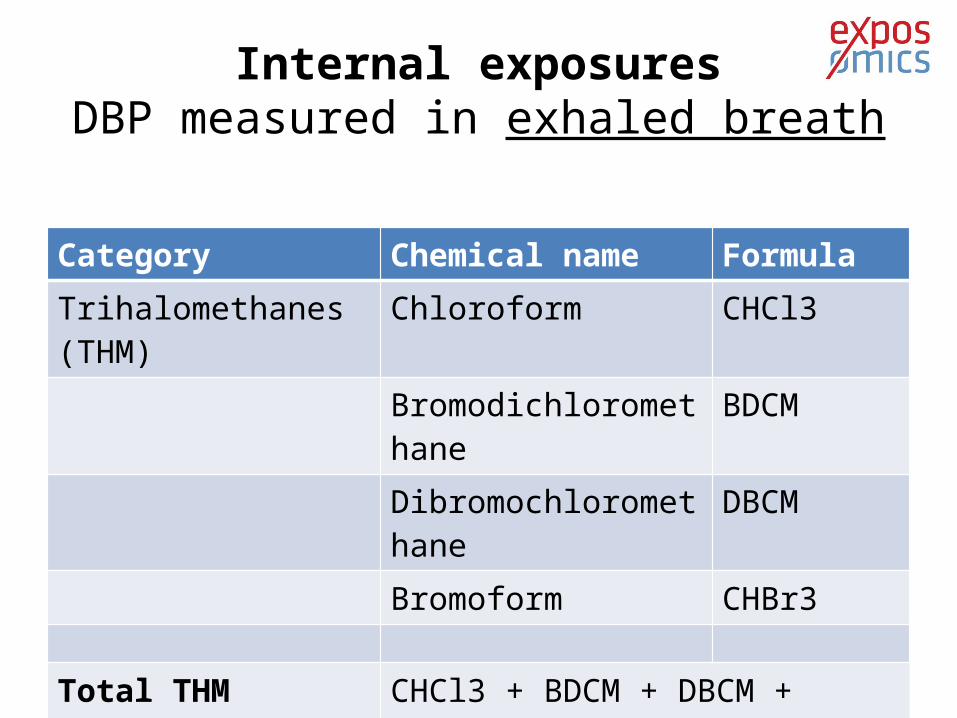
Internal exposuresDBP measured in exhaled breath
Category Chemical name FormulaTrihalomethanes (THM) Chloroform CHCl3
Bromodichloromethane BDCMDibromochloromethane DBCMBromoform CHBr3
Total THM CHCl3 + BDCM + DBCM + CHBr3
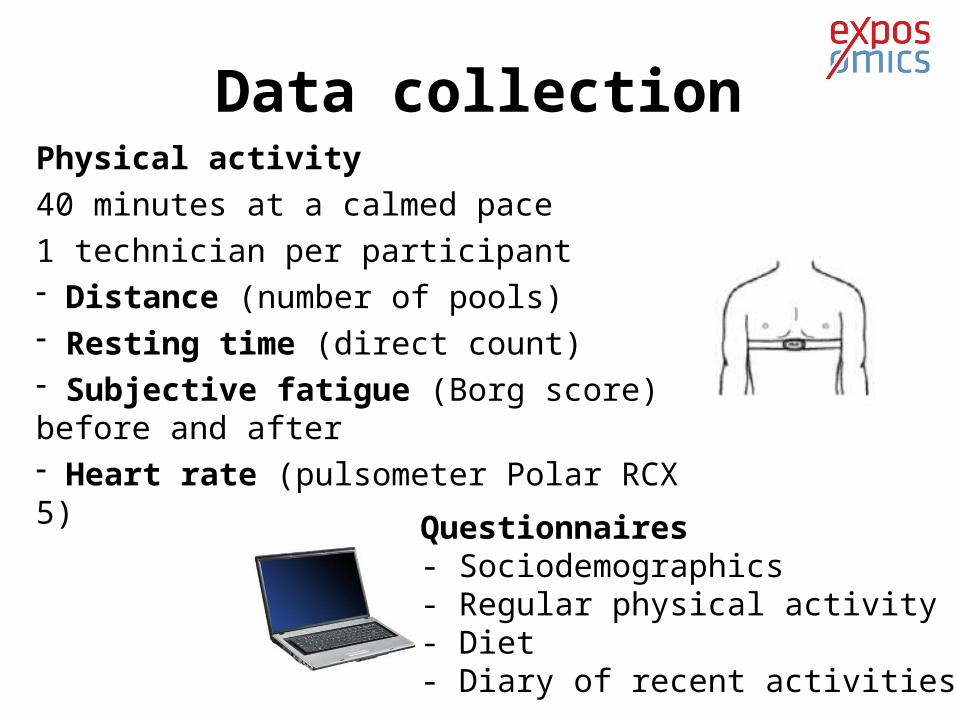
Physical activity40 minutes at a calmed pace1 technician per participant- Distance (number of pools)- Resting time (direct count)- Subjective fatigue (Borg score) before and after- Heart rate (pulsometer Polar RCX 5)
Questionnaires- Sociodemographics- Regular physical activity- Diet- Diary of recent activities
Data collection
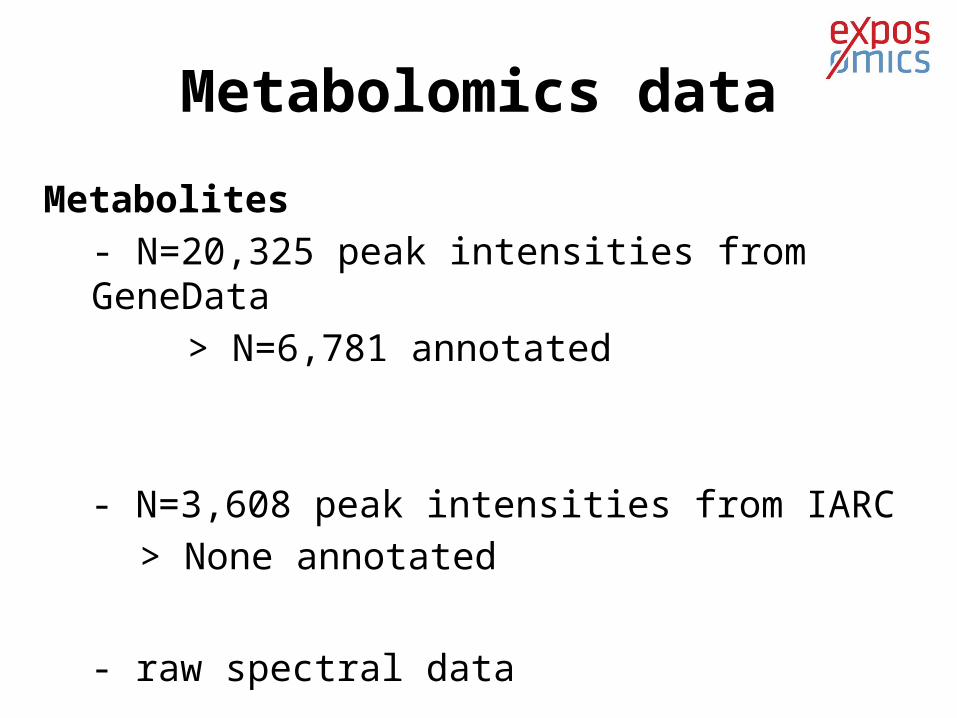
Metabolomics data
Metabolites- N=20,325 peak intensities from GeneData
> N=6,781 annotated
- N=3,608 peak intensities from IARC> None annotated
- raw spectral data
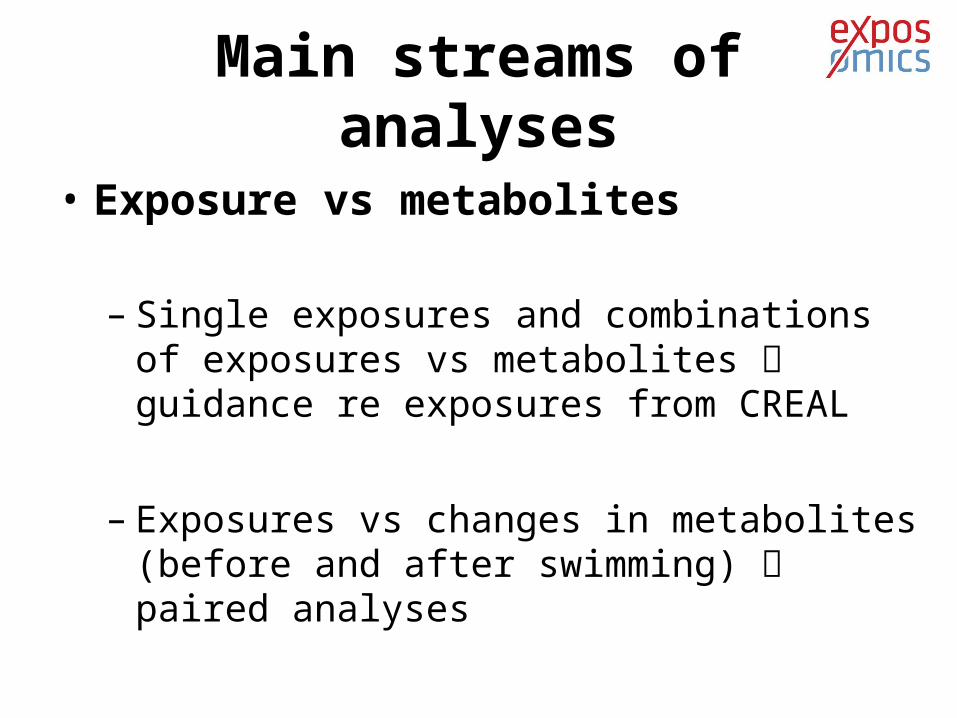
Main streams of analyses
• Exposure vs metabolites
– Single exposures and combinations of exposures vs metabolites guidance re exposures from CREAL
– Exposures vs changes in metabolites (before and after swimming) paired analyses
Main streams of analyses
• Metabolites vs outcome
– Cluster individuals with respect to their short-term metabolic response to exposure
– Identify relationship between individual heterogeneity in the metabolic responses to exposure and:• Genotoxicity (micronuclei in lymphocytes and
reticulocytes)• Respiratory biomarker (CC16)• Mutagenicity
Pre-processing, quality checks
• Check exposure distribution
• Check association with exposures of interest and age, sex, BMI, other potential confounders account for these in subsequent analyses
• Filtering of metabolomic features
• PCA to identify outliers and main sources of variation
Univariate analyses
• Benchmark model: (generalized) linear models, adjusted for potential confounders
• Extension: investigating non-linear alternatives (Generalized Additive Models: GAMs)
• Multiple testing correction: control FWER Comparison with alternative strategies
Multivariate analyses
• Partial Least Squares regression (PLS)
• Orthogonal Projections to Latent Structures (OPLS) or Bidirectional Orthogonal Projections to Latent Structures (O2PLS)
• Exploratory use of variable selection approaches: - Penalized regression - Bayesian variable selection (BVS)
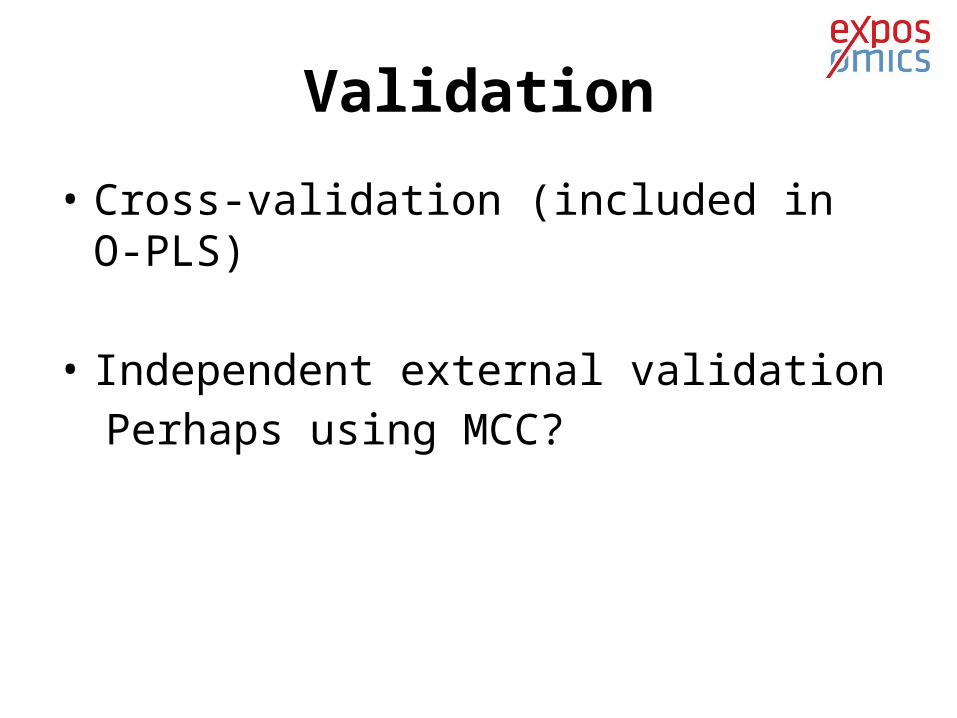
Validation
• Cross-validation (included in O-PLS)
• Independent external validationPerhaps using MCC?
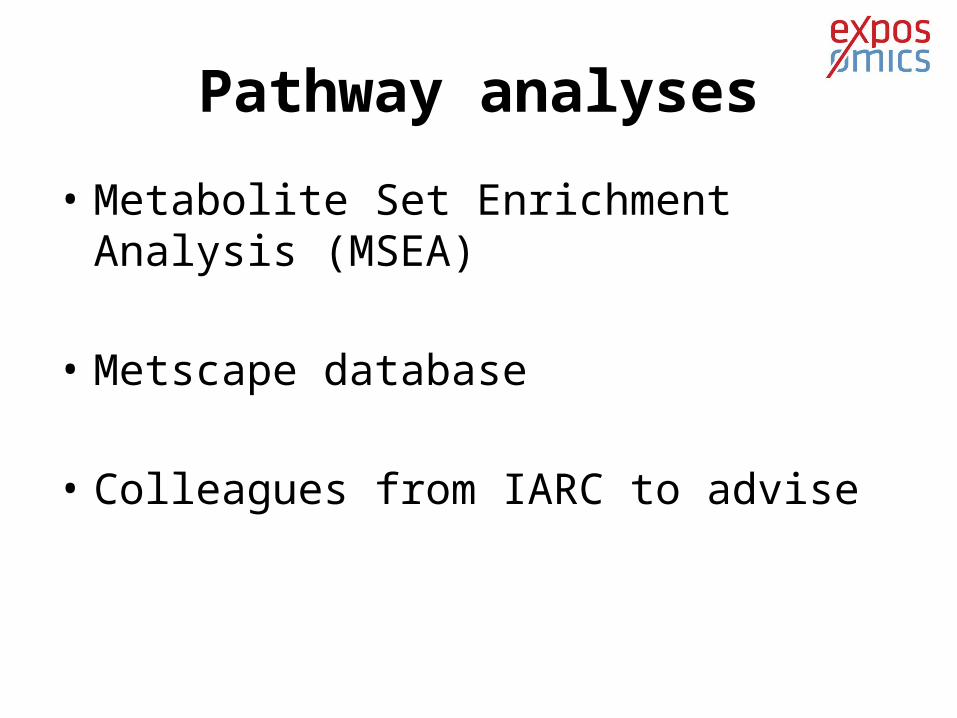
Pathway analyses
• Metabolite Set Enrichment Analysis (MSEA)
• Metscape database
• Colleagues from IARC to advise
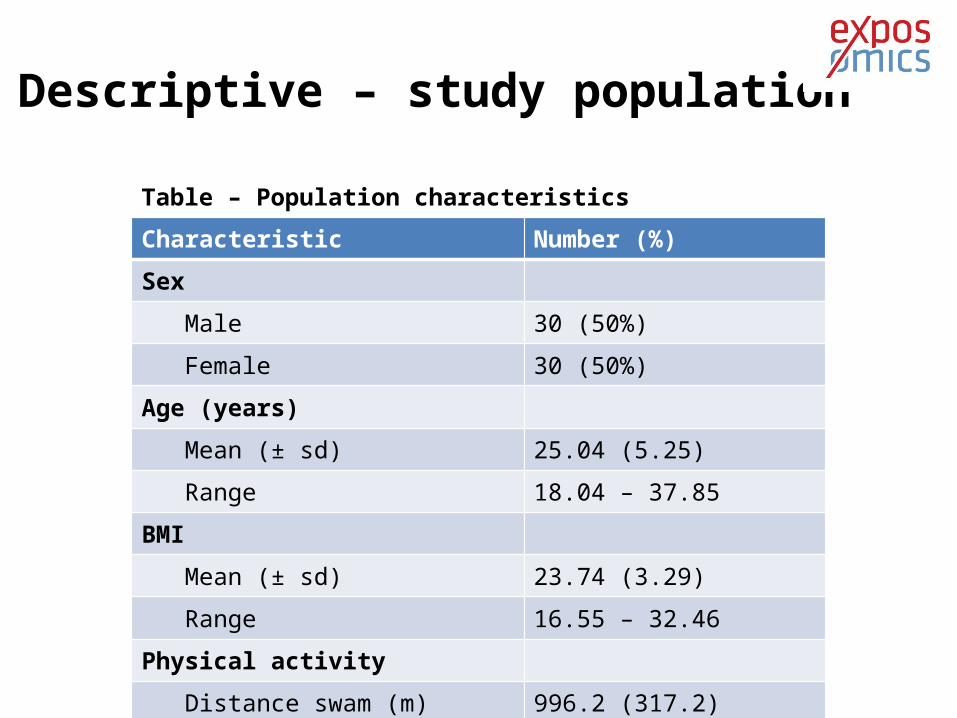
Descriptive – study population
Characteristic Number (%)
Sex
Male 30 (50%)
Female 30 (50%)
Age (years)
Mean (± sd) 25.04 (5.25)
Range 18.04 – 37.85
BMI
Mean (± sd) 23.74 (3.29)
Range 16.55 – 32.46
Physical activity
Distance swam (m) (Mean (± sd)) 996.2 (317.2)
Table – Population characteristics
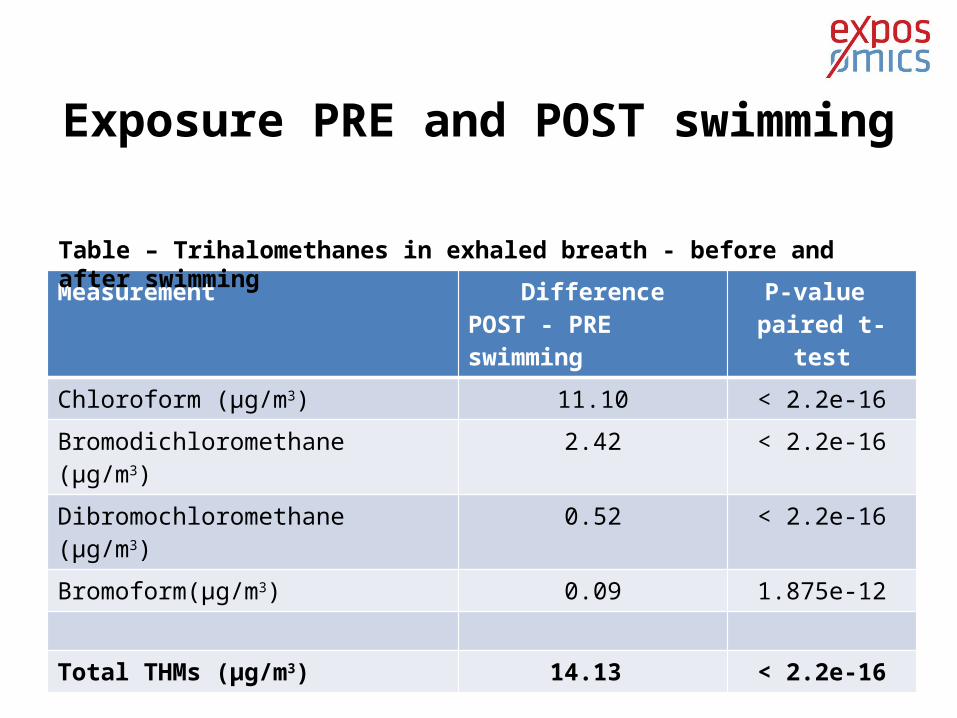
Exposure PRE and POST swimming
Measurement DifferencePOST - PRE swimming
P-value paired t-test
Chloroform (µg/m3) 11.10 < 2.2e-16
Bromodichloromethane (µg/m3) 2.42 < 2.2e-16
Dibromochloromethane (µg/m3) 0.52 < 2.2e-16
Bromoform(µg/m3) 0.09 1.875e-12
Total THMs (µg/m3) 14.13 < 2.2e-16
Table – Trihalomethanes in exhaled breath - before and after swimming
Acknowledgements
• Marc Chadeau-Hyam• Paolo Vineis
• Florence Guida• Michelle Plusquin• Raphaele Castagne
• CREAL + PISCINA volunteers