Embed Size (px)
Citation preview
Metagenomic analysis of antibiotic resistance genes in the fecal microbiome
following therapeutic and prophylactic antibiotic administration in dairy cows
Lindsey Renee Caudle
Thesis submitted to the faculty of the Virginia Polytechnic Institute and State University
in partial fulfillment of the requirements for the degree of
Master of Science
in
Dairy Science
Committee
Katharine F. Knowlton, Chair
Amy J. Pruden
Michael S. Strickland
Robert M. Akers
July 8th, 2014
Blacksburg, VA
Keywords: shotgun metagenomic sequencing, antibiotic resistance, dairy cow
Metagenomic analysis of antibiotic resistance genes in the fecal microbiome
following therapeutic and prophylactic antibiotic administration in dairy cows
Lindsey Renee Caudle
ABSTRACT
The use of antibiotics in dairy cattle has the potential to stimulate the
development and subsequent fecal dissemination of antibiotic resistance genes (ARGs) in
bacteria. The objectives were to use metagenomic techniques to evaluate the effect of
antibiotic treatment on ARG prevalence in the fecal microbiome of the dairy cow and to
determine the temporal excretion pattern of ARGs. Twelve Holstein cows were assigned
to one of four antibiotic treatments: control, pirlimycin, ceftiofur, or cephapirin. Fecal
samples were collected on d -1, 1, 3, 5, 7, 14, 21, and 28. Samples were freeze-dried and
subjected to DNA extraction followed by Illumina paired-end HiSeq sequencing and
quantitative polymerase chain reaction (qPCR). Illumina sequences were analyzed using
MG-RAST and the Antibiotic Resistance Gene Database (ARDB) via BLAST.
Abundance of ampC, ermB, tetO, tetW, and 16S rRNA genes were determined using
qPCR. All data were statistically analyzed with PROC GLIMMIX in SAS. Antibiotic
treatment resulted in a shift in bacterial cell functions. Sequences associated with
“resistance to antibiotics and toxic compounds” were higher in ceftiofur-treated cows
than control cows. Ceftiofur-treated cows had a higher abundance of -lactam and
multidrug resistance sequences than control cows. There was no effect of treatment or
day on fecal tetO and ermB excretion. The relative abundances of tetW and ampC were
higher on d 3 post-treatment than d 5 and d 28. In conclusion, antibiotic use in dairy
iii
cattle shifted bacterial cell functions and temporarily increased antibiotic resistance in the
fecal microbiome.
Keywords: shotgun metagenomic sequencing, antibiotic resistance, dairy cow
iv
ACKNOWLEDGEMENTS
First and foremost, I would like to thank my Lord and Savior, Jesus Christ, for
allowing me the opportunity to pursue my Masters and for giving me the strength and
endurance I needed to succeed.
I would like to thank my major advisor, Dr. Katharine Knowlton, for first hiring
me when I was still an undergrad, sparking my passion for both dairy cows and research.
Thank you for having enough faith in me to take me on as a grad student and for
constantly pushing me to be the best I can be. Finally, thank you for allowing me the
freedom to pursue all my crazy metagenomic endeavors.
I would like to thank my graduate advisory committee members, Dr. Amy Pruden
and Dr. Mike Strickland, for always helping me troubleshoot when I ran into problems
with my research and for sharing in my excitement when I finally succeeded in producing
data. Dr. Pruden, thank you for allowing me to invade your lab space and lab meetings. I
appreciate all you have taught me and appreciate your kindness in treating me as one of
your own students. Dr. Strickland, thank you for helping me figure out what to do with
the massive amount of MG-RAST data I obtained. Without you I would still be staring at
it cross-eyed.
To other DASC faculty, staff, and grad students, thank you for being a wonderful
department to learn from and grow with. To Becky, thank you so much for always
answering my questions and for making my life much easier by handling things like
forms and conference room reservations. I would also like to thank the VT Dairy farm
crew, especially Shane Brannock and Curtis Caldwell, for their help during my cow
study. Thank you for being so flexible and kind when I entered your offices stressed out
v
about a problem and for going out of your way to check in on my cows. To my
officemate, Abby, thank you for our long conversations and for our office naps. I have
loved going to Northstar Church with you and getting to help with your engagement and
talk wedding planning. I couldn’t ask for anyone better to walk through my Masters with.
To Ying Yang, thank you for your countless hours of help with MG-RAST
analysis and for performing the BLAST analysis on my samples. I would still be stuck
without you!
To the undergrads that helped with my cow study, thank you for being willing to
work around-the-clock alongside of me. Thank you for being so trustworthy and for
being such hard workers. Shasta, thank you, thank you, thank you, for driving from Floyd
every time I needed help catching and sampling cows after everyone else had already left
for Christmas break. I will never forget the bitter cold and moments like “let’s just stand
here and cry a little”. Thank you so much for the all the laughter.
To my lab mates, Heather, Partha, and Xin, you guys are absolutely incredible. I
have loved our laughs, jokes, sarcasm, long talks, therapy sessions, and have been blessed
to have friends who would drop everything to help me. Heather, thank you for letting me
talk to you about relationships, wedding planning, and life events. Thank you for being
an amazing lab tech and for teaching me lab skills like DNA extraction and qPCR. Thank
you for running qPCR plates for my study and for always listening to me when I needed
to practice a presentation or needed help proofreading this thesis. Thank you for our
coffee dates, barn adventures, TSP bootcamps, and for allowing me to be friends with
Buddy. I will miss you (and him) like crazy! Partha, thank you for SAS help!!! Thanks
for always talking research with me and for helping me when I needed to find papers.
vi
Thank you for making me laugh with your endless stories about punching beehives,
gluing your fingers together, and throwing firecrackers into bathroom stalls. Thank you
for long conversations about India and Big Bang Theory. Thank you for teaching me that
people can fake allergies to food (mint) and that I should never, ever believe people when
they try to convince me to microwave an egg. Xin, thank you for your SAS help too.
Thank you for not hating me when I change the lab computer background to ridiculous
pictures or for when I leave notes for Heather saying you told her to “get it together”.
Finally Xin, my hair is red, not brown!
To my wonderful family, incredible fiancé, and amazing friends, thank you for
your endless support and prayers. Your love and support are what has kept me going.
Dad, thank you telling me I should go to grad school and for not saying “I told you so”
when I finally went. Thank you for your morning prayers over-the-phone and for the “I
love you” texts. Mom, thank you for always being a phone call away whenever I needed
you. Thanks for driving down to help me with my study and for telling everyone you
know about the time the cow got loose while I was taking a fecal sample. Liss and Ryno,
thank you for being the best siblings I could ever ask for and for your patience in all my
craziness these last two years. Bobby, thank you for always listening and for always
encouraging me when I felt like I was at the end of my rope. Thank you for going to the
barn with me at 1 and 3 AM, for helping me catch cows, and for listening to hours of talk
about things like “metagenomics” and “antibiotic resistance”. Thank you for always
doing your best to understand what I do. I love you and can’t wait to marry you.

vii
TABLE OF CONTENTS
ABSTRACT ...................................................................................................................ii
ACKNOWLEDGEMENTS ......................................................................................... iv
TABLE OF CONTENTS ............................................................................................ vii
LIST OF TABLES ........................................................................................................ x
LIST OF FIGURES...................................................................................................... xi
Chapter 1: INTRODUCTION ...................................................................................... 1
Chapter 2: REVIEW OF LITERATURE .................................................................... 4
ANTIOBIOTIC USE IN THE DAIRY INDUSTRY AND ASSOCIATED PROBLEMS .. 4
MECHANISMS OF ANTIBIOTIC RESISTANCE ............................................................ 5
Cephalosporin Resistance ................................................................................................... 7
Lincosamide Resistance ...................................................................................................... 9
Ionophore Resistance ........................................................................................................ 10
BOVINE ANTIBIOTIC METABOLISM AND RESIDUE EXCRETION ....................... 11
Metabolism and Excretion of Cephalosporins .................................................................... 11
Metabolism and Excretion of Lincosamides ...................................................................... 13
METHODS FOR MEASURING ANTIBIOTIC RESISTANCE ...................................... 13
Traditional Culture-Based Methods ................................................................................... 13
Quantitative Real-Time Polymerase Chain Reaction ......................................................... 15
Metagenomic Sequencing ................................................................................................. 17
Functional Analysis .......................................................................................................... 21
ANTIBIOTIC RESISTANCE IN BOVINE BACTERIA .................................................. 24
Gastrointestinal (GI) Tract ................................................................................................ 24
viii
Feces ................................................................................................................................ 24
ENVIRONMENTAL EFFECTS AND POTENTIAL IMPACT ....................................... 30
CONCLUSION AND RESEARCH OBJECTIVES ........................................................... 31
REFERENCES ................................................................................................................... 33
Chapter 3: METAGENOMIC ANALYSIS OF ANTIBIOTIC RESISTANCE
GENES IN THE FECAL MICROBIOME FOLLOWING THERAPEUTIC AND
PROPHYLACTIC ANTIBIOTIC ADMINISTRATION IN DAIRY COWS .......... 45
ABSTRACT ........................................................................................................................ 45
INTRODUCTION............................................................................................................... 46
MATERIALS AND METHODS ........................................................................................ 48
Animals and Experimental Treatments .............................................................................. 48
Antibiotic Administration ................................................................................................. 49
Sample Collection ............................................................................................................. 50
Metagenomic Analysis ...................................................................................................... 51
Real-Time Quantitative Polymerase Chain Reaction (qPCR) Analysis .............................. 54
RESULTS ............................................................................................................................ 55
Metagenomic Results: MG-RAST Analysis ...................................................................... 55
Metagenomic Results: BLAST Analysis using the ARDB ................................................. 58
Q-PCR Results.................................................................................................................. 58
DISCUSSION ...................................................................................................................... 60
MG-RAST Analysis ......................................................................................................... 60
BLAST/ARDB Analysis ................................................................................................... 64
qPCR Analysis.................................................................................................................. 66
CONCLUSIONS ................................................................................................................. 70
REFERENCES ................................................................................................................. 105

ix
APPENDIX ....................................................................................................................... 112
x
LIST OF TABLES
Table 1 Summary of responses to antibiotic treatment for each analysis ........................ 72
Table 2 MG-RAST analysis: effect of ceftiofur crystalline-free acid antibiotic treatment
on bacterial species diversity in dairy cow feces .................................................... 73
Table 3 MG-RAST analysis: effect of ceftiofur crystalline-free acid antibiotic treatment
on the abundance of bacterial cell functions in dairy cow feces .............................. 74
Table 4 MG-RAST analysis: effect of ceftiofur crystalline-free acid antibiotic treatment
on the abundance of “phages, prophages, transposable elements, plasmids”
sequences in dairy cow feces ................................................................................. 83
Table 5 MG-RAST analysis: effect of ceftiofur crystalline-free acid antibiotic treatment
on the abundance of “virulence, disease, and defense” sequences in dairy cow feces
.............................................................................................................................. 85
Table 6 BLAST/ARDB analysis: effect of ceftiofur crystalline free acid antibiotic
treatment on the abundance of resistance gene sequences in dairy cow feces ......... 88
Table 7 BLAST/ARDB analysis: effect of ceftiofur crystalline free acid antibiotic
treatment on the proportion of resistance gene sequences in dairy cow feces .......... 91
Table 8 qPCR analysis: effect of antibiotic treatment on antibiotic resistance gene
absolute abundance in dairy cow feces ................................................................... 93
Table 9 qPCR analysis: effect of antibiotic treatment on antibiotic resistance gene relative
abundance in dairy cow feces................................................................................. 96
xi
LIST OF FIGURES
Figure 1. MG-RAST analysis: abundance of “cell division and cell cycle” sequences in
fecal samples collected from control (n=3) and ceftiofur crystalline free acid treated
(n=3) cows on day 3 post-treatment. ...................................................................... 78
Figure 2. MG-RAST analysis: abundance of “clustering-based subsystems” sequences in
fecal samples collected from control (n=3) and ceftiofur crystalline free acid treated
(n=3) cows on day 3 post-treatment.. ..................................................................... 79
Figure 3. MG-RAST analysis: abundance of “metabolism of aromatic compounds”
sequences in fecal samples collected from control (n=3) and ceftiofur crystalline free
acid treated (n=3) cows on day 3 post-treatment. ................................................... 80
Figure 4. MG-RAST analysis: abundance of “secondary metabolism” sequences in fecal
samples collected from control (n=3) and ceftiofur crystalline free acid treated (n=3)
cows on day 3 post-treatment. ................................................................................ 81
Figure 5. MG-RAST analysis: abundance of “stress response” sequences in fecal samples
collected from control (n=3) and ceftiofur crystalline free acid treated (n=3) cows on
day 3 post-treatment. ............................................................................................. 82
Figure 6. MG-RAST analysis: abundance of “pathogenicity islands” sequences in fecal
samples collected from control (n=3) and ceftiofur crystalline free acid treated (n=3)
cows on day 3 post-treatment. ................................................................................ 84
Figure 7. MG-RAST analysis: abundance of “resistance to antibiotics and toxic
compounds (RATC)” sequences in fecal samples collected from control (n=3) and
ceftiofur crystalline free acid treated (n=3) cows on day 3 post-treatment. ............. 86
xii
Figure 8. BLAST/ARDB analysis: abundance of antibiotic resistance gene (ARG)-like
sequences in fecal samples collected from control (n=3) and ceftiofur crystalline free
acid treated (n=3) cows on day 3 post-treatment. ................................................... 87
Figure 9. BLAST/ARDB analysis: abundance of beta-lactam resistance genes in fecal
samples collected from control (n=3) and ceftiofur crystalline free acid treated (n=3)
cows on day 3 post-treatment. ................................................................................ 89
Figure 10. BLAST/ARDB analysis: abundance of multidrug resistance genes in fecal
samples collected from control (n=3) and ceftiofur crystalline free acid treated (n=3)
cows on day 3 post-treatment. ................................................................................ 90
Figure 11. BLAST/ARDB analysis: abundance of beta-lactam resistance genes in fecal
samples collected from control (n=3) and ceftiofur crystalline free acid treated (n=3)
cows on day 3 post-treatment. ................................................................................ 92
Figure 12. qPCR analysis: abundance of 16S rRNA (log10 gene copies per 1.0 g freeze-
dried feces) in fecal samples. ................................................................................. 95
Figure 13. qPCR analysis: (A) Abundance of tetO (log10 gene copies per 1.0 g freeze-
dried feces) in fecal samples. (B) Relative abundance of tetO (gene copies/ 16S
rRNA) in fecal samples collected. .......................................................................... 98
Figure 14. qPCR analysis: (A) Abundance of tetW (log10 gene copies per 1.0 g freeze-
dried feces) in fecal samples. (B) Relative abundance of tetW (gene copies/ 16S
rRNA) in fecal samples collected ......................................................................... 100
Figure 15. qPCR analysis: relative abundance of ampC (gene copies/ 16S rRNA) in
collected fecal samples.. ...................................................................................... 102
xiii
Figure 16. qPCR analysis: (A) Abundance of ermB (log10 gene copies per 1.0 g freeze-
dried feces) in fecal samples. (B) Relative abundance of ermB (gene copies/ 16S
rRNA) in collected fecal samples ......................................................................... 103
1
Chapter 1: INTRODUCTION
Even at an early stage, the development of antibiotic resistance was recognized as
a potential problem of antibiotic use. Alexander Fleming, upon his discovery of
penicillin, said “It is not difficult to make microbes resistant to penicillin in the laboratory
by exposing them to concentrations not sufficient to kill them” (Fleming, 1945). Today,
the resistance problem continues to grow. Gram-negative bacterial isolates were
recovered from ICU patients all over the United States from 1994 – 2000 and, in that
time span, susceptibility to several antibiotics were reduced including ciprofloxacin by
10% and gentamicin by 6% (Neuhauser et al., 2003). Antibiotic resistance is clearly on
the rise and must be addressed.
In addressing this global problem, attention has fallen on the animal industry and
its use of antibiotics. In 2011, the FDA reported that 3.29 million kg of antibiotics were
sold for human pharmaceutical purposes while 13.5 million kg of antibiotics were sold
for use in domestic livestock (FDA, 2011;2012). Therefore, it is estimated that of the
total antimicrobials sold annually, roughly 80% is used by the livestock industry. This
usage of antibiotics has implications for soil and water microbiomes through effects of
excreted antibiotics (Sarmah et al., 2006) as well as the dissemination of antibiotic
resistance from livestock fecal bacteria.
The three main mechanisms of antibiotic resistance transfer include (1)
conjugation, which occurs via plasmids, (2) transformation, which is the uptake of naked
DNA, and (3) transduction, which is the transfer of resistance genes via a bacteriophage
(Barbosa and Levy, 2000). Resistance genes coding for resistance mechanisms to -
lactams [i.e. altering penicillin binding proteins or producing -lactamases (McDermott

2
et al., 2003)] or to macrolide-lincosamide-streptogramins [i.e. obtaining an rRNA
methylase which inhibits drug binding to the 50S ribosomal subunit (Roberts, 2004)] can
be spread rapidly between bacteria.
Previously, cultured-based methods like agar disc diffusion tests and dilution-
based tests (Schmieder and Edwards, 2012) were used to identify antibiotic resistant
bacterial isolates. However, newer quantitative methods like qPCR (Steffan and Atlas,
1991) can analyze for specific resistance genes present in the environmental sample, not
just in culturable bacteria. Today, metagenomic methods of analysis like 454
pyrosequencing (Sirohi et al., 2012) and Illumina sequencing (Fox et al., 2009) allow for
the study of entire bacterial metagenomes. Metagenomic methods are enhanced by
functional analysis of the sequencing output via databases like BLAST, ARDB, the
SEED, and MG-RAST.
The effect of antibiotic treatment on cattle fecal microbiomes has been a topic of
study for quite some time yielding results both consistent with and contradictory to any
directly linked hypotheses. For instance, fecal bacteria from conventionally-raised cows
tend to be more resistant to antibiotics than that from cows raised organically (Sato et al.,
2005; Halbert et al., 2006) but the increase in resistance in fecal bacteria of cows treated
with antibiotics is only transient (Tragesser et al., 2006; Singer et al., 2008). Even cattle
never exposed to antibiotics shed antibiotic resistant bacteria (Durso et al., 2011; Thames
et al., 2012). Finally the link between feeding antibiotics to cattle and fecal antibiotic
resistance is weak, with conflicting results (Inglis et al., 2005; Edrington et al., 2006;
Jacob et al., 2008; Mirzaagha et al., 2011). What is known is that runoff from farms
contain higher levels of antibiotic resistance genes than other water sources (Santamaría
3
et al., 2011) and that land applying contaminated cattle feces to vegetable plots results in
resistance genes making their way into and on produce (Marti et al., 2013). Further
research is necessary to complete the picture of antibiotic use on antibiotic resistance to
determine how to appropriately prevent the dissemination of those resistance genes.
4
Chapter 2: REVIEW OF LITERATURE
ANTIOBIOTIC USE IN THE DAIRY INDUSTRY AND ASSOCIATED
PROBLEMS
Antibiotics are compounds with antimicrobial properties and can be synthetic,
semi-synthetic, or found naturally in the environment (Phillips et al., 2004). Resistance to
these compounds is a natural occurrence, developed by bacteria to aid in their survival
against other antibiotic-producing microorganisms in the environment (Phillips et al.,
2004). However, it wasn’t until Alexander Fleming accidentally discovered penicillin in
1928 that this natural relationship between bacteria (and other organisms) began to play a
role in human and animal health.
Antibiotics are commonly used for therapeutic and prophylactic purposes in
livestock, as well as for growth promotion. In 2000, a survey by the Animal Health
Institute revealed that in 1998, roughly 8 million kg of antimicrobials were used in the
U.S. livestock industry, with 6.6 million kg of that being for prophylactic and therapeutic
use (McEwen and Fedorka-Cray, 2002). In 2011, the FDA reported that 3.29 million kg
of antibiotics were sold for human pharmaceutical purposes while 13.5 million kg of
antibiotics were sold for use in domestic livestock (FDA, 2011;2012). Therefore, it is
estimated that of the total antimicrobials sold annually, roughly 80% is used by the
livestock industry. The FDA further reported that 5.6 million kg of the antibiotics
distributed to livestock were tetracyclines, making it the most widely-used drug class
(FDA, 2011).
In the dairy industry, common antibiotic uses involve the treatment or prevention
of diarrhea and pneumonia in dairy calves, as well as the prevention (dry-cow therapy) or

5
treatment of mastitis in dairy cows (McEwen and Fedorka-Cray, 2002). Unlike in the
beef industry, lactating dairy cows receive few antimicrobials through their feed
(McEwen and Fedorka-Cray, 2002). The two most common types of antibiotics used on
conventional dairy farms are penicillins and cephalosporins, as these are the primary
choices for treatment of respiratory disease, mastitis, metritis, and foot problems (Zwald
et al., 2004).
While antibiotics used as growth promoters in livestock are not used in human
medicine, those used for disease treatment and prevention often are from the same drug
classes as antibiotics used in human medicine (Phillips et al., 2004). The broad use of
these classes of antibiotics has resulted in disease treatment problems in the human health
sector. Antibiotic resistance first became a problem in the 1950s with the emergence of
penicillin resistance in hospitals across the world, followed by gentamicin resistance in
the 1970s (O'Brien, 2002). Soon after, resistance to amikacin, sulfonamides, and the
“last-resort” drug, vancomycin, followed (O'Brien, 2002). However, the contribution of
animal antibiotic use to this growing resistance problem in human medicine is still in
question.
MECHANISMS OF ANTIBIOTIC RESISTANCE
An organism is resistant to an antibiotic when it is capable of surviving and
reproducing upon exposure. There are three main categories of biochemical mechanisms
by which resistance occurs: inactivating the antibiotic compound, preventing high
cellular levels of the antibiotic via drug efflux pumps or reduced permeability, and
altering the antibiotic cell target (Pehrsson et al., 2013). Resistance to a specific antibiotic
6
can be due to a single resistance mechanism or a combination of these mechanisms
utilized by the cell (Barbosa and Levy, 2000).
There are two general types of mechanisms by which bacteria can obtain
antibiotic resistance: intrinsic and acquired (Alekshun and Levy, 2007). Intrinsic
resistance comes from antibiotic resistance genes (ARGs) naturally found on the
bacterium’s chromosome while acquired resistance comes from the transfer or mutation
of genes targeted by an antibiotic (Alekshun and Levy, 2007). Intrinsic resistance is
spread vertically between mother and daughter cells through proliferation, while acquired
resistance is spread horizontally between different bacteria through a variety of transfer
mechanisms (Licht and Wilcks, 2006).
Conjugation is the most common transfer mechanism for acquired resistance and
involves the exchange of either chromosomal or extra-chromosomal DNA via cell-to-cell
contact (Barbosa and Levy, 2000). Plasmids are extra-chromosomal, double-stranded,
circular DNA that often carry multiple resistance genes (O'Brien, 2002). Transposons are
chromosomal DNA segments that are cut from the chromosome and transferred to new
bacterial chromosome where it is integrated (Licht and Wilcks, 2006). While plasmids
are capable of independent replication, transposons instead depend on replication of the
host chromosome (Licht and Wilcks, 2006). Both plasmids and transposons allow for the
rapid and relatively easy spread of antibiotic resistance among all types of bacteria.
Other mechanisms of acquired resistance transfer include transformation and
transduction. Transformation occurs when a bacterium takes up “naked” DNA from its
environment (Barbosa and Levy, 2000). This DNA most often comes from the death and
lysis of another bacterium, which releases DNA into the environment (McAllister et al.,
7
2001). Transduction occurs when a bacterium obtains new DNA via infection by a
bacteriophage (Barbosa and Levy, 2000). Although these transfer mechanisms are not as
common as conjugation, they still play a role in the movement of resistance genes.
Whether intrinsic or acquired, the genes that produce antibiotic resistance within a
bacterium through direct or indirect means make up the antibiotic “resistome” (Wright,
2012). This “resistome” includes the “housekeeping” genes that, through mutation or
overexpression, produce resistance (Wright, 2012). Therefore, these “housekeeping”
genes are considered “proto-resistance” elements (Wright, 2012). This antibiotic
“resistome” serves as a resistance gene database to which all bacteria have access.
Cephalosporin Resistance
First- (e.g. cephapirin, cefazolin) and second-generation (e.g. cefuroxime,
cefotetan) cephalosporins are referred to as narrow-spectrum cephalospsorins (Jacoby
and Munoz-Price, 2005; Seiffert et al., 2013). Third- (e.g. ceftriaxone, ceftiofur) and
fourth-generation (e.g. cefepime, cefpirome) cephalosporins are called extended-
spectrum cephalosporins (Seiffert et al., 2013). However, all cephalosporin generations
fall into the -lactam drug class (Seiffert et al., 2013).
Cephalosporins, like other -lactams, function by attacking synthesis of
peptidoglycan (or murein), a cell wall component that all bacteria possess with higher
levels present in Gram-positive than Gram-negative bacteria (McDermott et al., 2003;
Seiffert et al., 2013). There are four major events that occur during peptidoglycan
synthesis: (1) cell wall precursors are synthesized in the cytoplasm; (2) precursors are
bound to a lipid and then taken across the cytoplasmic membrane; (3) pre-formed glycan
components are incorporated into the cell wall; and finally (4) transpeptidation bonding
8
and subsequent maturation (McDermott et al., 2003). Cephalosporins inhibit
peptidoglycan synthesis at stage 4 by blocking the transpeptidation reaction through
binding with penicillin-binding proteins (PBPs) (Nikolaidis et al., 2014). PBPs are
enzymes that catalyze the process of cross-linking peptides, or transpeptidation
(Nikolaidis et al., 2014).
As is true of resistance to other -lactams, there are four different mechanisms
through which bacterial resistance to cephalosporins occurs: (1) altering of the PBP’s
active site to which the drug binds or acquiring new PBPs that are less susceptible; (2)
producing -lactamases that hydrolyze the -lactam ring, inactivating the drug; (3)
preventing the drug from reaching its target site by changing cell wall porins; and (4)
actively pumping the drug out of the cell (McDermott et al., 2003). The mechanisms of
altering cell wall porins and developing a drug efflux system both may lead to multiple
drug resistance since other drugs may also enter the cell via the same porins or be
expelled from the cell via the same efflux system (McDermott et al., 2003).
The major gene class that confers resistance to extended-spectrum cephalosporins
(and other -lactams) is the bla class of genes, which encodes for -lactamases (Seiffert
et al., 2013). Another gene that encodes for -lactamases is ampC, but this gene only
confers resistance to third-generation cephalosporins (Seiffert et al., 2013). The bla genes
are often found on mobile genetic elements such as plasmids, transposons, or integrons,
while ampC tends to be found on either plasmids (pampC) or the bacterial chromosome
(campC) (Seiffert et al., 2013). In the animal industry, the blaESBL genes encoding CTX-
M-types are the most common agents of extended-spectrum cephalosporin resistance
with CTX-M-1, -14, and -15 enzyme types being predominant in cattle in the U.S.

9
(Seiffert et al., 2013). However, the blaCMY-2 gene, a plasmid-encoded -lactamase that
functions similar to AmpC, accounts for roughly 95% of detected bla genes in American
cattle giving it more interest than the CTX-M-types (Alcaine et al., 2005; Seiffert et al.,
2013).
Lincosamide Resistance
Lincosamides are a class of antibiotics that operate by inhibiting bacterial protein
synthesis (Roberts, 2004). Protein synthesis is halted when lincosamides bind to tRNA at
the 50S subunit preventing transpeptidation, causing tRNA to break away from the
ribosome (McDermott et al., 2003). Affinity for the 50S subunit binding site is shared by
other antimicrobial classes like macrolides and streptogramin B even though they all
possess a different structure (Roberts, 2004). Since they function similarly, these
antimicrobials are often linked together and called the Macrolide-Lincosamide-
Streptogramin (MLS) group (Roberts, 2004).
Resistance to MLS antibiotics most commonly results when a bacterium obtains
an rRNA methylase that inhibits the ability of the MLS to bind to the 50S subunit on the
bacterial ribosome (Roberts, 2004). The group of genes responsible for 30 different
rRNA methylases is the erm genes (Roberts, 2004). The ermF gene can actually be found
in 20 different genera and both ermF and ermB are known to be linked to tet genes,
encoding for tetracycline resistance (Roberts, 2004).
Another mechanism of MLS resistance involves protein transporters that act like
an efflux system and pump the incoming antibiotic back out of the cell allowing ribosome
function to remain unaltered (Roberts, 2004). There are several types of transporters
responsible for this phenomenon including ATP transporters, facilitator transporters, and

10
eight different transferases (Roberts, 2004). A wide variety of genes code for ATP
transporters, with each bacterial genus having its own set of genes, while the genes
encoding for facilitator transporters (lmrA, mefA) and transferases (lnu, vat) are more
specific (Roberts, 2004).
Ionophore Resistance
Ionophores are antimicrobials administered through cattle feed, originally used to
treat or prevent intestinal parasites but now with the intention of growth promotion
(Callaway et al., 2003). The ionophores fed to cattle belong to the carboxylic group, also
known as polyether antibiotics, and are further split into monovalent or divalent polyether
categories based on how they transport monovalent (e.g. K+, Na+) or divalent (e.g. Ca2+,
Mg2+) cations (Butaye et al., 2003). Monensin (Rumensin), a monovalent polyether
antibiotic produced by Streptomyces cinnamonensis, exchanges H+ for either extracellular
Na+ or intracellular K+, leading to interference with ion gradients and ATP hydrolysis and
eventually causing bacterial cell death (Butaye et al., 2003; Callaway et al., 2003).
Lasalocid, produced by Streptomyces lasaliensis, is another polyether antibiotic that is
instead divalent, preferring to transport Ca2+ and K+ (Westley, 1977). Although different
in structure, monensin and lasalocid function similarly in their effect on weight gain and
feed efficiency in cattle (Berger et al., 1981).
Bacteria become resistant to ionophores via different mechanisms such as
preventing the binding of the ionophore to the bacterial cell wall or by reducing cell
membrane porin size to prevent ionophore entry (Callaway et al., 2003). Development of
ionophore resistance can occur naturally without ionophore exposure, but mainly
develops in the presence of ionophore selection pressure (Dawson and Boling, 1983;

11
Houlihan and Russell, 2003). Ionophore resistance has not been linked to any genetic
element so transfer of resistance between bacteria is unlikely (Lana and Russell, 1996;
Houlihan and Russell, 2003). Lastly, bacterial resistance to ionophores does not appear to
result in additional resistance to therapeutic antibiotics as they have different mechanisms
of action for inhibiting bacterial growth or causing bacterial death (Houlihan and Russell,
2003).
BOVINE ANTIBIOTIC METABOLISM AND RESIDUE EXCRETION
When an antibiotic is administered to an animal it is not fully absorbed, resulting
in residues being excreted in either feces or urine. In fact, from a single antibiotic dose up
to 90% may be excreted through urine; other antibiotics are excreted via feces (up to
75%) (Sarmah et al., 2006). Antibiotics may be excreted as the parent compound or as
metabolites, but the distinction makes little difference as metabolites may be converted
back into the parent compound upon excretion (Sarmah et al., 2006). These excreted
antibiotics can persist in the environment and may contribute to the maintenance and
development of antibiotic resistance as environmental bacteria are exposed to these
compounds (Sarmah et al., 2006). Therefore, antibiotic metabolism, excretion, and
environmental degradation are important.
Metabolism and Excretion of Cephalosporins
Cephalosporin antibiotics are semisynthetic and are adapted from cephalosporin
C, a compound naturally produced by Cephalosporium acremonium (Alcaine et al.,
2005). There are a variety of cephalosporin forms that can be administered either
intramammary (e.g. cephapirin), or intramuscularly and subcutaneously (e.g. ceftiofur
crystalline free acid sterile suspension or CCFA-SS).
12
In cattle, CCFA-SS is routinely given behind the ear and is quickly metabolized
upon injection (Washburn et al., 2005; Volkova et al., 2012). When metabolized by the
body, ceftiofur becomes desfuroylceftiofur, which remains active because the -lactam
ring is maintained (Washburn et al., 2005; Volkova et al., 2012). It has been shown that
subcutaneous administration of ceftiofur in beef calves results in blood concentrations
that remain at or above 0.2 g/mL for up to 8 days post-administration (Washburn et al.,
2005). When excreted in cattle, roughly 65% of ceftiofur and desfuroylceftiofur exit
through the urine, while roughly 35% does so through the feces (Volkova et al., 2012).
About 29% of intramuscularly injected ceftiofur was detected in cattle feces 8 hours post-
injection, with 37% detected after 12 hours (Volkova et al., 2012). The majority of
ceftiofur recovered in feces does not show any kind of antimicrobial activity even though
the ceftiofur is believed to cross over the wall of the large intestine with its -lactam ring
still intact (Volkova et al., 2012).
The first-generation cephalosporin, cephapirin, is routinely given intramammary
for the purpose of treating or preventing mastitis (dry cow therapy) (Pol and Ruegg,
2007). When two doses of 275 mg cephapirin sodium were given per quarter at 12-hour
intervals, both cephapirin and its metabolite, desacetyl-cephapirin, were detected in the
milk of healthy and mastitic cows for up to 48 hours post-administration of the second
dose (Cagnardi et al., 2014). Since cephapirin is highly ionized and has low lipid
solubility, it is not very capable of reaching deeper udder tissues and blood (Gehring and
Smith, 2006). Therefore, most cephapirin excretion is via milk.

13
Metabolism and Excretion of Lincosamides
Modern lincosamide antibiotics are semisynthetic derivatives of the naturally
produced lincomycin, including clindamycin and pirlimycin (Morar et al., 2009). These
antibiotics are effective against Gram-positive bacteria but can be used against some
Gram-negative bacteria and protozoa (Morar et al., 2009). Both clindamycin
hydrochloride and pirlimycin hydrochloride are approved for animal use in the United
States (FDA, 2014).
When pirlimycin is infused into the cow’s udder it is slowly absorbed across the
udder membrane/blood barrier with blood concentrations being highest 6 to 12 hours
post-treatment (Hornish et al., 1992). What remains unabsorbed in the udder is quickly
expelled in the first few milkings following treatment, resulting in roughly 50% of the
dose being excreted in the milk as intact pirlimycin (Hornish et al., 1992). Once the
absorbed pirlimycin is circulated throughout the vascular system, about 10% of the total
dose is excreted through the urine and about 24% through the feces (Hornish et al., 1992).
Of the pirlimycin excreted renally, 80% remains intact while 8% is metabolized into
pirlimycin sulfoxide (Hornish et al., 1992). Of that excreted via feces, 45% remains intact
while only 1.5% is metabolized into pirlimycin sulfoxide (Hornish et al., 1992). Overall,
about 89% of the total administered pirlimycin dose is recovered in the milk, urine, and
feces (Hornish et al., 1992).
METHODS FOR MEASURING ANTIBIOTIC RESISTANCE
Traditional Culture-Based Methods
The two main traditional methods for studying the antibiotic resistance phenotype
in bacteria are the agar disc diffusion test and the dilution-based test (Schmieder and
14
Edwards, 2012). Both tests involve first isolating the bacteria of interest from an infected
human or animal and then evaluating their ability to grow following antibiotic exposure
(Cockerill, 1999). In order to accurately perform these tests, the Clinical Laboratory
Standards Institute (CLSI), formerly known as the National Committee for Clinical
Laboratory Standards (NCCLS), provides standards for media preparation, incubation
requirements, and explains how to properly interpret the results (Cockerill, 1999).
Standards are provided for aerobic and anaerobic bacteria and for yeasts, and all are
updated regularly (Cockerill, 1999).
The agar disk diffusion test involves soaking a paper disc with an antibiotic and
placing the disc onto agar that has been seeded with the bacteria of interest (Gavin,
1957). The agar can be prepared a variety of ways, including seeding the entire agar with
bacteria or pouring inoculated agar (seed layer) over nutrient agar (base layer) (Gavin,
1957). The antibiotic will diffuse through the agar, producing a zone of inhibition around
the paper disc because of its effect on the bacteria (Gavin, 1957; Papich, 2013). The
larger the zone of inhibition (diameter that is measured in millimeters) the more
susceptible the bacteria are to the antibiotic (Papich, 2013). An ideal zone is one that is
well defined and easy to identify and large plates with multiple discs are often used in
order to obtain accurate zone measurements (Gavin, 1957). Although an agar disc
diffusion test is simple, it is limited to antibiotics that will readily diffuse through agar
and the results of one antibiotic cannot be compared to another (Gavin, 1957). And,
although the minimum inhibitory concentration (MIC) of a bacterium can be estimated
based on the size of the zone of inhibition it should not be used to identify the actual MIC
value (Papich, 2013).

15
A dilution-based test, or microdilution test, is the way to directly obtain the MIC
value of a bacterium (Papich, 2013). The MIC is defined as the lowest concentration of
an antibiotic that prevents visible bacterial growth (Papich, 2013). The test requires
inoculating a multiple wells of a well plate with the bacteria of interest and then adding
different dilutions of an antibiotic to the wells as a serial dilution (Papich, 2013). This
MIC is determined based on a standard and is reported as g/mL for the first antibiotic
concentration in which the bacteria is unable to grow (Papich, 2013). The level of
resistance to an antibiotic can then be determined based on CLSI classifications for MIC
values: S, susceptible; I, intermediate; or R, resistant (Papich, 2013).
The advantages of using culture-based methods are that they enable the phenotype
to be studied, requiring no extrapolations on the expression of a genotype, and they allow
for a comprehensive view of the resistance expressed (Cockerill, 1999). However, the
disadvantages are that most bacteria cannot be cultured, the tests are slow as they are
based on organism growth, and results may be misleading as these bacteria are tested
under artificial conditions (Cockerill, 1999). To overcome these disadvantages, newer
genetic-based methods like quantitative real-time polymerase chain reaction and
metagenomic sequencing were developed.
Quantitative Real-Time Polymerase Chain Reaction
Polymerase chain reaction (PCR) is a method that can detect resistance genes
within an environmental sample based on the exponential amplification of a targeted
DNA sequence (Steffan and Atlas, 1991). The three stages of PCR include: (1) melting
the double-stranded DNA down to single-stranded DNA; (2) annealing primers to the
target DNA; and (3) using DNA polymerase to extend the DNA through nucleotide
16
addition (Steffan and Atlas, 1991). Oligonucleotide primers are used to hybridize to the
DNA surrounding a target sequence, enabling the duplication of that specific sequence
through PCR (Steffan and Atlas, 1991). It is possible to amplify several target sequences
simultaneously through the use of multiple primer sets, a process called multiplex PCR
(Steffan and Atlas, 1991).
Quantitative real-time polymerase chain reaction (qPCR) is a form of PCR that
allows for quantification during sequence amplification by using fluorescence (Wilhelm
and Pingoud, 2003). This reaction relies on a reporter molecule (TaqMan or SYBR
Green) that increases its fluorescence level based on the accumulation of PCR product
within an amplification cycle (Sirohi et al., 2012). An amplification curve involves three
phases: (1) an initial lag phase where there is no product accumulation; (2) an exponential
phase; and (3) a plateau phase (Wilhelm and Pingoud, 2003). It is in the exponential
phase that the threshold and signal curve must intersect in order for quantification to
occur (Wilhelm and Pingoud, 2003). Where the two intersect is called the threshold value
(CT) and this value is used to quantify the number of genes present in the sample based
on the number of cycles needed for the signal to reach the threshold (Wilhelm and
Pingoud, 2003).
qRT-PCR has become an important tool in the detection and quantification of
resistance genes within a bacterial community (Sirohi et al., 2012). However, due to
limited knowledge of resistance genes and the subsequent lack of available primers, it can
only be implemented to detect the few well-studied genes within a sample, leaving other
genes unidentified (Yang et al., 2013).
17
Metagenomic Sequencing
Metagenomics involves the study of all metagenomes whether bacterial, viral, or
fungal, present in an environmental sample (Penders et al., 2013). There are three
different approaches for analyzing a metagenome: targeted (PCR-based), functional, and
sequenced-based (shotgun) metagenomics (Penders et al., 2013). Targeted metagenomics
involves using real-time PCR to analyze samples for known resistance genes (Penders et
al., 2013). Functional metagenomics requires placing DNA fragments of interest into a
host (ex. E. coli) via a vector (e.g. a plasmid), and then testing the transformant for
antibiotic resistance expression by plating it on an antibiotic-containing media (Penders
et al., 2013). If the transformant grows then its DNA is sequenced (Penders et al., 2013).
Lastly, sequenced-based metagenomics involves extracting DNA from a given sample,
fragmenting it, randomly sequencing the extracted DNA, and then comparing the
sequence output to a database to identify resistance genes (Penders et al., 2013). The two
most common techniques used for sequence-based metagenomic sequencing are Roche
454 Pyrosequencing and Illumina GAIIX Sequencing.
Roche 454 Pyrosequencing
Roche 454 pyrosequencing is a technique based on the “sequencing-by-synthesis”
principle, meaning a sample is sequenced by monitoring DNA synthesis via
bioluminescence (Sirohi et al., 2012). This was the first “next-generation” system to be
commercially successful (Liu et al., 2012). Pyrosequencing is, at its core, a
revolutionized version of Sanger DNA sequencing, which was developed in the late
1970s (Ahmadian et al., 2006). The Sanger technique was the first to use DNA synthesis
as a means of sequencing samples and it involved the incorporation of both
18
deoxyribonucleotide triphosphates (dNTPs) and dideoxyribonucleotide triphosphates
(ddNTPs) used to create DNA fragments (Ahmadian et al., 2006). These fragments were
then separated by size and analyzed using gel electrophoresis (Ahmadian et al., 2006). In
contrast, pyrosequencing is performed by sequentially adding nucleotides to a primed
template, thus determining the sequence of the template based on the order of the
synthesized complementary DNA strand (Ahmadian et al., 2006).
The first step in the enzymatic pyrosequencing reaction is emulsion PCR,
resulting in the production of a DNA template which is then used for sequencing (Novais
and Thorstenson, 2011). This involves isolating and fragmenting genomic DNA,
followed by ligating “A” and “B” adaptors to either end of the single-stranded DNA
fragments (Novais and Thorstenson, 2011). A magnetization process is then used to bind
these fragments to specialized beads, with one fragment per bead, before isolating each
fragment-bead complex in a droplet of a “PCR-reaction-mixture-in-oil emulsion” (Novais
and Thorstenson, 2011). Within the droplet, amplification of the fragment occurs,
producing ten million copies on the surface of the bead: the DNA template (Novais and
Thorstenson, 2011). The emulsion is then broken and the DNA strands contained on the
bead are denatured into single-stranded DNA (Margulies et al., 2005). The DNA-
containing bead is then loaded into a well on a fiber optic slide (PicoTiterPlateTM) along
with other beads containing the enzymes needed for the pyrophosphate sequencing step
(Margulies et al., 2005).
The pyrophosphate-sequencing phase begins by adding deoxynucleotides (dATP,
dCTP, dGTP, or dTTP) stepwise to the well of the fiber optic plate (França et al., 2002).
If the deoxynucleotide is complementary to the base in the template strand then it is
19
incorporated via DNA polymerase and a pyrophosphate (PPi) is released, directly
proportionate in amount to the number of deoxynucleotides incorporated (ex. 1 PPi for
each 2 dATPs incorporated) (França et al., 2002). Released PPi are converted to ATP via
ATP sulfurylase, providing the energy for the oxidation of luciferin by luciferase, thus
generating light (Ronaghi and Elahi, 2002). The light generated is detected by a photon
detector device, producing a pyrogram that is analyzed to determine the sequence of the
DNA template strand (Ronaghi and Elahi, 2002).
There are two types of pyrosequencing approaches: solid-phase sequencing and
liquid-phase sequencing (França et al., 2002). Solid-phase sequencing is a three-enzyme
reaction and involves a washing step between each deoxynucleotide addition to remove
the deoxynucleotides that were not incorporated in order to prevent interference with the
reaction (França et al., 2002). Liquid-phase sequencing is similar to solid-phase except
that it has a nucleotide-degrading enzyme, apyrase, making it a four-enzyme reaction
(França et al., 2002). The use of apyrase makes the washing steps between
deoxynucleotide addition unnecessary (França et al., 2002).
Multiplexing can be used in pyrosequencing to sequence several samples
simultaneously by barcoding the DNA templates prior to sequencing (Novais and
Thorstenson, 2011). The pyrogram produced by multiplexed pyrosequencing is then
deconvoluted to obtain separate data for each DNA template (Ronaghi and Elahi, 2002).
Using this approach reduces the cost of analyzing samples.
Illumina Genome Analyzer (GAIIx) Sequencing
Like Roche 454 pyrosequencing, Illumina GAIIX Sequencing is also based on the
“sequencing-by-synthesis” principle. However, Illumina produces ten times more

20
sequence information than 454 pyrosequencing at roughly the same cost, but with shorter
read lengths and a longer run time (Fox et al., 2009). Therefore, the newer Illumina
technology has become the preferred approach for applications that require deep
sequencing and where shorter read lengths are sufficient (Fox et al., 2009).
Illumina implements solid-phase amplification and begins by fixing adaptors to
the fragmented sample DNA strands, or DNA library (Fox et al., 2009; Liu et al., 2012).
The double-stranded DNA is then denatured into single strands and attached to a solid
surface, called a single-molecule array or flow cell, followed by bridge amplification
(Morozova and Marra, 2008; Liu et al., 2012). The process of bridge amplification
involves attaching one end of the single-stranded DNA to the flow cell via an adaptor; the
strand then bends over and hybridizes to complementary adaptors also located on the
flow cell (Morozova and Marra, 2008). This “bridge” becomes the template for the
sequencing step, but is first PCR-amplified to produce about 1000 copies of the template,
forming a “cluster” (Morozova and Marra, 2008). The flow cell will ultimately hold
more than 40 million clusters, all created from the original DNA library (Morozova and
Marra, 2008).
The sequencing phase of Illumina involves flooding the flow cell with dNTPs
(dATP, dGTP, dCTP, and dTTP), each containing its own fluorescently labeled 3’-
reversible terminator (Fox et al., 2009). This “reversible terminator” allows for each
cycle of the reaction to occur simultaneously with all four deoxynucleotides present
(Imelfort and Edwards, 2009). These fluorescently-labeled terminators each have a
different color, so each dNTP will flash its specific color upon incorporation into the
complementary strand by DNA polymerase (Morozova and Marra, 2008). The color
21
signal released is captured by a charge-coupled device (CCD) and thus finishes a single
sequencing cycle (Liu et al., 2012). The 3’-terminator is removed prior to the start of the
next cycle, a process that is repeated for multiple cycles (Fox et al., 2009).
Functional Analysis
Functional metagenomics is a means of identifying the functions of the genes
possessed in a bacterial genome, including functions like transferrable antibiotic
resistance (Pehrsson et al., 2013). This process involves shotgun-cloning community
DNA and then inserting the library created into an indicator host; the host is selected for
the desired function and its DNA is sequenced (Pehrsson et al., 2013).
While this process allows for gene function to be identified, functional analysis
(or “profiling”) of a sequence instead gives the predicted function of a gene (its gene
“profile”) (Durso et al., 2011). This is a much simpler process where the community
DNA is isolated, sequenced, and the sequences are analyzed against different databases to
identify the genes’ potential roles in the cell; examples of these databases are the SEED,
MG-RAST, BLAST, and ARBD. The genetic information in these metagenomic
databases is derived from a variety of resources including previously developed
databases, published literature where bacterial genes were identified, and data
submissions by users of the databases (Peri et al., 2003; Pruitt et al., 2005; Liu and Pop,
2009).
The SEED
The SEED is a family of databases that stores all publicly accessible genomic
sequences and provides the framework for several annotation pipelines including MG-
RAST (Disz et al., 2010). The SEED was initially developed by the Fellowship for the
22
Interpretation of Genomes and was intended to serve as a way for researchers to assemble
and manage gene annotations (Overbeek et al., 2004). This family of databases is
organized via subsystems, where each subsystem is a group of related biological
functions that together form a specific process (Overbeek et al., 2004). It is through these
subsystems that an organism’s genes can be annotated (Overbeek et al., 2004).
There are four methods by which SEED data can be accessed and utilized, called
the SEED servers (Aziz et al., 2012). These four servers are: (1) the Sapling Server; (2)
the Annotation Support Server; (3) the RAST Server; and (4) the Metabolic modeling and
Flux Balance Analysis (FBA) Server (Aziz et al., 2012). The Sapling Server gives access
to the SEED through an entity-relationship data model (ERDB), allowing for direct
comparisons against the database (Aziz et al., 2012). The Annotation Support Server
enables new protein or DNA sequences to be annotated and assigned subsystems (Aziz et
al., 2012). The Rapid Annotation using Subsystems Technology (RAST) server allows
new genomes to be submitted and annotated using a web interface (Aziz et al., 2012).
Finally, the FBA server allows access to the Model SEED which houses a biochemistry
and metabolic model database at the genome level (Aziz et al., 2012). Together these
servers provide a wide array of means for annotating and studying genomes and
metagenomes.
MG-RAST
“Meta Genome Rapid Annotation using Subsystems Technology ” (MG-RAST) is
an analysis pipeline used for gene prediction and functional annotation all using the
SEED system (Port et al., 2012; Thomas et al., 2012; Overbeek et al., 2014). Once a new

23
genome is annotated using MG-RAST, it can be made public and added to the SEED for
other researchers to reference (Overbeek et al., 2014).
BLAST
“Basic Local Alignment Search Tool” (BLAST) serves as a method of identifying
sequence similarity between sequence pairs in order to provide identification (Altschul et
al., 1990). This comparison is done by calculating a maximal segment pair (MSP) score,
defined as the pair of identical segments between two sequences that has the highest
score (Altschul et al., 1990). The best MSP score, between a user-submitted protein or
nucleotide sequence and a known database sequence, provides sequence identification
(Altschul et al., 1990). BLAST can be used as an individual program or through a web
interface maintained by the National Center for Biotechnology Information (NCBI)
(McGinnis and Madden, 2004).
There are currently five types of BLAST programs: (1) BLASTP; (2) BLASTN;
(3) BLASTX; (4) TBLASTN; and (5) TBLASTX (Pertsemlidis et al., 2001). BLASTP
involves the submission of an amino acid sequence and then identifying the sequence
using a protein sequence database (Pertsemlidis et al., 2001). BLASTN takes a
nucleotide sequence and compares it against a nucleotide sequence database (Pertsemlidis
et al., 2001). BLASTX takes a nucleotide sequence and translates it in order to identify
the resulting protein using a protein sequence database (Pertsemlidis et al., 2001).
TBLASTN translates a protein sequence and identifies its nucleotide sequence by
comparing it against a nucleotide sequence database (Pertsemlidis et al., 2001). Finally,
TBLASTX compares nucleotide translations against the translations found in a nucleotide
sequence database (Pertsemlidis et al., 2001).

24
ARDB
The “Antibiotic Resistance Gene Database” (ARDB) enables the identification
and classification of antibiotic resistance genes (Liu and Pop, 2009). The antibiotic
resistance gene sequences were pooled from the NCBI nucleotide and protein databases,
as well as from the Swiss-Prot database, and categorized based on their protein sequence
similarity (Liu and Pop, 2009). The ARDB operates using the BLAST program, taking
BLAST “hits” and grouping them according to resistance type based on their similarity to
sequences within the ARDB (Liu and Pop, 2009). The ARDB currently offers
information on resistance to 257 antibiotics and 13,293 genes associated with resistance
(Liu and Pop, 2009).
ANTIBIOTIC RESISTANCE IN BOVINE BACTERIA
Gastrointestinal (GI) Tract
It is important to separate analysis of the published literature on antibiotic
resistance in bovine bacteria into those bacteria housed in the gastrointestinal (GI) tract
and those housed in the feces because microbial communities change throughout the
digestive tract, potentially impacting the antibiotic resistance gene profile (Frey et al.,
2010). However, no published research is available analyzing changes in resistance in
different segments of the mature bovine GI tract.
Feces
While the resistance profile of bacteria in the bovine GI tract is important as it
directly affects the success of antibiotic treatment, the resistance profile of excreted
bovine feces is of even greater importance as it directly impacts the environment and has
the potential to impact human health. However, on the question of whether fecal
25
antibiotic resistance is produced upon antibiotic administration is addressed, the available
data are conflicting.
Resistance in Cattle with no Antibiotic Exposure
The first question of interest is whether antibiotic resistance exists in healthy cows
with no history of antibiotic exposure. When fecal grab samples were collected from
healthy beef heifers and analyzed using shotgun metagenomics about 8% of the
sequences were associated with virulence genes (Durso et al., 2011). Of the 8%, roughly
40% of the virulence genes coded for multidrug resistance efflux pumps and 20% coded
for fluoroquinolone resistance (Durso et al., 2011). Although the presence of these genes
does not necessarily indicate a resistant phenotype, the authors concluded that there is a
baseline level of potential resistance in bovine fecal bacteria without any selection
pressure from antibiotics (Durso et al., 2011).
Resistance in Organic vs. Conventionally Raised Cattle
Differences have been observed in the resistance profiles of fecal bacteria from
cows housed on conventional farms, where antibiotics are routinely administered, and
cows housed on organic farms where antibiotics are not allowed. A significantly higher
rate of resistance in E. coli isolates from conventional dairy cows to ampicillin,
streptomycin, kanamycin, gentamicin, chloramphenicol, tetracycline, and
sulfamethoxazole was found when compared with organic dairy cows (Sato et al., 2005).
While there was an increase in single-drug resistance, there was no effect of farm type on
multidrug resistance in E. coli isolated from adult dairy cows (Sato et al., 2005). When
tested specifically for cephalosporin resistance, fecal samples had significantly more
ESBL-producing E. coli in cows from conventional dairy farms where the use of third-

26
and fourth-generation cephalosporins was common (Dolejska et al., 2011). A
significantly higher proportion of Campylobacter spp isolates from conventional dairy
cows were resistant to tetracycline, requiring a tetracycline concentration four times
higher than organic dairy cow Campylobacter spp to inhibit the growth of 50% of the
isolates (Halbert et al., 2006). However, resistance to erythromycin, clindamycin,
ampicillin, ceftriaxone, streptomycin, and many other antimicrobials tested were all
statistically similar between conventional and organic dairy cow Campylobacter spp
isolates (Halbert et al., 2006). These studies show that bacteria isolated from the feces of
cows raised on conventional farms tend to be more resistant to some (but not all)
antibiotics than those isolated from cows raised under organic conditions.
When considering the issue of antibiotic resistance changes in conventional
versus organic or natural systems, the tendency for higher resistance levels in the feces of
conventionally raised feedlot cattle is offset by other environmental impacts of the
management practice (Morley et al., 2011). When compared with conventionally raised
cows, the amount of rearing time required for naturally raised cows (no exposure to
antimicrobial drugs, hormone implants, or anthelmintic drugs) is greater by an average of
50 days (Morley et al., 2011). This extended feeding time results in 1,500 extra kg of
feces and 750 extra L of urine per feedlot animal (Morley et al., 2011). With daily
excretion of antibiotic resistance genes (or antibiotic resistant bacteria) being fairly
similar between systems, the increase in fecal and urine output in natural/organic systems
may result in a greater overall resistance problem.
Resistance when Treating Cattle with Antibiotics

27
When cattle are therapeutically treated with antibiotics, impacts on their fecal
bacteria are likely. When fecal samples were taken from dairy cows with previous
ceftiofur treatment there was no correlation at the cow level between treatment and E.
coli isolates resistant to ceftriaxone (Tragesser et al., 2006). However, there was a
correlation at the herd level where herds with ceftiofur use were 25 times more likely to
have cows with reduced-susceptibility E. coli (Tragesser et al., 2006). This implies that
treating an individual cow with ceftiofur can lead to the spread of extended-spectrum
cephalosporin resistance within a herd (Tragesser et al., 2006).
Contradicting the study performed by Tragesser and colleagues, other research
showed no impact of previous ceftiofur treatment on the presence of the blaCMY-2 gene in
E. coli isolates and there was no correlation between use of the drug and susceptibility to
ceftazidime at the herd level (Daniels et al., 2009). Another study showed that neither the
previous rate of ceftiofur treatment nor treatment itself was associated with the presence
of blaCTX-M or blaCMY-2 genes in E. coli isolates from dairy cattle manure (Mollenkopf et
al., 2012).
When dairy cows diagnosed with either metritis or interdigital necrobacillosis
were treated with either ceftiofur or penicillin there was no significant change in
resistance from the pre-treatment baseline in isolated E. coli (Mann et al., 2011). When
sick dairy cows were treated with ceftiofur, ceftiofur-resistant E. coli appeared shortly
after antibiotic treatment but remained low in number and were replaced with a
susceptible E. coli population when the effects of the antibiotic disappeared (Singer et al.,
2008).
28
When beef steers where administered a single subcutaneous injection of
florfenicol there was no long-term impact on E. coli resistance to a wide variety of
antimicrobials, with resistance levels significantly reduced by four weeks post-treatment
(Berge et al., 2005). Finally, healthy beef steers were given ceftiofur crystalline-free acid
(CCFA) subcutaneous injections, which resulted in E. coli populations with reduced-
susceptibility to ceftiofur shortly after treatment (Lowrance et al., 2007). However, the E.
coli returned to pre-treatment susceptibility levels within 15 days of CCFA
administration (Lowrance et al., 2007). While the effect of antibiotic treatment on fecal
bacteria is not consistent, these studies suggest a short-term increase in resistance after
treatment followed by a return to the pre-treatment resistance level.
Resistance when Feeding Cattle Subtherapeutic Antibiotics
The feeding of antibiotics has perhaps the greatest potential impact on the
contribution of animal agriculture to the global problem of antibiotic resistance. In 2011,
over 4.1 million kg of ionophores and 5.6 million kg of tetracyclines, the most commonly
fed antibiotics, were given to domestic food producing animals (FDA, 2011). Together
these antibiotic classes made up over 70% of the total antibiotics given to food producing
animals in 2011, so clearly the oral route of administration requires attention.
When feedlot steers were fed the ionophore lasalocid there was no effect on fecal
coliform resistance to tetracyclines, florfenicol, or sulfonamides (Edrington et al., 2006).
Feeding monensin only, or in combination with tylosin, to beef heifers increased the level
of macrolide resistance in commensal Enterococcus but had no effect on the fecal
shedding of ermB, a gene coding for macrolide resistance, or tetM (Jacob et al., 2008).
Feeding monensin, tylosin, or virginiamycin to feedlot steers had no effect on E. coli
29
resistance to ampicillin, tetracycline, or gentamicin (Alexander et al., 2008). When
feedlot steers were fed chlortetracycline, chlortetracycline and sulfamethazine, or tylosin
phosphate there was no significant effect on the fecal excretion of tet, erm, or sul genes
(Alexander et al., 2011). E. coli isolated from feedlot steers fed chlortetracycline,
chlortetracycline and sulfamethazine, or virginiamycin showed similar resistance levels
as control steers to tetracycline, streptomycin, sulfamethoxazole, and ampicillin,
indicating no effect of oral antibiotic administration on the expression of resistance in
fecal E. coli (Mirzaagha et al., 2011). Finally, feeding steer calves chlortetracycline and
sulfamethazine or chlortetracycline alone increased the percentage of fecal C.
hyointestinalis isolates resistant to erythromycin and tetracycline, and feeding
chlortetracycline alone increased the percentage of fecal C. jejuni resistant to tetracycline
when compared to control calves (Inglis et al., 2005). However, in the same study,
feeding calves virginiamycin, monensin, or tylosin phosphate resulted in no change in
fecal C. hyointestinalis resistance to ampicillin, erythromycin, or tetracycline and even
decreased the percentage of C. jejuni isolates resistant to ampicillin when compared with
isolates from control calves (Inglis et al., 2005). Therefore, the published research shows
a weak link, if any, between feeding antibiotics and antimicrobial resistance
development. In fact, feeding antibiotics may not be the only factor influencing the
development of antibiotic resistance in bovine fecal bacteria. Other factors, such as diet,
may be major contributors and further research needs to be conducted to determine the
clear effect of feeding antibiotics (Mirzaagha et al., 2011).
30
ENVIRONMENTAL EFFECTS AND POTENTIAL IMPACT
When studying the impact of antibiotic administration in animals on the excretion
of ARGs, the major concern is the fate of those ARGs upon excretion. One of the biggest
problems is water contamination, as water in close proximity to agricultural activity tends
to contain higher levels of ARGs than more distant waters (Pruden et al., 2006). This
contamination is likely due to runoff from farms, as resistance genes tetW and tetQ were
found in both the cow feces and runoff from cattle farms (Santamaría et al., 2011).
Human contact with the ARGs found in water from an agricultural source is a direct point
of entry of these resistance genes to the human microbiome.
Another problem stemming from ARG excretion is the use of contaminated
manure as fertilizer for crops. When fresh dairy manure was used to fertilize soil plots
growing a wide variety of vegetables, manuring was associated with the presence of sul2,
ermF, qnrB, blaPSE, and blaOXA-20 resistance genes on the harvested vegetables (Marti et
al., 2013). The consumption of these contaminated vegetables without properly washing
or peeling the vegetables provides a means of transfers of these resistance genes from
bacteria in the manure to human gut bacteria (Marti et al., 2013).
Finally, the soil that comes in contact with animal manure containing ARGs is yet
another major area of concern. It is estimated that the majority of animal manure
produced by concentrated animal feeding operations (CAFO) is land applied within a 10-
mile radius of the CAFO (Sarmah et al., 2006). This results in high potential soil
exposure to manure ARGs. High resistance levels to tetracycline, erythromycin, and
streptomycin have all been detected in farmland soil (Popowska et al., 2012). When
compared with unmanured soils such as forest and orchard soils, manured vegetable

31
garden soil possessed bacterial strains with the highest MICs for tetracycline and
erythromycin (Popowska et al., 2012). Tetracycline resistance genes were present in the
soil of grassland farms where dairy cattle were housed (Santamaría et al., 2011).
Manuring vegetable soil plots with fresh dairy or swine manure increased the abundance
of bacteria exhibiting resistance to drugs such as amikacin, cefoxitin, and ampicillin
(Marti et al., 2013). However, shifts in the soil resistome may have more to do with the
bacterial species present in the soil or soil composition than the horizontal gene transfer
processes occurring between manure containing antibiotic resistant bacteria and soil
bacteria (Forsberg et al., 2014). Furthermore, soil bacteria may not be as capable of
transferring resistance to other members of their community like bacteria recognized as
human pathogens (Forsberg et al., 2014). Regardless, exposing soils to animal manure
tends to result in the production of antibiotic resistance within soil bacteria, making soil a
significant reservoir of antibiotic resistance.
CONCLUSION AND RESEARCH OBJECTIVES
In the dairy cow, the role antibiotic administration plays in subsequent fecal
excretion of antibiotic resistant bacteria is of major concern. However, the contribution of
antibiotic administration alone is unclear due to baseline bacterial resistance in cows
without exposure to antibiotics, exposure to environmental resistance genes (e.g. soil or
water), and the (until recent) lack of sensitive methods for identifying resistance genes.
Fortunately, identification methods and knowledge continue to integrate, improving the
understanding of the relationship between antibiotics and resistance.
The objective of this research was to use new metagenomic techniques to evaluate
the effect of pirlimycin hydrochloride (mastitis treatment), ceftiofur crystalline free acid
32
(metritis treatment), and cephapirin benzathine (dry cow therapy) on antibiotic resistance
gene prevalence in the fecal microbiome of the dairy cow. A second goal was to
determine the temporal pattern of excretion of antibiotic resistance genes to identify key
time points for producers to focus their manure management strategies, helping to
prevent the spread of antibiotic resistance.
33
REFERENCES
Ahmadian, A., M. Ehn, and S. Hober. 2006. Pyrosequencing: history, biochemistry and
future. Clinica chimica acta 363:83-94.
Alcaine, S. D., S. S. Sukhnanand, L. D. Warnick, W.-L. Su, P. McGann, P. McDonough,
and M. Wiedmann. 2005. Ceftiofur-resistant Salmonella strains isolated from dairy farms
represent multiple widely distributed subtypes that evolved by independent horizontal
gene transfer. Antimicrobial agents and chemotherapy 49:4061-4067.
Alekshun, M. N., and S. B. Levy. 2007. Molecular mechanisms of antibacterial multidrug
resistance. Cell 128:1037-1050.
Alexander, T., L. Yanke, E. Topp, M. Olson, R. Read, D. Morck, and T. McAllister.
2008. Effect of subtherapeutic administration of antibiotics on the prevalence of
antibiotic-resistant Escherichia coli bacteria in feedlot cattle. Applied and environmental
microbiology 74:4405-4416.
Alexander, T. W., J. L. Yanke, T. Reuter, E. Topp, R. R. Read, B. L. Selinger, and T. A.
McAllister. 2011. Longitudinal characterization of antimicrobial resistance genes in feces
shed from cattle fed different subtherapeutic antibiotics. BMC microbiology 11:19.
Altschul, S. F., W. Gish, W. Miller, E. W. Myers, and D. J. Lipman. 1990. Basic local
alignment search tool. Journal of molecular biology 215:403-410.
Aziz, R. K., S. Devoid, T. Disz, R. A. Edwards, C. S. Henry, G. J. Olsen, R. Olson, R.
Overbeek, B. Parrello, and G. D. Pusch. 2012. SEED Servers: high-performance access
to the SEED genomes, annotations, and metabolic models. PloS one 7:e48053.
Barbosa, T. M., and S. B. Levy. 2000. The impact of antibiotic use on resistance
development and persistence. Drug resistance updates 3:303-311.
34
Berge, A. C. B., W. B. Epperson, and R. H. Pritchard. 2005. Assessing the effect of a
single dose florfenicol treatment in feedlot cattle on the antimicrobial resistance patterns
in faecal Escherichia coli. Veterinary research 36:723-734.
Berger, L., S. Ricke, and G. Fahey Jr. 1981. Comparison of two forms and two levels of
lasalocid with monensin on feedlot cattle performance. J anim sci 53:1440-1445.
Butaye, P., L. A. Devriese, and F. Haesebrouck. 2003. Antimicrobial growth promoters
used in animal feed: effects of less well known antibiotics on gram-positive bacteria.
Clinical microbiology reviews 16:175-188.
Cagnardi, P., C. Locatelli, C. Ferraresi, V. Bronzo, S. Carli, R. Villa, and A. Zonca. 2014.
Pharmacokinetics in foremilk and antimicrobial activity of cephapirin following
intramammary administration in healthy and Staphylococcus aureus-infected cows. New
Zealand veterinary journal:1-6.
Callaway, T. R., T. S. Edrington, J. L. Rychlik, K. J. Genovese, T. L. Poole, Y. S. Jung,
K. M. Bischoff, R. C. Anderson, and D. J. Nisbet. 2003. Ionophores: their use as
ruminant growth promotants and impact on food safety. Curr issues intest microbiol 4:43-
51.
Cockerill, F. R. 1999. Genetic methods for assessing antimicrobial resistance.
Antimicrobial agents and chemotherapy 43:199-212.
Daniels, J. B., D. R. Call, D. Hancock, W. M. Sischo, K. Baker, and T. E. Besser. 2009.
Role of ceftiofur in selection and dissemination of blaCMY-2-mediated cephalosporin
resistance in Salmonella enterica and commensal Escherichia coli isolates from cattle.
Applied and environmental microbiology 75:3648-3655.

35
Dawson, K., and J. Boling. 1983. Monensin-resistant bacteria in the rumens of calves on
monensin-containing and unmedicated diets. Applied and environmental microbiology
46:160-164.
Disz, T., S. Akhter, D. Cuevas, R. Olson, R. Overbeek, V. Vonstein, R. Stevens, and R.
A. Edwards. 2010. Accessing the SEED genome databases via Web services API: tools
for programmers. BMC bioinformatics 11:319.
Dolejska, M., Z. Jurcickova, I. Literak, L. Pokludova, J. Bures, A. Hera, L. Kohoutova, J.
Smola, and A. Cizek. 2011. IncN plasmids carrying blaCTX-M-1 in Escherichia coli
isolates on a dairy farm. Veterinary microbiology 149:513-516.
Durso, L. M., G. P. Harhay, J. L. Bono, and T. P. Smith. 2011. Virulence-associated and
antibiotic resistance genes of microbial populations in cattle feces analyzed using a
metagenomic approach. Journal of microbiological methods 84:278-282.
Edrington, T., M. Looper, S. Duke, T. Callaway, K. Genovese, R. Anderson, and D.
Nisbet. 2006. Effect of ionophore supplementation on the incidence of Escherichia coli
O157: H7 and Salmonella and antimicrobial susceptibility of fecal coliforms in stocker
cattle. Foodbourne pathogens & disease 3:284-291.
FDA. 2011. Summary report on antimicrobials sold or distributed for use in food-
producing animals.
FDA. 2012. 2010-2011 drug use review.
FDA. 2014. FDA approved products section 2.0 - active ingredients.
Fleming, A. 1945. Penicillin. Nobel Lecture.
Forsberg, K. J., S. Patel, M. K. Gibson, C. L. Lauber, R. Knight, N. Fierer, and G.
Dantas. 2014. Bacterial phylogeny structures soil resistomes across habitats. Nature.
36
Fox, S., S. Filichkin, and T. C. Mockler. 2009. Applications of ultra-high-throughput
sequencing. Pages 79-108 in Plant systems biology. Springer.
França, L. T., E. Carrilho, and T. B. Kist. 2002. A review of DNA sequencing techniques.
Quarterly reviews of biophysics 35:169-200.
Frey, J., A. Pell, R. Berthiaume, H. Lapierre, S. Lee, J. Ha, J. Mendell, and E. Angert.
2010. Comparative studies of microbial populations in the rumen, duodenum, ileum and
faeces of lactating dairy cows. J appl microbiol 108:1982-1993.
Gavin, J. J. 1957. Analytical microbiology: II. The diffusion methods. Applied
microbiology 5:25.
Gehring, R., and G. Smith. 2006. An overview of factors affecting the disposition of
intramammary preparations used to treat bovine mastitis. Journal of veterinary
pharmacology and therapeutics 29:237-241.
Halbert, L. W., J. B. Kaneene, P. L. Ruegg, L. D. Warnick, S. J. Wells, L. S. Mansfield,
C. P. Fossler, A. M. Campbell, and A. M. Geiger-Zwald. 2006. Evaluation of
antimicrobial susceptibility patterns in Campylobacter spp isolated from dairy cattle and
farms managed organically and conventionally in the midwestern and northeastern
United States. Journal of the american veterinary medical association 228:1074-1081.
Hornish, R., T. Arnold, L. Baczynskyj, S. Chester, T. Cox, T. Flook, R. Janose, D.
Kloosterman, J. Nappier, and D. Reeves. 1992. Pirlimycin in the dairy cow: metabolism
and residue studies. in Proc. ACS symposium series.
Houlihan, A. J., and J. B. Russell. 2003. The susceptibility of ionophore-resistant
Clostridium aminophilum F to other antibiotics. Journal of antimicrobial chemotherapy
52:623-628.
37
Imelfort, M., and D. Edwards. 2009. De novo sequencing of plant genomes using second-
generation technologies. Briefings in bioinformatics 10:609-618.
Inglis, G., T. McAllister, H. Busz, L. Yanke, D. Morck, M. Olson, and R. Read. 2005.
Effects of subtherapeutic administration of antimicrobial agents to beef cattle on the
prevalence of antimicrobial resistance in Campylobacter jejuni and Campylobacter
hyointestinalis. Applied and environmental microbiology 71:3872-3881.
Jacob, M., J. Fox, S. Narayanan, J. Drouillard, D. Renter, and T. Nagaraja. 2008. Effects
of feeding wet corn distillers grains with solubles with or without monensin and tylosin
on the prevalence and antimicrobial susceptibilities of fecal foodborne pathogenic and
commensal bacteria in feedlot cattle. J anim sci 86:1182-1190.
Jacoby, G. A., and L. S. Munoz-Price. 2005. The new β-lactamases. New England journal
of medicine 352:380-391.
Lana, R. P., and J. B. Russell. 1996. Use of potassium depletion to assess adaptation of
ruminal bacteria to ionophores. Applied and environmental microbiology 62:4499-4503.
Licht, T. R., and A. Wilcks. 2006. Conjugative gene transfer in the gastrointestinal
environment. Advances in applied microbiology 58:77-96.
Liu, B., and M. Pop. 2009. ARDB—antibiotic resistance genes database. Nucleic acids
research 37:D443-D447.
Liu, L., Y. Li, S. Li, N. Hu, Y. He, R. Pong, D. Lin, L. Lu, and M. Law. 2012.
Comparison of next-generation sequencing systems. Journal of biomedicine and
biotechnology 2012.
Lowrance, T. C., G. H. Loneragan, D. J. Kunze, T. M. Platt, S. E. Ives, H. M. Scott, B.
Norby, A. Echeverry, and M. M. Brashears. 2007. Changes in antimicrobial susceptibility
38
in a population of Escherichia coli isolated from feedlot cattle administered ceftiofur
crystalline-free acid. American journal of veterinary research 68:501-507.
Mann, S., J. D. Siler, D. Jordan, and L. D. Warnick. 2011. Antimicrobial susceptibility of
fecal Escherichia coli isolates in dairy cows following systemic treatment with ceftiofur
or penicillin. Foodborne pathogens and disease 8:861-867.
Margulies, M., M. Egholm, W. E. Altman, S. Attiya, J. S. Bader, L. A. Bemben, J. Berka,
M. S. Braverman, Y.-J. Chen, and Z. Chen. 2005. Genome sequencing in microfabricated
high-density picolitre reactors. Nature 437:376-380.
Marti, R., A. Scott, Y.-C. Tien, R. Murray, L. Sabourin, Y. Zhang, and E. Topp. 2013.
Impact of manure fertilization on the abundance of antibiotic-resistant bacteria and
frequency of detection of antibiotic resistance genes in soil and on vegetables at harvest.
Applied and environmental microbiology 79:5701-5709.
McAllister, T., L. Yanke, G. Inglis, and M. Olson. 2001. Is antibiotic use in dairy cattle
causing antibiotic resistance. Adv dairy technol 13:229-247.
McDermott, P. F., R. D. Walker, and D. G. White. 2003. Antimicrobials: modes of action
and mechanisms of resistance. International journal of toxicology 22:135-143.
McEwen, S. A., and P. J. Fedorka-Cray. 2002. Antimicrobial use and resistance in
animals. Clinical infectious diseases 34:S93-S106.
McGinnis, S., and T. L. Madden. 2004. BLAST: at the core of a powerful and diverse set
of sequence analysis tools. Nucleic acids research 32:W20-W25.
Mirzaagha, P., M. Louie, R. Sharma, L. J. Yanke, E. Topp, and T. A. McAllister. 2011.
Distribution and characterization of ampicillin-and tetracycline-resistant Escherichia coli
from feedlot cattle fed subtherapeutic antimicrobials. BMC microbiology 11:78.
39
Mollenkopf, D. F., M. F. Weeman, J. B. Daniels, M. J. Abley, J. L. Mathews, W. A.
Gebreyes, and T. E. Wittum. 2012. Variable within-and between-herd diversity of CTX-
M cephalosporinase-bearing Escherichia coli isolates from dairy cattle. Applied and
environmental microbiology 78:4552-4560.
Morar, M., K. Bhullar, D. W. Hughes, M. Junop, and G. D. Wright. 2009. Structure and
mechanism of the lincosamide antibiotic adenylyltransferase LinB. Structure 17:1649-
1659.
Morley, P. S., D. A. Dargatz, D. R. Hyatt, G. A. Dewell, J. G. Patterson, B. A. Burgess,
and T. E. Wittum. 2011. Effects of restricted antimicrobial exposure on antimicrobial
resistance in fecal Escherichia coli from feedlot cattle. Foodborne pathogens and disease
8:87-98.
Morozova, O., and M. A. Marra. 2008. Applications of next-generation sequencing
technologies in functional genomics. Genomics 92:255-264.
Neuhauser, M. M., R. A. Weinstein, R. Rydman, L. H. Danziger, G. Karam, and J. P.
Quinn. 2003. Antibiotic resistance among gram-negative bacilli in US intensive care
units: implications for fluoroquinolone use. Jama 289:885-888.
Nikolaidis, I., S. Favini‐ Stabile, and A. Dessen. 2014. Resistance to antibiotics targeted
to the bacterial cell wall. Protein science.
Novais, R., and Y. Thorstenson. 2011. The evolution of Pyrosequencing® for
microbiology: from genes to genomes. Journal of microbiological methods 86:1-7.
O'Brien, T. F. 2002. Emergence, spread, and environmental effect of antimicrobial
resistance: how use of an antimicrobial anywhere can increase resistance to any
antimicrobial anywhere else. Clinical infectious diseases 34:S78-S84.
40
Overbeek, R., T. Disz, and R. Stevens. 2004. The SEED: a peer-to-peer environment for
genome annotation. Communications of the ACM 47:46-51.
Overbeek, R., R. Olson, G. D. Pusch, G. J. Olsen, J. J. Davis, T. Disz, R. A. Edwards, S.
Gerdes, B. Parrello, and M. Shukla. 2014. The SEED and the Rapid Annotation of
microbial genomes using Subsystems Technology (RAST). Nucleic acids research
42:D206-D214.
Papich, M. G. 2013. Antimicrobials, susceptibility testing, and minimum inhibitory
concentrations (MIC) in veterinary infection treatment. Veterinary clinics of North
America: small animal practice 43:1079-1089.
Pehrsson, E. C., K. J. Forsberg, M. K. Gibson, S. Ahmadi, and G. Dantas. 2013. Novel
resistance functions uncovered using functional metagenomic investigations of resistance
reservoirs. Frontiers in microbiology 4.
Penders, J., E. E. Stobberingh, P. H. Savelkoul, and P. F. Wolffs. 2013. The human
microbiome as a reservoir of antimicrobial resistance. Frontiers in microbiology 4.
Peri, S., J. D. Navarro, R. Amanchy, T. Z. Kristiansen, C. K. Jonnalagadda, V.
Surendranath, V. Niranjan, B. Muthusamy, T. Gandhi, and M. Gronborg. 2003.
Development of human protein reference database as an initial platform for approaching
systems biology in humans. Genome research 13:2363-2371.
Pertsemlidis, A., J. W. Fondon, and W. John. 2001. Having a BLAST with bioinformatics
(and avoiding BLASTphemy). Genome biol 2:1-10.
Phillips, I., M. Casewell, T. Cox, B. De Groot, C. Friis, R. Jones, C. Nightingale, R.
Preston, and J. Waddell. 2004. Does the use of antibiotics in food animals pose a risk to
41
human health? A critical review of published data. Journal of antimicrobial chemotherapy
53:28-52.
Pol, M., and P. Ruegg. 2007. Treatment practices and quantification of antimicrobial drug
usage in conventional and organic dairy farms in Wisconsin. J dairy sci 90:249-261.
Popowska, M., M. Rzeczycka, A. Miernik, A. Krawczyk-Balska, F. Walsh, and B. Duffy.
2012. Influence of soil use on prevalence of tetracycline, streptomycin, and erythromycin
resistance and associated resistance genes. Antimicrobial agents and chemotherapy
56:1434-1443.
Port, J. A., J. C. Wallace, W. C. Griffith, and E. M. Faustman. 2012. Metagenomic
profiling of microbial composition and antibiotic resistance determinants in Puget Sound.
PloS one 7:e48000.
Pruden, A., R. Pei, H. Storteboom, and K. H. Carlson. 2006. Antibiotic resistance genes
as emerging contaminants: studies in northern Colorado. Environmental science &
technology 40:7445-7450.
Pruitt, K. D., T. Tatusova, and D. R. Maglott. 2005. NCBI Reference Sequence (RefSeq):
a curated non-redundant sequence database of genomes, transcripts and proteins. Nucleic
acids research 33:D501-D504.
Roberts, M. C. 2004. Resistance to macrolide, lincosamide, streptogramin, ketolide, and
oxazolidinone antibiotics. Molecular biotechnology 28:47-62.
Ronaghi, M., and E. Elahi. 2002. Pyrosequencing for microbial typing. Journal of
chromatography B 782:67-72.

42
Santamaría, J., L. López, and C. Y. Soto. 2011. Detection and diversity evaluation of
tetracycline resistance genes in grassland-based production systems in Colombia, South
America. Frontiers in microbiology 2.
Sarmah, A. K., M. T. Meyer, and A. Boxall. 2006. A global perspective on the use, sales,
exposure pathways, occurrence, fate and effects of veterinary antibiotics (VAs) in the
environment. Chemosphere 65:725-759.
Sato, K., P. C. Bartlett, and M. A. Saeed. 2005. Antimicrobial susceptibility of
Escherichia coli isolates from dairy farms using organic versus conventional production
methods. Journal of the american veterinary medical association 226:589-594.
Schmieder, R., and R. Edwards. 2012. Insights into antibiotic resistance through
metagenomic approaches. Future microbiology 7:73-89.
Seiffert, S. N., M. Hilty, V. Perreten, and A. Endimiani. 2013. Extended-spectrum
cephalosporin-resistant gram-negative organisms in livestock: An emerging problem for
human health? Drug resistance updates.
Singer, R. S., S. K. Patterson, and R. L. Wallace. 2008. Effects of therapeutic ceftiofur
administration to dairy cattle on Escherichia coli dynamics in the intestinal tract. Applied
and environmental microbiology 74:6956-6962.
Sirohi, S. K., N. Singh, S. S. Dagar, and A. K. Puniya. 2012. Molecular tools for
deciphering the microbial community structure and diversity in rumen ecosystem. Appl
microbiol biotechnol 95:1135-1154.
Steffan, R., and R. Atlas. 1991. Polymerase chain reaction: applications in environmental
microbiology. Annual reviews in microbiology 45:137-161.
43
Thames, C. H., A. Pruden, R. E. James, P. P. Ray, and K. F. Knowlton. 2012. Excretion
of antibiotic resistance genes by dairy calves fed milk replacers with varying doses of
antibiotics. Frontiers in microbiology 3.
Thomas, T., J. Gilbert, and F. Meyer. 2012. Metagenomics-a guide from sampling to data
analysis. Microb inform exp 2.
Tragesser, L. A., T. E. Wittum, J. A. Funk, P. L. Winokur, and P. J. Rajala-Schultz. 2006.
Association between ceftiofur use and isolation of Escherichia coli with reduced
susceptibility to ceftriaxone from fecal samples of dairy cows. American journal of
veterinary research 67:1696-1700.
Volkova, V. V., C. Lanzas, Z. Lu, and Y. T. Gröhn. 2012. Mathematical model of
plasmid-mediated resistance to ceftiofur in commensal enteric Escherichia coli of cattle.
PloS one 7:e36738.
Washburn, K., R. Johnson, C. Clarke, K. Anderson, M. Lucas, W. Bryson, J. Robinson,
K. Dame, V. Hubbard, and K. Callahan. 2005. Penetration of ceftiofur into sterile vs.
Mannheimia haemolytica-infected tissue chambers in beef calves after subcutaneous
administration of ceftiofur crystalline free acid sterile suspension in the ear pinna. Journal
of veterinary pharmacology and therapeutics 28:247-251.
Westley, J. 1977. Polyether antibiotics: versatile carboxylic acid ionophores produced by
Streptomyces. Advances in applied microbiology 22:177.
Wilhelm, J., and A. Pingoud. 2003. Real-time polymerase chain reaction. Chembiochem
4:1120-1128.
Wright, G. D. 2012. The origins of antibiotic resistance. Pages 13-30 in Antibiotic
resistance. Springer.
44
Yang, Y., B. Li, F. Ju, and T. Zhang. 2013. Exploring variation of antibiotic resistance
genes in activated sludge over a four-year period through a metagenomic approach.
Environmental science & technology 47:10197-10205.
Zwald, A., P. Ruegg, J. Kaneene, L. Warnick, S. Wells, C. Fossler, and L. Halbert. 2004.
Management practices and reported antimicrobial usage on conventional and organic
dairy farms. J dairy sci 87:191-201.
45
Chapter 3: METAGENOMIC ANALYSIS OF ANTIBIOTIC RESISTANCE
GENES IN THE FECAL MICROBIOME FOLLOWING THERAPEUTIC AND
PROPHYLACTIC ANTIBIOTIC ADMINISTRATION IN DAIRY COWS
ABSTRACT
The use of antibiotics in dairy cattle has the potential to stimulate the
development and subsequent fecal dissemination of antibiotic resistance genes (ARGs) in
bacteria. The objectives were to use metagenomic techniques to evaluate the effect of
antibiotic treatment on ARG prevalence in the fecal microbiome of the dairy cow and to
determine the temporal excretion pattern of ARGs. Twelve Holstein cows were assigned
to one of four antibiotic treatments: control, pirlimycin hydrochloride (PIRL), ceftiofur
crystalline free acid (CCFA), or cephapirin benzathine (CEPH). Fecal samples were
collected on d -1, 1, 3, 5, 7, 14, 21, and 28. Samples were freeze-dried and subjected to
DNA extraction followed by Illumina paired-end HiSeq sequencing and quantitative
polymerase chain reaction (qPCR). Illumina sequences were analyzed using MG-RAST
and the Antibiotic Resistance Gene Database (ARDB) via BLAST. Abundance of ampC,
ermB, tetO, tetW, and 16S rRNA genes were determined using qPCR. All data were
statistically analyzed with PROC GLIMMIX in SAS. Antibiotic treatment resulted in a
shift in bacterial cell functions. Sequences associated with “stress response” were higher
and sequences associated with “phages, prophages, transposable elements, plasmids” and
“motility and chemotaxis” tended to be higher in ceftiofur-treated cows than control
cows. Sequences associated with “resistance to antibiotics and toxic compounds” were
higher in ceftiofur-treated cows than control cows. Ceftiofur-treated cows had a higher
abundance of -lactam and multidrug resistance sequences than control cows. There was
46
no effect of treatment or day on fecal tetO and ermB excretion. The relative abundances
of tetW and ampC were higher on d 3 post-treatment than d 5 and d 28. In conclusion,
antibiotic use in dairy cattle shifted bacterial cell functions and temporarily increased
antibiotic resistance in the fecal microbiome.
Keywords: shotgun metagenomic sequencing, antibiotic resistance, dairy cow
INTRODUCTION
Even at an early stage, the development of antibiotic resistance was recognized as
a potential problem of antibiotic use. Alexander Fleming, upon his discovery of
penicillin, said “It is not difficult to make microbes resistant to penicillin in the laboratory
by exposing them to concentrations not sufficient to kill them” (Fleming, 1945). Today,
the resistance problem continues to grow. Gram-negative bacterial isolates were
recovered from ICU patients all over the United States from 1994 – 2000 and, in that
time span, susceptibility to several antibiotics were reduced including ciprofloxacin by
10% and gentamicin by 6% (Neuhauser et al., 2003). Antibiotic resistance is clearly on
the rise and must be addressed.
In addressing this global problem, attention has fallen on the animal industry and
its use of antibiotics. In 2011, the FDA reported that 3.29 million kg of antibiotics were
sold for human pharmaceutical purposes while 13.5 million kg of antibiotics were sold
for use in domestic livestock (FDA, 2011;2012). Therefore, it is estimated that of the
total antimicrobials sold annually, roughly 80% is used by the livestock industry. This
usage of antibiotics has implications for soil and water microbiomes through effects of
excreted antibiotics (Sarmah et al., 2006) as well as the dissemination of antibiotic
resistance from livestock fecal bacteria.
47
The three main mechanisms of antibiotic resistance transfer include (1)
conjugation, which occurs via plasmids, (2) transformation, which is the uptake of naked
DNA, and (3) transduction, which is the transfer of resistance genes via a bacteriophage
(Barbosa and Levy, 2000). Resistance genes coding for resistance mechanisms to -
lactams [i.e. altering penicillin binding proteins or producing -lactamases (McDermott
et al., 2003)] or to macrolide-lincosamide-streptogramins [i.e. obtaining an rRNA
methylase which inhibits drug binding to the 50S ribosomal subunit (Roberts, 2004)] can
be spread rapidly between bacteria.
Previously, cultured-based methods like agar disc diffusion tests and dilution-
based tests (Schmieder and Edwards, 2012) were used to identify antibiotic resistant
bacterial isolates. However, newer quantitative methods like qPCR (Steffan and Atlas,
1991) can analyze for specific resistance genes present in the environmental sample, not
just in culturable bacteria. Today, metagenomic methods of analysis like 454
pyrosequencing (Sirohi et al., 2012) and Illumina sequencing (Fox et al., 2009) allow for
the study of entire bacterial metagenomes. Metagenomic methods are enhanced by
functional analysis of the sequencing output via databases like BLAST, ARDB, the
SEED, and MG-RAST.
The effect of antibiotic treatment on cattle fecal microbiomes has been a topic of
study for quite some time yielding results both consistent with and contradictory to any
directly linked hypotheses. For instance, fecal bacteria from conventionally-raised cows
tend to be more resistant to antibiotics than that from cows raised organically (Sato et al.,
2005; Halbert et al., 2006) but the increase in resistance in fecal bacteria of cows treated
with antibiotics is only transient (Tragesser et al., 2006; Singer et al., 2008). Even cattle
48
never exposed to antibiotics shed antibiotic resistant bacteria (Durso et al., 2011; Thames
et al., 2012). Finally the link between feeding antibiotics to cattle and fecal antibiotic
resistance is weak, with conflicting results (Inglis et al., 2005; Edrington et al., 2006;
Jacob et al., 2008; Mirzaagha et al., 2011). What is known is that runoff from farms
contain higher levels of antibiotic resistance genes than other water sources (Santamaría
et al., 2011) and that land applying contaminated cattle feces to vegetable plots results in
resistance genes making their way into and on produce (Marti et al., 2013). Further
research is necessary to complete the picture of antibiotic use on antibiotic resistance to
determine how to appropriately prevent the dissemination of those resistance genes.
The objective of this research was to use new metagenomic techniques to evaluate
the effect of pirlimycin hydrochloride (mastitis treatment), ceftiofur crystalline free acid
(metritis treatment), and cephapirin benzathine (dry cow therapy) on antibiotic resistance
gene prevalence in the fecal microbiome of the dairy cow. A second objective was to
determine the temporal pattern of excretion of antibiotic resistance genes to identify key
time points for producers to focus their manure management strategies, helping to
prevent the spread of antibiotic resistance.
MATERIALS AND METHODS
Animals and Experimental Treatments
This experiment was conducted under the review and approval of the Virginia
Polytechnic Institute and State University Institutional Animal Care and Use Committee
(protocol 12-184-DASC). Holstein (n = 12) cows in their first lactation, 110 to 200 days
in milk and yielding 30.45 to 40.45 kg of milk daily, were selected from the Virginia
49
Tech Dairy Center (Blacksburg, VA). Farm records showed that these cows had not
received any antibiotic treatment from at least the time of their insemination as heifers.
The study was conducted over 2, 28-day periods. Cows were housed individually
in tie-stalls with rubber mats for the first 7 days, were fed a total mixed ration twice daily,
and provided ad libitum access to water. For the remaining 21 days, cows were housed in
a free-stall barn with rubber mats and sawdust, fed a total mixed ration once daily, and
given ad libitum access to water.
Treatments (n = 4) were the administration of cephapirin benzathine
(ToMorrow, Boehringer Ingelheim Vetmedica, Inc., St. Joseph, MO), pirlimycin
hydrochloride (Pirsue, Zoetis, Madison, NJ), or ceftiofur crystalline free acid sterile
suspension (Excede, Zoetis, Madison, NJ), as well as a control group where no
antibiotic was given. All cows were randomly assigned to the control or one of the
antibiotic treatments except for those cows (n = 3) receiving cephapirin benzathine for
dry cow therapy. Cows for this treatment were selected based on the previously
mentioned criteria as well as a scheduled date for dry-off that overlapped with the time of
the experiment. A random number generator was used to assign cows within each
treatment to either period 1 or 2, ensuring each treatment was represented in each period.
Antibiotic Administration
Cows (n = 3) on the cephapirin benzathine (CEPH) treatment were dried off on
day 0. Virginia Tech Dairy Center (Blacksburg, VA) standard dry-off protocol was
followed. The cows were milked and each teat was cleaned with a 4 x 4 gauze pad soaked
in 70% isopropyl alcohol. Each teat was injected with 10 mL cephapirin benzathine (300
50
mg cephapirin) and then sealed with Orbeseal (bismuth subnitrate, colloidal silicon
dioxide, and liquid paraffin; Zoetis, Madison, NJ).
Cows (n = 3) assigned to the pirlimycin hydrochloride (PIRL) treatment were
infused with 10 mL of pirlimycin hydrochloride (50 mg pirlimycin) in their front left
quarter on days 0 and 1, with 24 hours separating infusions. Prior to each infusion, cows
were milked and the teat receiving treatment was cleaned with a 4 x 4 gauze pad soaked
in 70% isopropyl alcohol.
Cows (n = 3) assigned to the ceftiofur crystalline free acid (CCFA) treatment
were injected subcutaneously with 1.5 mL ceftiofur crystalline free acid sterile
suspension (150 mg ceftiofur) per 45.4 kg body weight. Per manufacturer’s protocol,
cows were injected at the base of the right ear on day 0 and at the base of the left ear on
day 3, with injections spaced 72 hours apart. Prior to injection, the area was cleaned with
a 4 x 4 gauze pad soaked in 70% isopropyl alcohol.
Sample Collection
Fecal samples were collected from all 12 cows 30 min. prior to antibiotic
administration on day 0, and then once daily on days 1, 3, 5, 7, 14, 21, and 28 following
treatment. Samples were collected at 1800 h when cows were housed in individual stalls
(days 1, 3, 5, and 7) and at 1300 h on days 14, 21, and 28 when cows were housed in a
free stall barn (or, for dry cows, when on pasture). Fecal samples were collected rectally,
using a clean palpation sleeve and sterile lubricant for each collection. Roughly 500 g of
feces was discarded to prevent contamination before 100 g of wet sample was collected
in a sterile plastic snap cap vial. Fecal samples were placed in a -20 C freezer within one
hour of collection and stored until analysis.
51
Metagenomic Analysis
Sample Preparation and DNA Extraction
Fecal samples were thawed and 15 g of wet feces/sample was placed into a sterile
50 mL conical and covered with aluminum foil. Samples were frozen for a minimum of
30 min. in a -80C freezer prior to freeze-drying. Fecal samples were freeze dried
(LABCONCO, Kansas City, MO) for 72 hours or until the expected dry matter content
(13 – 19% dry matter) was achieved. Freeze-dried samples were mixed with an
autoclaved disposable spatula prior to being weighed for DNA extraction.
For DNA extraction, 0.102x g of freeze-dried feces was weighed into a sterile 2
mL centrifuge tube. Samples were extracted in replicates of 6 using a QIAamp DNA
Mini Stool Kit (QIAGEN, Germantown, MD), following the Stool Pathogen Detection
Protocol with some modifications. First, the ASL Buffer (lysis buffer) was heated prior to
use until the precipitate dissolved (at 45 - 50C). In the lysis step (step 3), samples were
heated at 95C for 6 minutes to improve lysis of Gram-negative bacteria. In step 8, prior
to centrifugation, 4 L of RNase A (Epicentre, Madison, WI) (conc. of 5 g/L) was
added, the tube was inverted to mix, and the supernatant was allowed to sit for 3 min. at
room temperature. The purpose of adding the RNase A was to rid the sample of any RNA
contamination. The recommended step 17 of centrifugation for 1 min. with a new catch
tube was included. In step 18 (elution step), 50 L of Buffer EB (10 mM Tris-Cl) was
used because it does not contain EDTA, which inhibits Illumina library preparation. Also,
the Buffer EB was heated at 60C for 2 min. prior to pipetting it onto the column and
allowed to sit on the column for 6 min. prior to centrifugation; this aided in the binding of
52
the buffer to the DNA on the column. Finally, all centrifugation steps were carried out at
16,100 x g. The eluted DNA was immediately stored at -20C until further processing.
Sample Purification and Quality Testing
The DNA concentration of each sample replicate (n = 6) was quantified using a
Qubit 2.0 Fluorometer (Life Technologies, Grand Island, NY) with the Qubit
dsDNA HS Assay Kit. Samples were submitted to the Virginia Bioinformatics Institute
Genomics Research Laboratory (Blacksburg, VA) for Solid Phase Reversible
Immobilization (SPRI) Purification, using Agencourt AMPure XP. This is a purification
process that uses magnetic beads to bind amplicons larger than 100 bp, ridding the
sample of contaminants like salts or primer dimmers (Beckman Coulter, Inc., 2013).
After purification, the DNA concentrations of each sample replicate were again
quantified using a Qubit 2.0 Fluorometer with the Qubit dsDNA HS Assay Kit.
Sample replicates were run on an electrophoresis gel with 2.66 L loading dye
(sybergreen, monensin blue, and glycerol) to 4 L sample. Lastly, sample replicates were
analyzed on a NanoPhotometer (Implen, Inc., Westlake Villiage, CA) to confirm that
the 260/280 value of each replicate was approximately 1.8, indicating pure DNA.
The best two replicates of each sample, determined by 260/280 ratio resembling pure
DNA, highest DNA concentration, and adequate gel images, were pooled and submitted
for library preparation and sequencing.
Library Preparation and Illumina GAIIx HiSeq Sequencing
DNA Seq library preparation and Illumina paired-end HiSeq, 100 cycle,
multiplexed sequencing was performed by the Virginia Bioinformatics Institute
Genomics Research Laboratory (Blacksburg, VA). HiSeq sequencing was performed on
53
day -1 (pre-treatment) and day 3 samples for all control and ceftiofur cows (a total of 12
samples sequenced).
BLAST/ARDB Data Analysis
Sequence data analysis for the 12 samples was performed using BLAST to
compare sequences to the ARDB by our collaborator Dr. Tong Zhang’s lab (Hong Kong,
China). An e-value of 1e-5 was used as the cutoff value for sequence similarity.
MG-RAST Data Analysis
Sequence analysis on the 12 samples was performed using MG-RAST. This
involved uploading the paired-end sample sequences, in fastq format, to MG-RAST and
removing any bovine host sequences (those associated with the Bos taurus genome). The
remaining sequences were quality checked and dereplication was performed to remove
false sequences (those the result of sequencing error). Of the sequences that passed these
quality tests, predicted protein coding regions were determined, assigned annotation
based on SEED sequence identification, and assigned to a functional category using the
SEED subsystems. Functional data for the paired-end sequences was downloaded from
MG-RAST and merged to create one dataset per sample prior to statistical analysis.
For bacterial species diversity, -diversity values were calculated using MG-
RAST and are defined as the antilog of the Shannon diversity index. Therefore, -
diversity values do not represent the actual number of bacterial species.
Statistical Analysis
Statistical analysis of BLAST/ARDB and MG-RAST data was with PROC
GLIMMIX in SAS 9.2 (SAS Institute Inc. Cary, NC). A minimum of 40 or more
sequences per sample was required for an antibiotic resistance gene class to be analyzed

54
in the BLAST/ARDB dataset. Samples from day -1 were used as a covariate. Tukey pair-
wise comparisons were used to determine treatment differences on day 3. Significance
was declared at P < 0.10. Trends were declared at P < 0.15.
Real-Time Quantitative Polymerase Chain Reaction (qPCR) Analysis
Sample Preparation and DNA Extraction
All samples were analyzed for 16S rRNA, tetO, tetW, ampC, and ermB using
qPCR. Fecal samples were thawed and 15 g of wet feces/sample was placed into a sterile
50 mL conical and covered with aluminum foil. Samples were frozen for a minimum of
30 min. in a -80C freezer prior to freeze-drying. Fecal samples were freeze dried
(LABCONCO, Kansas City, MO) for 72 hours or until the expected dry matter content
(13 – 19% dry matter) was achieved. Freeze-dried samples were mixed with an
autoclaved disposable spatula prior to being weighed for DNA extraction.
DNA extraction was performed using 0.05xx g freeze-dried feces. The FastDNA
Spin Kit for Soil (MP Biomedicals, Santa Ana, CA) was used following manufacturer
instructions, including the use of the FastPrep instrument (MP Biomedicals, Santa Ana,
CA). In order to optimize DNA yield, all DNA extracts were incubated for 5 minutes in a
55C water bath following the addition of DNase/Pyrogen-Free Water to the column.
Upon removal from the water bath, the DNA was eluted via centrifugation and
immediately stored at -80C until further processing.
Q-PCR Quantification
Previously reported qPCR protocols were used to quantify the genes 16S rRNA
(Suzuki et al., 2000), ampC (Shi et al., 2013), ermB (Jacob et al., 2008), and tetO and
tetW (Aminov et al., 2001). Primer sequences are provided in the appendix.
55
Q-PCR quantifications were performed in triplicate using a CFX96 Real-Time
System (Bio-Rad, Hercules, CA). The 10 l reaction mixture for each well consisted of 5
l SsoFast EvaGreen (Bio-Rad, Hercules, CA), 0.8 l (5M) of each forward and reverse
primer, 2.4 l of molecular grade water, and 1 l of 1:80 diluted sample DNA. Reaction
temperatures were 98C for 2 min. for temperature stabilization, 39 cycles of 98C to
denature the DNA followed by annealing temperatures (60.0C for 16S rRNA and tetW,
50.3C for tetO, 57.8C for ampC), and finally 45 cycles of 98C for DNA extension.
For resistance gene abundance representation, the absolute abundance value
represents the number of ARG copies per gram of freeze-dried feces. The relative
abundance value represents the number of ARG copies per copy of 16S rRNA, giving the
proportion of ARG abundance relative to total bacterial load.
Statistical Analysis
Statistical analysis was with PROC GLIMMIX in SAS 9.2 (SAS Institute Inc.
Cary, NC). Prior to statistical analyses, non-normal data were logarithmically
transformed to achieve normality. Samples for day -1 were used as a covariate. If the P-
value of the treatment by day interaction was < 0.50, Tukey pair-wise comparisons were
used to determine treatment differences within each day and day differences within each
treatment. Significance was declared at P < 0.10. Trends were declared at P < 0.15.
RESULTS
Metagenomic Results: MG-RAST Analysis
Species Diversity: Alpha-Diversity Values

56
There was no significant effect of CCFA treatment on sample species diversity, as
indicated by -diversity values (Table 2 MG-RAST analysis: effect of ceftiofur
crystalline-free acid antibiotic treatment on bacterial species diversity in dairy cow feces).
Functional Sequence Abundance as a % of Total Sample Sequences Assigned
Function
There was no effect of CCFA treatment on the fecal abundance of sequences
associated with “virulence, disease, and defense” as a percentage of total sample
sequences (Table 3).
Control cows had a significantly greater fecal abundance of sequences associated
with “cell division and cell cycle” (P < 0.06, Figure 1), “clustering-based subsystems” (P
< 0.01, Figure 2), “metabolism of aromatic compounds” (P < 0.06, Figure 3), and
“secondary metabolism” (P < 0.07, Figure 4) than CCFA-treated cows (Table 3). Control
cows also tended to have a greater fecal abundance of sequences associated with “DNA
metabolism” (P < 0.12) than CCFA-treated cows (Table 3).
CCFA-treated cows had a significantly greater fecal abundance of sequences
associated with “stress response” (P < 0.08, Figure 5) than control cows (Table 3).
CCFA-treated cows also tended to have a greater fecal abundance of sequences
associated with “motility and chemotaxis” (P < 0.13), (synthesis of) “nucleosides and
nucleotides” (P < 0.12), and “phages, prophages, transposable elements, plasmids” (P <
0.15) than control cows (Table 3).
There was no effect of CCFA treatment on the fecal abundance of sequences
associated with (metabolism of) “amino acids and derivatives”, (metabolism of)
“carbohydrates”, “cell wall and capsule”, (metabolism of) “cofactors, vitamins, prosthetic
57
groups, pigments”, “dormancy and sporulation”, (metabolism of) “fatty acids, lipids, and
isoprenoids”, “iron acquisition and metabolism”, “membrane transport”,
“miscellaneous”, “nitrogen metabolism”, “phosphorus metabolism”, “photosynthesis”,
“potassium metabolism”, “protein metabolism”, “RNA metabolism”, “regulation and cell
signaling”, “respiration”, and “sulfur metabolism” (Table 3).
Abundance of Phages, Prophages, Transposable Elements, and Plasmids
Subcategories
There was an effect of CCFA treatment on the abundance of sequences associated
with “pathogenicity islands” and “phages, prophages” as a % of total “phages, prophages,
transposable elements, plasmids” sequences (Table 4). Control cows had a significantly
greater (P < 0.06, Figure 6) fecal abundance of sequences associated with “pathogenicity
islands” than CCFA-treated cows. However, CCFA-treated cows tended to have a greater
(P < 0.11) fecal abundance of sequences associated with “phages, prophages” than
control cows. There was no effect of CCFA treatment on the abundance of sequences
associated with “gene transfer agent”, “plasmid related functions”, “transposable
elements”, and “other” as a % of total “phages, prophages, transposable elements, and
plasmids” sequences (Table 4).
Abundance of Total Virulence, Disease, and Defense Subcategories
There was an effect of CCFA treatment on the abundance of sequences associated
with “resistance to antibiotics and toxic compounds” as a % of total “virulence, disease,
and defense” sequences (Table 5). Most relevant to our research question, CCFA-treated
cows had a significantly greater (P < 0.01, Figure 7) fecal abundance of sequences
associated with “resistance to antibiotics and toxic compounds” than control cows.
58
However, there was no effect of CCFA treatment on the abundance of sequences
associated with “adhesion”, “bacteriocins, ribosomally synthesized antibacterial
peptides”, “detection”, “invasion and intracellular resistance”, “toxins and
superantigens”, and “other” as a % of total “virulence, disease, and defense” sequences
(Table 5).
Metagenomic Results: BLAST Analysis using the ARDB
There was no significant effect of CCFA treatment on the total abundance of fecal
ARG-like sequences (Figure 8). However, there was a significant effect of treatment on
-lactam and multidrug resistance gene sequences as a proportion of total sample
sequences (Table 6). CCFA-treated cows had a greater proportion of -lactam (P < 0.01,
Error! Reference source not found.) and multidrug (P < 0.02, Figure 10) resistance
genes when compared with control cows. There was also a significant effect of treatment
on -lactam resistance genes as a percentage of total ARG-like sequences (Table 7), with
CCFA-treated cows having a significantly greater (P < 0.01, Figure 11) percentage of -
lactam resistance genes when compared with control cows.
Q-PCR Results
16S rRNA
There was a significant effect of treatment (P < 0.03, Table 8) and day (P < 0.08,
Table 8) on 16S rRNA abundance in feces. Control cows (P < 0.06) and cows treated
with CEPH (P < 0.04) had a greater abundance of 16S rRNA when compared to cows
treated with PIRL (Table 8). On d 3 post-treatment, cows treated with PIRL had a greater
abundance of 16S rRNA when compared with cows treated with CEPH (P < 0.09, Figure
59
12). On d 5 post-treatment, control cows had a greater abundance of 16S rRNA when
compared with cows treated with PIRL (P < 0.08, Figure 12).
Tetracycline Resistance Genes
The absolute abundance of fecal tetO was not significantly affected by treatment,
day, or treatment by day interaction (Table 8). However, on d 5 post-treatment control
cows had a greater absolute abundance of tetO when compared with cows treated with
PIRL (P < 0.07, Figure 13). The relative abundance of tetO was also not affected by
treatment, day, or treatment by day interaction (Table 9). However, on d 1 post-treatment
control cows had a greater relative abundance of tetO when compared with cows treated
with CCFA (P < 0.10, Figure 13).
There was no effect of treatment on the absolute or relative abundance of fecal
tetW. However, the absolute abundance of fecal tetW was significantly affected by day (P
< 0.01, Table 8) with tetW being greater on d 28 post-treatment when compared with d 1
(P < 0.01) and d 7 (P < 0.05) post-treatment (Figure 14). The relative abundance of tetW
was also significantly affected by day (P < 0.04, Table 9) with tetW being greater on d 3
post-treatment when compared with d 5 (P < 0.03) and d 28 (P < 0.10) post-treatment
(Figure 14).
-lactam Resistance Genes
Absolute abundance of fecal ampC was not significantly affected by treatment,
day, or treatment by day interaction (Table 8). The relative abundance of ampC was
significantly affected by day (P < 0.04, Table 9) with d 3 post-treatment being greater
when compared with d 5 (P < 0.04) and d 28 (P < 0.05) post-treatment (Figure 15).
Although effect of treatment was not significant, cows treated with PIRL had a greater
60
relative abundance of ampC when compared with cows treated with CCFA on d 3 post-
treatment (P < 0.09, Figure 15).
Macrolide-lincosamide-streptogramin (MLS) Resistance Genes
Absolute abundance of fecal ermB tended to be affected by treatment (P < 0.11,
Table 8) with CEPH-treated cows tending to have greater ermB absolute abundance than
control (P < 0.12) and PIRL-treated (P < 0.15) cows (Figure 16). There was no
significant effect of day or treatment by day interaction on absolute abundance of ermB.
On day 1 following treatment, CEPH-treated cows had a significantly greater (P < 0.08,
Figure 16) absolute abundance of ermB than control cows. On day 28 post-treatment,
CCFA-treated cows tended to have a greater (P < 0.11) absolute abundance of ermB than
cows treated with PIRL. When looking within treatment, CCFA-treated cows shed
significantly greater (P < 0.10) amounts of ermB on day 14 than day 28 post-treatment.
The relative abundance of ermB was not significantly affected by treatment, day,
or treatment by day interaction (Table 9). However, on day 28 following treatment
CCFA-treated cows had a significantly greater relative abundance of fecal ermB than
cows treated with PIRL (P < 0.01, Figure 16) and CEPH (P < 0.01, Figure 16). When
looking within treatment, CCFA-treated cows shed a significantly greater (P < 0.02)
amount of ermB, relative to 16S, on day 28 than all other days post-treatment.
DISCUSSION
MG-RAST Analysis
MG-RAST analysis to compare the bacterial cell functions in the fecal
microbiomes of cows on the 3rd day following antibiotic (CCFA) treatment showed no
effect of treatment on the bacterial species diversity of the fecal microbiome. This
61
indicates that antibiotic treatment did not result in the death of bacterial populations
immediately following treatment. The lack of treatment effect may be a result of the time
point analyzed. In a human trial, when ampicillin/sulbactam and cefazolin were
administered, the earliest change in fecal diversity was a reduction in Gram-negative
bacteria 6 days post-treatment (Pérez-Cobas et al., 2013). In fact, it was 14 days post-
treatment before a large shift was observed in the active bacterial populations (Pérez-
Cobas et al., 2013). Therefore, in the current study fecal samples taken later after
antibiotic treatment must be analyzed to assess the effect of CCFA treatment on bacterial
species diversity.
MG-RAST analysis showed there were significant effects of CCFA treatment on
several bacterial functional categories. Control cows had a significantly greater
proportion of sequences associated with “cell division and cell cycle” than CCFA-treated
cows. Although counter-intuitive, this reduction in cell division and cell cycle sequences
may be advantageous for the bacteria under antibiotic stress. The tricarboxylic acid
(TCA) cycle plays an important role in producing energy for aerobic and facultative
anaerobic bacteria, but TCA mutant bacteria are actually better able to survive when
exposed to a -lactam like oxacillin (Thomas et al., 2013). Perhaps the bacteria
themselves are responsible for this disruption of the cell cycle, in order to ensure their
own survival under antibiotic selection pressure. However, the more accepted explanation
is that since CCFA is a cephalosporin, which inhibits peptidoglycan synthesis causing
cell death (Lagacé-Wiens et al., 2014), the disruption of cell wall synthesis results in the
lack of cell division. Therefore, the reduced incidence of cell division and cell cycle
62
sequences in the bacteria housed in CCFA-treated cows is due to bacterial cell death upon
antibiotic exposure.
Control cows had a significantly greater proportion of sequences associated with
“metabolism of aromatic compounds” than CCFA-treated cows. Aromatic compounds
make up roughly 20% of the earth’s biomass and are mainly produced by plants (Fuchs et
al., 2011; Díaz et al., 2013). One major aromatic compound is lignin (Fuchs et al., 2011),
a common component of a cow’s plant-based diet. It is the responsibility of bacteria to
metabolize these aromatic compounds in order to recycle the carbon (Fuchs et al., 2011).
The difference between the abundance of aromatic compound metabolism sequences
could be due to the disruption of normal bacterial cell functions by antibiotic presence in
CCFA-treated cows.
CCFA-treated cows tended to have a greater proportion of sequences associated
with bacterial “motility and chemotaxis” than control cows. The increased abundance of
sequences associated with motility and chemotaxis in CCFA-treated cows could indicate
that the bacteria possessed an increased ability for formation of biofilms to protect them
from antibiotic exposure. Motility is a key step in the initial stages of biofilm
development (Sauer et al., 2002) and chemotaxis factors are also important in biofilm
formation, as it is a method bacteria use to attract other bacteria (Bigot et al., 2013).
CCFA-treated cows tended to have a greater proportion of sequences associated
with “phages, prophages, transposable elements, and plasmids” than control cows. This
suggests that the bacteria in antibiotic-treated cows possessed a greater ability to acquire
and spread antibiotic resistance genes through the use of phages/prophages (transduction)
or plasmids (conjugation) (Barbosa and Levy, 2000). When swine were fed antibiotics

63
(chlortetracycline, sulfamethazine, penicillin) an increase in prophage abundance was
detected in the fecal bacteria (Allen et al., 2011). Therefore, this trend for an increase in
these types of sequences may reflect an important impact of CCFA treatment on the
bacterial resistome.
Control cows had a significantly greater proportion of sequences associated with
“secondary metabolism” than CCFA-treated cows. Secondary metabolism involves the
natural production of secondary metabolites that often contain antibacterial properties,
often as a response to living in an environment with limited nutrient availability (Inaoka
et al., 2003). Therefore, it is interesting that bacteria from CCFA-treated cows contained
a lower proportion of sequences associated with this function. Perhaps this is due to less
competition for nutrients as bacteria susceptible to the antibiotic died off.
CCFA-treated cows had a significantly greater proportion of sequences associated
with “stress response” than control cows, suggesting that the bacteria in the gut of treated
cows were under stress from the antibiotic selection pressure. Similarly, when C.
trachomatis were exposed to penicillin, the bacteria became stressed and remained viable
but became non-infectious (Kintner et al., 2014). When stressed, C. trachomatis were
incapable of dividing and were less active metabolically (Kintner et al., 2014). By
extrapolation, we might conclude that the stressed bacteria in CCFA-treated cows were
relatively static in terms of metabolic function and cell growth. On another note, this
increase in stress response could also lead to a delayed change in bacterial species
diversity, as mentioned earlier.
Control cows had a significantly greater proportion of sequences associated with
“pathogenicity islands” than CCFA-treated cows. Pathogenicity islands are large
64
segments of DNA (>10 – 200 kb), often a component of plasmids or bacteriophages,
which can contain genes coding for virulence factors such as adhesion, invasion, and
Type III and Type IV secretion systems (Hacker and Kaper, 2000). This is surprising
because -lactam exposure was shown to increase the development and transfer of
pathogenicity islands between S. aureus isolates (Maiques et al., 2006).
CCFA-treated cows had a significantly greater proportion of sequences associated
with resistance to antibiotics and toxic compounds than control cows. This was expected
because it has been shown that cows receiving antibiotic treatment had increased resistant
bacterial isolates or increased fecal shedding of antibiotic resistance genes, even if for
only a short interval following treatment (Lowrance et al., 2007; Singer et al., 2008; Alali
et al., 2009).
Control cows had a significantly greater proportion of sequences associated with
“clustering-based subsystems” than CCFA-treated cows. “Clustering-based subsystems”
is a category MG-RAST uses for sequences that share a function, but one that is unknown
(Uroz et al., 2013). Therefore, the importance of this difference between the bacteria of
control and CCFA-treated cows is unknown.
CCFA-treated cows tended to have a greater proportion of sequences associated
with (synthesis of) “nucleosides and nucleotides” than control cows. The reason behind
this effect and its subsequent impact is unknown.
Control cows tended to have a greater proportion of sequences associated with
“DNA metabolism” than CCFA-treated cows. The reason behind this effect and its
subsequent impact is unknown.
65
BLAST/ARDB Analysis
BLAST/ARDB analysis to compare the fecal microbiomes of cows on the 3rd day
following treatment showed no effect of CCFA treatment on overall ARG-like sequence
abundance. This lack of effect is partly explained by the dominance (>85% of the
sequences associated with antibiotic resistance) in both CCFA-treated and control cows
of sequences coding for resistance to the tetracycline class of antibiotics. The presence of
antibiotic resistance in the fecal bacteria of cows with no previous exposure to antibiotics
is well documented, and the largest resistance category is against antibiotics like
tetracyclines that attack drug efflux pumps as a major mode of action (Durso et al., 2011).
For instance, genes coding for tetracycline resistance (tetW and tetQ) were detected in
more than 80% of fecal samples collected from cattle raised in grassland-production
systems (Santamaría et al., 2011). Therefore, given the lack of impact of CCFA (a
cephalosporin) on tetracycline resistance sequences, their overwhelming presence in the
current fecal samples may have masked any effect of CCFA treatment on ARG sequence
abundance.
Although CCFA treatment had no effect on overall ARG sequence abundance,
there was an effect on the proportion of -lactam and multidrug resistance gene
sequences, both of which were higher in ceftiofur-treated cows three days post-treatment
than in control cows. Similarly, when feedlot steers were given one dose of CCFA at
either 4.4 mg/kg or 6.6 mg/kg, fecal shedding of ceftiofur-resistant E. coli isolates was
significantly higher on 2, 6, 9, and 16 days following treatment (Lowrance et al., 2007).
In a corresponding study beef steers treated with one dose of 4.4 mg/kg CCFA had
significantly higher fecal amounts of blaCMY-2 on days 3, 7, and 10 following treatment
66
(Alali et al., 2009). Cows in the current study received two doses of roughly 3.3 mg/kg,
somewhat similar to the single 4.4 mg/kg dose in the Lowrance et al. (2007) study, and
this resulted in a significant increase in sequences associated with -lactam resistance on
day 3 post-treatment. Another study with more prolonged dosing of CCFA showed
similar results. When dairy cows were treated with five doses of 2.2 mg/kg CCFA,
significantly more antibiotic resistant E. coli were detected in the feces 4, 5, and 6 days
following treatment than in control cows (Singer et al., 2008). This was directly
correlated with the detection of blaCMY-2. On day 4 post-treatment isolates from two of the
treated cows possessed blaCMY-2, while on day 5 four cows did, declining to just one cow
by 6 days after treatment (Singer et al., 2008). Combined data from the current and
published research provide evidence that when cows are treated with CCFA, fecal
shedding of -lactam-resistant bacteria is a fairly immediate response.
qPCR Analysis
The bacterial genes analyzed using qPCR were (1) 16S rRNA used as a proxy for
bacterial abundance and to normalize abundance of measured ARGs; (2) tetW and tetO,
coding for tetracycline resistance; (3) ampC, coding for -lactam resistance; and (4)
ermB, coding for macrolide-lincosamide-streptogramin resistance, specifically focusing
on lincosamide resistance. It is important to note that ampC, tetW, and tetO were detected
in the feces of every cow, even the control cows. Resistance gene excretion in control
cows may have occurred because of the natural baseline level of resistance genes present
in the cow’s digestive tract. Even cattle never exposed to antibiotics excrete resistance
genes coding for resistance to fluoroquinolones, tetracyclines, -lactams, vancomycin,
and other classes of antibiotics (Durso et al., 2011). The detection of antibiotic resistance
67
starts even at an early age. Genes encoding for tetracycline (tetG, tetO, tetW, tetX),
sulfonamide (sul1, sul2) and macrolide-lincosamide-streptogramin (ermB, ermF)
resistance were detected in the feces of newborn dairy calves (Thames et al., 2012). In
fact, even Enterococcus spp. from the exotic Russian tortoise displayed resistance to
kanamycin, rifampicin, and vancomycin with 59% of the isolates being multi-drug
resistant (Nowakiewicz et al., 2013). Therefore, it is not surprising that even fecal
bacteria from control cows possessed resistance genes in the current study.
Antibiotic treatment had a significant effect on 16S rRNA abundance with
elevated abundance in CEPH-treated and control cows as compared to cows treated with
PIRL, suggesting reduced total bacterial counts in PIRL-treated cows. This effect was
especially apparent for CEPH vs. PIRL on d 3 post-treatment and control vs. PIRL on d 5
post-treatment. Approximately 24% of the administered intramammary pirlimycin dose is
excreted through the feces (Hornish et al., 1992) and exposure of gut bacteria to such a
large percentage of the dose may be the cause for reduced bacterial counts in the feces. In
contrast, cephapirin does not easily cross from the udder into the blood (Gehring and
Smith, 2006) so the bacterial populations in the lower GI tract of the cow remain
undisturbed.
Although day post-treatment did affect 16S rRNA abundance, few effects were
seen in pairwise comparison of specific days. 16S rRNA gene counts tended to be greater
on d 28 post-treatment than on both d 1 and d 7, which could suggest that bacterial
populations are affected following antibiotic treatment but eventually return to normal.
However, it is important to note that five days after treatment the cows were moved from
individual stalls back into the main barn where they are group housed. This change in

68
housing environment also has the potential to impact the fecal microbiome as cows were
again allowed contact with other members of the herd. A herd-level association of
ceftiofur treatment and expanded-spectrum cephalosporin resistance was observed in
dairy cows, indicating that the use of antibiotics in an individual cow can result in the
production of bacterial resistance in the entire herd (Tragesser et al., 2006). The same
effect could be true of bacterial diversity where, like antibiotic resistance, bacterial
populations could be transferred between members of a herd.
Relative fecal abundance of ampC was greater on d 3 than d 5 and d 28 following
treatment. Fecal excretion of blaCMY-2, which codes for an ampC-like enzyme and is very
closely related to ampC (Winokur et al., 2000), has been shown to increase shortly after
antibiotic treatment (Alali et al., 2009). Since the two genes are so closely related, it
makes sense that they would follow a similar fecal excretion pattern upon exposure to
antibiotic treatment. Thus, it can be concluded that there is an almost immediate response
of ampC excretion to antibiotic administration followed by a return to a baseline-level of
resistance gene excretion, similar to the pattern observed in published research focused
on other -lactam resistance genes.
There tended to be an effect of antibiotic treatment on the absolute abundance of
ermB, with CEPH having the largest effect. Since ermB codes for resistance to
lincosamides, it was expected that the PIRL treatment would show the largest impact.
However, when normalized to 16S the overall treatment effect of CEPH disappeared.
Instead, CCFA treatment resulted in the highest relative ermB abundance of all
treatments. For effect of day, CCFA treatment yielded the highest relative abundance of
ermB on d 28 post-treatment when compared with all days. The reason for this significant
69
jump on day 28 is unknown and it cannot be determined if ermB levels remained elevated
after 28 days following treatment because sampling was not continued.
The effect of antibiotic treatment on the two tetracycline resistance genes, tetO
and tetW, that were analyzed differed. There was no effect of antibiotic treatment or day
on the absolute or relative fecal abundance of tetO. However, there was a significant day
effect for both absolute and relative fecal abundance of tetW. Both tetO and tetW genes
code for ribosomal protection proteins (Chopra and Roberts, 2001). Although these genes
code for the same resistance mechanism, it is interesting that they responded differently
in this study.
The absolute abundance of tetW was significantly greater on d 28 when compared
with d 1 and d 7 post-treatment. However, when normalized to 16S rRNA, tetW was
significantly higher on d 3 than d 5 and d 28 post-treatment. It is possible that the higher
absolute abundance of tetW on d 28 was probably due to the numerically higher
abundance of 16S rRNA on d 28 (that is, increased bacteria numbers rather than bacteria
with increased copies of tetracycline resistance genes). If the tetW increase was due to
increased bacterial numbers, this indicates that increased bacterial resistance was not a
result of antibiotic treatment. Therefore, it can be concluded that tetW fecal abundance
was highest three days after antibiotic treatment before declining and remaining at a
lower level for the remainder of the sampling period.
Although a tetracycline antibiotic was not administered, the increase in tetW
relative abundance three days post-treatment could be related to the increase in ampC
excretion on that same day. Multiple resistance genes may be carried and spread together
mainly through extrachromosomal genetic elements such as plasmids (O'Brien, 2002). In
70
fact, tetracycline resistance genes are known to be associated with bla genes, including
the plasmid ampC gene (Seiffert et al., 2013). Therefore, the tetW fecal excretion pattern
may be influenced by the excretion of other resistance genes, resulting in increased fecal
excretion shortly after antibiotic treatment followed by a low, persistent level of
excretion.
CONCLUSIONS
Metagenomic techniques implemented in the current study gave a broad
perspective on the effects of antibiotic treatment on the bovine fecal microbiome in terms
of bacterial diversity, cell function, and antibiotic resistance profiles. Antibiotic treatment
resulted in fecal bacteria that were stressed under antibiotic selection pressure, inhibiting
their ability to perform normal cell functions like cell proliferation and degradation of
plant products consumed by the cow. However, treatment also induced a wide variety of
functions capable of aiding bacterial survival in the presence of antibiotic selection
pressure, including functions that aid in biofilm formation and the ability to acquire and
transfer resistance genes. In fact, treatment directly increased bacterial sequences
associated with resistance to -lactams and multidrug resistance, indicating that antibiotic
treatment increases antibiotic resistance, at least for a short period of time following
antibiotic treatment.
A definitive pattern of antibiotic resistance gene excretion following antibiotic
treatment is hard to determine. However, the results of this study support the hypothesis
that resistance gene excretion increases shortly after antibiotic treatment followed by a
gradual return to the baseline level of resistance in the cow’s fecal microbiome.
Therefore, when determining key time points for producers to focus their efforts when
71
treating their herd with antibiotics, it seems that the first 5 – 7 days following treatment
should be given attention. With the identification of manure treatments to degrade the
excreted resistance genes, feces from those days could be isolated and further processed
before land application to minimize the transfer of antibiotic resistance to other
environments and hosts.
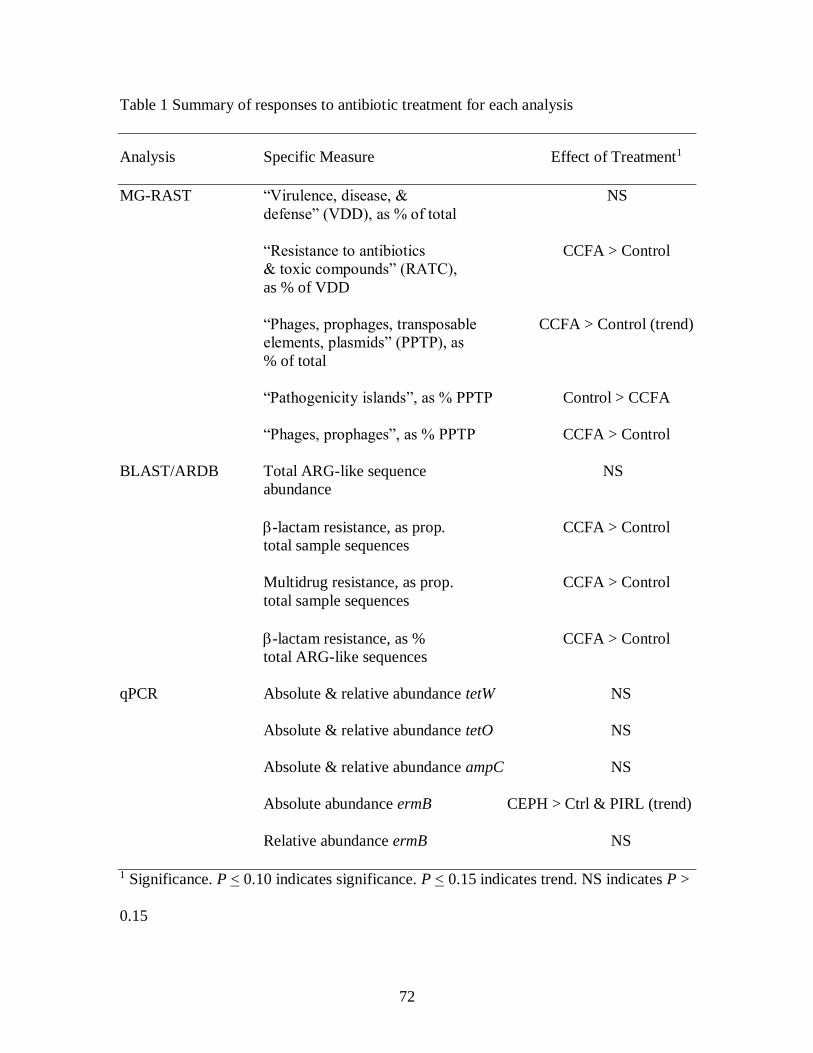
72
Table 1 Summary of responses to antibiotic treatment for each analysis
Analysis Specific Measure Effect of Treatment1
MG-RAST “Virulence, disease, & NS
defense” (VDD), as % of total
“Resistance to antibiotics CCFA > Control
& toxic compounds” (RATC),
as % of VDD
“Phages, prophages, transposable CCFA > Control (trend)
elements, plasmids” (PPTP), as
% of total
“Pathogenicity islands”, as % PPTP Control > CCFA
“Phages, prophages”, as % PPTP CCFA > Control
BLAST/ARDB Total ARG-like sequence NS
abundance
-lactam resistance, as prop. CCFA > Control
total sample sequences
Multidrug resistance, as prop. CCFA > Control
total sample sequences
-lactam resistance, as % CCFA > Control
total ARG-like sequences
qPCR Absolute & relative abundance tetW NS
Absolute & relative abundance tetO NS
Absolute & relative abundance ampC NS
Absolute abundance ermB CEPH > Ctrl & PIRL (trend)
Relative abundance ermB NS
1 Significance. P < 0.10 indicates significance. P < 0.15 indicates trend. NS indicates P >
0.15
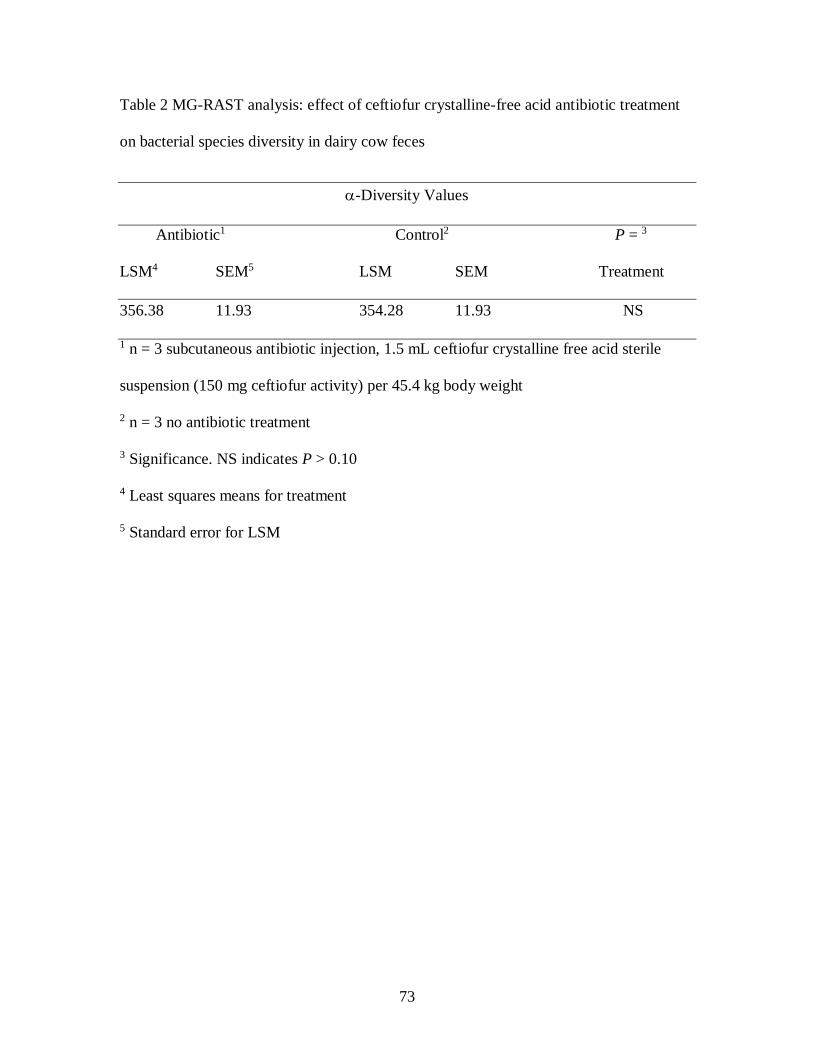
73
Table 2 MG-RAST analysis: effect of ceftiofur crystalline-free acid antibiotic treatment
on bacterial species diversity in dairy cow feces
-Diversity Values
Antibiotic1 Control2 P = 3
LSM4 SEM5 LSM SEM Treatment
356.38 11.93 354.28 11.93 NS
1 n = 3 subcutaneous antibiotic injection, 1.5 mL ceftiofur crystalline free acid sterile
suspension (150 mg ceftiofur activity) per 45.4 kg body weight
2 n = 3 no antibiotic treatment
3 Significance. NS indicates P > 0.10
4 Least squares means for treatment
5 Standard error for LSM
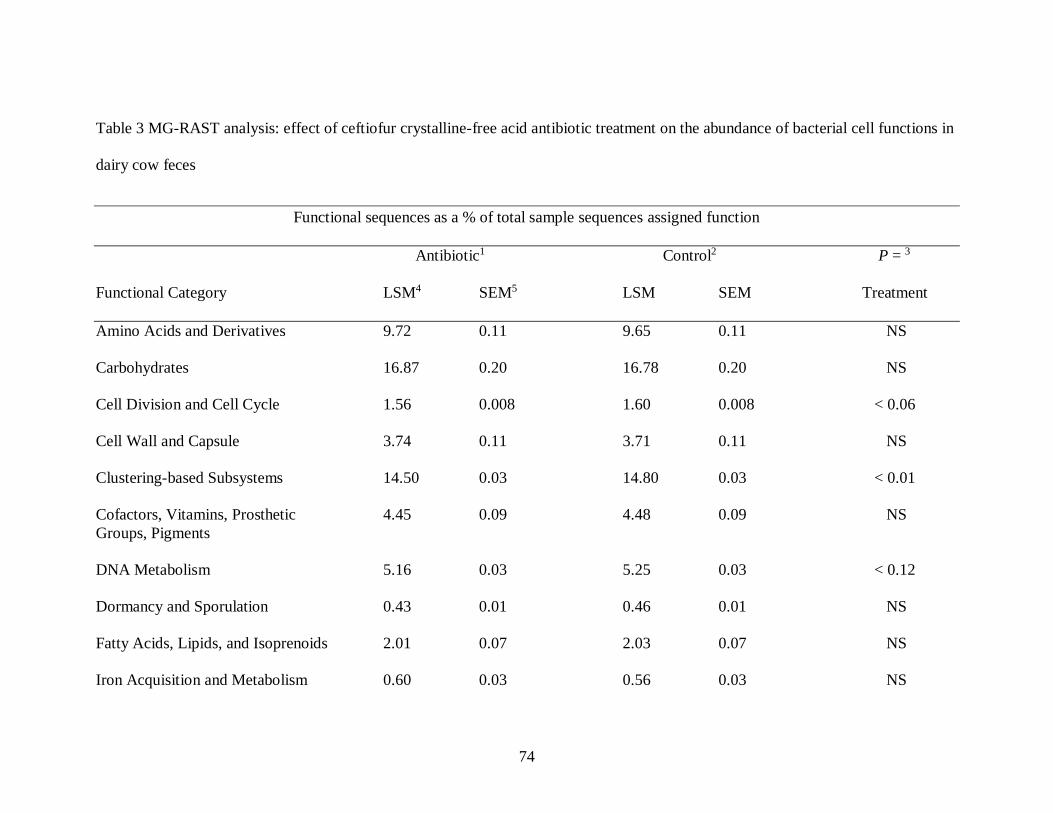
74
Table 3 MG-RAST analysis: effect of ceftiofur crystalline-free acid antibiotic treatment on the abundance of bacterial cell functions in
dairy cow feces
Functional sequences as a % of total sample sequences assigned function
Antibiotic1 Control2 P = 3
Functional Category LSM4 SEM5 LSM SEM Treatment
Amino Acids and Derivatives 9.72 0.11 9.65 0.11 NS
Carbohydrates 16.87 0.20 16.78 0.20 NS
Cell Division and Cell Cycle 1.56 0.008 1.60 0.008 < 0.06
Cell Wall and Capsule 3.74 0.11 3.71 0.11 NS
Clustering-based Subsystems 14.50 0.03 14.80 0.03 < 0.01
Cofactors, Vitamins, Prosthetic 4.45 0.09 4.48 0.09 NS
Groups, Pigments
DNA Metabolism 5.16 0.03 5.25 0.03 < 0.12
Dormancy and Sporulation 0.43 0.01 0.46 0.01 NS
Fatty Acids, Lipids, and Isoprenoids 2.01 0.07 2.03 0.07 NS
Iron Acquisition and Metabolism 0.60 0.03 0.56 0.03 NS
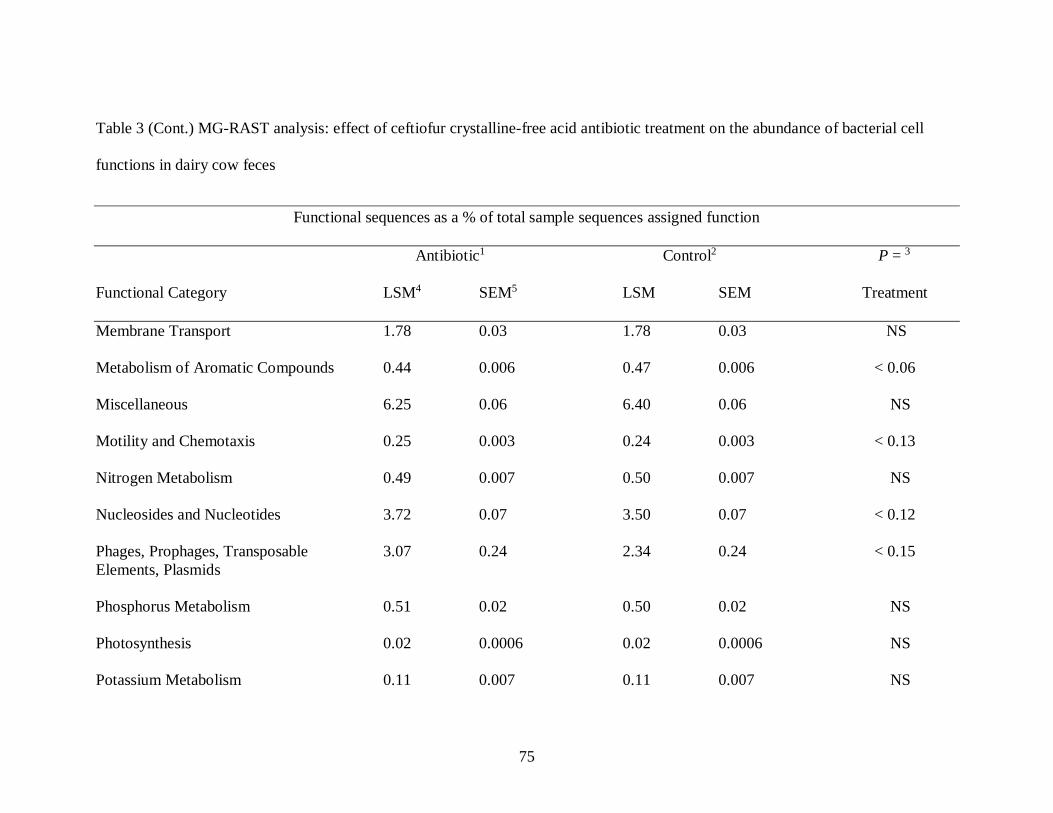
75
Table 3 (Cont.) MG-RAST analysis: effect of ceftiofur crystalline-free acid antibiotic treatment on the abundance of bacterial cell
functions in dairy cow feces
Functional sequences as a % of total sample sequences assigned function
Antibiotic1 Control2 P = 3
Functional Category LSM4 SEM5 LSM SEM Treatment
Membrane Transport 1.78 0.03 1.78 0.03 NS
Metabolism of Aromatic Compounds 0.44 0.006 0.47 0.006 < 0.06
Miscellaneous 6.25 0.06 6.40 0.06 NS
Motility and Chemotaxis 0.25 0.003 0.24 0.003 < 0.13
Nitrogen Metabolism 0.49 0.007 0.50 0.007 NS
Nucleosides and Nucleotides 3.72 0.07 3.50 0.07 < 0.12
Phages, Prophages, Transposable 3.07 0.24 2.34 0.24 < 0.15
Elements, Plasmids
Phosphorus Metabolism 0.51 0.02 0.50 0.02 NS
Photosynthesis 0.02 0.0006 0.02 0.0006 NS
Potassium Metabolism 0.11 0.007 0.11 0.007 NS

76
Table 3 (Cont.) MG-RAST analysis: effect of ceftiofur crystalline-free acid antibiotic treatment on the abundance of bacterial cell
functions in dairy cow feces
Functional sequences as a % of total sample sequences assigned function
Antibiotic1 Control2 P = 3
Functional Category LSM4 SEM5 LSM SEM Treatment
Protein Metabolism 11.16 0.13 11.32 0.13 NS
RNA Metabolism 6.29 0.07 6.45 0.07 NS
Regulation and Cell Signaling 0.97 0.01 0.96 0.01 NS
Respiration 1.83 0.06 1.95 0.06 NS
Secondary Metabolism 0.20 0.007 0.23 0.007 < 0.07
Stress Response 1.60 0.02 1.53 0.02 < 0.08
Sulfur Metabolism 0.55 0.02 0.54 0.02 NS
Virulence, Disease, and Defense 1.82 0.03 1.74 0.03 NS
1 n = 3 subcutaneous antibiotic injection, 1.5 mL ceftiofur crystalline free acid sterile suspension (150 mg ceftiofur activity) per 45.4
kg body weight
77
2 n = 3 no antibiotic treatment
3 Significance. P < 0.10 indicates significance. P < 0.15 indicates trend. NS indicates P > 0.15
4 Least squares means for treatment
5 Standard error for LSM
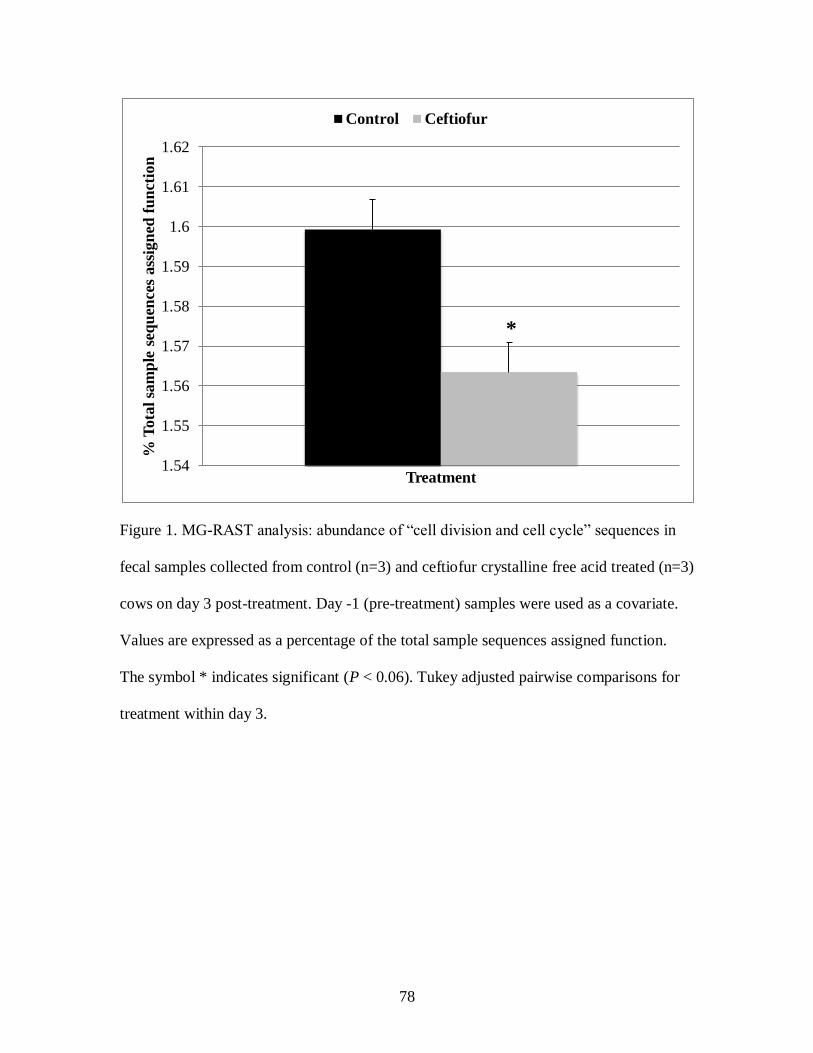
78
Figure 1. MG-RAST analysis: abundance of “cell division and cell cycle” sequences in
fecal samples collected from control (n=3) and ceftiofur crystalline free acid treated (n=3)
cows on day 3 post-treatment. Day -1 (pre-treatment) samples were used as a covariate.
Values are expressed as a percentage of the total sample sequences assigned function.
The symbol * indicates significant (P < 0.06). Tukey adjusted pairwise comparisons for
treatment within day 3.
1.54
1.55
1.56
1.57
1.58
1.59
1.6
1.61
1.62%
Tota
l sa
mp
le s
equ
ence
s ass
ign
ed f
un
ctio
n
Treatment
Control Ceftiofur
*

79
Figure 2. MG-RAST analysis: abundance of “clustering-based subsystems” sequences in
fecal samples collected from control (n=3) and ceftiofur crystalline free acid treated (n=3)
cows on day 3 post-treatment. Day -1 (pre-treatment) samples were used as a covariate.
Values are expressed as a percentage of the total sample sequences assigned function.
The symbol * indicates significant (P < 0.01). Tukey adjusted pairwise comparisons for
treatment within day 3.
14.3
14.4
14.5
14.6
14.7
14.8
14.9%
Tota
l sa
mp
le s
equ
ence
s ass
ign
ed f
un
ctio
n
Treatment
Control Ceftiofur
*

80
Figure 3. MG-RAST analysis: abundance of “metabolism of aromatic compounds”
sequences in fecal samples collected from control (n=3) and ceftiofur crystalline free acid
treated (n=3) cows on day 3 post-treatment. Day -1 (pre-treatment) samples were used as
a covariate. Values are expressed as a percentage of the total sample sequences assigned
function. The symbol * indicates significant (P < 0.06). Tukey adjusted pairwise
comparisons for treatment within day 3.
0.42
0.425
0.43
0.435
0.44
0.445
0.45
0.455
0.46
0.465
0.47
0.475%
Tota
l sa
mp
le s
equ
ence
s ass
ign
ed f
un
ctio
n
Treatment
Control Ceftiofur
*
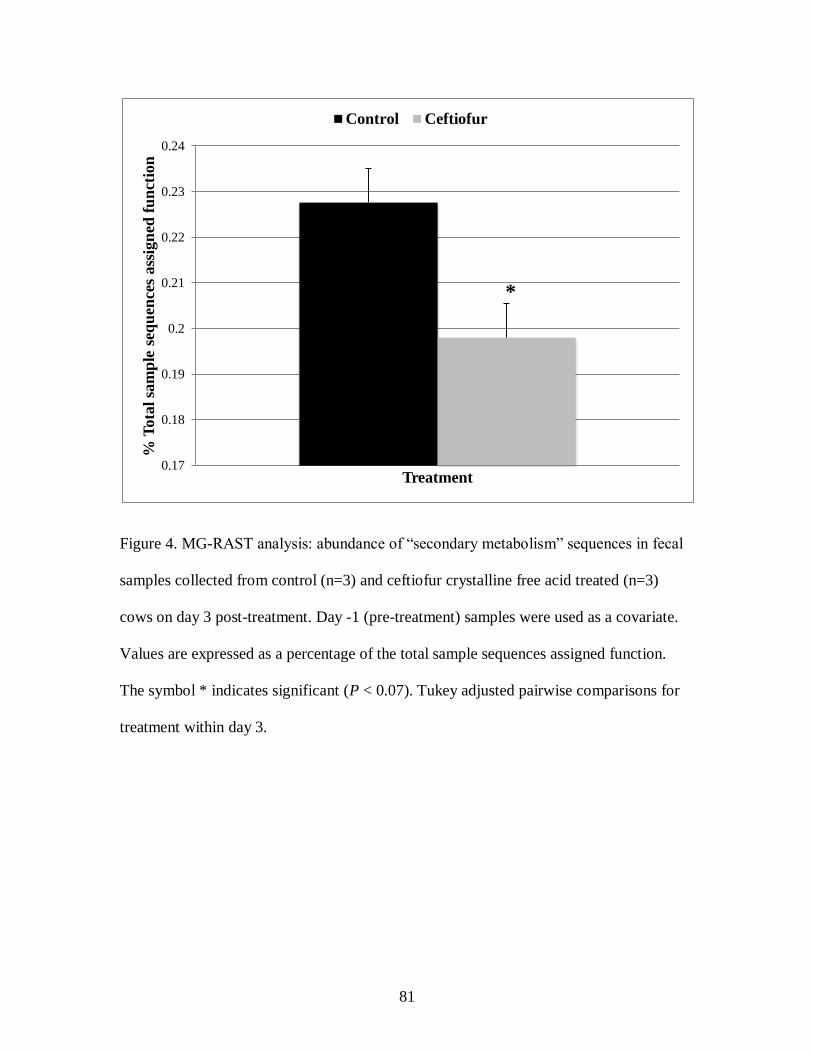
81
Figure 4. MG-RAST analysis: abundance of “secondary metabolism” sequences in fecal
samples collected from control (n=3) and ceftiofur crystalline free acid treated (n=3)
cows on day 3 post-treatment. Day -1 (pre-treatment) samples were used as a covariate.
Values are expressed as a percentage of the total sample sequences assigned function.
The symbol * indicates significant (P < 0.07). Tukey adjusted pairwise comparisons for
treatment within day 3.
0.17
0.18
0.19
0.2
0.21
0.22
0.23
0.24%
Tota
l sa
mp
le s
equ
ence
s ass
ign
ed f
un
ctio
n
Treatment
Control Ceftiofur
*
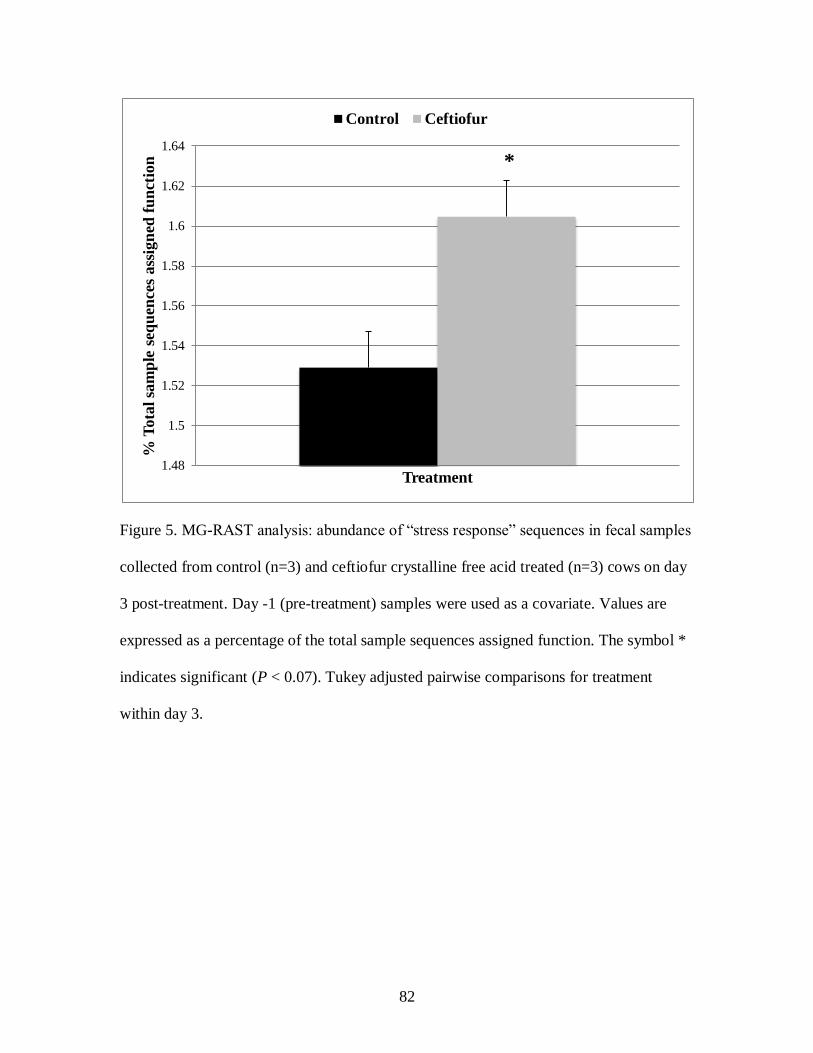
82
Figure 5. MG-RAST analysis: abundance of “stress response” sequences in fecal samples
collected from control (n=3) and ceftiofur crystalline free acid treated (n=3) cows on day
3 post-treatment. Day -1 (pre-treatment) samples were used as a covariate. Values are
expressed as a percentage of the total sample sequences assigned function. The symbol *
indicates significant (P < 0.07). Tukey adjusted pairwise comparisons for treatment
within day 3.
1.48
1.5
1.52
1.54
1.56
1.58
1.6
1.62
1.64%
Tota
l sa
mp
le s
equ
ence
s ass
ign
ed f
un
ctio
n
Treatment
Control Ceftiofur
*

83
Table 4 MG-RAST analysis: effect of ceftiofur crystalline-free acid antibiotic treatment
on the abundance of “phages, prophages, transposable elements, plasmids” sequences in
dairy cow feces
Sequence abundance as a % of “phages, prophages, transposable elements, plasmids”
total sequences
Antibiotic1 Control2 P = 3
Category LSM4 SEM5 LSM SEM Treatment
Gene Transfer Agent 0.0043 0.0009 0.0039 0.0009 NS
Pathogenicity Islands 11.60 0.61 14.41 0.61 < 0.06
Phages, Prophages 83.14 1.36 78.21 1.36 < 0.11
Plasmid Related Functions 0.0022 0.0004 0.0025 0.0004 NS
Transposable Elements 5.58 0.84 7.04 0.84 NS
Other 0.008 0.002 0.005 0.002 NS
1 n = 3 subcutaneous antibiotic injection, 1.5 mL ceftiofur crystalline free acid sterile
suspension (150 mg ceftiofur activity) per 45.4 kg body weight
2 n = 3 no antibiotic treatment
3 Significance. NS indicates P > 0.10
4 Least squares means for treatment
5 Standard error for LSM
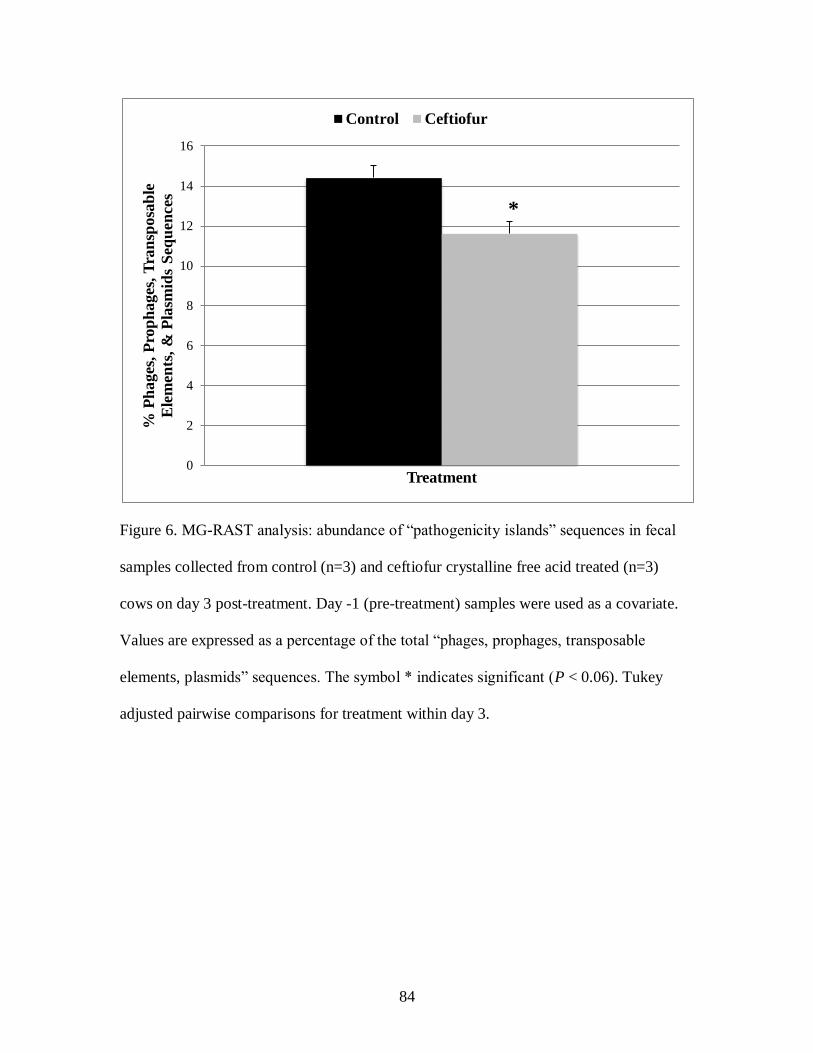
84
Figure 6. MG-RAST analysis: abundance of “pathogenicity islands” sequences in fecal
samples collected from control (n=3) and ceftiofur crystalline free acid treated (n=3)
cows on day 3 post-treatment. Day -1 (pre-treatment) samples were used as a covariate.
Values are expressed as a percentage of the total “phages, prophages, transposable
elements, plasmids” sequences. The symbol * indicates significant (P < 0.06). Tukey
adjusted pairwise comparisons for treatment within day 3.
0
2
4
6
8
10
12
14
16%
Ph
ages
, P
rop
hages
, T
ran
sposa
ble
Ele
men
ts,
& P
lasm
ids
Seq
uen
ces
Treatment
Control Ceftiofur
*
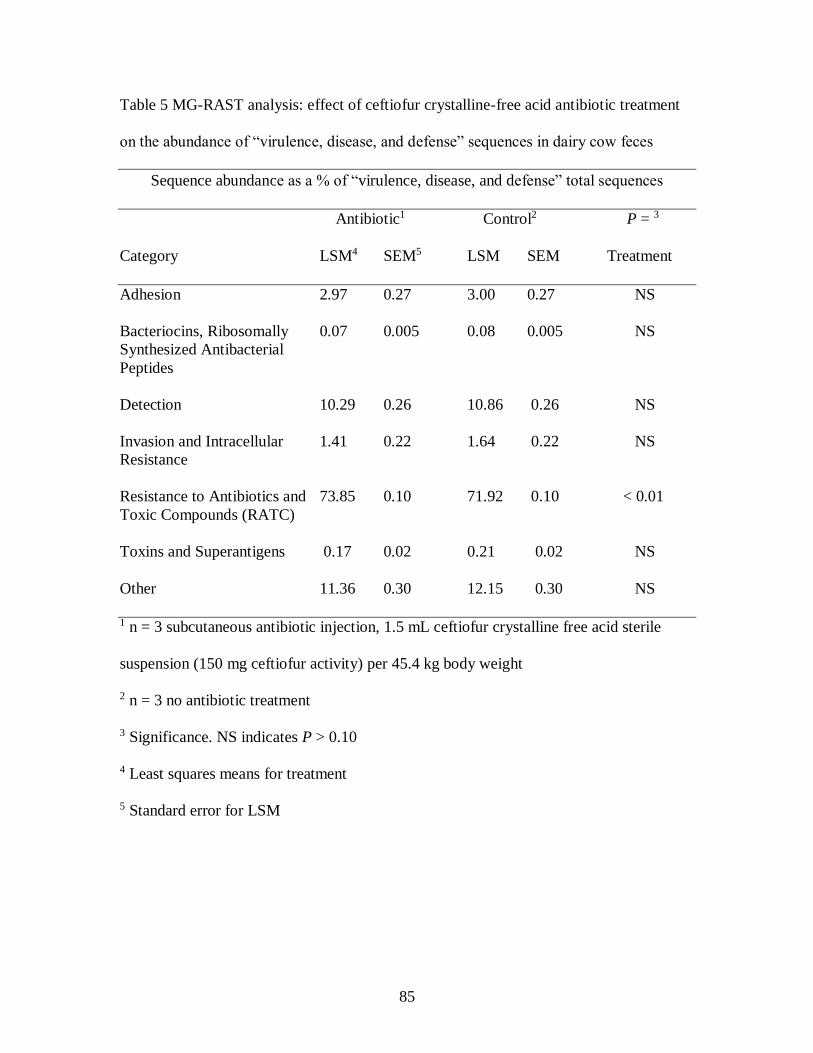
85
Table 5 MG-RAST analysis: effect of ceftiofur crystalline-free acid antibiotic treatment
on the abundance of “virulence, disease, and defense” sequences in dairy cow feces
Sequence abundance as a % of “virulence, disease, and defense” total sequences
Antibiotic1 Control2 P = 3
Category LSM4 SEM5 LSM SEM Treatment
Adhesion 2.97 0.27 3.00 0.27 NS
Bacteriocins, Ribosomally 0.07 0.005 0.08 0.005 NS
Synthesized Antibacterial
Peptides
Detection 10.29 0.26 10.86 0.26 NS
Invasion and Intracellular 1.41 0.22 1.64 0.22 NS
Resistance
Resistance to Antibiotics and 73.85 0.10 71.92 0.10 < 0.01
Toxic Compounds (RATC)
Toxins and Superantigens 0.17 0.02 0.21 0.02 NS
Other 11.36 0.30 12.15 0.30 NS
1 n = 3 subcutaneous antibiotic injection, 1.5 mL ceftiofur crystalline free acid sterile
suspension (150 mg ceftiofur activity) per 45.4 kg body weight
2 n = 3 no antibiotic treatment
3 Significance. NS indicates P > 0.10
4 Least squares means for treatment
5 Standard error for LSM

86
Figure 7. MG-RAST analysis: abundance of “resistance to antibiotics and toxic
compounds (RATC)” sequences in fecal samples collected from control (n=3) and
ceftiofur crystalline free acid treated (n=3) cows on day 3 post-treatment. Day -1 (pre-
treatment) samples were used as a covariate. Values are expressed as a percentage of the
total “virulence, disease, and defense” sequences. The symbol * indicates significant (P <
0.01). Tukey adjusted pairwise comparisons for treatment within day 3.
70.5
71
71.5
72
72.5
73
73.5
74
74.5%
of
Tota
l V
iru
len
ce,
Dis
ease
, &
Def
ense
Seq
uen
ces
Treatment
Control Ceftiofur
*
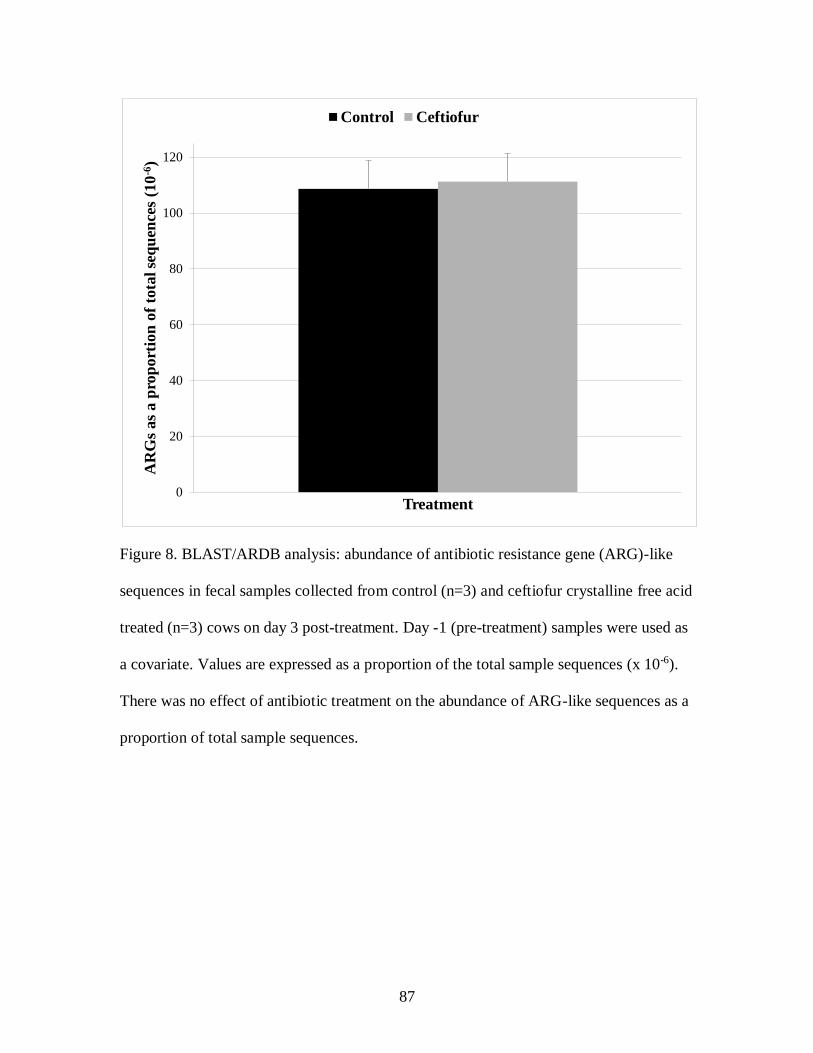
87
Figure 8. BLAST/ARDB analysis: abundance of antibiotic resistance gene (ARG)-like
sequences in fecal samples collected from control (n=3) and ceftiofur crystalline free acid
treated (n=3) cows on day 3 post-treatment. Day -1 (pre-treatment) samples were used as
a covariate. Values are expressed as a proportion of the total sample sequences (x 10-6).
There was no effect of antibiotic treatment on the abundance of ARG-like sequences as a
proportion of total sample sequences.
0
20
40
60
80
100
120A
RG
s as
a p
rop
ort
ion
of
tota
l se
qu
ence
s (1
0-6
)
Treatment
Control Ceftiofur
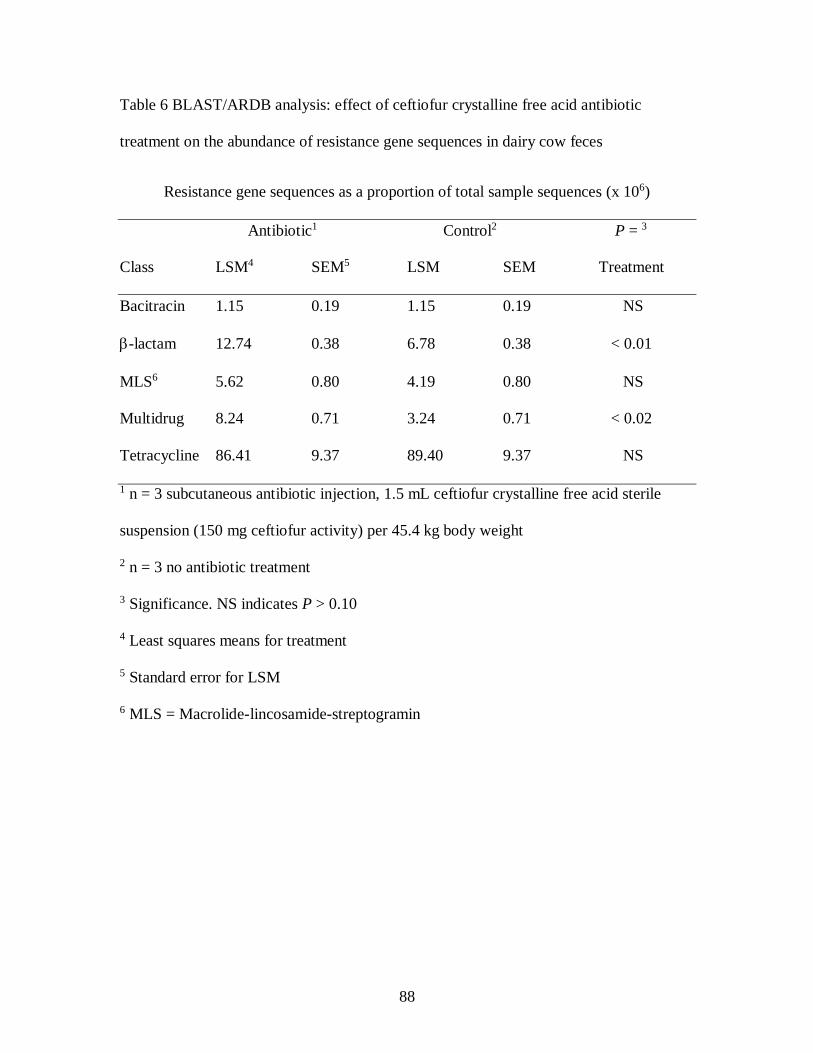
88
Table 6 BLAST/ARDB analysis: effect of ceftiofur crystalline free acid antibiotic
treatment on the abundance of resistance gene sequences in dairy cow feces
Resistance gene sequences as a proportion of total sample sequences (x 106)
Antibiotic1 Control2 P = 3
Class LSM4 SEM5 LSM SEM Treatment
Bacitracin 1.15 0.19 1.15 0.19 NS
-lactam 12.74 0.38 6.78 0.38 < 0.01
MLS6 5.62 0.80 4.19 0.80 NS
Multidrug 8.24 0.71 3.24 0.71 < 0.02
Tetracycline 86.41 9.37 89.40 9.37 NS
1 n = 3 subcutaneous antibiotic injection, 1.5 mL ceftiofur crystalline free acid sterile
suspension (150 mg ceftiofur activity) per 45.4 kg body weight
2 n = 3 no antibiotic treatment
3 Significance. NS indicates P > 0.10
4 Least squares means for treatment
5 Standard error for LSM
6 MLS = Macrolide-lincosamide-streptogramin

89
Figure 9. BLAST/ARDB analysis: abundance of beta-lactam resistance genes in fecal
samples collected from control (n=3) and ceftiofur crystalline free acid treated (n=3)
cows on day 3 post-treatment. Day -1 (pre-treatment) samples were used as a covariate.
Values are expressed as a percentage of the total sample sequences (x 10-6). The symbol *
indicates significant (P < 0.01). Tukey adjusted pairwise comparisons for treatment
within day 3.
0
2
4
6
8
10
12
14B
eta
-lact
am
res
ista
nce
gen
es a
s a p
rop
ort
ion
of
tota
l se
qu
ence
s (1
0-6
)
Treatment
Control Ceftiofur

90
Figure 10. BLAST/ARDB analysis: abundance of multidrug resistance genes in fecal
samples collected from control (n=3) and ceftiofur crystalline free acid treated (n=3)
cows on day 3 post-treatment. Day -1 (pre-treatment) samples were used as a covariate.
Values are expressed as a percentage of the total sample sequences (x 10-6). The symbol *
indicates significant (P < 0.02). Tukey adjusted pairwise comparisons for treatment
within day 3.
0
1
2
3
4
5
6
7
8
9
10M
ult
idru
g r
esis
tan
ce g
enes
as
a p
rop
ort
ion
of
tota
l se
qu
ence
s (1
0-6
)
Treatment
Control Ceftiofur
*
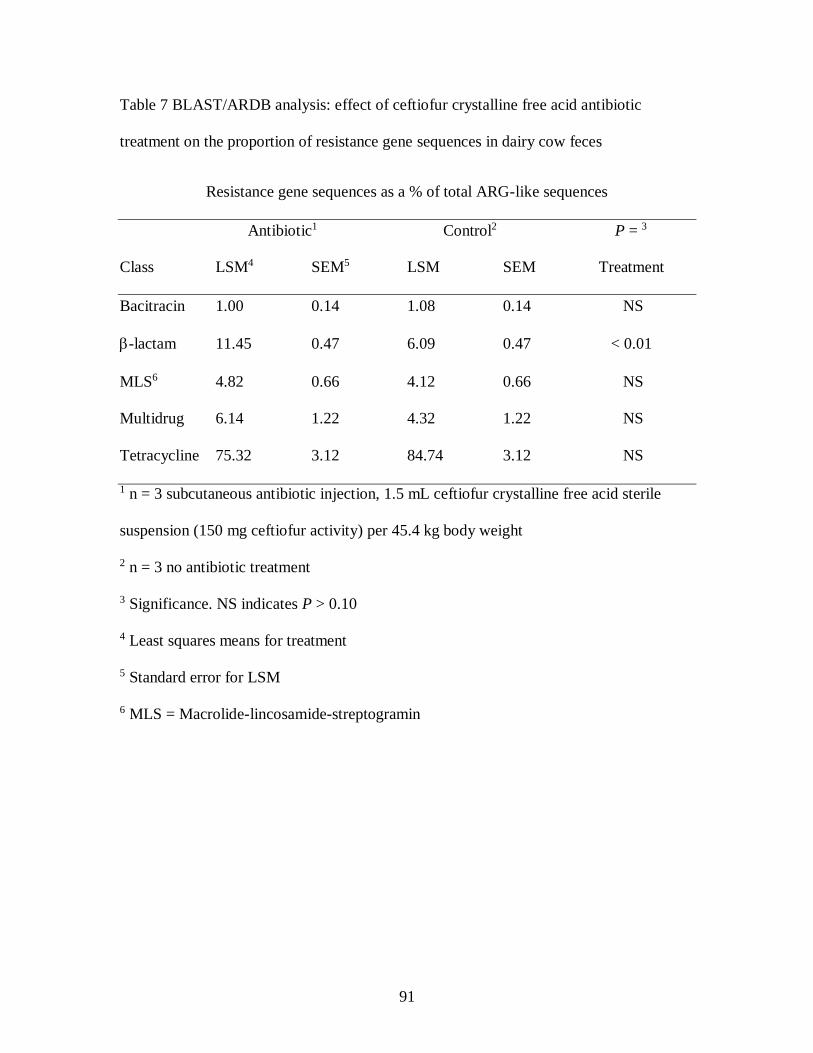
91
Table 7 BLAST/ARDB analysis: effect of ceftiofur crystalline free acid antibiotic
treatment on the proportion of resistance gene sequences in dairy cow feces
Resistance gene sequences as a % of total ARG-like sequences
Antibiotic1 Control2 P = 3
Class LSM4 SEM5 LSM SEM Treatment
Bacitracin 1.00 0.14 1.08 0.14 NS
-lactam 11.45 0.47 6.09 0.47 < 0.01
MLS6 4.82 0.66 4.12 0.66 NS
Multidrug 6.14 1.22 4.32 1.22 NS
Tetracycline 75.32 3.12 84.74 3.12 NS
1 n = 3 subcutaneous antibiotic injection, 1.5 mL ceftiofur crystalline free acid sterile
suspension (150 mg ceftiofur activity) per 45.4 kg body weight
2 n = 3 no antibiotic treatment
3 Significance. NS indicates P > 0.10
4 Least squares means for treatment
5 Standard error for LSM
6 MLS = Macrolide-lincosamide-streptogramin

92
Figure 11. BLAST/ARDB analysis: abundance of beta-lactam resistance genes in fecal
samples collected from control (n=3) and ceftiofur crystalline free acid treated (n=3)
cows on day 3 post-treatment. Day -1 (pre-treatment) samples were used as a covariate.
Values are expressed as a percentage of the total ARG-like sequences (x 10-6). The
symbol * indicates significant (P < 0.01). Tukey adjusted pairwise comparisons for
treatment within day 3.
0
2
4
6
8
10
12
14B
eta-l
act
am
res
ista
nce
gen
es a
s a %
of
tota
l A
RG
seq
uen
ces
Treatment
Control Ceftiofur
*
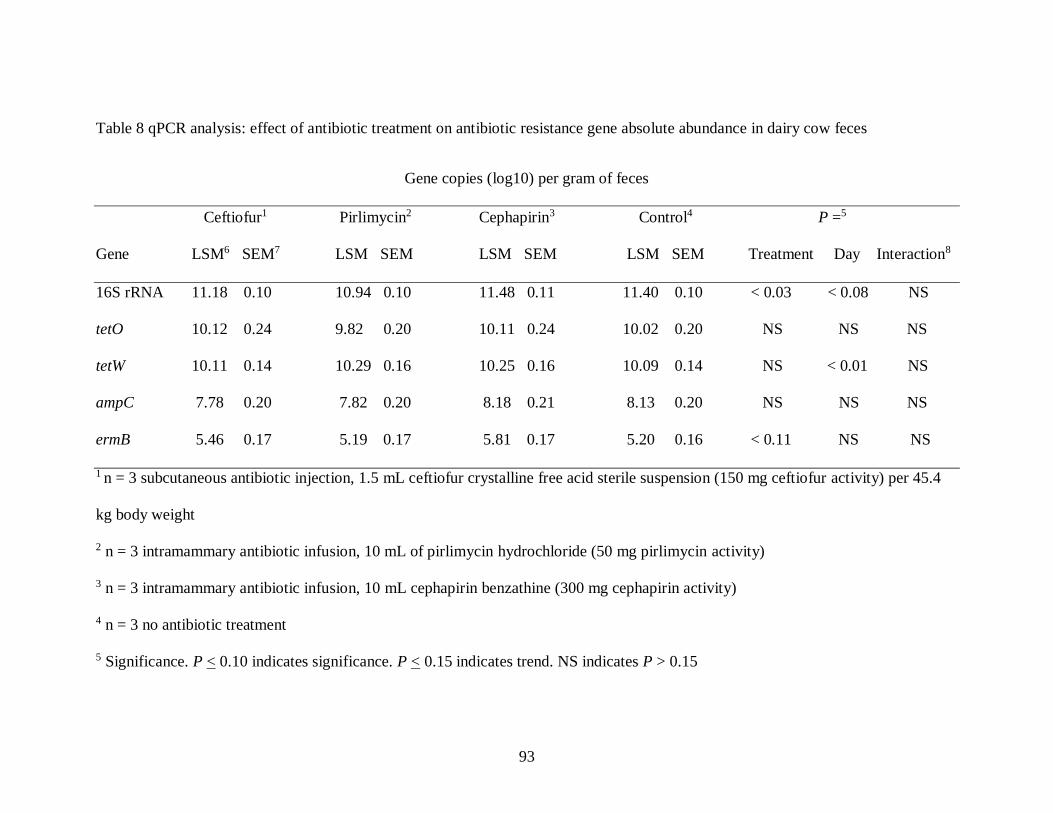
93
Table 8 qPCR analysis: effect of antibiotic treatment on antibiotic resistance gene absolute abundance in dairy cow feces
Gene copies (log10) per gram of feces
Ceftiofur1 Pirlimycin2 Cephapirin3 Control4 P =5
Gene LSM6 SEM7 LSM SEM LSM SEM LSM SEM Treatment Day Interaction8
16S rRNA 11.18 0.10 10.94 0.10 11.48 0.11 11.40 0.10 < 0.03 < 0.08 NS
tetO 10.12 0.24 9.82 0.20 10.11 0.24 10.02 0.20 NS NS NS
tetW 10.11 0.14 10.29 0.16 10.25 0.16 10.09 0.14 NS < 0.01 NS
ampC 7.78 0.20 7.82 0.20 8.18 0.21 8.13 0.20 NS NS NS
ermB 5.46 0.17 5.19 0.17 5.81 0.17 5.20 0.16 < 0.11 NS NS
1 n = 3 subcutaneous antibiotic injection, 1.5 mL ceftiofur crystalline free acid sterile suspension (150 mg ceftiofur activity) per 45.4
kg body weight
2 n = 3 intramammary antibiotic infusion, 10 mL of pirlimycin hydrochloride (50 mg pirlimycin activity)
3 n = 3 intramammary antibiotic infusion, 10 mL cephapirin benzathine (300 mg cephapirin activity)
4 n = 3 no antibiotic treatment
5 Significance. P < 0.10 indicates significance. P < 0.15 indicates trend. NS indicates P > 0.15

94
6 Least squares means for treatment
7 Standard error for treatment LSM
8 Two way interaction of treatment and day

95
Figure 12. qPCR analysis: abundance of 16S rRNA (log10 gene copies per 1.0 g freeze-
dried feces) in fecal samples. Samples were collected from control (n = 3), ceftiofur
crystalline free acid treated (n = 3), pirlimycin hydrochloride treated (n = 3), and
cephapirin benzathine treated (n = 3) cows. Day -1 (pre-treatment) samples were used as
a covariate. The symbol * indicates significant (P < 0.10) Tukey adjusted pairwise
comparisons for treatment within day.
10
10.5
11
11.5
12
12.5
0 5 10 15 20 25 30log 1
6S
rR
NA
gen
e co
pie
s/g d
ry f
eces
Day post-treatment
Control Ceftiofur Pirlimycin Cephapirin
*
**
*
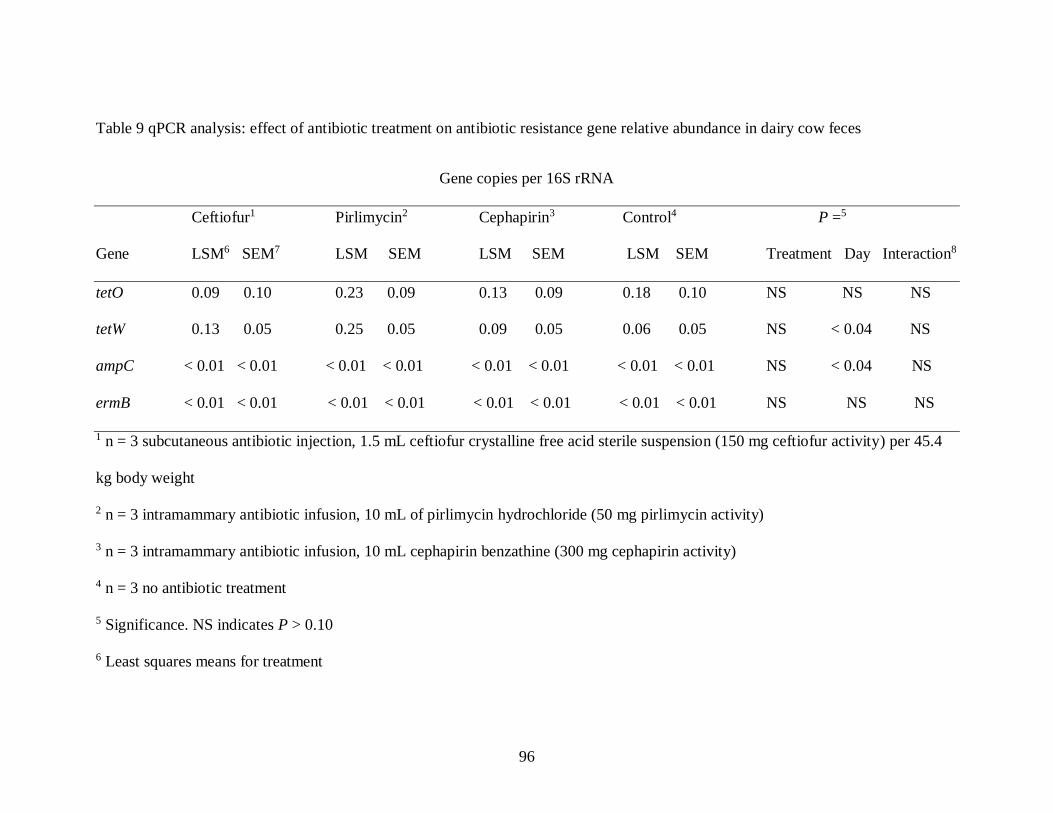
96
Table 9 qPCR analysis: effect of antibiotic treatment on antibiotic resistance gene relative abundance in dairy cow feces
Gene copies per 16S rRNA
Ceftiofur1 Pirlimycin2 Cephapirin3 Control4 P =5
Gene LSM6 SEM7 LSM SEM LSM SEM LSM SEM Treatment Day Interaction8
tetO 0.09 0.10 0.23 0.09 0.13 0.09 0.18 0.10 NS NS NS
tetW 0.13 0.05 0.25 0.05 0.09 0.05 0.06 0.05 NS < 0.04 NS
ampC < 0.01 < 0.01 < 0.01 < 0.01 < 0.01 < 0.01 < 0.01 < 0.01 NS < 0.04 NS
ermB < 0.01 < 0.01 < 0.01 < 0.01 < 0.01 < 0.01 < 0.01 < 0.01 NS NS NS
1 n = 3 subcutaneous antibiotic injection, 1.5 mL ceftiofur crystalline free acid sterile suspension (150 mg ceftiofur activity) per 45.4
kg body weight
2 n = 3 intramammary antibiotic infusion, 10 mL of pirlimycin hydrochloride (50 mg pirlimycin activity)
3 n = 3 intramammary antibiotic infusion, 10 mL cephapirin benzathine (300 mg cephapirin activity)
4 n = 3 no antibiotic treatment
5 Significance. NS indicates P > 0.10
6 Least squares means for treatment
97
7 Standard error for treatment LSM
8 Two way interaction of treatment and day
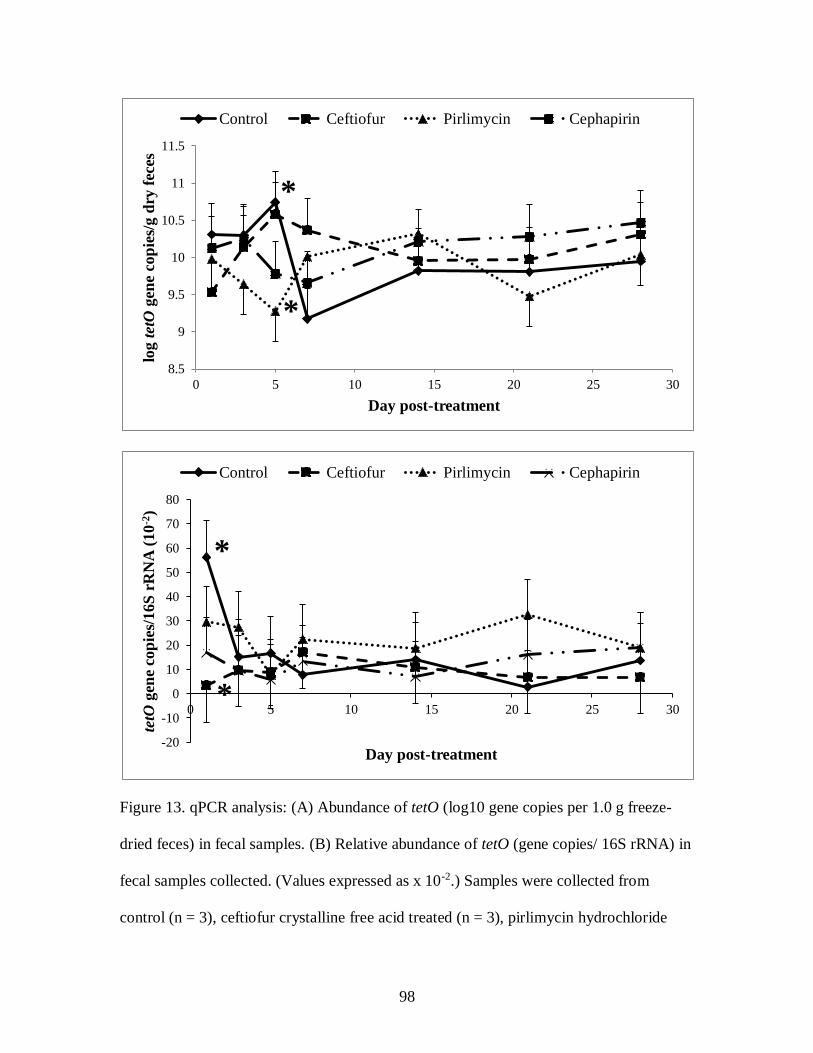
98
Figure 13. qPCR analysis: (A) Abundance of tetO (log10 gene copies per 1.0 g freeze-
dried feces) in fecal samples. (B) Relative abundance of tetO (gene copies/ 16S rRNA) in
fecal samples collected. (Values expressed as x 10-2.) Samples were collected from
control (n = 3), ceftiofur crystalline free acid treated (n = 3), pirlimycin hydrochloride
8.5
9
9.5
10
10.5
11
11.5
0 5 10 15 20 25 30
log
tetO
gen
e co
pie
s/g d
ry f
eces
Day post-treatment
Control Ceftiofur Pirlimycin Cephapirin
*
*
-20
-10
0
10
20
30
40
50
60
70
80
0 5 10 15 20 25 30
tetO
gen
e co
pie
s/16S
rR
NA
(10
-2)
Day post-treatment
Control Ceftiofur Pirlimycin Cephapirin
*
*
99
treated (n = 3), and cephapirin benzathine treated (n = 3) cows. Day -1 (pre-treatment)
samples were used as a covariate. The symbol * indicates significant (P < 0.10) Tukey
adjusted pairwise comparisons for treatment within day.
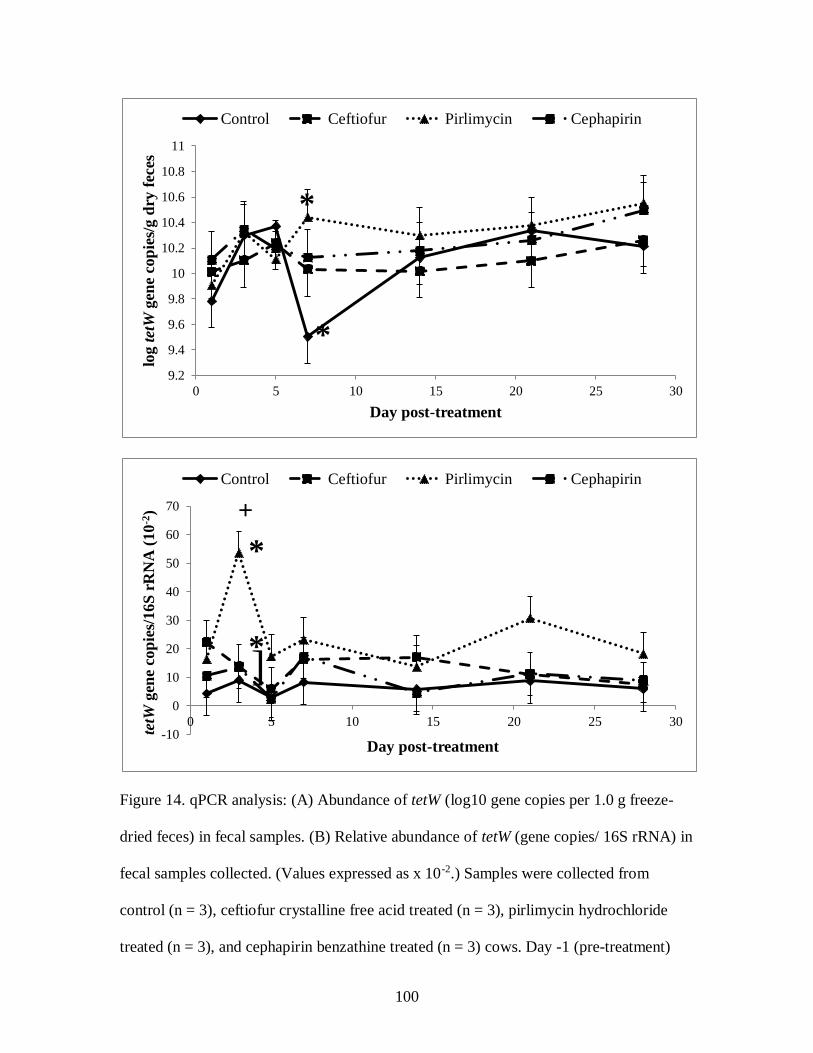
100
Figure 14. qPCR analysis: (A) Abundance of tetW (log10 gene copies per 1.0 g freeze-
dried feces) in fecal samples. (B) Relative abundance of tetW (gene copies/ 16S rRNA) in
fecal samples collected. (Values expressed as x 10-2.) Samples were collected from
control (n = 3), ceftiofur crystalline free acid treated (n = 3), pirlimycin hydrochloride
treated (n = 3), and cephapirin benzathine treated (n = 3) cows. Day -1 (pre-treatment)
9.2
9.4
9.6
9.8
10
10.2
10.4
10.6
10.8
11
0 5 10 15 20 25 30
log
tetW
gen
e co
pie
s/g d
ry f
eces
Day post-treatment
Control Ceftiofur Pirlimycin Cephapirin
*
*
-10
0
10
20
30
40
50
60
70
0 5 10 15 20 25 30
tetW
gen
e co
pie
s/16S
rR
NA
(10
-2)
Day post-treatment
Control Ceftiofur Pirlimycin Cephapirin
*
*]
+
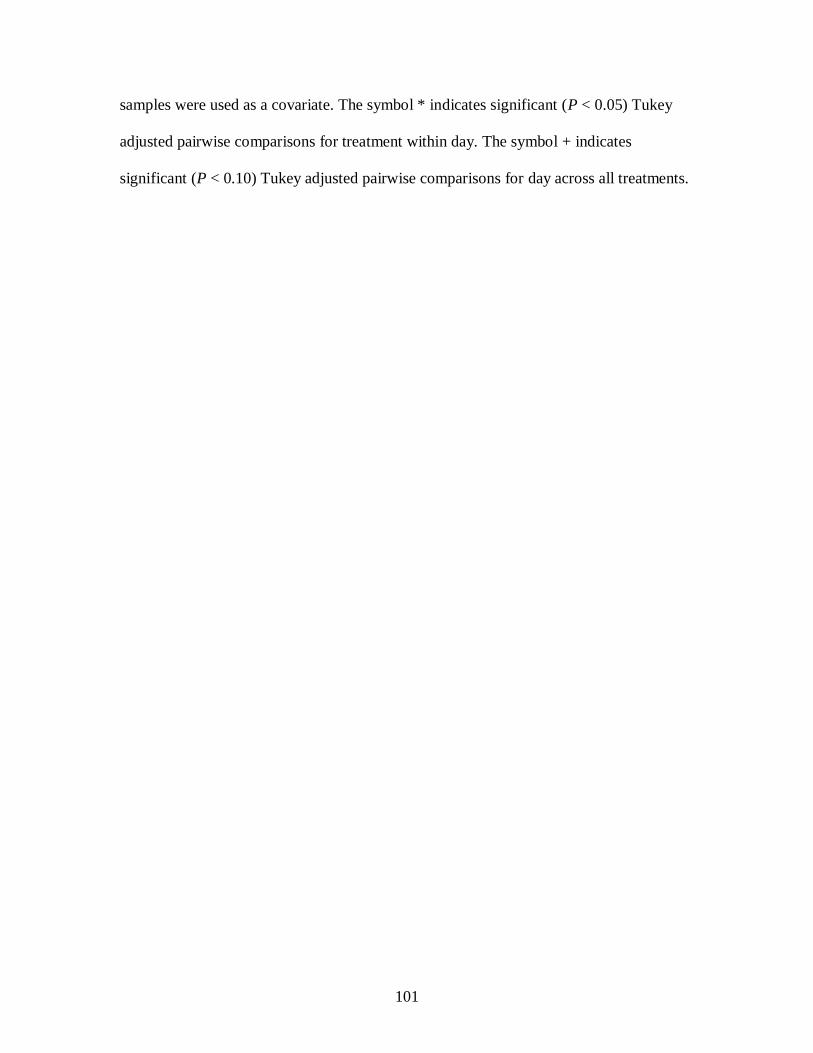
101
samples were used as a covariate. The symbol * indicates significant (P < 0.05) Tukey
adjusted pairwise comparisons for treatment within day. The symbol + indicates
significant (P < 0.10) Tukey adjusted pairwise comparisons for day across all treatments.
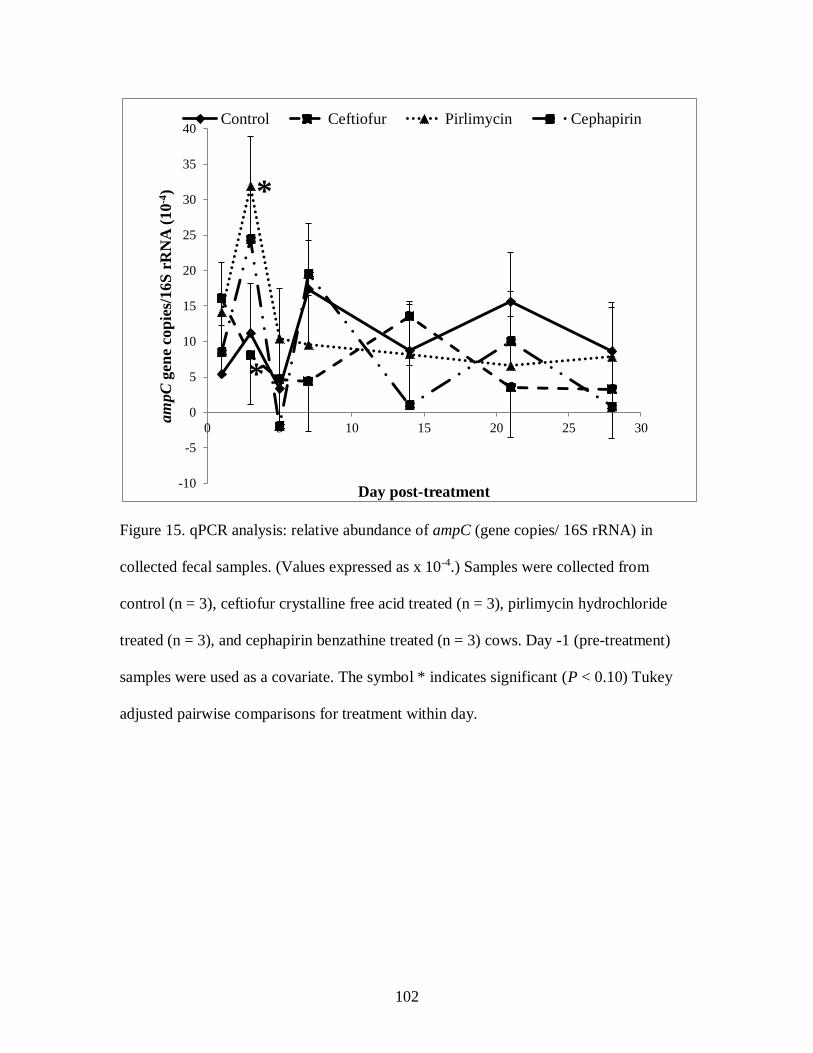
102
Figure 15. qPCR analysis: relative abundance of ampC (gene copies/ 16S rRNA) in
collected fecal samples. (Values expressed as x 10-4.) Samples were collected from
control (n = 3), ceftiofur crystalline free acid treated (n = 3), pirlimycin hydrochloride
treated (n = 3), and cephapirin benzathine treated (n = 3) cows. Day -1 (pre-treatment)
samples were used as a covariate. The symbol * indicates significant (P < 0.10) Tukey
adjusted pairwise comparisons for treatment within day.
-10
-5
0
5
10
15
20
25
30
35
40
0 5 10 15 20 25 30
am
pC
gen
e co
pie
s/1
6S
rR
NA
(10
-4)
Day post-treatment
Control Ceftiofur Pirlimycin Cephapirin
*
*
103
Figure 16. qPCR analysis: (A) Abundance of ermB (log10 gene copies per 1.0 g freeze-
dried feces) in fecal samples. (B) Relative abundance of ermB (gene copies/ 16S rRNA)
in collected fecal samples. (Values expressed as x 10-4.) Samples were collected from
4.5
5
5.5
6
6.5
7
1 2 3 4 5 6 7
log
erm
B g
ene
cop
ies/
g d
ry f
eces
Day post-treatment
Control Ceftiofur Pirlimycin Cephapirin
*
*
-50
0
50
100
150
200
250
300
350
400
450
500
1 2 3 4 5 6 7
erm
Bgen
e co
pie
s/16S
rR
NA
(10
-4)
Day post-treatment
Control Ceftiofur Pirlimycin Cephapirin
*
*
104
control (n = 3), ceftiofur crystalline free acid treated (n = 3), pirlimycin hydrochloride
treated (n = 3), and cephapirin benzathine treated (n = 3) cows. Day -1 (pre-treatment)
samples were used as a covariate. The symbol * indicates significant (P < 0.10) Tukey
adjusted pairwise comparisons for treatment within day.
105
REFERENCES
Alali, W., H. Scott, B. Norby, W. Gebreyes, and G. Loneragan. 2009. Quantification of
the BlaCMY-2 in feces from beef feedlot cattle administered three different doses of
ceftiofur in a longitudinal controlled field trial. Foodborne pathogens and disease 6:917-
924.
Allen, H. K., T. Looft, D. O. Bayles, S. Humphrey, U. Y. Levine, D. Alt, and T. B.
Stanton. 2011. Antibiotics in feed induce prophages in swine fecal microbiomes. MBio
2:e00260-00211.
Aminov, R., N. Garrigues-Jeanjean, and R. Mackie. 2001. Molecular ecology of
tetracycline resistance: development and validation of primers for detection of
tetracycline resistance genes encoding ribosomal protection proteins. Applied and
environmental microbiology 67:22-32.
Barbosa, T. M., and S. B. Levy. 2000. The impact of antibiotic use on resistance
development and persistence. Drug resistance updates 3:303-311.
Bigot, R., J. Bertaux, J. Frere, and J.-M. Berjeaud. 2013. Intra-Amoeba Multiplication
Induces Chemotaxis and Biofilm Colonization and Formation for Legionella. PloS one
8:e77875.
Chopra, I., and M. Roberts. 2001. Tetracycline antibiotics: mode of action, applications,
molecular biology, and epidemiology of bacterial resistance. Microbiology and molecular
biology reviews 65:232-260.
Díaz, E., J. I. Jiménez, and J. Nogales. 2013. Aerobic degradation of aromatic
compounds. Current opinion in biotechnology 24:431-442.
106
Durso, L. M., G. P. Harhay, J. L. Bono, and T. P. Smith. 2011. Virulence-associated and
antibiotic resistance genes of microbial populations in cattle feces analyzed using a
metagenomic approach. Journal of microbiological methods 84:278-282.
Edrington, T., M. Looper, S. Duke, T. Callaway, K. Genovese, R. Anderson, and D.
Nisbet. 2006. Effect of ionophore supplementation on the incidence of Escherichia coli
O157: H7 and Salmonella and antimicrobial susceptibility of fecal coliforms in stocker
cattle. Foodbourne pathogens & disease 3:284-291.
FDA. 2011. Summary report on antimicrobials sold or distributed for use in food-
producing animals.
FDA. 2012. 2010-2011 drug use review.
Fleming, A. 1945. Penicillin. Nobel Lecture.
Fuchs, G., M. Boll, and J. Heider. 2011. Microbial degradation of aromatic compounds—
from one strategy to four. Nature reviews microbiology 9:803-816.
Gehring, R., and G. Smith. 2006. An overview of factors affecting the disposition of
intramammary preparations used to treat bovine mastitis. Journal of veterinary
pharmacology and therapeutics 29:237-241.
Hacker, J., and J. B. Kaper. 2000. Pathogenicity islands and the evolution of microbes.
Annual reviews in microbiology 54:641-679.
Halbert, L. W., J. B. Kaneene, P. L. Ruegg, L. D. Warnick, S. J. Wells, L. S. Mansfield,
C. P. Fossler, A. M. Campbell, and A. M. Geiger-Zwald. 2006. Evaluation of
antimicrobial susceptibility patterns in Campylobacter spp isolated from dairy cattle and
farms managed organically and conventionally in the midwestern and northeastern
United States. Journal of the american veterinary medical association 228:1074-1081.
107
Hornish, R., T. Arnold, L. Baczynskyj, S. Chester, T. Cox, T. Flook, R. Janose, D.
Kloosterman, J. Nappier, and D. Reeves. 1992. Pirlimycin in the dairy cow: metabolism
and residue studies. in Proc. ACS symposium series.
Inaoka, T., K. Takahashi, M. Ohnishi-Kameyama, M. Yoshida, and K. Ochi. 2003.
Guanine nucleotides guanosine 5′-diphosphate 3′-diphosphate and GTP co-operatively
regulate the production of an antibiotic bacilysin in Bacillus subtilis. Journal of biological
chemistry 278:2169-2176.
Inglis, G., T. McAllister, H. Busz, L. Yanke, D. Morck, M. Olson, and R. Read. 2005.
Effects of subtherapeutic administration of antimicrobial agents to beef cattle on the
prevalence of antimicrobial resistance in Campylobacter jejuni and Campylobacter
hyointestinalis. Applied and environmental microbiology 71:3872-3881.
Jacob, M., J. Fox, S. Narayanan, J. Drouillard, D. Renter, and T. Nagaraja. 2008. Effects
of feeding wet corn distillers grains with solubles with or without monensin and tylosin
on the prevalence and antimicrobial susceptibilities of fecal foodborne pathogenic and
commensal bacteria in feedlot cattle. J anim sci 86:1182-1190.
Kintner, J., D. Lajoie, J. Hall, J. Whittimore, and R. V. Schoborg. 2014. Commonly
prescribed β-lactam antibiotics induce C. trachomatis persistence/stress in culture at
physiologically relevant concentrations. Frontiers in cellular and infection microbiology
4.
Lagacé-Wiens, P., A. Walkty, and J. A. Karlowsky. 2014. Ceftazidime–avibactam: an
evidence-based review of its pharmacology and potential use in the treatment of Gram-
negative bacterial infections. Core evidence 9:13.

108
Lowrance, T. C., G. H. Loneragan, D. J. Kunze, T. M. Platt, S. E. Ives, H. M. Scott, B.
Norby, A. Echeverry, and M. M. Brashears. 2007. Changes in antimicrobial susceptibility
in a population of Escherichia coli isolated from feedlot cattle administered ceftiofur
crystalline-free acid. American journal of veterinary research 68:501-507.
Maiques, E., C. Ubeda, S. Campoy, N. Salvador, I. Lasa, R. Novick, and J. Barbe. 2006.
Beta-lactam antibiotics induce the SOS response and horizontal transfer of virulence
factors in Staphylococcus aureus. J. Bacteriol 188:2726-2729.
Marti, R., A. Scott, Y.-C. Tien, R. Murray, L. Sabourin, Y. Zhang, and E. Topp. 2013.
Impact of manure fertilization on the abundance of antibiotic-resistant bacteria and
frequency of detection of antibiotic resistance genes in soil and on vegetables at harvest.
Applied and environmental microbiology 79:5701-5709.
McDermott, P. F., R. D. Walker, and D. G. White. 2003. Antimicrobials: modes of action
and mechanisms of resistance. International journal of toxicology 22:135-143.
Mirzaagha, P., M. Louie, R. Sharma, L. J. Yanke, E. Topp, and T. A. McAllister. 2011.
Distribution and characterization of ampicillin-and tetracycline-resistant Escherichia coli
from feedlot cattle fed subtherapeutic antimicrobials. BMC microbiology 11:78.
Neuhauser, M. M., R. A. Weinstein, R. Rydman, L. H. Danziger, G. Karam, and J. P.
Quinn. 2003. Antibiotic resistance among gram-negative bacilli in US intensive care
units: implications for fluoroquinolone use. Jama 289:885-888.
O'Brien, T. F. 2002. Emergence, spread, and environmental effect of antimicrobial
resistance: how use of an antimicrobial anywhere can increase resistance to any
antimicrobial anywhere else. Clinical infectious diseases 34:S78-S84.
109
Pérez-Cobas, A. E., M. J. Gosalbes, A. Friedrichs, H. Knecht, A. Artacho, K. Eismann,
W. Otto, D. Rojo, R. Bargiela, and M. von Bergen. 2013. Gut microbiota disturbance
during antibiotic therapy: a multi-omic approach. Gut 62:1591-1601.
Roberts, M. C. 2004. Resistance to macrolide, lincosamide, streptogramin, ketolide, and
oxazolidinone antibiotics. Molecular biotechnology 28:47-62.
Santamaría, J., L. López, and C. Y. Soto. 2011. Detection and diversity evaluation of
tetracycline resistance genes in grassland-based production systems in Colombia, South
America. Frontiers in microbiology 2.
Sarmah, A. K., M. T. Meyer, and A. Boxall. 2006. A global perspective on the use, sales,
exposure pathways, occurrence, fate and effects of veterinary antibiotics (VAs) in the
environment. Chemosphere 65:725-759.
Sato, K., P. C. Bartlett, and M. A. Saeed. 2005. Antimicrobial susceptibility of
Escherichia coli isolates from dairy farms using organic versus conventional production
methods. Journal of the american veterinary medical association 226:589-594.
Sauer, K., A. K. Camper, G. D. Ehrlich, J. W. Costerton, and D. G. Davies. 2002.
Pseudomonas aeruginosa displays multiple phenotypes during development as a biofilm.
Journal of bacteriology 184:1140-1154.
Schmieder, R., and R. Edwards. 2012. Insights into antibiotic resistance through
metagenomic approaches. Future microbiology 7:73-89.
Seiffert, S. N., M. Hilty, V. Perreten, and A. Endimiani. 2013. Extended-spectrum
cephalosporin-resistant gram-negative organisms in livestock: An emerging problem for
human health? Drug resistance updates.
110
Shi, P., S. Jia, X.-X. Zhang, T. Zhang, S. Cheng, and A. Li. 2013. Metagenomic insights
into chlorination effects on microbial antibiotic resistance in drinking water. Water
research 47:111-120.
Singer, R. S., S. K. Patterson, and R. L. Wallace. 2008. Effects of therapeutic ceftiofur
administration to dairy cattle on Escherichia coli dynamics in the intestinal tract. Applied
and environmental microbiology 74:6956-6962.
Sirohi, S. K., N. Singh, S. S. Dagar, and A. K. Puniya. 2012. Molecular tools for
deciphering the microbial community structure and diversity in rumen ecosystem. Appl
microbiol biotechnol 95:1135-1154.
Steffan, R., and R. Atlas. 1991. Polymerase chain reaction: applications in environmental
microbiology. Annual reviews in microbiology 45:137-161.
Suzuki, M. T., L. T. Taylor, and E. F. DeLong. 2000. Quantitative analysis of small-
subunit rRNA genes in mixed microbial populations via 5′-nuclease assays. Applied and
environmental microbiology 66:4605-4614.
Thames, C. H., A. Pruden, R. E. James, P. P. Ray, and K. F. Knowlton. 2012. Excretion
of antibiotic resistance genes by dairy calves fed milk replacers with varying doses of
antibiotics. Frontiers in microbiology 3.
Thomas, V. C., L. C. Kinkead, A. Janssen, C. R. Schaeffer, K. M. Woods, J. K. Lindgren,
J. M. Peaster, S. S. Chaudhari, M. Sadykov, and J. Jones. 2013. A dysfunctional
tricarboxylic acid cycle enhances fitness of Staphylococcus epidermidis during β-lactam
stress. MBio 4:e00437-00413.
Tragesser, L. A., T. E. Wittum, J. A. Funk, P. L. Winokur, and P. J. Rajala-Schultz. 2006.
Association between ceftiofur use and isolation of Escherichia coli with reduced
111
susceptibility to ceftriaxone from fecal samples of dairy cows. American journal of
veterinary research 67:1696-1700.
Uroz, S., P. Ioannidis, J. Lengelle, A. Cébron, E. Morin, M. Buée, and F. Martin. 2013.
Functional assays and metagenomic analyses reveals differences between the microbial
communities inhabiting the soil horizons of a Norway spruce plantation. PloS one
8:e55929.
Winokur, P., A. Brueggemann, D. DeSalvo, L. Hoffmann, M. Apley, E. Uhlenhopp, M.
Pfaller, and G. Doern. 2000. Animal and human multidrug-resistant, cephalosporin-
resistant Salmonella isolates expressing a plasmid-mediated CMY-2 AmpC β-lactamase.
Antimicrobial agents and chemotherapy 44:2777-2783.
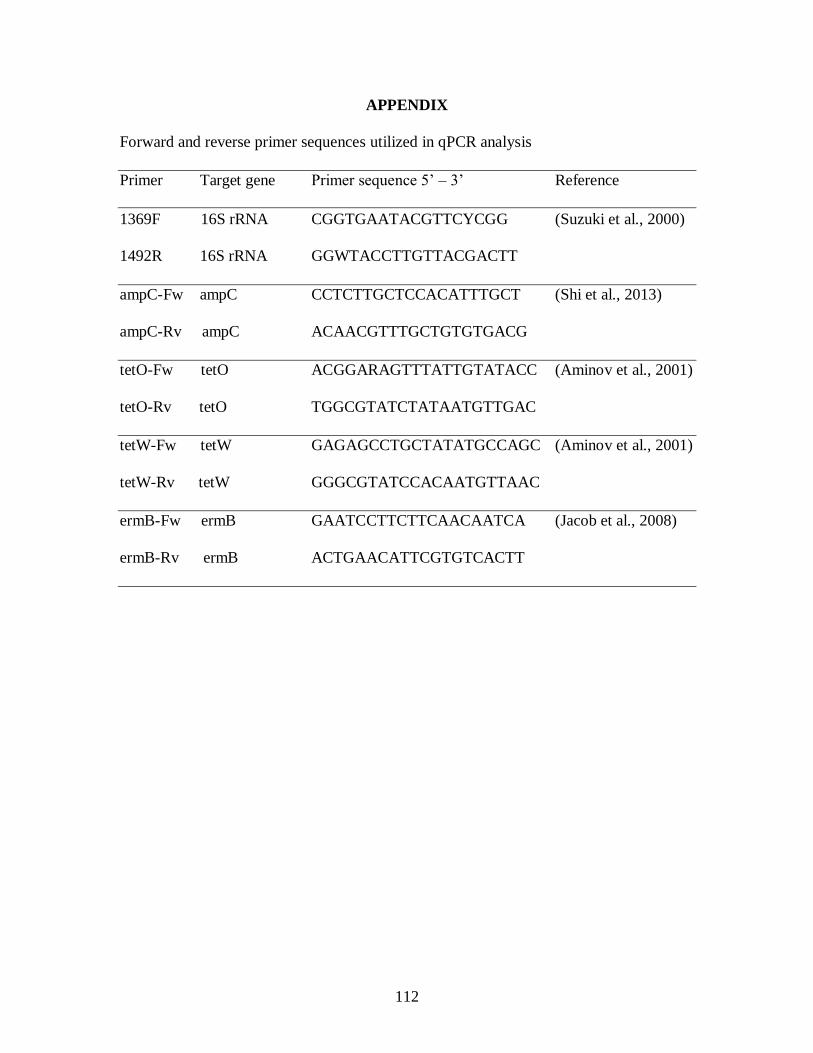
112
APPENDIX
Forward and reverse primer sequences utilized in qPCR analysis
Primer Target gene Primer sequence 5’ – 3’ Reference
1369F 16S rRNA CGGTGAATACGTTCYCGG (Suzuki et al., 2000)
1492R 16S rRNA GGWTACCTTGTTACGACTT
ampC-Fw ampC CCTCTTGCTCCACATTTGCT (Shi et al., 2013)
ampC-Rv ampC ACAACGTTTGCTGTGTGACG
tetO-Fw tetO ACGGARAGTTTATTGTATACC (Aminov et al., 2001)
tetO-Rv tetO TGGCGTATCTATAATGTTGAC
tetW-Fw tetW GAGAGCCTGCTATATGCCAGC (Aminov et al., 2001)
tetW-Rv tetW GGGCGTATCCACAATGTTAAC
ermB-Fw ermB GAATCCTTCTTCAACAATCA (Jacob et al., 2008)
ermB-Rv ermB ACTGAACATTCGTGTCACTT