Embed Size (px)
Citation preview

Metal Carbide & Oxide Nanoparticles:Discovering Stardust in the Lab
Michael A. Duncan, Jeffrey S. Pilgrim
Department of Chemistry, University of Georgia, Athens, GA 30602-2556
[email protected]://www.arches.uga.edu/~maduncan
Deniz van Heijnsbergen, Gert von Helden, Gerard MeijerFOM Institute for Plasma Physics – Rijnhuisen
Edisonbahn 14, NL3430 BE, Nieuwegein, The Netherlands
Air Force Office of Scientific Research

New Age of Infrared Astronomy:
Studies of molecules, ice & dust
ISOSpitzerHershelSOFIA
Laboratory measurements availablefor molecules.
More needed for ice & dust.
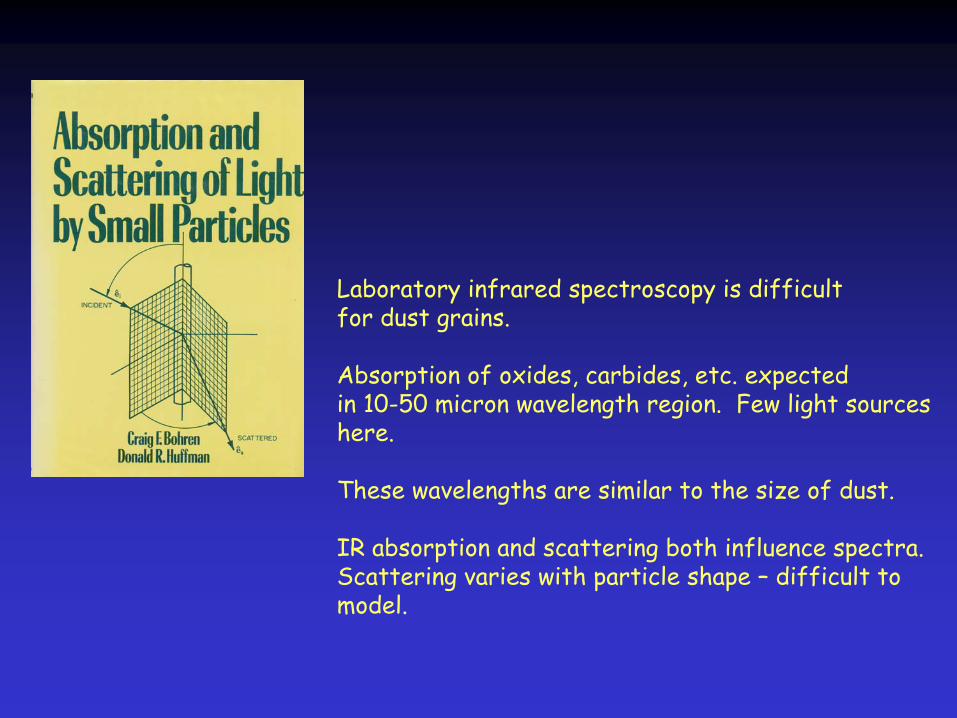
Laboratory infrared spectroscopy is difficultfor dust grains.
Absorption of oxides, carbides, etc. expectedin 10-50 micron wavelength region. Few light sourceshere.
These wavelengths are similar to the size of dust.
IR absorption and scattering both influence spectra.Scattering varies with particle shape –
difficult tomodel.

Nanoparticle Production by Laser VaporizationNanoparticle Detection by Mass Spectrometry
Scientific American, December 1989.
Our work:

A broad distributionof cluster sizes isusually produced...

Laser vaporization ofgraphite produced thefirst observation of C60in 1985. It was isolatedin 1991.
Smalley, Curl and Krotoreceived the Nobel Prizein Chemistry in 1996
C60
…
but sometimes there are “magic numbers”!

0 2 0 0 4 0 0 6 0 0 8 0 0 1 0 0 0 1 2 0 0
9,
22
8,19
7,17
6,16
5,12
4,11
3,7
2,8
1,1
Vx
Oy+
Direct Ions
Mass spectrum seen previously by Castleman and coworkers, J. Phys. Chem. A 103, 5671 (1999).
Similar distributionsSeen for Nb/O and Ta/O
No single magic numbers;Limited range of stoichiometries.
Oxide particles:

Production of clusters bylaser vaporization.
Mass spectra via photoionizationor direct ion sampling.
Fixed frequency photodissociationto probe stability.
Tunable infrared photodissociationto probe spectroscopy.

5 0 1 0 0 1 5 0 2 0 0 2 5 0
2 ,4
1 ,2
V2
O6+
355 nm
Photodissociation ofmetal oxide clusters
0 200 400 600 800
V7O17+
3,7355 nm
Magic numbers only becomeapparent in dissociation!
2/4, 3/7, 4/9, 7/17 seenfor V, Nb, Ta oxides.
K. S. Molek, T. D. Jaeger and M. A. Duncan,J. Chem. Phys. 123, 144313 (2005).
0 100 200 300 400 500 600 700 800 900 1000 1100 1200
mass (amu)
11,1
5
10,1
4
Fe+
4,5
9,128,117,106,85,
7
3,3
2,2
FenO
m
+
10,2
5
11,2
7
12,2
9
5,13
6,14
7,17
8,19
9,22
4,10
3,8
2,8
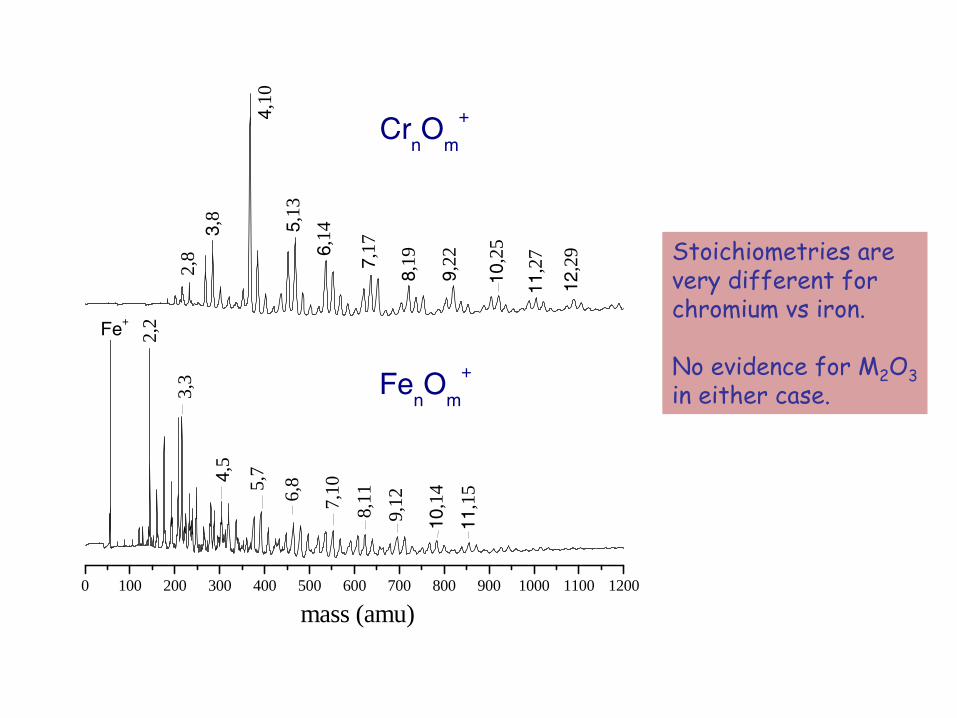
CrnO
m
+
Stoichiometries arevery different forchromium vs iron.
No evidence for M2
O3in either case.

100 200 300 400 500 600 700 800
2,4
4,9
4,10
4,10
3,7
3,7
mass (amu)
3,7
2,4 5,12
Cr8O19+
Cr8O20+
2,4
Cr8O21+
100 200 300 400 500 600 700 800 900 1000
6,15
5,12
Cr10O25+
mass (amu)
2,4
3,7
Cr10O26+
2,47,176,14
4,10
4,103,6
Chromium:Formation of 4/10 as an ion and elimination of it as a neutral!
Molek, Reed, Ricks, Duncan,J. Phys. Chem. A 111, 8080 (2007).
Cr4
O10
- Cr4
O10
- Cr4
O10
- Cr4
O10

100 200 300 400
Fe+ 2,2 3,3
Fe5O8+
Fe5O7+
mass (amu)
Fe5O5+
Fe+2,2 3,3 4,4
Fe+2,2 3,3
5,6
5,5
4,4
4,4
Iron:1:1 stoichiometry prominentat all cluster sizes.
6/6
5/5 8/6
7/95/54/42/2
8/86/65/5
4/4
4/43/3
3/3
3/3
2/2
Fe9O10+
Fe9O9+
Fe9O8+
2/2
100 200 300 400 500 600 700
mass (amu)
J. Phys. Chem. A 112, 9238 (2008) .
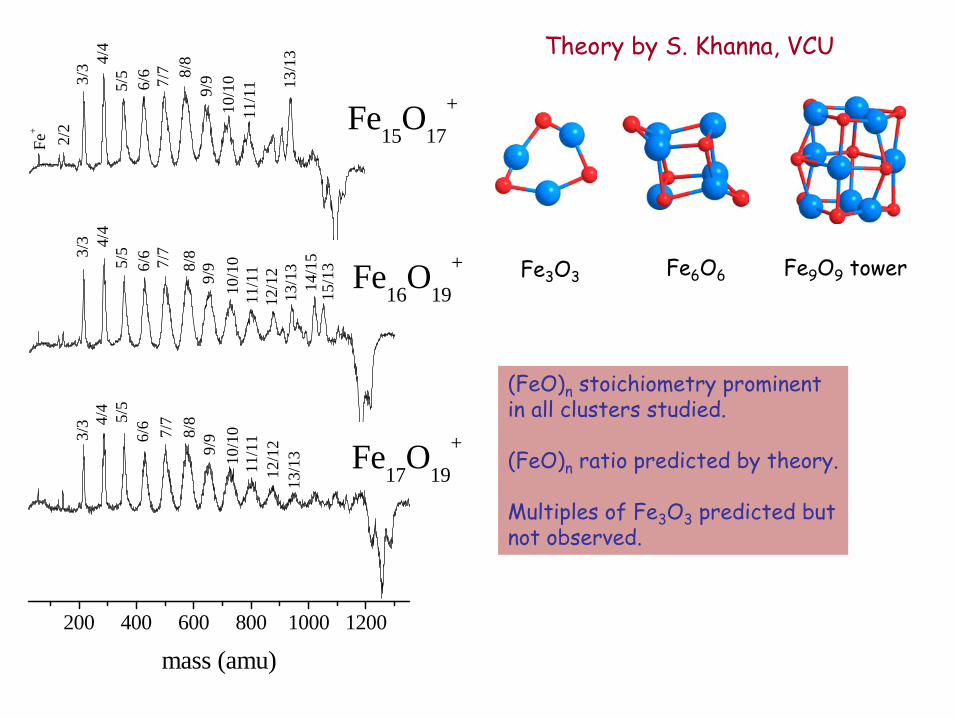
200 400 600 800 1000 1200
Fe15O17+
Fe16O19+
Fe17O19+
mass (amu)
3/3
13/1
312
/12
11/1
110
/10
9/98/
87/
76/
65/5
4/4
11/1
1
3/3
10/1
09/
98/87/7
6/65/54/
4
2/2
Fe+
3/3
10/1
09/
98/8
7/7
6/6
5/5
4/4
13/1
312
/12
15/1
314
/15
11/1
1
13/1
3 Fe3
O3 Fe6
O6 Fe9
O9
tower
Theory by S. Khanna, VCU
(FeO)n
stoichiometry prominentin all clusters studied.
(FeO)n
ratio predicted by theory.
Multiples of Fe3
O3
predicted butnot observed.

TM Oxides
Stable stoichiometries not generally the same as themost-common bulk phases.
DFT is able to identify reasonable geometriesfor structures identified experimentally.
DFT indicates per atom bond energies (3-5 eV),But relative
energetics of different clusters are highlyproblematic:
Per-atom bond energies for “stable”
clustersare no better than those for unstable!(instead, they vary randomly)
Spectroscopy is needed to identify/confirm structures.

Magic numbers are also seen for metal carbide clusters.Castleman and coworkers, Science 255, 1411 (1992).
The same magicnumber was seenFor V, Zr, Hf

Larger metal carbides!
J.S. Pilgrim and M.A. Duncan,J. Am. Chem. Soc. 115,9724 (1993).
A mass peak is also observedwith a stoichiometry of 14 metalatoms and 13 carbon atoms. Itis not possible to make a simplesymmetric cage with 27 atoms.
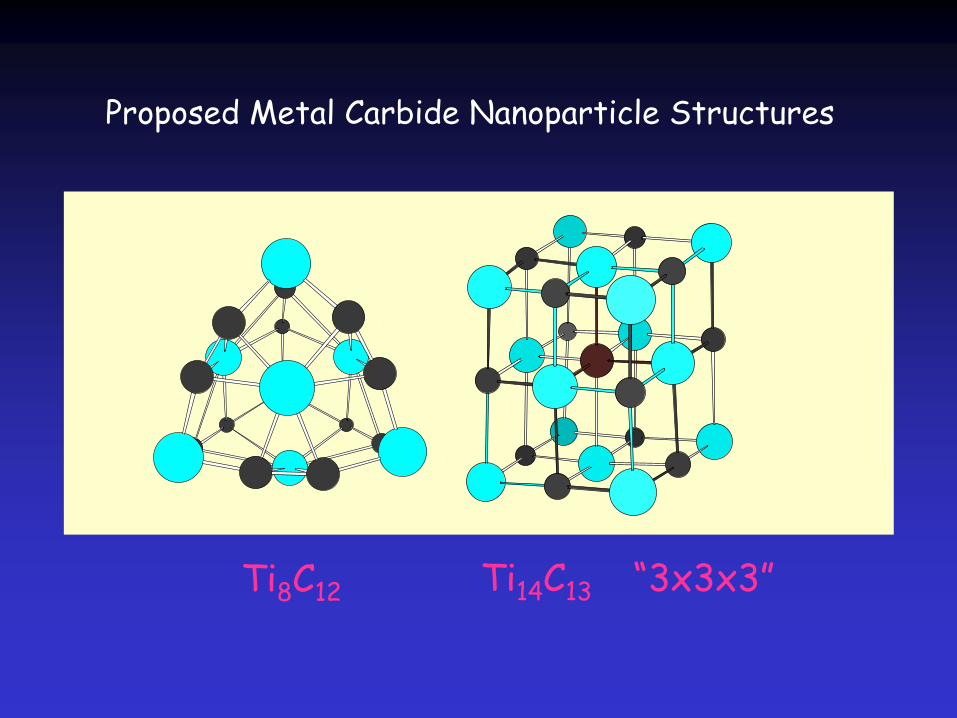
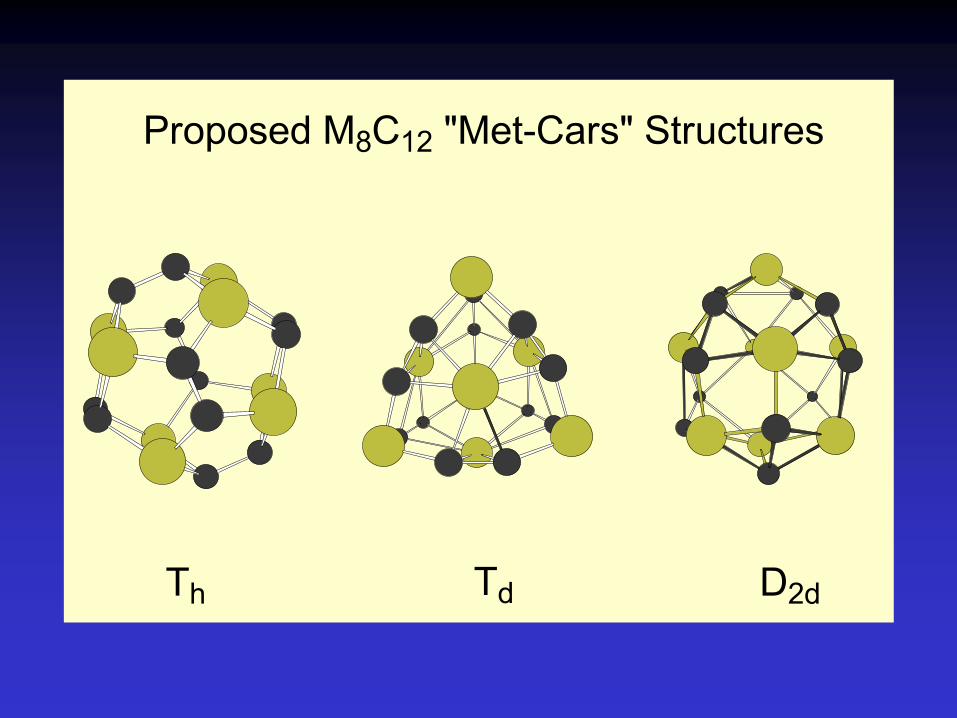
Proposed Metal Carbide Nanoparticle Structures
Ti8
C12 Ti14
C13 “3x3x3”

J.S. Pilgrim and M.A. Duncan, J. Am. Chem. Soc. 115, 6958 (1993).
Other metals produce the 8/12clusters, but not the 14/13 ones.

Metal Cluster Spectroscopy
* low sample density→
106-108
cm-3
per size: absorption spectroscopy not possible!*
distribution of cluster sizes→
need size selection and identification*
large clusters -high density of states→
continuous UV-VIS absorption*
low frequency vibrations→
far-infrared vibrational spectra
“Normal”
spectroscopy techniques don’t work for metal clusters,especially in the gas phase!.
-
New Technique -*
IR-REMPI vibrational spectroscopy
-
Problems -

Tuning Range: 40 to 2000 cm-1
Rep Rate: 10 HzPulse Energy: 50 mJ/pulse
FELIXFFree ree EElectron lectron LLaser for aser for IInfrared nfrared eXperimentseXperiments
FOM Institute for Plasma Physics RijnhuisenNieuwegein, The Netherlands (near Utrecht)

FELIX

Thermionic Emission in Clusters
Some clusters have strong bonds and network structures.Multiple bonds must be broken to cause fragmentation.Dissociation energies are high.
D0
= 12-15 eV for C60
Ionization potentials of large clusters are relatively low,and they decrease with cluster size.
D0
IP
Mx-1
+ M
Mx+
+ e-Ionization is lower energythan dissociation.
Heating a cluster leads toelectron emission, i.e., ionization!
IP(C60
) = 7.5 eVIP(Ti8
C12
) = 4.5 eV

Thermionic Emission
n(hυ)
e-
As the cluster is heated with many photons, it boils off anelectron, leaving behind the positive ion, which we detect.
+
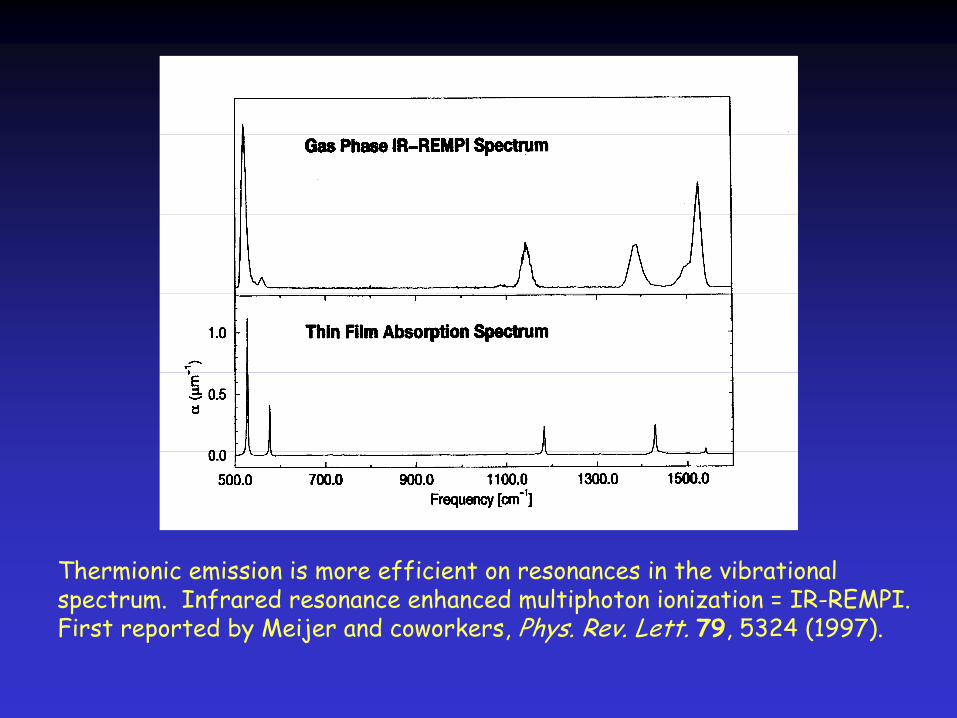
Thermionic emission is more efficient on resonances in the vibrationalspectrum. Infrared resonance enhanced multiphoton ionization = IR-REMPI.First reported by Meijer and coworkers, Phys. Rev. Lett. 79, 5324 (1997).

einzel lens
deflection plates
FELIX photoionization laser6.0-25 microns (400-1700 cm-1)
reflectrongrid assembly
draw-out grid
repeller plate
Nd:YAG vaporization laser532 nm
pulsed nozzlelaser vaporizationcluster source
ion rejectionplates
mcp detector
IR-REMPI Spectroscopyof Gas Phase Metal Clusters

Infrared Multiphoton Ionization Of Metal Carbide Clusters

D. van Heijnsbergen, G. vonHelden, M.A. Duncan, A.J.A.van Roij and G. MeijerPhys. Rev. Lett. 83, 4983 (1999).
IR-REMPI VibrationalSpectroscopy!

All M8
C12
species havea strong vibrationalband near 1300-1400 cm-1
associated with C-C stretch.
However, the best agreementwith theory is not
for the Tdstructure predicted to have thelowest energy. The bestagreement is for the D2d
structure.

The 27-atom nanocrystalhas a vibrational spectrumlike that of the solid TiCsurface phonons!

Higher masses correspond to Ti/C nanocrystals!
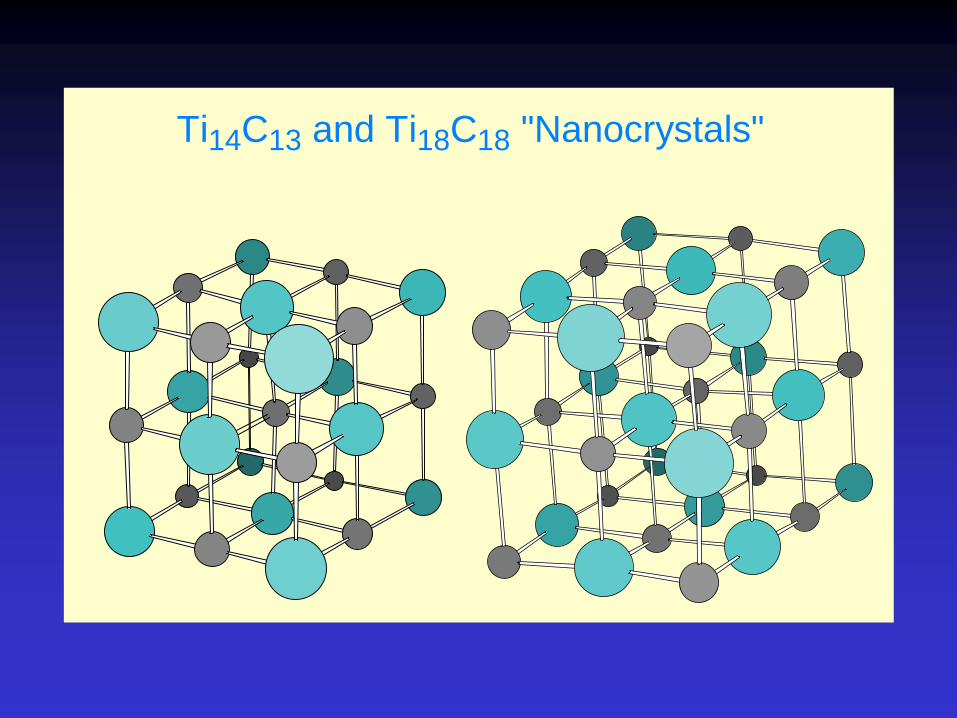
Ti14C13 and Ti18C18 "Nanocrystals"

3x4x4
200 400 600 800 1000 1200cm-1
3x3x3
200 400 600 800 1000 1200cm-1
4x4x4
200 400 600 800 1000 1200cm-1
5x5x5
200 400 600 800 1000 1200cm-1
IR-REMPI of Titanium Carbide Nanocrystals
“This looks like the 21 micron line…”
Xander
Tielens
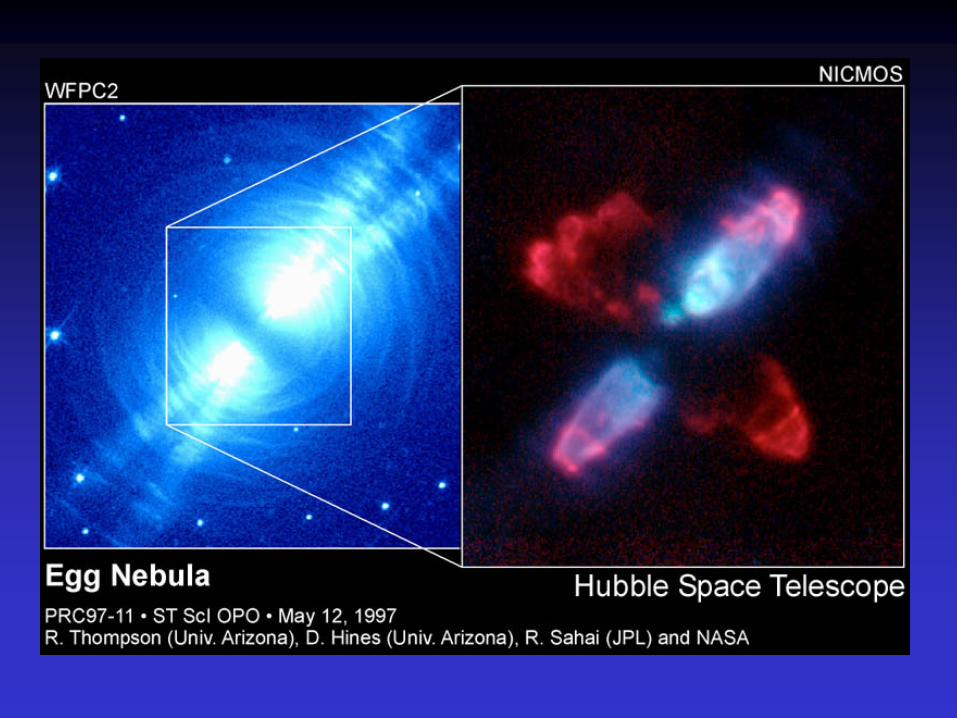

The 21 micron lineSeen in carbon-rich stars.

Titanium Carbide Nanocrystals in Space!
* The peak in the spectrum of SAO 96709, taken by the ISOsatellite, occurs at the same position as the IR-REMPI peakof TiC nanocrystals.
* Calculations of titanium density indicate that assignmentof this emission feature to TiC is reasonable.
Assignment of the “21 micron line”
Science 288, 313 (2000).
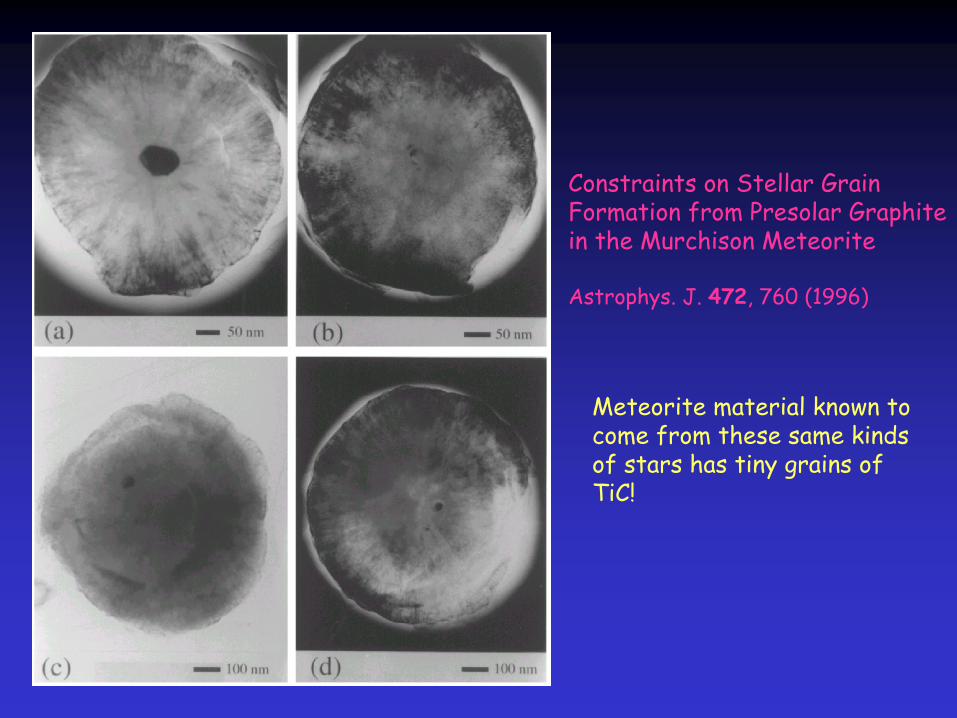
Constraints on Stellar GrainFormation from Presolar
Graphitein the Murchison Meteorite
Astrophys. J. 472, 760 (1996)
Meteorite material known tocome from these same kindsof stars has tiny grains ofTiC!

Oxide-stars haveunassigned bands at 11and 13 microns.
Proposals suggest thatdust is composed ofoxides of silicon, aluminumiron, magnesium, etc.

Magnesium oxide (100) surface
Far-IR reflectance:
640 cm-1
longitudinal phonon401 cm-1
transverse phonon
EELS:
80.6 meV (650 cm-1)


Strong band convergesto position of bulklongitudinal phonon.
Weaker band does notconverge to transversephonon.
Similar recent studiesfor aluminum and titaniumoxides. These ~match bulkspectra, but not stellar spectra.
J. Chem. Phys. 116, 2400 (2002)
Al2
O3
:Phys. Chem. Chem. Phys. 5, 2515 (2003).
TiO2
:J. Phys. Chem. A 107, 1671 (2003).

Conclusions
Infrared induced thermionic emission is efficient in metalcarbide and oxide clusters.
Thermionic emission is strongly enhanced on vibrationalresonances, making it possible to do IR-REMPI spectroscopy.
M8
C12
and M14
C13
metal carbide clusters have different, but understandable infrared spectra. The structure of the 8/12species is still in question, but the 14/13 is a cubic nanocrystalwith a spectrum like the bulk surface phonons.
TiC
nanocrystals explain the previously unidentified 21 micronline in post-AGB stars.
Several oxides now studied, but no matches with oxide stars.
IR-REMPI is a new versatile technique for cluster vibrationalspectroscopy.