Embed Size (px)
Citation preview

METALLOMICS IN IN VITRO TOXICOLOGY RESEARCH
TESI DOCTORAL
Massimo FARINA
Any 2008

FACULTAT DE BIOCIÈNCIES
DEPARTAMENT DE GENÈTICA I DE MICROBIOLOGIA
Director: Ricard MARCOS DAUDER Tutor: Enrico SABBIONI Autor: Massimo FARINA
BELLATERRA, Octubre 2008

This work has been carried out at the Joint Research
Centre (JRC), via E. Fermi, 2749, Ispra, Varese, Italy.
European Commission, Institute for Health and
Consumer Protection (IHCP), European Centre for the
Validation of Alternative Methods Unit (ECVAM),
(Head of Unit Prof. Thomas Hartung).

ACKNOWLEDGEMENTS
I WOULD LIKE TO THANK
Prof. Ricard Marcos for his essential support and for the help he gave me concerning the training at the Universitat Autònoma de Barcelona and Prof. Amadeu Creus for his availability during such training. Prof. Thomas Hartung for the possibility he gave me to carry on the laboratory work. I’m very grateful to Prof. Enrico Sabbioni for his teaching, for the fundamental and unique scientific guide and the pleasure to work with him during this period. Stefano Bosisio, Francesca Broggi, Riccardo Del Torchio, Salvador Fortaner, Patrick Marmorato, Barbara Munaro, Jessica Ponti, Claire Thomas and Giorgio Tettamanti for the fundamental help during the work, friendship and because it is a pleasure for me to work with them every day. Dr. Agnieszka Kinsner and Dr. Erwin Van Vliet for their help concerning the brain aggregates and isolated cells. Last but not least: Uno speciale ringraziamento va a Chiara e a tutta la mia famiglia per il loro affetto ed incondizionato supporto.

I
INDEX INTRODUCTION 1
LITERATURE SURVEY 3
Metallomics and trace element speciation 3
Balb/3T3 cell line 4 PC12 cell line 6
Re-aggregating brain cell cultures 7 Carcinogenicity of metal compounds 8
Neurotoxicity of metal compounds 10
OBJECTIVES 12
MATERIALS AND METHODS 15
1. Chemicals 15 2. Radiochemicals 17 3. Analytical techniques 21
3.1 Neutron Activation Analysis (NAA) 21
3.2 Counting of the radioactivity 22 3.2.1 Low resolution integral γ-counting 22
3.2.2 Computer-based high resolution γ ray spectrometry 23 3.2.3 Computer-based β spectrometry 24
3.3 Inductively Coupled Plasma Mass Spectrometry (ICPMS) 24 3.4 Graphite Furnace Atomic Absorption Spectrometry (GFAAS) 25
3.5 Nuclear Magnetic Resonance (NMR) 25 4. Biochemical techniques 26
4.1 Chromatographic techniques for speciation analysis 26 4.1.1 Tam’s method (TAM) and solvent extraction 26
4.1.2 Sabbioni’s method 27 4.1.3 Minoia’s method 28
4.1.4 HPLC 29

II
4.1.5 Gel filtration 30
4.2 Differential ultracentrifugation 32 4.3 NucleoSpin for the isolation of DNA 33
4.4 Ultrafiltration 33 5. Biological systems 34
5.1 Balb/3T3 cell line and culturing 34 5.2 PC12 cell line and culturing 36
5.3 Brain re–aggregating and culturing 38 5.4 Isolation and culture of primary neurons, astrocytes and microglia 39
6. Studies on Balb/3T3 cell line 44 6.1 Basal cytotoxicity 44
6.2 Concurrent cytotoxicity (CFE) and Morphological Transformation Assay
45
6.3 Behaviour in culture medium 47 6.4 Uptake 47
6.5 Intracellular distribution 48 6.6 Distribution of elements among cytosol components 48
6.7 Binding of metals to DNA 49 6.8 Binding to DNA and cross linking of Cd 50
6.9 Biomethylation of As(III), As(V) and AsF 50 6.10 NCG, cellular protein, DNA and RNA after exposure to As(III) 50
6.11 Oxidation state of Cr and V in the cytosol 51 6.12 Induction of Cd-BP by Cd 51
6.13 Reactive oxygen species (ROS) induced by Cd 51 6.14 Lipid peroxidation by Cd 52
6.15 Inhibition of DNA synthesis by Cd 53 6.16 Determination of glutathione induced by Cd 53
7. Studies on Mn in PC12 cell line 54 7.1 Cell viability by MTT assay 55
7.2 Behaviour in culture medium 56 7.3 Uptake 56
7.4 Intracellular distribution 57 7.5 Expression of catecholamine
57

III
8. Studies on As in aggregating brain cell cultures and isolated brain cells (neurons, microglia and astrocytes)
57
8.1 Uptake of As by Brain aggregates 57
8.2 Uptake of As by neurons, astrocytes and microglia cells 58 8.2 Biomethylation studies 58
RESULTS 59
9. Elemental analysis of salts, culture media and cells 59 10. Studies on Balb/3T3 cell line 62
10.1 Arsenic 62 10.1.1 Cytoxicity assay (CFE) 62
10.1.2 Morphological transformation assay 64 10.1.3 Behaviour in culture medium 67
10.1.4 Uptake 68 10.1.5 Intracellular distribution and binding to biomolecules 71
10.1.6 Biomethylation 72 10.1.7 Effect of As(III) on NCG, protein and nucleic acid 74
10.1.8 Binding of As(III) to DNA 76 10.2 Cadmium 78
10.2.1 Cytoxicity assay (CFE) 78 10.2.2 Morphological transformation assay 80
10.2.3 Uptake 82 10.2.4 Intracellular distribution 83
10.2.5 Distribution among cellular components 84 10.2.6 Induction of Cd-BP 86
10.2.7 Binding to DNA and aminoacids cross-links 90 10.2.8 Reactive oxygen species (ROS) 92
10.2.9 Lipid peroxidation 93 10.2.10 Inhibition of DNA synthesis 93
10.2.11 Determination of glutathione 94 10.3 Chromium 95
10.3.1 Cytotoxicity assay (CFE) 95 10.3.2 Morphological transformation assay 96
10.3.3 Behavior of Cr(VI) in cell-free or cell-containing culture medium
96

IV
10.3.4 Uptake 97
10.3.5 Intracellular distribution 99 10.3.6 Oxidation state of Cr in the cytosol 102
10.3.7 Binding of Cr to DNA 102 10.4 Platinum 105
10.4.1 Cytotoxicity assay (CFE) 105 10.4.2 Behaviour in culture medium 106
10.4.3 Uptake 109 10.4.4 Intracellular distribution and binding to biomolecules 110
10.5 Vanadium 114 10.5.1 Cytotoxicity assay (CFE) 114
10.5.2. Morphological transformation assay 115 10.5.3 Behaviour of V in culture medium 115
10.5.4 Uptake 117 10.5.5 Intracellular distribution and binding to biomolecules 119
10.5.6 Oxidation state of V in the cytosol 121 10.5.7 Binding of V to DNA 122
11. Studies on PC12 cell line 124 11.1 Manganese 124
11.1.1 Cell viability (MTT) 124 11.1.2 Behaviour in culture medium 125
11.1.3 Uptake 127 11.1.4 Intracellular distribution 130
11.1.5 Reactive oxygen species (ROS) 134 12. Studies on rat brain aggregates 135
12.1 Brain aggregates 135 12.2 Isolated cells of brain aggregates 136
DISCUSSION 138
Carcinogenic potential of As, Cd, Cr, Pt and V compounds 139
Check of chemicals purity of metals compounds to be tested in cell transformation assay
139
Arsenic 139 Cadmium 143

V
Chromium 153 Platinum 155 Vanadium 156
Neurotoxic effects of As and Mn compounds 158 Arsenic 158 Manganese 159
CONCLUSIONS 164
BIBLIOGRAPHY 165

Introduction
1
INTRODUCTION This work has been carried out in the context of a research programme of the
European Centre for the Validation of Alternative Methods (ECVAM) of JRC-Ispra.
The aim of ECVAM is to promote and coordinate the scientific and regulatory
acceptance of alternative methods, which are of importance to the biosciences, and
which reduce, refine and replace (3Rs) the use of laboratory animals in toxicity
testing required by law (Hartung et al., 2004).
In particular, the research executed is a part of the ECVAM key area “omics” aiming
at identifying metabolites and biomarkers of toxicity of chemicals by using in vitro
cell cultures as models of carcinogenicity, reproductive toxicity, toxicokinetics and
systemic toxicity (Hartung et al., 2003). The experimental studies here reported are
referred to “metallomics” (Szpunar, 2004), a scientific area related to biometals
requiring versatile measurement tools that allow for trace detection, identification
and measurement of covalent bound metals in proteins or metal-protein complexes.
In this context, the aim of this work is to give a mechanistic insight of: (i)
cytotoxicity and carcinogenic potential induced in in vitro systems by different As,
Cd, Cr, Pt and V chemical species which are relevant from environmental and
occupational health point of view, (ii) neurotoxic effects induced by As species in
brain re-aggregates and their individual cell type constituent and by Mn species in
PC12 cells.
Usually, in vitro studies by cell cultures are mainly focussed on
biochemical/toxicological aspects establishing relation between a biological response
(end-point) induced by exposure to xenobiotics and dose exposure, while metabolic
pathways (uptake, intracellular distribution, binding to biomolecules and speciation)

Introduction
2
are much less considered. This is also due to the severe experimental difficulties
concerning the detection and quantification of xenobiotic and its metabolites, into
cells and culture medium, almost at ng-pg level. These analytical difficulties can be
overcome only by using sophisticated and advanced analytical techniques (Sabbioni
and Balls, 1995).
Furthermore, since bioavailability and toxicity of the elements depend also on their
chemical form, adequate analytical methods for separation of proteins and
measurement of metallo-proteins are required for speciation analysis (Suzuki, 2005).
Since major topics in metallomics research includes the study of the distribution of
the elements into cells and the chemical speciation of the elements in the biological
systems the availability of advanced analytical techniques is of paramount
importance.
In our work, peculiar analytical techniques such as nuclear, radioanalytical and
advanced spectrochemical techniques have been used in combination with
biochemical techniques of protein separation for speciation analysis of different
chemical forms of As, Cd, Cr, Pt and V in mouse fibroblasts Balb/3T3 cell line (in
vitro model for testing the carcinogenic potential of chemicals); of Mn in rat
pheochromocytoma cells of the adrenal gland PC12 cell line, of As in and rat brain
re-aggregates (in vitro models of neurotoxicity).

Literature survey
3
LITERATURE SURVEY Hereafter few bibliographic data related to the subjects of the present work are
reported. They include few essential on metallomics and speciation studies; the in
vitro models of carcinogenic potential and neurotoxicity, and the carcinogenicity of
metal compounds.
Metallomics and trace element speciation
Metal ions are utilised by fundamental cellular processes. In this context,
transcription, translation, proper assimilation and incorporation of the necessary
metal to function are regulated by the organism. Thus, the chemistry of a cell needs
to be characterized not only by its characteristic genome in the nucleus, in protein
context (proteome) but also by the distribution of the metals and metalloids among
the different species and cell compartments (metallome). Therefore, in analogy with
genome and proteome, metallome can be defined as “the entirety of metal and
metalloids species within a cell (or tissue) type”. In this context, Haraguchi
(Haraguchi, 2004) suggested the term “metallomics” as a new scentific field in
symbiosis with genomics and proteomics, because synthesis and metabolic function
of genes (DNA and RNA) and proteins cannot be performed without the aid of
various metal ions and metalloenzymes. The metallomic information will comprise
the identity of individual metal species and their concentrations. As such,
metallomics, referred to cellular biochemistry, can be considered as a subset of
speciation analysis understood as the identification and/or quantitation of elemental
species (speciation of an element is defined as “distribution of an element among
defined chemical species in a system”) (Templeton et al., 2000).
Literature survey
4
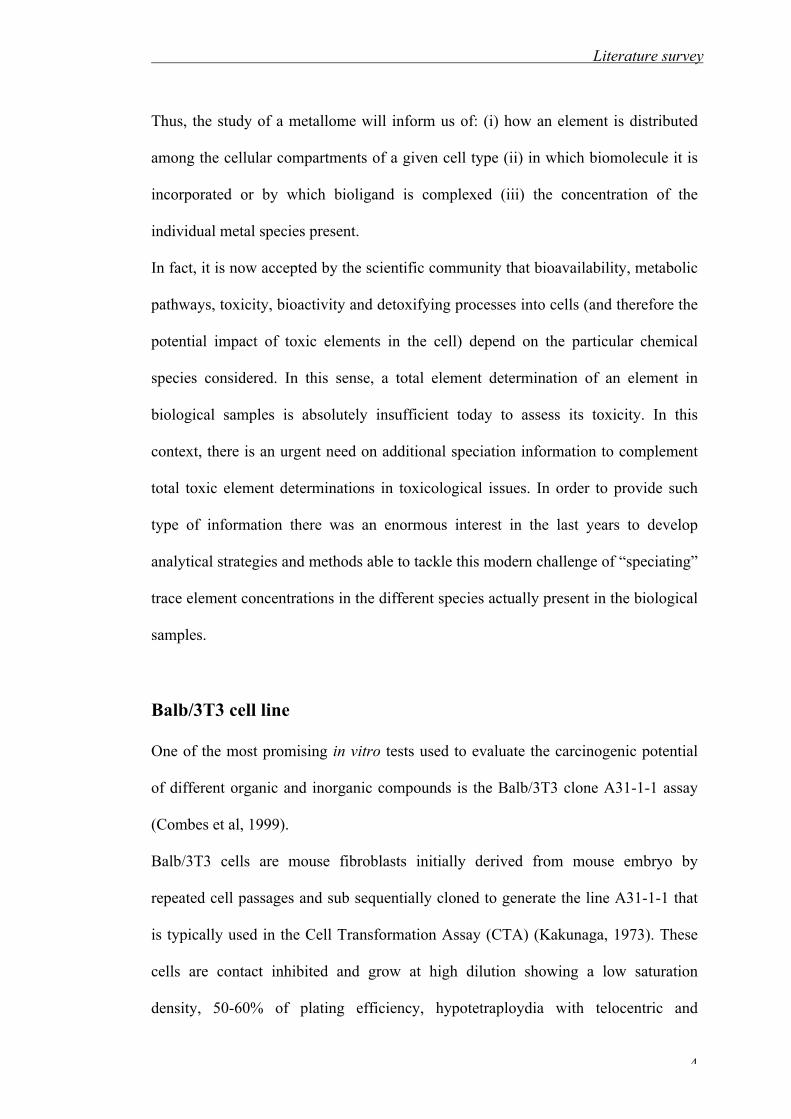
Thus, the study of a metallome will inform us of: (i) how an element is distributed
among the cellular compartments of a given cell type (ii) in which biomolecule it is
incorporated or by which bioligand is complexed (iii) the concentration of the
individual metal species present.
In fact, it is now accepted by the scientific community that bioavailability, metabolic
pathways, toxicity, bioactivity and detoxifying processes into cells (and therefore the
potential impact of toxic elements in the cell) depend on the particular chemical
species considered. In this sense, a total element determination of an element in
biological samples is absolutely insufficient today to assess its toxicity. In this
context, there is an urgent need on additional speciation information to complement
total toxic element determinations in toxicological issues. In order to provide such
type of information there was an enormous interest in the last years to develop
analytical strategies and methods able to tackle this modern challenge of “speciating”
trace element concentrations in the different species actually present in the biological
samples.
Balb/3T3 cell line
One of the most promising in vitro tests used to evaluate the carcinogenic potential
of different organic and inorganic compounds is the Balb/3T3 clone A31-1-1 assay
(Combes et al, 1999).
Balb/3T3 cells are mouse fibroblasts initially derived from mouse embryo by
repeated cell passages and sub sequentially cloned to generate the line A31-1-1 that
is typically used in the Cell Transformation Assay (CTA) (Kakunaga, 1973). These
cells are contact inhibited and grow at high dilution showing a low saturation
density, 50-60% of plating efficiency, hypotetraploydia with telocentric and
Literature survey
5
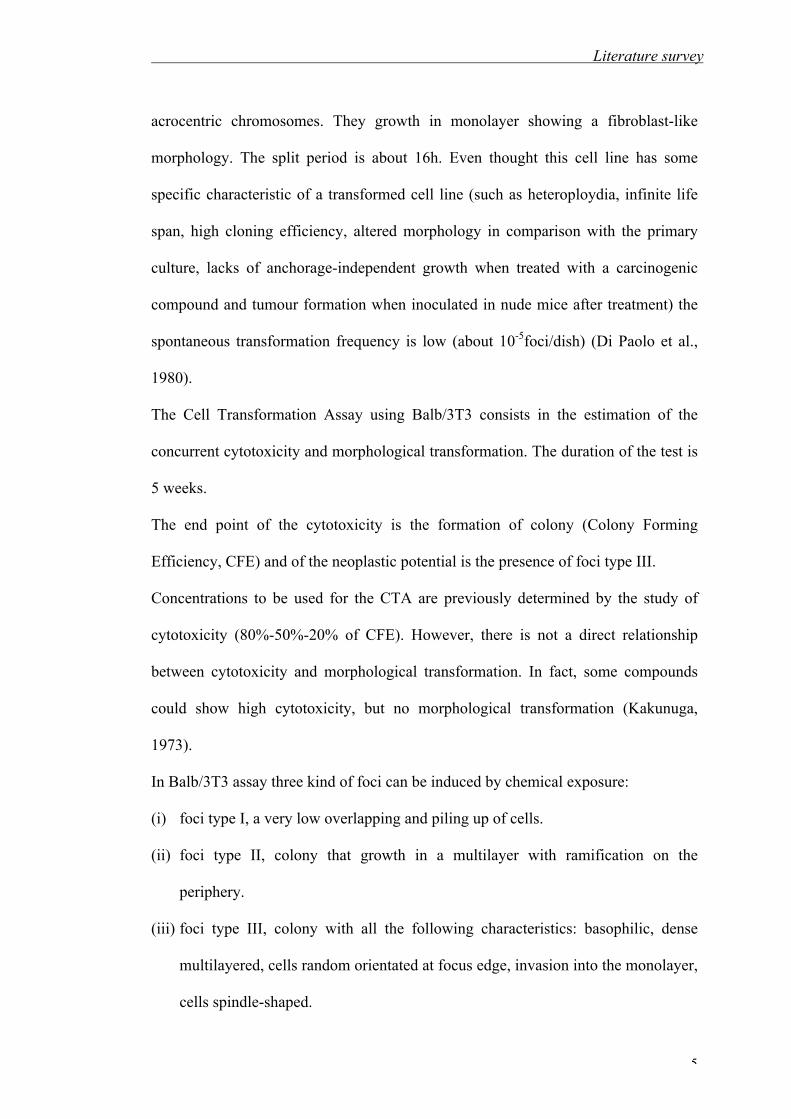
acrocentric chromosomes. They growth in monolayer showing a fibroblast-like
morphology. The split period is about 16h. Even thought this cell line has some
specific characteristic of a transformed cell line (such as heteroploydia, infinite life
span, high cloning efficiency, altered morphology in comparison with the primary
culture, lacks of anchorage-independent growth when treated with a carcinogenic
compound and tumour formation when inoculated in nude mice after treatment) the
spontaneous transformation frequency is low (about 10-5foci/dish) (Di Paolo et al.,
1980).
The Cell Transformation Assay using Balb/3T3 consists in the estimation of the
concurrent cytotoxicity and morphological transformation. The duration of the test is
5 weeks.
The end point of the cytotoxicity is the formation of colony (Colony Forming
Efficiency, CFE) and of the neoplastic potential is the presence of foci type III.
Concentrations to be used for the CTA are previously determined by the study of
cytotoxicity (80%-50%-20% of CFE). However, there is not a direct relationship
between cytotoxicity and morphological transformation. In fact, some compounds
could show high cytotoxicity, but no morphological transformation (Kakunuga,
1973).
In Balb/3T3 assay three kind of foci can be induced by chemical exposure:
(i) foci type I, a very low overlapping and piling up of cells.
(ii) foci type II, colony that growth in a multilayer with ramification on the
periphery.
(iii) foci type III, colony with all the following characteristics: basophilic, dense
multilayered, cells random orientated at focus edge, invasion into the monolayer,
cells spindle-shaped.

Literature survey
6
Only foci type III are considered tumorogenic because it is demonstrated that only
they induce neoplastic transformation in nude mice with a frequency of 85%
(Saffiotti et al., 1984; IARC/INCI/EPA, 1985).
PC12 cell line
The PC12 clonal cell line was developed from rat pheochromocytoma cells of the
adrenal gland (Greene and Tischler, 1976). Clonal cell lines which express neuronal
properties are useful model system for studying the neurons systems at the single cell
and molecular level (Greene and Tischler, 1976). PC12 cells stimulated by nerve
growth factor (NGF) and reduced serum content in the medium differentiate to
acquire properties similar to mature sympathetic neurons (Teng et al., 1998).
Differentiated PC12 cells are useful for neurotoxicity testing as they have a number
of neuronal characteristics, e.g. electrical excitability, polypeptide expression and
neurotransmitter receptors (Greene, 1995). The neurotransmitters secreted PC12 cells
are dopamine, noradrenaline and Ach (Greene and Tischler, 1976; Leist et al., 1995).
By monitoring dopamine metabolism in rat phaeochromocytoma derived PC12 cell
cultures during extened treatment with manganese chloride, functional changes
occurring in a dopaminergic system during the development of manganese induced
damage (Vescovi et al., 1991). The literature describes dopamine alterations in
relation with manganese (Stredrick et al., 2004). In PC12 cells, manganese induces
complete disappearance of extracellular (free) but not intracellular (vesicles stored)
dopamine and its metabolites (Vescovi et al., 1991).

Literature survey
7
Re-aggregating brain cell cultures
Aggregating brain cells cultures (model for in vitro neurotoxcity) are primary, three
dimensional cell cultures. The re-aggregated cells are able to migrate within the
former structures, and to interact with each other by direct cell-cell contact, as well
as through exchange of nutritional and signaling factors. This tissue-specific
environment enables aggregating neural cells to differentiate, and to develop
specialized structures (e.g. synapses, myelinated axons) resembling those of brain
tissue in situ. Aggregating cell cultures are therefore classified as organotypic
cultures.
The complexity of in vitro neurotoxicity models inversely correlates with the ease of
obtaining and maintaining cells and tissues in cultures.
Primary rat-derived neuronal cell cultures, astrocyte primary cultures and
oligidendrocytes cultures are the most widely used and extensively characterised, for
this mixed primary cultures have been used by a number of investigators for studying
receptor-mediated mechanisms.
Some models, such as re-aggregating brain cell cultures from different species, are
reported to cover the effects of different cell types and different maturation stages
(Honneger and Monnet-Tschudi, 2001). In three-dimensional models, including
aggregate cell and brain tissue slice cultures, the interaction of neurons and glia in
affecting some types of neurotoxicity end-points are shown for a variety of
compounds (Eskes et al., 2002). A benefit of using re-aggregate cultures is that the
nervous system cytoarchitecture circuitry and other biochemical processes (e.g.
myelination, synaptogenesis) are preserved (Honeger and Matthieu, 1985).
Furthermore, the system can be used to detect both acute, chronic and delayed
neurotoxic effects in either mature or immature state of the cells (Zurich et al., 2002).

Literature survey
8
This system can also detect both microglia and astroglial activation which are early
markers of neurotoxicity (Monnet-Tschudi et al., 1997). Since primary derived
material is currently used, new approaches employing human stem cell derived
neuronal and glial cells might overcome this issue in the future
Carcinogenicity of metal compounds
Human exposure to metals is common, with wide use in industry and long-term
environmental persistence. Historically, the heaviest metal exposures occurred in the
workplace or in environmental settings in close proximity to industrial sources.
Among the general population, exposure to a number of metals is widespread but
generally at substantially lower levels than have been found in industry.
The existence of relationship between cancer and metals is widely aknowledge by
oncologists.
Different agencies, utilising both epidemiological and experimental animal data,
classify a compound as carcinogenic if there is an evidence of its potential in humans
(International Agency for Research on Cancer, IARC) or place different emphases on
the results of animal and genotoxicity studies (U.S. environmental Protection
Agency, EPA; Chemical Manufactures Association; European Community). Thus,
for assessing human risk from exposure to a compound, several factors are
considered to provide a concern in regard to a potential for the induction of human
cancer from exposure. Many of these factors are based on the pharmacokinetic and
pathological response similarities between humans and the surrogate test species.
Table A summarises the IARC classification of metal compounds according to
evidence of carcinogenic effects IARC (IARC, 1990).

Literature survey
9
Table A. IARC classification of metal compounds IARC classification
Compound Group Evidence
Aluminiuma Arsenica Berylliuma Cadmiuma
Chromiuma Irona Nickela
1. Carcinogenic
Sufficientb in human
Cisplatinum 2A. Probably carcinogenic Limitedc in human, sufficient in animal
Antymony trioxide
Cobalta
Limited in human
Leada
Methylmercury
Inadequated in human
Metallic nickel
2B. Possible carcinogenic
Sufficient in human
Manganesea Antimony trisulfoxide Organoleada Metallic mercury Inorganic mercurya Seleniuma Titanium dioxide
3. Not carcinogenic
-
- 4. Probably not carcinogenic Inadequate in human and in animal
a: element and its compounds b: there is a causal relationship between the agent or agents and human cancer c: there is a credible causal interpretation, but alternative explanations such as chance, bias and confounding variables could not completely be excluded d: one or three conditions prevailed:
there are few pertinent data the available studies, while showing evidence of association, don’t exclude change, bias or confounding
variables studies are available, but they don’t show evidence of carcinogenicity.
Among the metal compounds considered in our work, only V is not included in the
IARC list. Moreover, Pt in the list concerns only cis-Pt.
For comprehensive reviews on health, toxic and carcinogenic effects of the metals
considered in the present work see: WHO-224, 2001 and Styblo et al., 2002 (As),
O’Brien et al., 2004 (Cr), Ravindra et al., 2004 (Pt) and WHO-29, 2001 (V).

Literature survey
10
Neurotoxicity of metal compounds
Metals are inextricably bound to many aspects of modern life. While some are
biologically essentials (e.g. Cu,Se,Zn), others are not and are considered toxic (e.g.
Cd, Hg and Pb). Among toxic metals, several have a primary target action on the
nervous system. These groups of metals are referred as neurotoxic metals. The most
noticeable neurotoxic metals are Al, As, Cd, Hg, Mn and Pb together with
organometals such as methylmercury, alkyl leads, trimethyltin and triethyltin which
are known as potent neurotoxicants. The damage by most neurotoxic metals is
unlikely to be solely ascribed to generation of excessive reactive oxygen species
(ROS).The toxicity of each metal is distinctive and involves a characteristic range of
morphological and biochemical abnormalities. Catalysis of generation of ROS may
represent a final common path induced by metal-containing chemicals. Table B
groups metals by classes believed to involve mechanisms underlying their prooxidant
potential.
Table B. Neurotoxic metals according their potential for inducing oxidative events
Different oxidation state
Sulfhydryl affinity Excitation by mimicking calcium Unknown
Cu As Pb Al Fe Cd Sn Mn Hg V Tl
In our work attention has been paid to manganese. There is increasing evidence for
the role of oxidative stress in Parkinson Disease. In this context, catecholaminergic
pathways seem particularly susceptible to metal-catalysed oxidative damage. This is
especially true of dopamine auto-oxidation, and such a mechanism may be related to
“manganism” (Donaldson et al, 1991).Injury to the catecholamine neurons seems

Literature survey
11
caused by the free radicals and quinones formed as a result of Mn-catalysed auto-
oxidatio of dopamine. (Stredrick et al, 2004).
Manganese is transition metal that can exist in different oxidation states, the most
common in biological systems being +2 and +3, +4. Therefore, metallomics is of
particular interest in the study of metabolic patterns and toxicity of this element in
biological systems.

Objectives
12
OBJECTIVES An emerging area of bioinorganic analysis of the distribution of metals and
metalloids among different species concern metallomics and cell compartments,
metallome.
The objectives of this study are linked to metallomics. In particular, the experimental
work of this thesis are:
• to complete previous investigations related to the setting of a database of the
carcinogenic potential of metal compounds in mouse fibroblasts Balb/3T3 cell line.
In particular, the metallomics study here carried out represents the 4th step of a
research that involves: the determination of basal cytotoxicity at fixed-dose
exposure; the setting of dose-effect relationship in order to establish the IC50 values
and suitable ranges of exposure dose to be used in the final morphological
transformation assay; the identification of metal compounds inducing neoplastic
morphological transformation (Mazzotti, 2001).
• to start a research on metabolic pathways and biotransformation of inorganic
As(III) and Mn(II) and Mn(VII) in whole rat brain re-aggregates, individual cell type
constituents of such aggregates (microglia, neurons and astrocytes) or rat
pheochromocytoma cells of the adrenal gland PC12.
Figures A, B and C outline the experiments carried out and the objectives of the
present experimental work.

Objectives
13
Figure A. Objectives of the present research on Balb/3T3 cell line.
Induction of MT
Cd
Reactive Oxygen
Species (ROS)
Cd
Lipid peroxidation
Cd
Inhibition of DNA
synthesis Cd
Mouse fibroblasts Balb/3T3 cell line
Basal cytotoxicity
Cytotoxicity and
morphological transformation
Uptake
Behaviour in culture
medium
Intracellular distribution
Binding to cellular
components
Binding to DNA
Oxidation state
Oxidation state
Effect on protein and
DNA
Biomethylation
As, Cd, Cr, Pt, V
As, Cd, Cr, V
As, Cr, Pt, V As, Cd, Cr, Pt, V
As, Cd, Cr, Pt, V Cr, Pt, V
As, Cr, V As, Cd, Cr, V
As
As
As, Cd, Cr, V
NMR analysis of
culture medium
Pt
NMR analysis of
cellular lysate
Pt
Exposure to inorganic As, Cd, Cd, Pt and V compounds

Objectives
14
Figure B. Objectives of the present research on PC12 cell line. Figure C. Objectives of the present research on whole rat brain re-aggregates and their individual cell type constituents.t
Uptake
Vitality
Rat brain re-aggregates and isolated cell components
Brain re-aggregates
Isolated cells
As As
Uptake
Biomethylation
Exposure to inorganic As(III)
Exposure to inorganic Mn compounds
Rat pheochromocytoma PC12 cell line
Cell viability
Uptake
Intracellular distribution
Mn Mn Mn
Behaviour in culture
medium
Mn
Reactive Oxigen
Species (ROS)
Mn
Binding to cellular
components
Mn

Materials and Methods
15
MATERIALS AND METHODS
1. Chemicals
All chemicals used were of the highest analytical purity available.
Sodium(meta)arsenite(III) (NaAsO2, CAS 7784-46-5, hereafter named As(III)) and
sodiumarsenate(V)dibasic heptahydrate (Na2HAsO4·7H2O, CAS 10048-95-0,
hereafter named As(V)) were supplied by Sigma Aldrich (Milan, Italy); sodium
hexafluoroarsenate(V) (NaAsF6, CAS 12005-86-6, hereafter named AsF) was
supplied by Alfa Aesar (Cologno Monzese, Milan, Italy); tetraphenylarsonium(V)
chloride ((C6H5)4AsCl, CAS 507-28-8, hereafter named Ph4As) and
triphenylarsine(III) ((C6H5)3As, CAS 603-32-7, hereafter named Ph3As) were
supplied by Sigma Aldrich (Milan, Italy); tetramethylarsenic iodide ((CH3)4AsI, CAS
5814-20-0, hereafter named TMAI), arsenocholine ([(CH3)AsCH2CH2OH)]+Br-,
CAS 39895-81-3, hereafter named AsCh), arsenobetaine ([(CH3)AsCH2COOH]+Br-),
CAS 64436-13-1, hereafter named Asβ), trimethylarsine oxide ((CH3)3AsO, CAS
4964-14-1, hereafter named TMAO), methylarsonic(V)acid (CH3AsO(OH)2, CAS
124-58-3, hereafter named MMA(V)) and dimethylarsinic(V)acid ((CH3)2AsO(OH),
CAS 76-60-5, hereafter named DMA(V)) were supplied by Trichemical Laboratory
(Osaka-fu, Japan); monomethyl arsenic(III) (CH3As(OH)2, was a gift of Prof. Styblo
M., (Triangle Park, North Carolina University, USA). It was prepared according to
Cullen synthesis (Cullen et al., 1984, hereafter named MMA(III)),.
Cadmium chloride(II)bihydrated (CdCl2·2H2O, CAS 654054-66-7, hereafter named
Cd(II)) was supplied by Sigma Aldrich (Milan, Italy).

Materials and Methods
16
Sodium chromate(VI)tetrahydrate (Na2CrO4·4H2O, CAS 10034-82-9, hereafter
named Cr(VI)) and chromium(III)chloride hexahydrate (CrCl3·6H2O, CAS 10025-
73-7, hereafter named Cr(III)) were supplied by Alfa Aesar (Cologno Monzese,
Milan, Italy).
Manganese chloride(II)hydrated (MnCl2·4H2O, CAS 73913-06-1, hereafter named
Mn(II)) was supplied by Sigma Aldrich (Milan, Italy), potassium permanganate(VII)
(KMnO4, CAS 7722-64-1, hereafter named MnO4-) was supplied by Alfa Aesar
(Cologno Monzese, Milan, Italy).
Sodium hexachloroplatinate(IV) (Na2PtCl6, CAS 16919-58-7), sodium
tetrachloroplatinate(II) (Na2PtCl4, CAS 13820-41-2), platinum(IV)chloride (PtCl4,
CAS 13454-96-1), platinum(II)dichloride (PtCl2, CAS 10025-65-7) were supplied by
Sigma Aldrich (Milan, Italy).
Sodium metavanadate(V) (NaVO3, CAS 13718-26-8, hereafter named V(V)) and
vanadium(IV)oxide sulfate pentahydrate (VOSO4⋅5H2O, CAS 123334-20-3,
hereafter named V(IV)) were supplied by Sigma Aldrich (Milan, Italy).
Buthioine sulfoximine (C8H18N2O3S, CAS 83730-53-4, hereafter named BSO),
diethylmaleate (C2H5OCOCH=CHCOOC2H5, CAS 141-05-9, hereafter named
DEM) and 2’-7’ dichlorofluorescein diacetate (C24H14Cl2O7, CAS 2044-85-1,
hereafter named DCFH-DA) were supplied by Sigma Aldrich (Milan, Italy).

Materials and Methods
17
2. Radiochemicals
In this work the following radiotracers of high specific radioactivity were used:
(i) 73As, purchased by Los Alamos National Laboratory (Los Alamos, USA).
(ii) 51Cr, purchased by Amersham, Perkin Elmer Life Sciences (Boston, USA).
(iii) 109Cd, purchased by Amersham, Perkin Elmer Life Sciences (Boston, USA).
(iv) 54Mn, purchased by Amersham, Perkin Elmer Life Sciences (Boston, USA).
(v) 52Mn, produced at the JRC-Cyclotron by (p, xn) nuclear reaction on metallic Cr
foil (Bonardi, private communication).
(vi) 56Mn, produced by (n, γ) reaction of Mn(CH3COO)2 at the Triga Mark II
reactor of the Radiochemical and Activation Analysis Center of the Pavia
University (Fortaner, private communication).
(vii) 191Pt, produced at the JRC-Cyclotron by (α, n) nuclear reaction on metallic Os
powder (Birattari et al., 2001).
(viii) 48V, produced at the JRC-Cyclotron by (α, n) nuclear reaction on metallic Sc
foil (Sabbioni et al., 1989).
(ix) 14C-aminoacids cocktail, purchased by Amersham, Perkin Elmer Life Sciences
(Boston, USA).
(x) 35S-cysteine, purchased Amersham, Perkin Elmer Life Sciences (Boston,
USA).
(xi) 3H-thymidine (3H-TdR), purchased Amersham, Perkin Elmer Life Sciences
(Boston, USA).
The characteristics of the radioisotopes are summarized in Table 1. They were used
for the labelling of As, Cd, Cr, Mn, Pt and V compounds at different concentrations
ranging from 0.01 to 1000µM. For this purpose, aliquots of radiotracers were added

Materials and Methods
18
to the corresponding aqueous solutions containing appropriate amounts of the non
radioactive stable compound in the same chemical form. Before the use, such
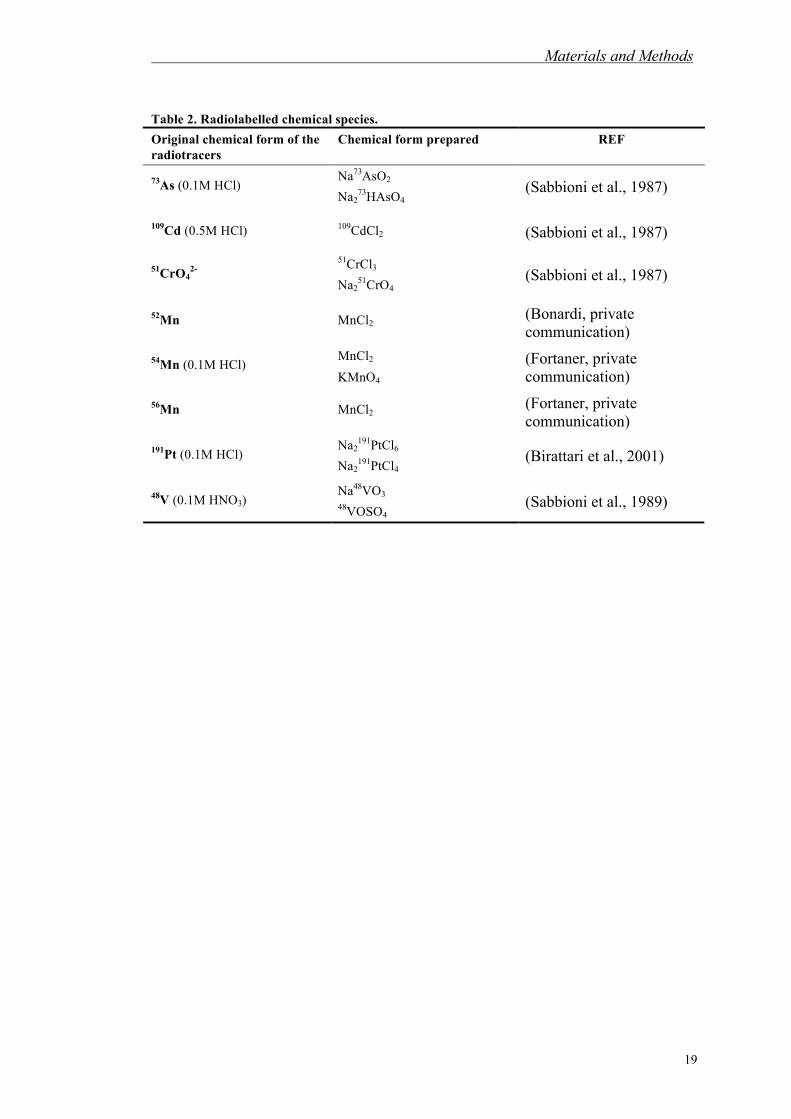
solutions were equilibrated at room temperature for 15min. Table 2 reports the
radiolabelled final chemical forms of the compounds used in the present work which
were prepared and tested for the chemical form as previously described.
Table 1. Radiochemical characteristics of the radiotracers. Characteristic
Isotopes Specific radioactivity
(mCi/µg)
Radiochemical purity
(%)
Radioactive concentration
(mCi/mL)
Mode of decay
Half life (T1/2) (days)
Principal γ or β ray emitted
(KeV)
Inorganic radiochemicals 73As (0.1M HCl) 1.6 >99.5 2.2 ECa 80.3 53.4 109Cd (0.5M HCl) 0.0034 99.8 22 ECa 462.6 22 - 88 51Cr (Saline solution) 0.45 99 5 ECa 27.7 320 52Mn (0.1M HCl) 0.031 >98 0.6 ECa 5.6 744 – 935
- 1434 54Mn (0.1M HCl) 51 99.9 2.3 ECa 312.3 834.9 56Mn (0.1M HCl) 15 >99 40 ECa 0.11 847 - 1811
- 2120 191Pt (0.1M HCl) 4.6 >99.9 0.4 β- 3 96 - 624 48V (0.1M HNO3) 1 >99.8 0.5 ECa, β- 16.1 983 - 1311
Organic radiochemicals [14C] Amoniacidsb 50mCi/Matom Carbon 0.1 β- 5730years 0-156.4 [1-35S] Cysteineb 1075Ci/mmol >95 0.01 β- 87.4 0-166.8
[3H] Thymidineb 6.7Ci/mmol >97 1 β- 12.43years 0-18.6
a: EC = Electron Capture b: aqueous solution
Materials and Methods
19
Table 2. Radiolabelled chemical species. Original chemical form of the radiotracers
Chemical form prepared REF
Na73AsO2 73As (0.1M HCl) Na2
73HAsO4 (Sabbioni et al., 1987)
109Cd (0.5M HCl) 109CdCl2 (Sabbioni et al., 1987) 51CrCl3 51CrO4
2- Na2
51CrO4 (Sabbioni et al., 1987)
52Mn MnCl2 (Bonardi, private communication)
MnCl2 54Mn (0.1M HCl)
KMnO4 (Fortaner, private communication)
56Mn MnCl2 (Fortaner, private communication)
Na2191PtCl6 191Pt (0.1M HCl)
Na2191PtCl4
(Birattari et al., 2001)
Na48VO3 48V (0.1M HNO3) 48VOSO4 (Sabbioni et al., 1989)

Materials and Methods
20
Hereafter are reported the γ-ray spectra regarding the radioisotopes used in this work.
Figure 1. γ-spectra of 73+74As, 51Cr, 109Cd, 52Mn, 54Mn, 56Mn, 191Pt and 48V.

Materials and Methods
21
3. Analytical techniques
The following analytical nuclear and spectrochemical techniques were used: Neutron
Activation Analysis (NAA), Inductively Coupled Plasma Mass Spectrometry
(ICPMS) and Graphite Furnace Atomic Absorption (GFAAS).
3.1 Neutron Activation Analysis (NAA)
In this work NAA has been used to determine: (i) the element impurities in salts to
which cells have been exposed, (ii) the background level in culture medium and in
unexposed cells, (iii) to study the uptake of AsF and organic As compounds by
Balb/3T3 cells.
NAA is a high specific and very sensitive multielemental and absolute nuclear
technique widely used in biological sciences for the analysis of trace elements in the
range of mg-ng (Sabbioni, 1978). Due to the peculiar characteristics of this nuclear
technique we shortly report here its basic principle. It is based on the radioactive
isotope generation by neutron interaction with stable isotopes. These isotopes are
detected and measured by γ-spectrometry. The most common nuclear reaction used
is (n,γ) reaction:
where X is the stable isotope bombarded by neutron n; is the resulting
radioisotope in highly excited state; A and Z are the mass and atomic number; γ is a
prompt radiation (decay times in the order of 10-12 - 10-15s) which has no practical
use.
β/γdecay
Materials and Methods
22
The highly excited radioisotope decay to sable state by β- and γ emission. This latter
radiation is used for the detection and measurements of the element. In spite, NAA is
an absolute technique (it should be possible to determine the quantity of the element
simply using nuclear constant), for practical purpose a comparative method based on
the irradiation of a standard with well know element concentration under the same
experimental conditions is used:
where: Ast= standard radioacivity
Ac= sample radioactivity
mst= standard mass
mx= sample mass
After neutron activation, standards and samples were directly counted for their γ-rays
(Instrumental NAA) or submitted to radiochemical separation to eliminate strong
interfering radionuclides such as 24Na, 82Br and 32P (Radiochemical NAA) (Pietra et
al., 1986).
3.2 Counting of the radioactivity
Hereafter are reported the counting systems used for the determination of the γ-ray
emission from single radiotracers or neutron irradiated samples.
3.2.1 Low resolution integral γ-counting
This technique has been employed in the experiments when individual radiotracers
were used.
In this case, the radioactivity was counted using an automatic integral γ-counter
Wizard Wallac 1480 3” (Perkin Elmer-Wallac, Sweden) equipped with NaI(Tl)

Materials and Methods
23
crystal (3”x3.5”). The integral γ-counting was acquired using appropriate acquisition
software.
3.2.2 Computer-based high resolution γ ray spectrometry
Such counting has been used to detect the γ rays from neutron irradiated salts, culture
media and cells.
The radioactivity measurement has been carried out by means of a system involving
a γ-spectrometer equipped with a high purity germanium crystal (Ge) detector,
photomultiplier, amplificator, multichannel analyzer and autosampler (Figure 2). The
acquisition and analysis of the spectra has been carried out by specific software
(Nuclear Elements Digital Analysis, NEDA, Ascom, Milano).
Figure 2. γ-spectrometry system with Ge crystal and autosampler.
The measures of the radioisotopes are expressed in counts for minute (cpm). At any
time such measurements have been interpreted in terms of concentration of the
corresponding element for comparison with standard solutions of the radioisotopes of
well known specific radioactivity.

Materials and Methods
24
3.2.3 Computer-based β spectrometry
The β emitters 3H, 14C and 35S radioisotopes were measured by Liquid Scintillation
Counting using a Wallac 1414 WinSpectral Liquid Scintillation Counter
(PerkinElmer Life Sciences, Finland).
0.2mL liquid sample (i.e.chromatographic fractions from gel filtration or from
NucleoSpin for the isolation of DNA) was diluted at 0.5mL with ultrapure water and
mixed with 1.5mL of the commercial scintillation mixture (Flo-ScintII, PerkinElmer,
USA). The quenching effect was compensate by the instrument using 152Eu internal
standard.
In samples with double label (109Cd and 35S-cysteine, 109Cd and 14C-aminoacid
cocktail) all measured were corrected for the contribution due to the 109Cd
radioactivity.
Additionally, the fractions of interest were pooled and wet-ashed in a Teflon bomb
and the 35S or 14C radioactivity was measured following selective radiochemical
separation of 35S or 14C from 109Cd by cation exchange resin AG 50-x8 (0.7x3cm
column) (Sabbioni and Marafante, 1975).
3.3 Inductively Coupled Plasma Mass Spectrometry (ICPMS)
This advanced spectrochemical technique has been used to complement the analysis
carried out by NAA of salts, culture medium and cells.
The instrument used was an ICPMS SCIEX ELAN DRC II (Perkin Elmer, Turhill,
Ontario, Canada) equipped with a Dynamic Reaction Cell (DRC) able to eliminate
the interferences. The gas for the instrument were Argon 99.99% (Air Liquide) and
anhydrous NH3 99.99% (Sigma Aldrich, Milan, Italy) (for the DRC). The
determinations have been executed in HNO3 2-3%. Before the instrumental analysis,

Materials and Methods
25
samples have been mineralized in microwave oven (CEM-MSD 2000) with HNO3
50% (Farina, 2003). The aim was to have homogeneous solution. In order to correct
the matrix effect due to the different source of the samples and standards in the
analysis of the biological samples (DMEM and products for cellular cultivations) the
internal standard method was used. The internal standards (In, Rh and Re) were
added to samples, blank and standards at concentrations of 1-5 ppb (Farina, 2003).
3.4 Graphite Furnace Atomic Absorption Spectrometry (GFAAS)
Atomic Absorpion Spectrometry is an analytical technique widely used in
toxicological studies. It was used in combination with ICPMS and NAA (Minoia et.
al., 1992). The instrument used was a SIMAA 6000 (Perkin Elmer, Monza, Italy)
equipped with a graphite furnace and Zeeman longitudinal effect for the interference
correction. Lamps used were hallow cathode lamps type HCL or EDL, depending on
specific element to be analysed (Perkin Elmer, Monza, Italy). The protocols and
analysis conditions was those made by Perkin Elmer.
3.5 Nuclear Magnetic Resonance (NMR)
This technique was used to study the interaction of manganese and platinum
compounds with culture medium components and Na2PtCl6 with cellular lysate in
the within of a contract study named “In vitro cellular biotransformation and
interaction of metal compounds”. The instrument used was a NMR Bruker Avance
6000 (Bruker BioSpin S.r.l., Milano, Italy), operating with magnetic field of 14.1T
(600.13MHz). The instrument was located and the analyses were performed at the
Dipartimento di Genetica, Biologia e Biochimica, Sezione Biologia, Turin University
(Italy).

Materials and Methods
26
The analyses were conducted on culture medium or cellular lysate after addition of
and 50µL of D2O (necessary to obtain the field frequency lock) to 550µL of sample.
4. Biochemical techniques
The biochemical techniques used for speciation analysis included ion exchange
chromatography, high-pressure liquid chromatography, gel filtration differential
centrifugation, NucleoSpin and ultrafiltration.
4.1 Chromatographic techniques for speciation analysis
Hereafter are shown several chromatographic techniques used for the speciation
analysis of As, Cd, Cr, Mn, Pt and V compounds in culture medium and cellular
cytosol fraction.
4.1.1 Tam’s method (TAM) and solvent extraction
This method was used to study the 73As(III) and 73As(V) biomethylation in Balb/3T3
cells involving the determination of As metabolites in cytosol and culture medium in
Balb/3T3 cells and in brain aggregates exposed to both inorganic arsenic species. The
biomethylated arsenic metabolites were separated by an ion exchange resin AG 50-X4
(Tam et al, 1978) (Figure 3). The 73As(III) and 73As(V) in eluate were separated by
solvent extraction with diethylditiocarbamate (DTTC) in chloroform.

Materials and Methods
27
Figure 3. Tam's method and solvent extraction procedures for speciation of As in Balb/3T3 cells or rat brain aggregates exposed to 73As inorganic species. DTTC: diethyldithiocarbamate.
4.1.2 Sabbioni’s method
This method was used in the study of Balb/3T3 cells exposed to 48V(V) or 48V(IV),
which allowed the determination of the oxidation state of V in the cytosol of the cell
and in culture medium. The method was based on the use of Chelex 100 resin
(0.8x4.0cm, BioRad) (Figure 4). After equilibration of the resin with 10mM
CH3COOH, pH=5.0, sample was absorbed on the column (0.8x4.0cm). V(IV) was
retained on the resin and eluted by 0.1M NaOH. V(V) was recovered in the eluate.

Materials and Methods
28
The method was developed and validated in combination with EPR technique
(Sabbioni, unpublished) that is able to distinguish between V(IV) and V(V).
Figure 4. Method of speciation of V in Balb/3T3 cells exposed to 48V(V) and 48V(IV) species.
4.1.3 Minoia’s method
This method, based on solvent extraction and the use of liquid anion exchanger resin
Amberlite LA1 (Minoia et al., 1983) was used for the study oxidation states of Cr in
51Cr-containing cytosol of Balb/3T3 at the end of exposure to 51Cr(III) or 51Cr(VI).
The Cr(VI) was extracted in the organic phase while Cr(III) was recovered in the
aqueous phase (Figure 5).

Materials and Methods
29
Figure 5. Method of speciation of Cr in Balb/3T3 cells exposed to 51Cr(III) or 51Cr(VI).
4.1.4 HPLC
This technique, coupled with ICPMS as detector (Section 3.3), was used for the on-
line study of As and Pt speciation in culture medium (DMEM). The instrument used
was a SERIES 200 (Perkin Elmer, Monza, Italy). Two different columns and
conditions were used:
(i) arsenic species were separated by using an anionic exchange resin HAMILTON
PRP-X100 (25cm x 4.1mm, resin size=10µm) under the following conditions:
eluent A=NH4H2PO4 (0.25mM) - pH=9.0 - 2%MeOH; eluent B= NH4H2PO4
(20mM) - pH=8.8 - 2%MeOH. The eluents were degased with helium at 0.7psi
(Table 3).
(ii) platinum species were separated by using a TEKNOKROMA NUCLEOSIL
100-CN resin (25cm x 4.0mm, resin size=5µm) and the following conditions:
eluent A= NaNO3 50mM; eluent B= CH3COOH 10 mM; eluent C= H2O MilliQ.
The eluents were degased with helium at 0.7psi (Table 4).
Liquid Anion Exchanger (Amberlite LA1) 6MHCl
Methyl Isobutyl Ketone
51Cr(VI)
51Cr(III)
Step1 = Organic Extraction
Step2 = Centrifugation
Step3 = Separation of the phases
51Cr-labelled Cr3+ and CrO4-

Materials and Methods
30
Table 3. Elution program for As speciation in culture medium (DMEM) and rat brain aggregates exposed to As(III) or As(V).
Step Time (min) Flow (ml/min) %A %B Curve 0 7.0 1.00 100.0 0.0 0.0 1 10.0 1.00 100.0 0.0 0.0 2 20.0 1.00 0.0 100.0 0.0
Table 4. Elution programe for Pt speciation in culture medium (DMEM). Step Time (min) Flow (ml/min) %A %B %C Curve
0 6.0 0.3 0.0 0.0 100.0 0.0 1 8.0 0.3 0.0 10.0 90.0 0.0 2 16.0 0.3 50.0 0.0 50.0 0.0 3 6.0 0.3 50.0 50.0 0.0 0.0
4.1.5 Gel filtration
This technique was used for: (i) the fractionation of the culture medium and the
determination of the biochemical pools of As, Cd, Cr, Mn, Pt and V in the cytosol
from Balb/3T3 cells exposed to 73As, 109Cd, 51Cr, 52Mn, 54Mn, 56Mn, 191Pt and 48V
compounds; (ii) the study of the binding of Cr and V to DNA from Balb/3T3 cells.
It is based on the separation of molecules of different molecular weight and steric
dimension by the well known Sephadex, Sephacryl and Superdex resins. The high
molecular weight components (hereafter named HMWC) are moving into the resin
faster than low molecular weight components (hereafter named LMWC): the HMWC
don’t penetrate the pores of the resin and hence them exit from the column before
LMWC.
The results of the chromatography are expressed in terms of Ve/Vo (Ve=eluted
volume, Vo=column void volume). The elution volumes are a linear function of the
logMW (Figure 6). By means of protein with a known MW it is possible to establish

Materials and Methods
31
a calibration curve to determine the MW of the unknown components in the eluate
(Wood and Cooper, 1970). Blu Dextrane (MW=200KDa) was used to determine Vo.
Figure 6. Calibration curves of Sephadex G150 and Superdex-75 resins by standard molecular weight protein kit.
The gel filtration was carried out by an automatic system involving a biocompatible
low pressure and high flux chromatography apparatus FPLC (Pharmacia, Uppsala,
Sweden) (Figure 7) specific for the proteins and peptide purification. This system is
faster than classical gel filtration chromatography.
Figure 7. Fast Protein Liquid Chromatography system (FPLC)

Materials and Methods
32
4.2 Differential ultracentrifugation
This technique was used for the subcellular fractionation of Balb/3T3 and PC12 cell
line and in the study on Brain aggregates (Sabbioni and Marafante, 1976). It is based
on the sequential sedimentation of the cellular organelles by means of increasing of
centrifugal force by a cooled ultracentrifuge OPTIMAMAX 130.000rpm (Beckman,
USA) (Table 5).
Table 5. Subcellular fractionation of Balb/3T3 cells by differential ultracentrifugation. Subcellualr fractions Applied centrifugal force (xg) Time (min)
Nuclei and Membrane 700 10 Mitochondria 9000 15 Lysosomes 30000 25 Microsomes/Cytosol 105000 90
Materials and Methods
33
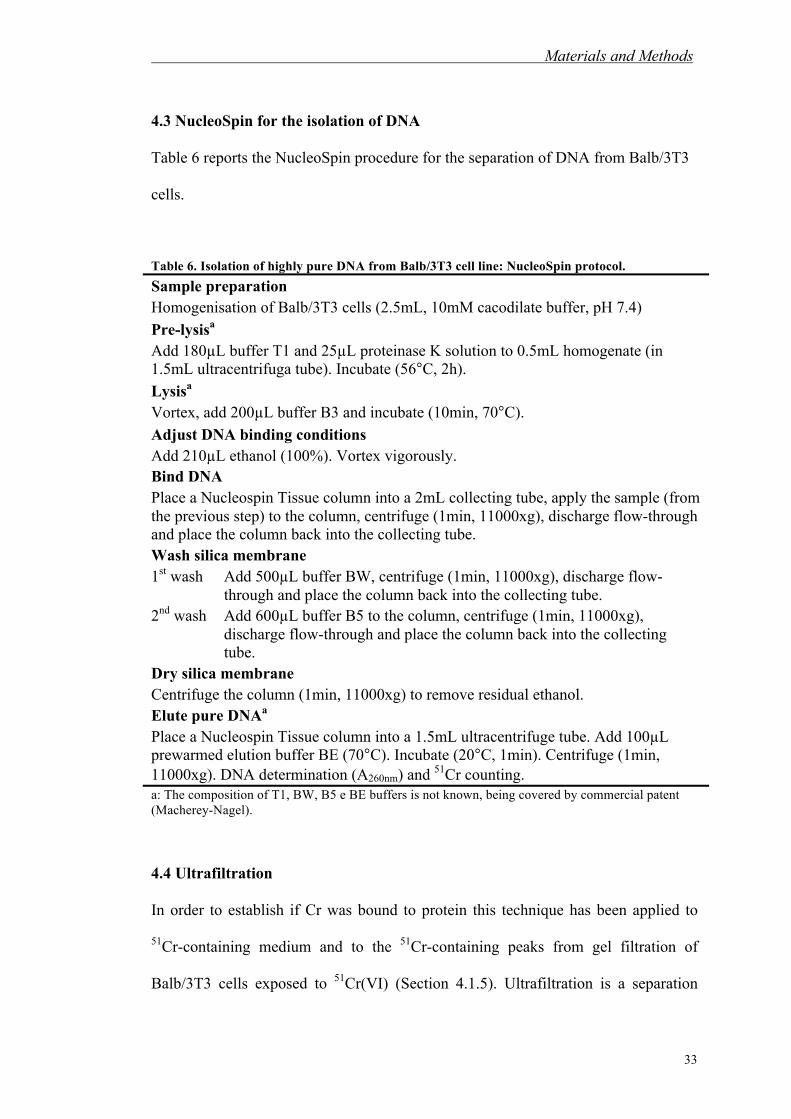
4.3 NucleoSpin for the isolation of DNA
Table 6 reports the NucleoSpin procedure for the separation of DNA from Balb/3T3
cells.
Table 6. Isolation of highly pure DNA from Balb/3T3 cell line: NucleoSpin protocol. Sample preparation Homogenisation of Balb/3T3 cells (2.5mL, 10mM cacodilate buffer, pH 7.4) Pre-lysisa Add 180µL buffer T1 and 25µL proteinase K solution to 0.5mL homogenate (in 1.5mL ultracentrifuga tube). Incubate (56°C, 2h). Lysisa Vortex, add 200µL buffer B3 and incubate (10min, 70°C). Adjust DNA binding conditions Add 210µL ethanol (100%). Vortex vigorously. Bind DNA Place a Nucleospin Tissue column into a 2mL collecting tube, apply the sample (from the previous step) to the column, centrifuge (1min, 11000xg), discharge flow-through and place the column back into the collecting tube. Wash silica membrane 1st wash Add 500µL buffer BW, centrifuge (1min, 11000xg), discharge flow-
through and place the column back into the collecting tube. 2nd wash Add 600µL buffer B5 to the column, centrifuge (1min, 11000xg),
discharge flow-through and place the column back into the collecting tube.
Dry silica membrane Centrifuge the column (1min, 11000xg) to remove residual ethanol. Elute pure DNAa Place a Nucleospin Tissue column into a 1.5mL ultracentrifuge tube. Add 100µL prewarmed elution buffer BE (70°C). Incubate (20°C, 1min). Centrifuge (1min, 11000xg). DNA determination (A260nm) and 51Cr counting. a: The composition of T1, BW, B5 e BE buffers is not known, being covered by commercial patent (Macherey-Nagel).
4.4 Ultrafiltration
In order to establish if Cr was bound to protein this technique has been applied to
51Cr-containing medium and to the 51Cr-containing peaks from gel filtration of
Balb/3T3 cells exposed to 51Cr(VI) (Section 4.1.5). Ultrafiltration is a separation

Materials and Methods
34
process using membranes, with well defined pore size, mainly polysulphone and
cellulose acetate. Typically, it removes high molecular weight substances, colloidal
materials and polymeric molecules which allows the separation of unbound metal
ions species from protein-bound metals. In our study, ultrafiltration of 1-2mL 51Cr-
containing culture medium and 51Cr-cytosol was carried out on Centricon (YM-1)
Centrifugal Filter Devices (Amicon, Millipore, nominal molecular weight cut off
1KDa). Sample in the Filter Device was by centrifuged at 100xg for 30min.
In addition, ultrafiltration experiments were carried out also in cadmium experiments
on 109Cd-14C amino acids-DNA solution loaded onto Ultrafree Microcon Filter
Units at 30K nominal molecular weight limit (NMWL).
5. Biological systems
Mouse fibroblasts Balb/3T3 cell line, rat brain re-aggregates (brain aggregates) as
whole or as individual cell components such as granule cells (neurons), mixed
primary glial cells (astrocytes) and microglia cells were used.
5.1 Balb/3T3 cell line and culturing
The cellular line of immortalized mouse fibroblasts Balb/3T3 (clone A31-1-1) has
been supplied to ECVAM from Istituto Zooprofilattico Sperimentale of Lombardia
and Emilia (IZS), Laboratorio Centro Substrati of Brescia (Balb 3T3, step n°76-78).
Cells were maintained in culture under standard conditions (37°C, 5%CO2, 95% of
humidity, in an incubator HERAEUS, Germany) and counted using a “Bürker”

Materials and Methods
35
chamber 0.0025mm2 (Blau-Brand, Germany) and Trypan blue solution (Sigma,
Milano, Italy). The number of cells/mL was calculated using the formula:
where: N = number of cells a = number of cells counted in minimum 3 squares b = number of squares considered (minimum 3) 104 = conversion factor of chambers volume DF = dilution factor
All cells have been certified free of bacteria, mycoplasma and fungi from by the
supplier. Figures 8A and 8B show the cells morphology as obtained by optical
microscope (Figure 8A) or by SEM (Figure 8B).
Figure 8. Balb 3T3 cells morphology: optical microscope (A); Scanning Eletron Microscope (SEM) (B).
Table 7 summarizes the cultures procedures concerning growth and maintenance of
the cells.
50µm50µm
B
N=(a/b) ⋅104 ⋅DF
A

Materials and Methods
36
Table 7. Balb/3T3 cell line: mainteinance and freezing protocolsa.
Culture medium • Dulbecco’s Modified Eagle Medium (1X), liquid
1000mgL-1 D-Glucose, with L-Glutamine and Sodium Piruvate, (hereafter named DMEM low Glucose)
GIBCO, Invitrogen Corporation
• 10% of Foetal Clone III serum, Bovine serum products (hereafter named FCIII)
HYCLONE, CELBIO, Milano
• 4.8mM of L-Glutamine 200mM (100X) GIBCO, Invitrogen Corporation
• 1% of Fungizone liquid (250µg/mL) GIBCO, Invitrogen Corporation
• 0.6% of Penicillin/Streptomycin solution, liquid, 5000UmL-1 Penicillin and Steptomycin 5000µg/mL (hereafter named P/S)
GIBCO, Invitrogen Corporation
Maintenance 1. Seed 4X10⁵ cells in 75cm2 flask with 15mL DMEM to get an 80% confluent culture in
4 days as follow 1st day
2. Wash cells twice with 10mL of Phosphate Buffer Solution (PBS) (1X) without Ca, Mg and sodium bicarbonate (GIBCO, Milano)
3. Replace PBS solution with 0.5mL of trypsin/EDTA (1X), liquid, 0.5g/L trypsin (1:250) and 0.2g/L EDTA⋅4Na in Hank’s BSS (GIBCO, Invitrogen Corporation)
4. Harvest cells (10mL of fresh medium) 5. Count and seed (15mL of fresh medium)
2nd day 6. Change culture medium
Freezing 1. Add DMSO (10%) and FCIII (10%) to culture medium (80%) 2. Store at –80°C (24h) and then in liquid nitrogen
a: Mazzotti et al., 2001
5.2 PC12 cell line and culturing
The rat pheochromocytoma PC12 clonal cell line (Figure 9) were purchased by
Clontech Laboratories (Mountain View, CA, USA) and cultivated under standard
conditions (37°C and 5%CO2 in an incubator HERAEUS, Germany). Due to the poor
adherence of PC12 cell line, these cells were grown on collagen Vitrogen 100 coated
tissue culture flasks and dishes for at least 3h at 37°C before using flasks for cells
maintenance or treatment.

Materials and Methods
37
Table 8 summarizes the cultures procedures concerning growth and maintenance of
the PC12 cells.
Table 8. PC12 cells: maintenance protocol.
Coating solution • 1%v/v Vitrogen 100 GIBCO, Invitrogen Corporation • 1% BSA 10% GIBCO, Invitrogen Corporation • 98% HBS: pH=7.5
• 122mM NaCl • 2.67mM KCl
• 9.4mM glucose • 14mM NaH2PO4 • 20mM Hepes
Culture medium • RPMI 1640 (1X), liquid 2000mg/L D-Glucose, with
Sodium Piruvate, (hereafter named RPMI) GIBCO, Invitrogen Corporation
• 10% of Horse serum HYCLONE, CELBIO, Milano
• 5% Foetal Calf Serum GIBCO, Invitrogen Corporation
• 1% of Penicillin/Streptomycin solution, liquid, 10000U/mL Penicillin and Steptomycin 10000µg/mL (hereafter named P/S)
GIBCO, Invitrogen Corporation
Maintenance 1. Seed 1X10⁶ cells in 75cm2 “coated” flask with 10mL culture medium to get an 80%
confluent culture in 4 days. 2st day
2. Wash cells twice with 10mL of Phosphate Buffer Solution (PBS) (1X) without Ca, Mg and sodium bicarbonate (GIBCO, Milano)
3. Replace PBS solution with 0.5mL of trypsin/EDTA (1X), liquid, 0.5/L trypsin (1:250) and 0.2g/L EDTA⋅4Na in Hank’s BSS (GIBCO, Invitrogen Corporation)
4. Harvest cells (10mL of fresh medium) 5. Count and seed (15mL of fresh medium)
3nd day 6. Change culture medium

Materials and Methods
38
Figure 9. PC12 cells morphologybyopticalmicroscope.
5.3 Brain re-aggregating and culturing
The brain re-aggregating cultures (Figure 10) were prepared from 16-day old foetal
rat telencephalon at the Insubria University (Varese, Italy) as previously described
(Honegger and Monnet-Tschudi, 2001). The dissected tissue was mechanically
dissociated using nylon sieves with 200 and 115µM pores.
Cells were cultivated under standard conditions (37°C and 10%CO2 in an incubator
HERAEUS, Germany).
Table 9 summarizes the cultures procedures concerning growth and maintenance of
the brain aggregates.

Materials and Methods
39
Table 9. Brain aggregates: maintenance protocol.
Culture medium • DMEM (1X), liquid 25mM D-Glucose
(hereafter named DMEM high Glucose)
• 0.8µM Insulin • 30nM Triiodothyroidine • 20nM Hydrocortisone-21-phosphate • 1µg/mL Transferrin
• 4µM Bioin • 1µM Vitamin B12 • 10µM Linoleate • 1µM Lipoic Acid • 10µM L-Carnitine Cell culture maintenance 1. Re-suspension of cells at a density of 7.5·106 cells/mL in culture medium 2. Maintainance in 15ml flasks under initial gyratory shaking speed of 68rpm, which
was increased over the days in vitro to a constant speed of 80rpm, at 37ºC in an atmosphere of 10%CO2.
3. Replacement of culture medium at intervals of three days up to day 14 and every other day thereafter (5ml replaced of 8ml total).
Figure 10. Brain aggregates microphotography by SEM: whole aggregates (A); details of surface (B).
5.4 Isolation and culture of primary neurons, astrocytes and microglia
Tables 10, 11 and 12 show the protocols concerning isolation and culturing of
primary cerebellar granule cells (neurons), mixed primary glial cells (containing 85%
of astrocytes) and microglial cells, respectively (Figures 11, 12 and 13).
Table 10. Neurons: protocol of preparationa.
A B

Materials and Methods
40
Culture medium • 100mL DMEM high Glucose GIBCO, Invitrogen
Corporation • 5mL Foetal Bovine Serum GIBCO, Invitrogen
Corporation • 5mL Horse serum EuroClone • 0.8mL of 1.66M D(+)glucose stock: 30 g
D(+)glucose in 100ml of DMEM Sigma
• 0.5ml of 1M Hepes
GIBCO, Invitrogen Corporation
• 1mL of of Glutammine (200 mM): 292mg of Glutammine in 10ml sterile water
• GIBCO, Invitrogen Corporation
• 2mL of KCl (1M) stock: 3.728g KCl in 50mL DMEM
• Sigma
• 20µl of Gentamicin (50mg/mL) • GIBCO, Invitrogen Corporation
PBS glucose • • 500mL PBS • GIBCO, Invitrogen
Corporation • 3.03mL of 1.66M D(+)glucose stock • Sigma • 3.85mL of P/S GIBCO, Invitrogen
Corporation Coating solution • Poly-L-Lysine solution 1:10 in sterile water
• Sigma
Coating 1. Add the coating solution to wells (Kinsner at al., 2005) 2. Incubate 30min at room temperature in the flow hood 3. Remove the coating solution 4. Wash 1x with sterile water (150mL) 5. Wash 1x with PBS/glucose (100mL) 6. Add complete medium to wells (0.5mL – 24-well plates; 70µL – 96-well plates;
200µl – chamber slides). Leave the plates in the incubator overnight. Isolation 7-8 days old rat pups are sacrified by decapitation. 1. Remove the brains and place in sterile PBS supplemented with 0.6% D(+)glucose
in a Petri dish 2. Isolate the structure (cerebella) and place them in a sterile 50-ml tube with
PBS/0.6%D (+)glucose. The tube with the material must be kept on ice during the isolation.
3. Cut the cerebella into small pieces on a Petri dish; place the pieces in a sterile 50mL tube containing 7mL of 1:5000 Versene (pre-warmed at 37°C).
4. Incubate the tissue for 5min at 37°C. 5. After incubation triturate the tissue 7-10 times using a fire polished, large bored
glass Pasteur pipette. Allow large pieces of tissue to settle, remove the cells suspension and place it into a sterile 50ml/tube.

Materials and Methods
41
6. Add 5mL of Versene to the remaining tissue. 7. Again triturate the tissue 7-10 times using a fire polished, small bored glass Pasteur
pipette. Allow large pieces of tissue to settle, remove the cell suspension and add it to the first.
8. Repeat the procedure until the tissue is fully dissociated. 9. Centrifuge the collected cell suspension for 6min, 900rpm at 40°C. 10. Discard the supernatant and add 10mL of medium. 11. Pass the cell suspension through a 40µm cell strainer. 12. Count the cells and plate at a density 250000cells/cm2.
Inhibition of glial cell proliferation If necessary, after 24 hours the cells can be treated with 10µM cytosine-D-arabinoside hydrochloride (Ara-C) (Kinsner et al., 2005) to inhibit proliferation of glial cells. a: Kinsner et al., 2005.
Figure 11. Morphology of cerebellar granule neurons observed under the phase-contrast microscope.
Table 11. Astrocytes: protocol of preparationa Culture medium • 100mL DMEM high Glucose GIBCO, Invitrogen Corporation • 11.4mL Foetal Bovine Serum GIBCO, Invitrogen Corporation • 2.3mL of P/S
GIBCO, Invitrogen Corporation PBS glucose • • 500mL PBS • GIBCO, Invitrogen Corporation • 3.03mL of 1.66M D(+)glucose stock • Sigma • 3.85mL of P/S GIBCO, Invitrogen Corporation DNA-se • • 50ml of EBSS • GIBCO, Invitrogen Corporation • 2mg DNA-se Sigma • 150mg of BSA Sigma Trypsin • • 25ml of EBSS/ DNA-se/ BSA solution GIBCO, Invitrogen Corporation

Materials and Methods
42
• 6.25mg trypsin Sigma Coating solution • Poly-L-Lysine solution 1:20 in sterile water
• Sigma
Coating 1. Add the coating solution to flasks: -75cm2 flasks: add 7mL of coating solution/flask
-25cm2 flasks: add 2.5mL of coating solution/flask 2. Incubate 30 minutes at room temperature under the flow hood 3. Remove the coating solution 4. Wash 1x with sterile water (7ml/T75 flask; 2.5ml/T25 flask) 5. Wash 1x with PBS/glucose (7ml/T75 flask; 2.5ml/T25 flask) 6. Add complete medium to flasks (7ml/T75 flask; 2.5ml/T25 flask) 7. Leave the flasks in the incubator overnight. Isolation 7-8 days old rat pups are sacrified by decapitation. The cortex is isolated from the brains removed from the scull. 1. Cut the isolated cortex in small pieces in a Petri dish. 2. Add 15mL EBSS/DNA-se/Trypsin and put into a 50mL tube. 3. Incubate for 15 min at 37°C. 4. Add an equal volume of DMEM to neutralise the trypsin. 5. Centrifuge at 900rpm, 7min, 4°C. 6. Discard the supernatant, add 10mL of EBSS/DNA-se and triturate the pellet using
glass Pasteur pipettes with big hole. 7. Allow the tissue to settle for 1min and remove the supernatant to a sterile 50mL
tube. 8. Add 10mL of EBSS/DNA-se to the tissue and triturate the pellet using Pasteur
pipettes with small hole. 9. Allow the tissue to settle for 1min and remove the supernatant and add it to the
first. 10. Repeat the procedure until the tissue is fully dissociated. 11. Centrifuge the collected supernatant at 900rpm, 7min, 4°C. 12. Discard the supernatant and add 3mL of DMEM to the pellet. 13. Gently disperse the pellet and resuspend the tissue completely by triturating with a
glass Pasteur pipette. 14. Make the volume up to 30mL with DMEM. 15. Filter the cells through the 100µm and than 40µm mesh. 16. Count the cells and plate at a cell density 3x10⁴cells cm-2. a: Kinsner et al., 2005.

Materials and Methods
43
Figure 12. Astrocytes morphology: optical (A) and fluorescent (B) microscope.
Table 12. Microglia: protocol of preparationa
Culture medium • 100mL DMEM high Glucose GIBCO, Invitrogen Corporation • 10% Foetal Bovine Serum GIBCO, Invitrogen Corporation • 1% of P/S
GIBCO, Invitrogen Corporation Hank’s balanced salt solution (HBSS) • • 0.25% trypsin GIBCO, Invitrogen Corporation • 0.02mg/mL DNA-se I GIBCO, Invitrogen Corporation • 1% of BSA Sigma Isolation Primary, mixed glial cultures were prepared as described before from the cerebral cortex of 7-day-old rats. 1. Briefly, the cells isolated from cerebral hemispheres were dissociated in Hank’s
balanced salt solution (HBSS). 2. Cells were plated at a cell density of 1x10⁴cells/cm in 75cm2 culture flasks (Costar,
Corning). 3. All flasks and plates were coated with poly-L-lysine (see above). 4. Cells were grown in a humidified incubator at 37°C in 5% CO2 in air. Medium was
changed every 3 days. 5. At confluence (14-16 days in vitro) the primary mixed glial cultures were used to
isolate microglial cells. 6. The cultures were shaken for 2h to dislodge microglia that were loosely attached to
the astrocytes. 7. Isolated microglia were seeded into 6-well or 12-well plates (Costar, Corning) at a
density of 2.0 x 10⁵cells/cm2 and maintained in astrocyte-conditioned medium (medium collected from astrocytic cultures and spun down) mixed 1:1 (v/v) with fresh culture medium. The purity of microglial cultures was determined immunocytochemically with anti-GFAP antibody (astrocytic marker) and anti-OX-42 antibody (microglial marker).
a: Kinsner et al., 2006.
A B

Materials and Methods
44
Figure 13. Microglia morphology: optical (A) and confocal (B) microscope.
6. Studies on Balb/3T3 cell line
This section reports the studies carried out on As, Cd, Cr, Pt and V compounds in
Balb/3T3 cell line. In addition, procedures concerning specific studies related to
biomethylation of inorganic As species, their effects on protein and nucleic acids
content and the determination of the oxidation state of Cr and V in the cytosol of
exposed cells, are reported.
6.1 Basal cytotoxicity
Hereafter is reported the screening of the basal cytotoxicity induced by As, Cd, Cr, Pt
and V compounds considered in this study in Balb/3T3 cells as determined by
Colony Forming Effciency assay (CFE).
According to a previous reported protocol (Mazzotti, 2001), 200cells/4mL of
complete medium were seeded in 60x15mm culture dish (Falcon, Italy) using 6
culture dishes for every treatment and control (complete medium) (Table 13).
After 24h the culture medium was replaced with fresh medium solution containing
metal compounds to be tested at the appropriate concentration.
A B
Materials and Methods
45
After 2h or 72h of exposure the metal-containing medium was replaced with fresh
complete medium (without the metal compound) that was changed twice/week.
Seven days later the culture medium was removed, cells were washed with 4mL
PBS/dish for 10min., fixed with 4mL/dish of a 10% in PBS formaldehyde 37%
solution Formalin (Sigma) for 20min. and stained with 4mL/dish of a 10% in MilliQ
H2O Giemsa stain stock solution (0.4%) for 30min. Dishes were rinsed with MilliQ
H2O and let to dry.
Colonies with more than 50 cells were counted using a stereo Wild Heerbrugg
(Switzerland) microscope. Results have been expressed as relative Colony Forming
Efficiency (CFE), assuming the number of colonies in metal treated plates as
percentage of viability of control (100%).
6.2 Concurrent cytotoxicity (CFE) and Morphological Transformation Assay
Cytotoxicity and carcinogenic potential of metal compounds were evaluated in
Balb/3T3 cells using concurrent CFE and morphological transformation assay
(Mazzotti, 2001). The protocol (Table 13) consists of two steps:
(i) evaluation of cytotoxicity (CFE).
(ii) evaluation of induction of foci TypeIII.
The results concerning the morphological transformation were elaborated
considering the following parameters:
- plating efficiency (mean of colonies in CFE dish x 100/200 cells seeded in every
dishes)
- total number of seeded cells (number of dishes for morphological
transformation x 10000 cells seeded in every dishes)

Materials and Methods
46
- surviving cells ((total number of cells seeded x plating efficiency) / 100)
- transformation frequency (total number of foci type III per treatment / surviving
cells)
The significance of transformation efficiency was calculated using Fisher analysis
(Ponti et al., 2007).
Table 13 summarizes the protocols used in CTA assay.
Table 13. Balb/3T3 concurrent cytotoxicity and morphological transformation assay: protocola.
Reagents • DMEM low Glucose • Formaldehyde solution (37%) • Giemsa solution 0.4% • Phosphate Buffer Solution (1X) without calcium,
magnesium and sodium bicarbonate (PBS)
Source SIGMA, Milano, Italy SIGMA, Milano, Italy GIBCO, Milano, Italy SIGMA, Milano, Italy
Protocol 1st day
1. Seed 200cell/dish 60x15mm in 4mL of fresh medium (6 dishes per treatment) for CFE and 104cells dish 60x15mm in 4mL of fresh medium (20 dishes per treatment) for morphological transformation assays
2nd day 2. Replace te medium with 4mL of treatment solution containing the metal
compound for 72h 5th day
3. Replace the treatment solution with 4mL of fresh complete medium 8th day
4. Change the medium (4mL) 11th day (end of CFE)
5. Fix the colonies with 4mL/dish of formaldehyde solution 10% in PBS for 20min. 6. Stain colonies with 4mL/dish of Giemsa filtered solution 10% in H2O MilliQ for
30min. 11th day (morphological transformation)
7. Change the medium (4mL) and culture cells for 4 weeks changing medium every 3 days
40th day (end of morphological transformation) 8. Fix the cells with 4mL/petri dish 60x15mm of formaldehyde solution 10% in PBS
for 20min. 9. Stain the cells with 4mL/petri dish 60x15mm of Giemsa filtered solution 10% in
H2O MilliQ for 30min. 10. Count of the foci type III and estimate transforming frequency a: Mazzotti, 2001.

Materials and Methods
47
In the cases of As(V), Cd(II) and V(V) further transformation assays were carried out
by exposing Balb/3T3 to of Na2HAsO4, CdCl2 or NaVO3 alone or to of the same
compounds in the presence of 3µM diethylmaleate (DEM), a cellular glutathione
(GSH)- depleting agent.
6.3 Behaviour in culture medium
The behaviour of 51Cr and 48V compounds in DMEM were investigated by Minoia’s
and Sabbioni's methods and by Chelex 100 (0.8x4.0cm) followed by gel filtration on
Sephacryl S200 (1.6x40cm). The corresponding studies on As were carried out by
HPLC (Section 4.1.2) and on Pt by HPLC (Section 4.1.4) and by NMR (section 3.5).
In the case of Cr, the 51Cr-cell-free medium was also ultrafiltered on Centricon (YM-
1) Centrifugal Filter Devices (Section 4.4).
6.4 Uptake
Table 14 summarizes the protocol of the study related to the uptake of 73As, 109Cd,
51Cr, 191Pt and 48V in Balb/3T3 cells exposed to different concentrations of the
radiolabelled species.
Table 14. As, Cd, Cr, Pt and V in Balb/3T3 cells: protocol of uptake. 1. Seed 5x10⁵cells in 75cm2 flasks (CORNING) with 10mL of DMEM.
1st day 0. Replace the medium with 10mL of fresh DMEM containing the metal compound of interest
and incubation for 4h, 24h or 72h 3. Remove DMEM 4. Wash three times cells with 10mL of PBS 5. Add 1mL of Trypsin-EDTA (1X) 6. Harvest the cells using 10mL of DMEM 7. Count the cells by using a Bürker chamber 8. Wash twice the pellet with PBS (290xg, 10min) 9. Determinate the incorporation of metal into cells (by counting the radiotracer or by NAA).

Materials and Methods
48
6.5 Intracellular distribution
The intracellular distribution of 73As, 109Cd, 51Cr, 191Pt and 48V incorporated into
cells has been studied by differential ultracentrifugation (Section 4.2). Cells, after
exposure to the compound, have been washed three times with PBS, treated with
trypsin, resuspended in 2mL of cacodilate buffer 10mM, pH=7.5 containing 0.25M
sucrose and homogenised using a Potter-Elvehjem supplied of Teflon pestle
(1000rpm). The homogenate has been submitted to differential centrifugation by
means of cooled miniultracentrifuge 100 TL (Beckmann, Milan, Italy) at increasing
centrifugal force (g) in order to sediment organelles (Sabbioni and Marafante, 1976)
(Section 4.2, Table 5). The subcellular fractions were counted by the radioactivity
content.
6.6 Distribution of elemets among cytosol components
0.5mL of a cytosol fraction obtained by ultracentrifugation of the homogenates from
Balb/3T3 cells exposed to 73As(III), 109Cd, 51Cr(VI), 191Pt(IV) as chloroplatinate and
48V(V) compounds were chromatographed on Sephacryl S200 (1.6x40cm) previously
equilibrated with Hepes buffer, pH=7.2. UV absorption of the eluate was monitored
continuously at 280nm using a Lambda 25 spectrophotometer (Perkin Elmer, Monza,
Italy) and the collected fractions were counted for the radioactivity content by
integral γ-counting (Section 3.2.1).
PtCl2 was also analysed by NMR (Section 3.5) to detect the interaction of platinum
with cellular lysate components. The lysate was obtained by suspending in PBS,
iced-homogenates and centrifuged at 4°C for 10min the cells from uptake (Section
6.4). The supernatant was ultracentrifuged at 100000xg for 90min.

Materials and Methods
49
6.7 Binding of metals to DNA
Two kind of experiments were carried out on DNA isolated by NucleoSpin method:
(i) isolation of DNA from Balb/3T3 cells exposed to 73As(III), 109Cd, 51Cr(VI) and
48V(V) species. 5÷10x106cells were exposed for different times to 10÷20µCi of
each radiolabelled compound at different concentrations. DNA was isolated by
NucleoSpin protocol (Section 4.3) and UV and radioactivity monitored in the
DNA fraction. Then, 51Cr- 109Cd- and 48V-containing DNA fractions were
chromatographed on Sephadex G25 resin (1.6x40cm) previously equilibrated
with 10mM Hepes, pH=7.2. UV and radioactivity were monitored in the
collected fractions.
(ii) incubation of 109Cd or 48V(V) with DNA previously isolated from Balb/3T3
cells. DNA was isolated from unexposed 5÷10x106cells by NucleoSpin. Then,
the nucleic acid was incubated with 5µM V(V) or 1µM Cd(II) spiked with 5µCi
48V or 2µCi 109Cd, respectively. The DNA was subsequently chromatographed
as at the point (i).
In order to asses the stability of the Cd-amino acid(s)-DNA complex isolated from
109Cd-treated cells preincubated with 14C-amino acids, each fresh DNA sample was
incubated with 10mMTris, pH=7.8 and 20mM EDTA for 30 min at room
temperature. Following each incubation, the sample was loaded onto filtered
Ultrafree-MC (30000 NMWL, Millipore) filter units and centrifuged at 1000g for 5
min at room temperature. Each sample was washed 5 times with 10mM Tris, pH=7.8
and 20mM EDTA and the released 14C-amino acid residues and 109Cd radioactivities
were determined in the washings as described in the Section 3.2.3.
Materials and Methods
50
6.8 Binding to DNA and cross linking of Cd
The cross linking of aminoacids to DNA was studied by isolating the nucleic acid by
proteinase K method (Nucleo Spin, Section 4.3) that yield deproteinated DNA and
aminoacid associated to DNA, (Lin et al., 1994), from cells treated with 1 and 5µM
109CdCl2 for 72h pre-treated or not with 20µCi 14C-aminoacid cocktail. Then, 14C and
109Cd were counted as reported in Section 3.2.
6.9 Biomethylation of As(III), As(V) and AsF
The biomethylation of 73As(III), As73(V) and AsF in Balb/3T3 cell line was studied
by TAM method (Section 4.1.1). The presence of 73As-biomethylated form of arsenic
was determined in culture medium after exposure of cells to inorganic 73As species
and in the cytosol from intracellular distribution (Section 4.2) by γ-counting of 73As
in the different chromatographic fractions. In the case of AsF the determination of As
in the fraction was carried by NAA (Section 3.1).
6.10 NCG, cellular protein, DNA and RNA after exposure to As(III)
Table 15 summarizes the protocol concerning the determination of cellular protein,
DNA and RNA.
Table 15. Determination of protein , DNA and RNA in Balb/3T3 cell line: protocol.
Culture medium (Table 7, Section 5.1) Cell culture and treatment 1. Seed 1X10⁴ cells in 10cm2 flask with 15mL in DMEM complete medium in order to
get an 80% confluent culture in 5 days as follow 1st day
2. Determination of cell number and plating efficiency 3. Exposure to chemicals
5nd day 4. Determination of Nt and NCG for all the dishes 5. Determination of total DNA, total RNA and total protein

Materials and Methods
51
6.11 Oxidation state of Cr and V in the cytosol
The emerging 51Cr- or 48V-containing peaks from gel filtration on Sephacryl S200
were submitted to Minoia’s or Sabbioni’s methods (Sections 4.1.3 and 4.1.2)
(Figures 4 and 5) in order to determine the oxidation state of the metal. The 51Cr and
48V radioactivity were measured by integral γ-counting (Section 3.2.1).
6.12 Induction of Cd-BP by Cd
In order to confirm the protein nature of the 6KDa 109Cd- and 35S- containing peak
(Cd-BP, Figure 30C), two “ad hoc” experiments were carried out.
1. An aliquot of the cytosol from cells exposed to 35S-cysteine and 1µM of
109CdCl2 was also chromatographed by FPLC after heating for 1min at 80°C
followed by cooling in an ice-bath.
2. The second study concerned the UV absorption characteristic of the 6KDa
component. In this context, the fractions eluted from FPLC arising from the last
heating experiment were spectrophotometrically analysed for their absorbance
both at 280 and 254nm.
6.13 Reactive oxygen species (ROS) induced by Cd
To determine the rate of Balb/3T3 ROS generation induced by Cd(II), the fluorescent
probe 2’-7’ dichlorofluorescein diacetate (DCFH-DA) was added to cell incubation
mixture. DCFH-DA diffuses through the cell membrane readily and is enzymatically
hydrolised by intracellular esterases to non-fluorescent dichlorofluorescein (DCFH),
which, in presence of ROS, is rapidly oxidised to high fluorescent
dischlorofluorescein (DCF) which effluxes the cells (Pourahmad et al., 2003). The

Materials and Methods
52
DCF intensity is parallel to the amount of ROS formed intracellularly. The stock
DCFH-DA (2mM) was prepared in absolute ethanol and kept at -70°C in the dark.
Cells collected from culture flasks using a cell scraper were washed twice with PBS
prior to the analysis. Cells (106cells/mL) were suspended in 10mL DMEM and were
incubated with 1, 3 and 5µM Cd(II) at 37°C for 15, 30 and 60min. After
centrifugation (50xg, 1min), the cells were resuspended in PBS, adjusted to pH=7.4
with 50mM Tris-HCl and dichlorofluorescein by incubating with 2µM DCFH-DA
for 30min at 37°C.
The fluorescent intensity of the ROS product was measured using a Perkin Elmer
LS55 fluorescence spectrophotometer (Perkin Elmer, Monza, Italy). Excitation and
emission wavelengths were 500 and 520nm respectively. The results were expressed
as fluorescent intensity/106cells.
6.14 Lipid peroxidation by Cd
In order to estimate the lipid peroxidation effect in Balb/3T3 cells exposed to
different Cd(II) concentrations (ranging from 1 to 5µM) the amount of thiobarbituric
acid-reactive substances (TBA-RS), formed during the decomposition of lipid
hydroperoxides, were determined (Smith et al., 1982). After incubation of 5·106cells
with Cd(II) for 72h, cells were collected by a cell scraper, washed with 1mL PBS and
resuspended (106cells/mL) in 0.5mL of PBS with trichloroacetic acid (70%w/v)
(SigmaAldrich, Milan, Italy). The suspension was boiled with thiobarbituric acid
(0.8%w/v) (SigmaAldrich, Milan, Italy) for 30min. After cooling, 1.5mL of
butylated hydroxytoluene (BHT) was added (0.05%w/v) in order to prevent
artifactual formation and/or degradation of hydroperoxides. After centrifugation the

Materials and Methods
53
absorbance of the butanol phase was recorded at 532nm in a Perkin Elmer LS55
fluorescence spectrophotometer (Perkin Elmer, Monza, Italy). The concentration of
TBA-RS was then calculated using a molar extinction coefficient of 1.56·105/M·cm
(Buege and Aust, 1978).
6.15 Inhibition of DNA synthesis by Cd
Balb/3T3 cells were exposed for 72h to 1, 3 and 5µM Cd(II) as reported in the
Section 10.2.10. Then, the medium was discarded, the cells trypsinised and the
survived cells in each flask were counted, aliquotated into three duplicate tubes
(106cells/mL in each tube), 5µCi/mL 3H-TdR was added to each tube and then
incubated in water bath at 37°C for 24h. After incubation the cells were extracted to
glass-fiber membranes, rinsed in 5% thrichloroacetic acid and 5mL ethanol, then
stored at 50°C until fully dry, placed in scintillation liquid and measured for 3H
radioactivity by β- counting (Section 3.2.3). Triplicates were prepared for each
concentration.
6.16 Determination of glutathione inducedd by Cd
The spectrophotometric/microplate reader assay method for glutathione (GSH)
involves oxidation of GSH by the sulfhydryl reagent 5,5′-dithio-bis(2-nitrobenzoic
acid) (DTNB) to form the yellow derivative 5′-thio-2-nitrobenzoic acid (TNB),
measurable at 412nm. The glutathione disulfide (GSSG) formed can be recycled to
GSH by glutathione reductase in the presence of NADPH. Levels of total glutathione
(reduced form (GSH) plus disulfide form (GSSG)) were determined according to the
microplate assay as previously described (Baker et al, 1990). Following treatment
with Cd(II) cells were scrapped, suspended in 0.01M HCl and homogenized by

Materials and Methods
54
sonication at 50W for 15sec. Protein was precipitated by adding sulfosalicilic acid
(2.5%v/v) and incubating the samples at 0ºC for 30min. Following centrifugation to
remove precipitate (1000g, 10 min), a 0.8mL portion of the acid-soluble fraction
from each sample was drawn off and neutralized by the addition of 80µL 50%
aqueous triethanolamine. Then, 0.1mL of the neutralized extract was transferred to a
96-well microplate and assayed for the glutathione. The final assay mixture
contained 0.1mL extract, 0.15mL of 150mM phosphate buffer (pH=7.2), 100µg 5,5′-
dithiobis-(2 nitrobenzoic acid), 50µg NADPH and 0.1unit of glutathione reductase.
Following the addition of the enzyme, the increase in absorbance at 405nm was
monitored over a period of 5min:
Each experiment included a set of internal standards containing known amounts of
reduced glutathione (Sigma, Milan, Italy). Total protein in the original homogenate
was determined using Protein Assay Kits (BioRad). Results were calculated as nmol
GSH per mg protein.
7. Studies on Mn in PC12 cell line
This section reports the studies carried out on Mn compounds in PC12 cell line.
Procedures concerning specific studies related to the cell viability (MTT assay),
behaviour in culture medium, uptake, intracellular distribution, interaction of Mn
with cellular components and expression catecholamine were performed.

Materials and Methods
55
7.1 Cell viability by MTT assay
Cell viability has been determined by MTT assay (Mosmann, 1983) (Table 16). In
such assay, the tetrazolium salt, 3-(4,5 dimethylthiazol-2-yl)-2-5 diphenyltetrazolium
bromide (MTT), is actively absorbed into cells and reduced in a mitochomdrial-
dependent reaction to yield a formazan product, which accumulates within the cell
since it cannot pass through the cell membrane. Upon addition of RPMI the product
is solubilised and liberated and it is readily quantified colorimetrically. The ability of
cells to reduce MTT provides an indication of mitochondrial integrity and activity
which is interpreted as a measure of cell viability.
Cells were plated in 96 well plates (Costar, Milan, Italy) previously treated with
100µL 1%v/v collagen Vitrogen 100 (Section 5.3).
After 24h, the medium was removed and the solution of Mn(II) or Mn(VII) was
added to each well and incubated for 72h at the selected concentrations ranging from
1 to 500µM.
Thereafter, 100µL MTT solution (1mg/mL HBSS) was directly added to each well
and incubated for 2h at 37°C, 5%CO2. The medium was discarded and 200µL of
MTT Desorb solution (50% DMSO and 50% ethanol) were added to cells in order to
solubilise the formazan crystals. Then, the plate was put on shaker for 15min until
the black spots disappeared. The optical density of the solution obtained was read at
550 and 620nm (wavelengths of reference) (Spectra Max 250µL plate reader,
Molecular Devices, Sunnyvale, CA, USA).

Materials and Methods
56
Table 16. MTT assay used to determine cell viability in PC12 exposed to Mn compounds: protocol.
1st day 1. Incubation of PC12 with Mn compounds 2. Addition of MTTa stock solution to incubating medium (HBSS) for 2h to 37°C 3. Remove medium and replace with 50% RPMI – 50% ethanol 4. Shake for 15min 5. Read absorbance at 550nm and 620nm against blank
7.2 Behaviour in culture medium
The behaviour of 54Mn in RPMI was investigated by gel filtration on Sephacryl S200
(1.6x40cm) (Section 4.1.5) and by NMR (section 3.5).
7.3 Uptake
Table 17 summarizes the protocol of the study related to the uptake of 54Mn, 52Mn and
56Mn in PC12 cells exposed to different concentrations of the radiolabelled Mn(II).
Table 17. 54Mn, 52Mn and 56Mn in PC12 cells: protocol of uptake. Seed 5x10⁵cells in previously “coated” 75cm2 flasks (CORNING) with 10mL of complete RPMI.
1st day 1. Replace the medium with 10mL of fresh RPMI containing the 54Mn of interest and
incubation for 24h 2. Add 52Mn or 56Mn for 3h (first experiment) 3. Add 56Mn for 3h (second experiment) 4. Remove RPMI 5. Wash three times cells with 10mL of PBS 6. Add 1mL of Trypsin-EDTA (1X) 7. Harvest the cells using 10mL of RPMI 8. Count the cells by using a Bürker chamber 10. Wash twice the pellet with PBS (290xg, 10min) 11. Determinate the incorporation of different isotoper of the metal into cells (by
counting the radiotracers or by NAA)

Materials and Methods
57
7.4 Intracellular distribution
The intracellular distribution of 54Mn incorporated into cells has been studied by
differential ultracentrifugation (Section 6.5).
7.5 Reactive oxygen species (ROS)
The determination of the rate of the ROS generation induced by Mn(II) and Mn(VII)
in PC12 grown in RPMI 1640 medium was studied as reported in Section 6.13.
8. Studies on As in aggregating rat brain cell cultures and isolated brain cells (neurons, microglia and astrocytes)
In this work we have studied the uptake and biometylation of As(III) in rat brain
aggregates and some of their cell components (neurons, microglia and astrocytes).
8.1 Uptake of As by brain aggregates
Table 18 summarize the protocol concerning the uptake of As(III) on Brain
aggregates.
Table 18. Uptake of As in Brain aggregates: protocol. Pooling of Re-aggregating brain cell cultures and distribution over six well plates (Nunc, Milan, Italy). Each well contained approximately 40 aggregates in 2ml of culture medium containing As(III).
4th day 1. Remove medium 2. Wash twice the cells with 10mL of PBS 3. Harvest the cells using 10mL of complete medium 4. Count the aggregates by microscope 5. Count 73As incorporated into Brain aggregates

Materials and Methods
58
8.2 Uptake of As by neurons, astrocytes and microglia cells
Table 19 summarizes the protocol concerning the uptake of As in neurons, astrocytes
and microglia cells. In the same experiments, cell viability was estimated using the
Alamar Blue assay (Al-Nasiry, 2007).
Table 19. Uptake of As in neurons, astrocytes and microglia cells: protocol. Seed 1x10⁶ Neurons or Astrocytes or Microglial cells in 6-well plates coated with poly-L-lysine (Costar) with 2.5mL of culture medium containing As(III).
4th day 1. Remove medium 2. Wash twice the cells with 10mL of PBS 3. Add 1mL of Trypsin-EDTA (1X) 4. Harvest the cells using 10mL of complete medium 5. Count the cells using a Bürker chamber 6. Wash twice the pellet with PBS (290xg, 10min) 7. Determination of the metal incorporated into cells (by counting 73As)
8.3 Biomethylation studies
After exposure to As(III) (Table 19) the biomethylation of As(III) in rat brain
aggregates was studied by their homogenisation and ultracentrifugation at 105000xg
for 90min. Then, the extract was submitted to ion exchange chromatography
according to the Tam’s method (Section 4.1.1).

Results
59
RESULTS
9. Elemental analysis of salts, culture media and cells
Tables 20 and 21 report the analytical data concerning the determination of
impurities of As, Cd, Cr, Pt and V salts used for carcinogenicity studies, of the
complete DMEM and of Balb/3T3 cells as determined by ICPMS, GFAAS or NAA
(Section 3).
The following conclusions can be drawn:
(i) the impurities of more than 30 elements of the 14 compounds analysed ranged
from a minimum of 0.0001 to 32.8ng/g for Cs and Fe in NaAsO2 and
VOSO46ּH2O respectively (Table 20). The same Table reports detailed
analytical data for elements, which are of particular interest in order to avoid
artifacts in carcinogenicity studies (As, Cd, Cr, Pt and V) (Farina, 2003).
(ii) the quantitative baseline of background concentrations of As, Cd, Cr, Pt and V
in the incubation DMEM medium were 6.2, 0.05, 16, 0.03 and 0.1µg/L
respectively (Table 21). The corresponding values of such elements in
unexposed Balb/3T3 cells were <0.03, <0.1, 0.3, <0.02 and 0.06fg/cell. The
other elements tested in DMEM ranged from 0.0005 to 78µg/L for Ir and Zn
respectively, while the corresponding values of Balb/3T3 cells were 0.00002
(Ir) and 36 (Zn) fg/cell1.

Results
60
V
0.3 -
<0.0
2
0.04
0.42
0.4
1.2 - 3.3
0.07
0.09
- -
Pt -
<0.0
5
<0.0
4
<0.0
1
0.00
2
0.00
2
<0.0
02
- - - -
0.00
6
0.00
5
Cr -
1.72
0.03
0.05
4.9
0.07
- 8.9
0.02
0.06
0.03
0.03
0.02
Cd
0.03
0.15
<0.0
6
<0.0
6
1.9 -
0.00
4
- 0.8
0.00
7
0.00
8
2.45
1.7
As - - - - -
15.5
0.03
- - 0.9
0.6
2.1
1.4
Min
.
0.00
05 (L
a)
0.00
02 (C
s)
0.00
8 (L
a)
0.00
1 (C
s)
0.00
02 (R
h)
0.00
04 (L
a)
0.00
04 (R
h)
0.02
(Ce)
0.00
1 (B
e)
0.00
02 (I
n)
0.00
3 (S
b)
0.00
05 (P
d)
0.00
04 (L
u)
Con
cent
ratio
n (n
g⋅/g
)
Max
0.5
(Al)
6.4
(Al)
24.1
(Fe)
14.3
(Fe)
7.2
(Zn)
18.6
(As)
9.3
(Fe)
27.6
(Zn)
12.4
(Zn)
3.3
(Mo)
3.9
(Zn)
32.8
(Fe)
23.5
(Fe)
Com
poun
ds
Na 2
HA
sO4·7
H2O
NaA
sO2
Asr
seno
chol
ine
Ars
enob
etai
ne
Tet
raph
enyl
arso
nium
chl
orid
e
CdC
l 2⋅2H
2O
Na 2
CrO
4⋅4H
2O
PtC
l 2
PtC
l 4
(NH
4) 2Pt
Cl 4
(NH
4) 2Pt
Cl 6
VO
SO4⋅
5H2O
NH
4VO
3
Tab
le 2
0. E
lem
enta
l im
puri
ties o
f As,
Cr,
Pt a
nd V
salts
use
d fo
r ca
rcin
ogen
icity
stud
ies i
n B
alb/
3T3
cells
. a:
mea
n of
3 d
eter
min
atio
ns, R
SD<1
5%

Results
61
Concerning the neurotoxicity studies on PC12 cell line, the content of Mn in
unexposed cells and complete RPMI was 1.9fg/cell and 4.3µg/L respectively.
Table 21. Baseline concentrations of trace elements in Balb/3T3 cells and in complete DMEM culture mediuma.
Element Balb/3T3 (fg/cell)
DMEM (µg/L)
Element Balb/3T3 (fg/cell)
DMEM (µg/L)
As <0.03 6.2 La 0.0007 0.001
Cd < 0.1 0.05 Lu 0.0001 -
Cr 0.3 16.0 Mn 0.9 2.52
Pt < 0.02 0.03 Mo 0.21 0.34
V 0.06 0.1 Ni 0.07 -
Pb 0.2 0.34
Ag 0.05 0.11 Rb 0.6 4.8
Au 0.0013 0.08 Sb 0.002 0.43
Ba < 6 5.99 Sc 0.0004 -
Ce 0.0025 0.01 Se 0.63 7.00
Co 0.06 9.40 Sn < 0.6 0.03
Cs 0.044 0.02 Sr <1.7 -
Cu 0.8 6.4 Ta 0.0009 0.03
Eu 0.0003 0.001 Tl < 0.05 0.06
Fe 16.6 - Rh <0.0003 -
Ga 0.003 - U < 0.2 0.01
Hf 0.0009 0.002 W 0.002 0.002
Hg 0.08 0.06 Zn 36 78
Ir 0.00002 0.0005 Zr < 0.05 0.08 a: Mean of 3-5 determinations, RSD<30%.

Results
62
10. Studies on Balb/3T3 cell line
Hereafter are reported the results concerning the studies carried out on As, Cd, Cr, Pt
and V compounds in Balb/3T3 cell line.
10.1 Arsenic
Results presented concern different As compounds. In particular, they are related to
the following studies: cytoxicity, morphological neoplastic transformation, behaviour
in culture medium, uptake, intracellular repartition, binding to biomolecules,
biomethylation of inorganic As species , effect of trivalent inorganic As on number
of cell generations (NGC), protein and nucleic acids content.
10.1.1 Cytoxicity assay (CFE)
Figures 14 and 15 illustrate the results of the Colony Forming Efficiency assay
(CFE) carried out to estimate the cytotoxic effect induced in Balb/3T3 cells exposed
for 72h to inorganic/organic As species.
The following remarks can be drawn:
(i) inorganic As(III) and As(V), but not AsF, inhibited CFE of cultured Balb/3T3
cells in a dose-dependent relationship (Figure 14A). Complete inhibition for
As(III) and As(V) was reached at 20 and 50µM respectively (IC50=1.5 and 5µM
respectively).
(ii) phenylated organic As species such as Ph3As and Ph4As displayed a complete
different cytotoxic response. Ph3As did not induce a CFE inhibition at all doses
tested (0.1 to 100µM) while Ph4As inhibited CFE in a obvious dose-dependent
relationship (IC50=5µM) (Figure 14B).
(iii) MMA(V), DMA(V), TMAO did not cause a significant CFE inhibition also at
high dose exposure (1000µM) (Figure 15A). No CFE inhibition was also

Results
63
observed for Asβ, AsCh and TMAI (Figure 15B). On the contrary MMA(III)
species induced a complete CFE inhibition already at 1µM exposure
(IC50=0.03µM) (Figure 15A).
Figure 14. CFE response in Balb/3T3 cells exposed for 72h to different concentrations of inorganic As species (A) or to phenylated organoarsenic species (B).

Results
64
Figure 15. CFE response in Balb/3T3 cells exposed for 72h to different concentrations of methylated organoarsenic species considered As metabolites in mammals (A) or related to “seafood arsenic” (B).
10.1.2 Morphological transformation assay
Table 22 summarizes the analytical data of the concurrent cytotoxicity and
morphological transformation assay carried out on Balb/3T3 cells exposed to
inorganic (As(III), As(V) and AsF) or organic As (MMA(V), MMA(III), DMA(V),
TMAO, Asβ, AsCh and Ph4As) compounds.

Results
65
The following remarks can be drawn:
(i) among the 3 inorganic As species tested, As(III) and As(V) were found positive
in the transformation assay, inducing type III foci (Figure 16) in a dose-
dependent fashion. On the contrary AsF failed in inducing the formation of any
type III foci.
(ii) among the 7 organic As compounds tested only the phenylated Ph4As species
was found positive inducing a dose-dependent morphological transformation.
No biomethylated organic As species were able to induce neoplastic
transformation also at high concentration of exposure (500µM). The same
results was also obtained for the MMA(III) compound tested for morphological
transformation which was tested at low concentrations of 0.1 and 0.3µM (Table
22) being very toxic (Figure 15A).
The results of the concurrent cytotoxicity and transformation assays of As on
Balb/3T3 cells exposed to 10, 20 and 30µM of As(V) alone or in combination with
3µM of DEM are shown in Table 23.
The following remarks can be drawn:
(i) As(V) alone was significantly positive in the transformation assay at doses of 20
and 30µM.
(ii) compared to the control, the transformation frequency was significantly lower in
cells simultaneously exposed to the same As(V) concentrations and 3µM of
DEM (Tf=2.6 and 7.8 at 20 and 30µM) than in cells exposed to As(V) alone
(Tf=1.1 and 1.7 at 20 and 30µM).

Results
66
Table 22. Cytotoxicity and morphological transformation of As species in Balb/3T3 cell line. Exposure
As chemical form
Dose (µM) CFE (%)
± SD
N° type III foci / N° dishes
N° type III foci positive dishes
/ N° dishes
Transformation frequency (Tf)
p
H2O biol. 0.1% v/v 100 1 / 20 1 / 20 0,03 N.S. B(a)Pa 0.1 10.5 ± 3 13 / 20 9 / 20 13.1 < 0.001
INORGANIC As COMPOUNDS As(III) 1 78 ± 6 0 / 18 0 / 18 0.0 – As(III) 3 28 ± 4 2 / 18 2 / 18 0.6 < 0.005 As(III) 5 12 ± 2 5 / 18 4 / 18 2.3 < 0.005 As(III) 6 5 ± 2 9 / 18 6 / 18 5.7 < 0.005 As(V) 10 53 ± 2 0 / 18 0 / 18 0.0 – As(V) 20 28 ± 3 9 / 18 7 / 18 2.6 < 0.005 As(V) 30 11 ± 3 9 / 18 8 / 18 7.8 < 0.005 AsF 20 92 ± 4 0 / 18 0 / 18 0.0 –
ORGANIC As COMPOUNDS Asβ 100 90 ± 6 0 / 18 0 / 18 0.0 – Asβ 500 94 ± 3 0 / 18 0 / 18 0.0 –
AsCh 100 95 ± 3 0 / 18 0 / 18 0.0 – AsCh 500 92 ± 5 0 / 18 0 / 18 0.0 –
MMA(V) 100 99 ± 6 0 / 18 0 / 18 0.0 – MMA(V) 500 93 ± 5 0 / 18 0 / 18 0.0 – MMA(III) 0.1 53 ± 5 0 / 18 0 / 18 0.0 – MMA(III) 0.3 12 ± 4 0 / 18 0 / 18 0.0 – DMA(V) 100 94 ± 6 0 / 18 0 / 18 0.0 – DMA(V) 500 90 ± 8 0 / 18 0 / 18 0.0 – TMAO 100 89 ± 2 0 / 18 0 / 18 0.0 – Ph4As 7 37 ± 5 11 / 18 6 / 18 1.5 <0.01
a: α-benzopyrene, positive control
Table 23. Cytotoxicity and morphological tansformation of BALB/3T3 induced by As(V) alone or in presence of diethylmaleate (DEM).
Exposure
As chemical form
Dose(µM) CFE (%)
± SD
N° type III foci / N° dishes
N° type III foci positive dishes
/ N° dishes
Transformation frequency (Tf) p
H2O biol. 0.1%v/v 100 1 / 20 1 / 20 0,03 N.S. B(a)P 0.1 10.5 ± 3 13 / 20 9 / 20 13,1 <0.001 As(V) 10 53 ± 2 0 / 18 0 / 18 0.0 – As(V) 20 28 ± 3 9 / 18 7 / 18 2.6 <0.005 As(V) 30 11 ± 3 9 / 18 8 / 18 7.8 <0.005
As(V)+DEM 20 49 ± 5 5 / 18 3 / 18 1.1 <0.02 As(V)+DEM 30 26 ± 4 6 / 18 4 / 18 1.7 <0.01
DEM 3 88 ± 6 1 / 18 1 / 18 0.05 N.S. a: α-benzopyrene, positive control

Results
67
Figure 16. TypeIII foci induced in Balb/3T3 exposed to As(III) (A) or As(V) (B).
10.1.3 Behaviour in culture medium
Figure 17 illustrates the chromatograms of As(III), As(V), MMA(V), DMA(V), Asβ
and AsCh after incubation for 72h with complete DMEM as obtained by HPLC-
ICPMS. Compared to the chromatogram obtained at T=0, after 72h all chemical As
species tested were eluted with the same retention time (Rt) and unchanged peak
area.
Figure 17. Stability of organic and inorganic As species after incubation for 72h in DMEM.
Time (min)
Arb
itrar
y un
it
A B

Results
68
10.1.4 Uptake
Table 24 summarizes the analytical results of the uptake of As by Balb/3T3 cells,
expressed as fgAs/cell, exposed for 24h to organic As (MMA(V), DMA(V), TMAO,
Asβ, AsCh, Ph4As) or inorganic (As(III), As(V), AsF) species, while Figures 18 and
19 show the corresponding curves expressed as pmol/106cells/h.
The following remarks can be drawn:
(i) the uptake of As in Balb/3T3 cells after incubation with inorganic As(III), As(V)
and AsF was dose-dependent. Exposure to equimolar concentrations of the three
As compounds resulted in about 4-fold higher incorporation of As in cells
exposed to As(III) compared to As(V) and AsF (Figure 18).
(ii) the uptake of As by cells after incubation with organic As compounds was also
linear with the dose. At high dose exposure (500µM) the As content ranged from
50.8 to 104.8fgAs/cell for TMAO and AsCh respectively. Concerning the organic
As species present in “seafood”, in the concentration range tested the cellular
uptake of As (on average) was 2.8-fold higher for AsCh than Asβ. Exposure to
the organic compound that was found transforming (Ph4As) led to an uptake of
1.11fgAs/cell which was about 10 and 3-times lower compared to the
transforming activity of As(III) and As(V) respectively.

Results
69
Ph4A
s
0.03
4
-
0.43
1.11
1.46
1.89
- - - - -
AsC
h
0.05
8
0.17
0.52
-
2.57
-
4.23
-
13.3
21.6
104.
8
Asβ
0.01
3
0.07
7
0.11
-
0.86
-
1.76
-
5.77
8.60
58.9
TM
AO
0.03
2
0.06
5
0.12
0.43
0.72
-
1.53
-
5.76
10.6
50.8
DM
A(V
)
0.03
0.12
0.22
0.68
0.83
-
1.62
-
8.70
12.5
72.9
MM
A(V
)
0.02
0
0.11
0.16
-
1.01
-
2.38
- -
17.3
80.5
AsF
0.24
-
1.42
-
7.91
- -
14.0
- - -
As(
V)
0.16
0.58
1.19
3.42
6.32
-
11.0
15.1
- - -
U
ptak
e (f
gAs/
cell)
a
As(
III)
0.67
2.75
4.51
13.7
20.1
-
40.7
60.5
- - -
Dos
e ex
posu
re
(µM
)
0.1
0.5 1 3 5 7 10
20
50
100
500
a: M
MA
(III
) has
bee
n te
sted
onl
y at
1.0µM
dos
e ex
posu
re le
adin
g to
an
upta
ke o
f 5.7
1fgA
s/ce
ll
M
ean
of 3
det
erm
inat
ions
, RSD
<15%
Tab
le 2
4. U
ptak
e of
As b
y B
alb/
3T3
cells
exp
osed
for
24h
to d
iffer
ent c
once
ntra
tions
of v
ario
us A
s spe
cies
.

Results
70
Figure 18 Uptake of As by Balb/3T3 exposed for 24h to inorganic As compounds.
Figure 19. Uptake of As by Balb/3T3 exposed for 24h to organic As compounds.

Results
71
10.1.5 Intracellular distribution and binding to biomolecules
Table 25 reports the intracellular repartition of As in Balb/3T3 cells exposed for 1,
24 and 72h to 0.1 and 3µM of As(III), to 3 and 30µM of As(V) and to 20µM AsF.
At non-toxic doses of exposure (0.1µM for As(III), 3µM for As(V) and 20µM for
AsF) 92-98% of cellular As was present in the cytosol. At toxic doses these
percentages decreased to 78-85% (As(III)) and to 81-94% (As(V)).
Table 26 and Figure 20 show the results of the experiments concerning the nature
and the binding of As incorporated into cytosol as determined by 73As radiotracer,
Tam’s method coupled with solvent extraction procedure (Section 4.1.1) and gel
filtration (Section 4.1.5).
The following remarks can be drawn:
(i) in the cytosol of Balb/3T3 exposed for 72h 0.1µM 73As(III) or 3µM 73As(V),
73As was recovered in the different Tam’s fractions including those
corresponding to the biomethylated forms as MMA(V) and DMA(V) (Table 26).
Such organic species were not detected in the case of AsF as determined by
NAA of the Tam’s fractions. Interestingly, exposure to As(III) did not lead to
appreciable amount of As(V) (1.1%) while in cell exposed to As(V) 86.5% of As
was in trivalent state.
(ii) gel filtration of the 73As-cytosol on Sephacryl S200 resin after exposure of
Balb/3T3 cells to 0.1 and 0.5µM of 73As(III) shows two peaks of As in the
eluate: a first small in association with high molecular weight components
(about 10% of the cytosolic As) and a second major peak emerging in the region
of low molecular weight components (Figure 20).

Results
72
Table 25. Intracellular repartition of As in Balb/3T3 cells exposed to inorganic 73As(III), 73As(V) or AsF species.
As content (% of the total homogenate)a As(III) As(V) AsF
0.1µM 3µM 3µM 30µM 20µM Exposure
(h)
Pellet Cytosol Pellet Cytosol
Pellet Cytosol Pellet Cytosol Pellet Cytosol
1 5 95 22 78 3 97 6 94 3 97 24 4 96 19 81 3 97 10 90 7 93 72 8 92 15 85 2 98 19 81 5 95
a: Mean of 3-5 determinations, RSD<30%.
Figure 20. Gel filtration on Sephacryl S-200of the cytosol from Balb/3T3 cells exposed to 0.1 and 0.5µM of 73As(III).
10.1.6 Biomethylation
Table 26 summarizes the data on the speciation of As (Tam's method and solvent
extraction, Section 4.1.1) in cell-containing medium and in the cytosol of Balb/3T3
cells exposed for 72h to 0.1, 3 and 20µM As(III), As(V) and AsF respectively.
The following remarks can be drawn:
(i) As(III) exposure: more than 94% of As was present in the organic phase of the
DTTC extraction (As(III) fraction). Less than 5% was eluted in H2O and
NH4OH fractions (biomethylated forms).

Results
73
(ii) As(V) exposure: the As repartition in the different fractions of the cytosol were
similar to that of As(III). In cell-containing medium 12,6% of As appeared in the
fraction corresponding to As(III).
(iii) AsF exposure: less than 2,5% were extracted in the organic phase from DDTC
solvent extraction. No significant As was detected in the fractions corresponding
to biomethylated forms.
Table 26. Speciation of As: (i) in the cytosol of Balb/3T3 cells exposed for 72h to 0.1µM 73As(III), 3µM 73As(V) and 20µM AsF (ii) in cell-containing culture medium.
As species (% whole samples)a Fraction As species
Cytosol Cell-containing
medium 73As(III)
Whole cytosol or cell-containing medium
100 100
0.5M HCl As(III)+As(V) 96.2 98.2 DDTCb organic phase As(III) 94.6 96.7 DDTCb aqueous phase As(V) 1.6 1.5 H2O MMA(V) 2.1 0.4 4M NH4OH DMA(V) 1.7 1.4
73As(V) Whole cytosol or cell-containing medium
100 100
0.5M HCl As(III)+As(V) 94.5 97.6 DDTCb organic phase As(III) 92.8 12.6 DDTCb aqueous phase As(V) 1.7 85.0 H2O MMA(V) 3.4 0.8 4M NH4OH DMA(V) 2.1 1.6
AsF Whole cytosol or cell-containing medium
100 100
0.5M HCl As(III)+As(V) 100 100 DDTCb organic phase As(III) 2.1 1.2 DDTCb aqueous phase As(V) 97.9 98.8 H2O MMA(V) ND ND 4M NH4OH DMA(V) ND ND
a: mean of 3 determinations, RSD<30% b: DDTC=diethyldithiocarbamate

Results
74
10.1.7 Effect of As(III) on NCG, protein and nucleic acid
Figures 21-24 show the curves concerning the effect of exposure of Balb/3T3 cells to
0.4, 1 and 3µM As(III) on NGC, protein, DNA and RNA content.
The following remarks can be drawn:
(i) there is a clear inhibition of cell proliferation for all the doses tested (Figure 21).
(ii) a gradual increase of total protein can be observed from 0.35mg/106cells in
unexposed cells to 1mg/106cells in cell exposed to 3µM of As(III) (Figure 22).
(iii) the RNA content increased from 80µg/106cells at 0.4µM As(III) to
185µg/106cells at 3µM, while the total DNA was double compared to control
values for exposed cells at all the dose studied (Figure 23). The ratio
RNA/DNA increased linearly as a function of the dose (Figure 24).
Figure 21. Number of Cell Generation (NCG) of Balb/3T3 cells exposed to different concentrations of As(III). Basal mean value=5.2NGC.

Results
75
Figure 22. Total cell protein in Balb/3T3 cells exposed to different concentrations of As(III). Basal mean value=0.35mg/106cells.
Figure 23. Total DNA and RNA of Balb/3T3 cells exposed to different concentrations of As(III). Basal mean values: DNA=27µg/106cells; RNA=2523µg/106cells.

Results
76
Figure 24. Ratio DNA/RNA for Balb/3T3 cells exposed to different concentrations of As(III).
10.1.8 Binding of As(III) to DNA
Table 27 reports the results of the As incorporated into DNA from Balb/3T3 cells
after exposure for 72h to 0.5µM 73As(III) as determined by NucleoSpin method
(Section 4.3) while Table 28 summarizes the data concerning the ultrafiltration of a
solution obtained in vitro by incubating 0.5µM 73As(III) with DNA previously
isolated from Balb/3T3 cells.
The following remarks can be drawn:
(i) no significant As content (<0.005ngAs) was found in DNA fraction isolated
from Balb/3T3 after exposure to 73As(III) (Table 27).
(ii) no significant As content was found retained on the ultrafiltration
membrane(Table 28).

Results
77
Table 27. Incorporation of As into DNA isolated from Balb/3T3 exposed to 0.5µM 73As(III) for 72h.
As contenta Fraction ngAs/fraction %
Homogenate 7.2 100 Eluate 6.3 86.4 Washings 0.9 13.6 DNA fraction <0.005 ~0.0004 a: mean of 3 determinations, RSD<15%
Table 28. Ultrafiltration of DNA, previously isolated from Balb/3T3 cells, incubated in vitro with 0.5µM 73As(III).
As contenta Fraction ngAs/fraction %
Incubation mixture 38 100 Ultrafiltrate 27.4 72.2 Washings 10.6 27.8 Membrane ~0.007 ~0.0005 a: mean of 3 determinations, RSD<10%

Results
78
10.2 Cadmium
Results reported are related to the exposure of cells to CdCl2·2H2O (Cd(II)). They
concern: cytotoxicity, morphological transformation (including the influence of the
glutathione (GSH) depletion), uptake, intracellular distribution, binding to cytosolic
biomolecules (metallothionein) as well as to DNA and aminoacid cross-linking.
10.2.1 Cytotoxicity assay (CFE)
The cytotoxicity induced in Balb/3T3 cells exposed for 3, 24 and 72h to increasing
Cd(II) concentrations ranging from 0.5 to 20µM was analysed by CFE. The CFE
decreased gradually for the different exposure times with the increase of Cd(II)
concentrations indicating that the induced cell toxicity is time and dose-dependent.
The IC50 values drawn from the graphics of Figure 25 were 15, 7 and 4µM at 3, 24
and 72h, respectively.
Figure 25. CFE response in Balb/3T3 cells exposed to different concentrations of Cd(II).
In order to study the effect of GSH depleting agents on Cd(II) cytotoxicity,
experiments were carried out by exposing Balb/3T3 for 12h to increasing
concentrations of Cd(II) alone or in combination with 1µM buthionine-S-R-

Results
79
sulfoximine (BSO) or 10µM diethylmaleate (DEM). The concentrations of the two
depleting agents were selected after an “ad hoc” study on the determination of their
cytotoxic effects in Balb/3T3 cells as measured by CFE (Figure 26, derived IC50 at
72h were 2.3 and 18 µM for BSO and DEM, respectively).
Figure 26. CFE response in Balb/3T3 cells exposed at different times to increasing concentrations of two GSH- depleting agents (BSO and DEM).
Figure 27 shows how the inhibition of CFE was significantly higher when the cells
were simultaneously incubated with Cd(II) and BSO or Cd(II) and DEM in
comparison to the corresponding value concerning the exposure to metal alone. The
inhibition level was higher in Cd-exposed cells in presence of 10 µM DEM than of
1µM BSO. The derived IC50 in cells exposed to Cd(II) alone was 8.3µM, while this
value decreased to 6 and 3.5µM in presence of BSO and DEM, respectively.

Results
80
Figure 27. CFE response in Balb/3T3 cells exposed for 12h to different concentrations of Cd(II) alone or in combination with 1µM BSO or 10µM DEM.
10.2.2 Morphological transformation assay
Table 29 summarizes the results of the concurrent cytotoxicity and morphological
transformation assays carried out on Balb/3T3 cells exposed to Cd(II) alone or in
presence of 3µM DEM. The DEM concentration was drawn from the CFE data of
the exposure of Balb/3T3 for 72h to this GSH-depleting agent (Figure 26).
The following remarks can be drawn:
(i) morphological features of the cells changed in a consistent manner after
transformation. Differently from the non-transformed cells that grew in a
monolayer the Cd-transformed cells showed morphological changes including
invasiveness, disoriented criss-cross organization, multilayer growth, piling and
foci formation
(ii) the transformation frequency was dose-dependent for the tested Cd(II)
concentrations. Compared to the controls, the transformation frequency (Tf) was
significantly and consistently higher in Balb/3T3 cells simultaneously exposed to

Results
81
Cd(II) and 1µM DEM compared to the corresponding values in cells exposed to
Cd(II) alone (Figure 28). However, exposure to Cd alone led to no statistically
significant difference in the formation of foci type III up to 2µM while in the
simultaneous exposure to Cd and 3µM DEM a statistical significant difference
was achieved at 1µM (Table 29).
Table 29. Concurrent cytotoxicity and morphological transformation induced in Balb/3T3 cell line by exposure to Cd(II) alone or in presence of 3µM DEM.
Exposure Cd chemical
form Dose (µM)
CFE (%) ± SD
N° type III foci / N° dishes
N° type III foci positive dishes
/ N° dishes
Transformation frequency (Tf)
p
H2O biol. 0.1% v/v 100 0 / 20 0 / 20 0.00 N.S. B(a)Pa 0.1 10.5 ± 3 13 / 20 9 / 20 13.1 <0.001
Cd(II) 0.7 91±5 1 / 20 1 / 20 0.15 N.S. 1 85±7 4 / 20 3 / 20 0.40 N.S. 2 80±5 2 / 20 2 / 20 0.48 N.S. 3 67±8 9 / 20 7 / 20 1.80 1.4⋅10-3 5 48±6 18 / 20 15 / 20 3.50 1.77⋅10-6 6 24±6 13 / 20 12 / 20 4.60 5.08⋅10-7 7 12±8 8 / 20 7 / 20 7.60 0.0025
CdCl2
10 0 0 / 20 0 / 20 - - Cd(II) + 3µM DEM
0.7 80±4 2 / 20 2 / 20 0.39 N.S. 1 72±7 4 / 20 3 / 20 0.81 0.038 3 41±3 11 / 20 10 / 20 5.00 0.001 5 26±4 16 / 20 14 / 20 9.30 2.3⋅10-7 7 5±2 10 / 20 9 / 20 14.00 1.76⋅10-11
CdCl2
10 0 0 / 20 0 / 20 - - a: α-benzopyrene, positive control

Results
82
Figure 28. Transformation frequency from studies on in Balb/3T3 cell line by exposure to Cd(II) alone or Cd(II)+3µM DEM.
10.2.3 Uptake
Cadmium uptake was investigated in cells exposed to increasing Cd(II)
concentrations ranging from 0.5 to 10µM for 3, 24 and 72h.
Cadmium uptake by cells, expressed as nmolCd/106cells, was a concentration-
dependent process (Figure 29). The accumulation increased linearly up to 2µM at 3h
post-exposure and to 5µM at 24 and 72h post-exposure, then the Cd taken up by cells
leveled off or slightly decreased. Interestingly, the uptake of Cd at 72h in presence of
1µM DEM was similar to that of cells exposed to Cd(II) alone.

Results
83
Figure 29. Uptake of Cd by Balb/3T3 cells exposed to Cd(II) alone or in presence of DEM
10.2.4 Intracellular disribution
Table 30 reports the time course intracellular repartition between cells organelles and
cytosol of the accumulated Cd examined after 24 and 72h cells exposure to
increasing Cd(II) concentrations.
At both times considered and up to 3µM Cd(II) exposure, the element was
consistently recovered into cytosol (from 98.4 to more than 99% of the cell-
associated Cd) and only 2-3% was recovered associated to cell organelle. At higher
doses (5 and 7µM) a decreasing of the metal in the cytosol of the order of 10% was
observed which was matched by an increase of the element in cell organelles.

Results
84
Table 30. Intracellular repartition of Cd between cytosol and cell organelles (pellet) of Balb/3T3 cells exposed for 24 and 72h to Cd(II), and association of cytosolic Cd to cadmium-binding protein (Cd-BP).
ngCd/106cells
24h 72h
Cytosol Cytosol
Dose (µM)
Pellet Whole Cd-BP
Pellet Whole Cd-BP
0.5 0.03 5.6 5.6 0.12 7.0 7.0 0.7 0.03 9.1 9.1 0.16 12.3 12.3 1 0.40 15.3 15.3 0.51 25.2 25.2 2 0.90 47.2 47.2 1.7 55.4 55.4 3 1.4 68.0 68.0 3.3 78.4 78.4 5 10.4 138.6 116.2 15.1 153.1 120.5 7 16.7 135.5 114.0 21.9 160.7 124.2
a: mean of 3 determinations, RSD<10%
10.2.5 Distribution among cellular components
Analysis of 109CdCl2 content in Superdex-75 eluates after application of the
110000xg supernatant (cytosol) showed that, after 72h of exposure to 1µM Cd, the
metal was bound only to a low molecular weight component (Cd-BP) eluted at
Ve/Vo=2.2÷2.6 (molecular weight of 6KDa) (Figure 30C). However, at dose
exposure of 5µM Cd, two other small but obvious peaks of 109Cd emerged in the
chromatogram in association with UV absorbing material: the first was eluted after
the void volume (Ve/Vo=1, high molecular weight components), approximately
accounting for 3% of the total cytosolic Cd; the second (approximately 7% of the
cytosolic Cd) appeared in the region of molecular weight components <3KDa
(Figure 30D).

Results
85
Figure 30. Superdex-75 elution profiles of cytosol from Balb/3T3 cells exposed to 1µM and 5µM 109Cd(II) and 35S-cysteine for 72h.

Results
86
10.2.6 Induction of Cd-BP
To further investigate whether Cd accumulation in the cytosol corresponded to
enhanced synthesis of Cd-BP, Balb/3T3 cells were exposed or not to 109CdCl2 in
presence of 53S-cysteine. This doubly radiolabelling technique had the advantage of
being able to simultaneously follow the incorporation of sulfur and Cd into cellular
components. Figure 30 displays UV, 35S and 109Cd radioactivity profiles of the
eluates of Balb/3T3 cytosols of unexposed cells or of cells exposed to 35S-cysteine
alone or in presence of 1 and 5µM 109CdCl2 .
Three UV absorbing peaks were eluted from the column (Figure 30A): the first peak
appeared in the void volume and thus had a molecular weight >300KDa (peak I, high
molecular weight components); the second peak (peak II) emerged in the region of
75÷80KDa as determined by a molecular weight calibration curve (Figure 6),
whereas a third UV absorbing peak (peak III) was eluted in the chromatographic
region of low molecular weight (<3KDa).
Figure 30B shows the 35S radioactivity distribution in the cytosol of cells exposed to
35S-cysteine but not to 109CdCl2. Three 35S peaks emerged from the column in
association with UV-absorbing peaks I, II and III. The repartition of 35S among the
three peaks was of the order of 43, 2 and 55% of the total 35S in the cytosol. A very
small 35S peak was also present in the chromatogram at Ve/Vo=2.2÷2.6,
corresponding to the region of 6KDa.
Figures 30C and D show the 35S and 109Cd distribution in the cytosol of cells exposed
to 35S-cysteine and 1 or 5µM 109CdCl2. In cells exposed to 1µM of 109CdCl2 the
radioactivity was totally recovered in one peak, eluted in the region at
Ve/Vo=2.2÷2.6 (Cd-BP region), in association with a obvious 35S peak (Figure 30C).

Results
87
The 35S associated to Cd-BP peak accounted for about 30% of the total 35S
incorporated into cytosol.
Differently, in the cytosol of cells exposed to 35S-cysteine and 5µM 109CdCl2 a small
but significant amount of 109Cd radioactivity appeared in the chromatogram, being
distributed in the peaks I and II, which accounted for about 5 and 10% of the total
109Cd in the cytosol, respectively.
In order to confirm the protein nature of the 6KDa 109Cd- and 35S- containing Cd-BP
(Figure 30C), two “ad hoc” experiments were carried out:
(i) heat stability. Figure 31 shows that were no significant change of 109Cd and 35S
associated with 6KDa component after heat treatment (Figure 31A) compared to
the non-heated component (Figure 31B) (section 6.11). However, there was a
significant decrease in the amount of 35S recovered in the void volume peak I.
This decrease was accompanied by an increase of the 35S associated with the low
molecular weight components, peak III (Figure 31C).
(ii) UV absorption. Figure 32 shows the spectrophotometric analysis concerning the
ultraviolet absorbance of the chromatographic fractions derived from the gel
filtration shown in Figure 31C. The results of this analysis indicate that the
6KDa molecular weight component (Cd-BP) absorbed at 254nm but had a poor
absorbance at 280nm (Section 6.12). In contrast, fractions corresponding to peak
I (high molecular weight components) showed absorbance at both wavelengths.

Results
88
Figure 31. Superdex-75 elution profiles of cytosol heated (Figure 29C) or not (Figure 29B) from Balb/3T3 cells exposed to 1µM 109Cd(II) and 35S-cysteine for 72h)
Figure 32. Ultraviolet absorbance of the chromatographic Gel filtration at 280 and 254nm of DMEM arising from Balb/3T3 cells exposure to 1µM Cd(II)

Results
89
We can reasonably conclude that the 6KDa (Cd-BP) component in Balb/3T3 cells
exposed to CdCl2 is a metallothionein-like protein. Thus, from gel filtration of the
cytosols of 109Cd-exposed cells (from 0.5 to 7µM) and the measure of 109Cd profiles
in the eluates, it was possible to detect the proportion of Cd bound to Cd-BP
compared to the total Cd incorporated into the cytosol (Table 30). The results show
that up to 3µM of Cd exposure the metal in the cytosol was associated only to the
Cd-BP component, while at 5 and 7µM a significant amount, ranging from 17%
(exposure to 5µM CdCl2 for 24h) to 22.8% (7µM for 72h) was recovered in
components other than Cd-BP, in agreement with the results of Figures 30C and D.
Interestingly, the enhancement of the amount of Cd-BP, estimated by the
incorporation of 109Cd, tended to be of the same order of magnitude in Cd-treated
cells at 24 and 72h post-exposure (Table 30).
Table 31 reports the results concerning the time course effects of BSO and DEM
treatment on Cd-induced levels of 35S-cysteine incorporation into Cd-BP fraction. In
1µM Cd-exposed cells, Cd significantly induced accumulation of 35S-cysteine into
Cd-BP at 6, 12, 24 and 72h post-exposure. BSO and DEM treatment had a different
effect on Cd-induced 35S-cysteine incorporation into Cd-BP: BSO significantly
enhanced Cd-induced 35S-cysteine incorporation at 6 and 12h post-exposure. The
increases were of the order of 30% compared to the 35S-cysteine incorporation in
cells exposed to Cd alone. On the contrary, DEM decreased the 35S-cysteine
incorporation into Cd-BP (about 35% for 10µM DEM at 72h).

Results
90
Table 31. Incorporation of 35S into Cd-BP of Balb/3T3 cells exposed at different times to Cd(II) in presence or not of BSO and DEM
35S incorporated into Cd-MT (cpm x 103 ± SD) Treatment
6h 12h 24h 72h
Unexposed cells(Ctrl) 0.43 0.72 0.84 0.88 1µM CdCl2 73±6 142±11 153±16 157±18 1µM CdCl2 + 1µM BSO 96±8 181±14 - - 1µM CdCl2 + 10µM DEM 49±7 108±8 - - 1µM CdCl2 + 3µM DEM - - 112±21 103±9
10.2.7 Binding to DNA and aminoacids cross-links
Figure 33 displays the elution profiles from gel filtration on Sephadex G-25 resin of
(i) a solution of 1µM 109CdCl2 incubated in vitro for 1h with DNA previously
isolated from Cd-unexposed Balb/3T3 cells (Figure 33A) (ii) a solution of DNA
isolated by NucleoSpin from Balb/3T3 cells previously exposed for 72h to 1 or 5µM
of 109CdCl2 (Figure 33B) (iii) a solution of DNA isolated from Balb/3T3 cells
previously exposed for 72h to 1 or 5µM 109CdCl2 and simultaneously to a cocktail of
14C-aminoacids (Figure 33C).
The following remarks can be drawn:
(i) a small peak of 109Cd was found associated to DNA previously isolated from
Balb/3T3 cells. The ratio was 0.01ngCd/µgDNA (Figure 33A).
(ii) a peak of 109Cd was eluted in association to DNA fraction isolated from 109Cd-
treated cells. The ratios measured were 0.92 and 1.75ngCd/µgDNA in cells
exposed to 1 and 5µM 109CdCl2, respectively (Figure 33B). These latter values
didn’t change significantly when Cd-exposed cells were simultaneously exposed
to a cocktail of 14C-aminoacids. Interestingly, a marked presence of 14C

Results
91
radioactivity was also associated to the UV absorbing peak of DNA to which
109Cd radioactivity was bound.
In order to verify the stability of the complex 109Cd- 14C- DNA, a DNA sample, after
incubation with Tris and EDTA, was submitted to repeated washes in Ultrafree Filter
unit. Figure 34 shows the stability of Cd-induced 14C-amino acid DNA crosslinks
and 109Cd-binding in Balb/3T3 cells. Repeated washings of AA(s)-DNA complex
reduced Cd concentration without reducing AA(s) association once loosely
associated AA(s) were washed out. This indicated that the amino acids were tightly
bound to DNA, but such strong binding didn’t depend upon direct Cd presence.
Figure 33. Binding of 109Cd to DNA: previously isolated from Balb/3T3 cells (A); isolated from 1µM 109Cd-treated cells (B); isolated from 1µM 109Cd- and 14C-aminoacids (C).

Results
92
Figure 34. Stability of 109Cd-induced 14C-aminoacids DNA crosslinks in Balb/3T3 cells after 6 washings.
10.2.8 Reactive oxygen species (ROS)
The ROS level were measured in Cd-treated Balb/3T3 cells to examine the
involvement of oxidative stress in Cd cytotoxicity (Figure 35). It appears that all the
Cd concentrations tested induce an increase in ROS levels in a dose-dependent
fashion. After 1h of Cd exposure to 1, 3 and 5µM the increase was 2.1, 2.4 and 3.2-
fold higher compared to the corresponding value of unexposed cells.
Figure 35. Effect of Cd(II) on ROS generation in Balb/3T3 cells.

Results
93
10.2.9 Lipid peroxidation
In Figure 36 are presented the effects of increasing concentrations of Cd upon
thiobarbituric-acid reacting substances, TAB-RS) production, as an index of lipid
peroxidation, in Balb/3T3cells exposed for 72h to 1, 3 and 5 µM of CdCl2.
The three Cd concentration tested induced a dose-dependent formation of TBA-RS
related chromogens. Compared to the value of TBA-RS production at 1 µM the
effect at 3 and 5 µM increased of 5 and 7 –fold.
Figure 36. Effect of different concentration of Cd(II) on TBA-RS production in Balb/3T3 cells. Each point is the mean of results from three different incubations and cell preparations.
19.2.10 Inhibition of DNA synthesis
The 3H-thymidine incorporation assay was used to detect the newly synthesized
DNA in Balb/3T3 cells (Table 32). A marked increase of radioactivity of 21% was
observed in cells treated for 72h with 0.5µM Cd compared to Cd-unexposed control.
Then, the incorporation of 3H-thymidine decreased in cells of Cd-exposed groups
treated with 1, 3 and 5µM, accounting for 95, 66 and 59% of the radioactivity
incorporated compared to the control. This indicate that the stimulation or the inhibit
DNA synthesis is dependent on the Cd concentration.

Results
94
Table 32. Effect of Cd(II) on DNA synthesis in Balb/3T3 cells. 3H radioactivity
Dose (µM) cpm/106cells % of the control pa
Ctrl 5070 ± 48 100 - 0.5 6130± 96 121 S 1 4815 ± 66 95 S 3 3332 ± 81 66 S 5 2990 ± 44 59 S
a: p<0.05
10.2.11 Determination of glutathione
Glutathione is considered the most important intracellular thiol involved in the
formation of protein-mixed disulfides. Incubations of Balb/3T3 cells with different
concentrations of Cd(II) (Table 33) induced significant changes in the cellular
glutathione levels. The lowest concentration of Cd tested (0.5µM) produced a 23%
increase in intracellular glutathione compared of the control value, while the highest
concentrations tested caused a drop of control levels ranging from 6% at 1µM to
46% at 5µM.
Table 33. Levels of glutathione in Balb/3T3 cells exposed or not to CdCl2 for . Dose (µM) GSH content (nmoles/mgprotein ± SD)
Ctrl 17.3±1.4 0.5 21± 2.9 1 16.1± 4.2 2 13.2± 2.5 3 9.8± 3.7 5 8.9±3.3

Results
95
10.3 Chromium
Results reported concern Balb/3T3 cells exposed to Na2CrO4x4H2O (Cr(VI)) or
CrCl3x6H2O (Cr(III)). They are related to the following studies: cytotoxicity,
morphological neoplastic transformation, behaviour in culture medium, uptake,
intracellular distribution, binding to cytosolic biomolecules, determination of the
oxidation state of Cr in the cytosol and culture medium and binding to DNA.
10.3.1 Cytotoxicity assay (CFE)
Figure 37 shows the cytotoxicity of Cr on Balb/3T3 cells after 72h of exposure to
different concentrations of Cr(VI) and Cr(III) ranging from 0.1 to 100µM as
determined by CFE assay.
The following remarks can be drawn:
(i) the cytotoxic effect of Cr in cells exposed to Cr(VI) was dose-dependent. A
complete inhibition of the CFE was observed at 15µM (IC50=7µM).
(ii) no significant CFE inhibition was observed in Balb/3T3 for all doses of Cr(III)
tested.
Figure 37. CFE response in Balb/3T3 cells exposed for 72h to different concentrations of Cr(VI) and Cr(III).

Results
96
10.3.2 Morphological transformation assay
Table 34 reports the results of the concurrent cytotoxicity and morphological
transformation assay of Cr on the Balb/3T3 exposed to different concentrations of
Cr(VI) amd Cr(III).
The following remarks can be drawn:
(i) Cr(VI) was significantly positive (p<0.05) in the assay for the tested doses
ranging from 1 to 10µM. Increasing doses caused a dose-related increase of the
transformation frequency, from 0.1 at 1µM to 6.9 at 10µM.
(ii) exposure of Balb/3T3 cells to 10 and 50µM Cr(III) failed in inducing type III
foci.
Table 34. Concurrent cytotoxicity and morphological transformation induced in Balb/3T3 cell line by exposure to Cr(VI) and Cr(III).
Exposure
Metal form Dose (µM) CFE (%) ± SD
N° type III foci / N° dishes
N° type III foci positive dishes
/ N° dishes
Transforming frequency (Tf)
p
H2O biol. 0,1% v/v 100± 0 / 20 0 / 20 - - B(a)P 0,1 8.3 ± 3.1 11 / 20 8 / 20 12.4 < 0.001
Cr(VI) 1 88 ± 4.3 2 / 20 1 / 20 0.1 < 0.05 Cr(VI) 5 66 ± 4.4 16 / 20 9 / 20 3.8 < 0.01 Cr(VI) 10 22 ± 2.1 18/ 20 10 / 20 6.9 < 0.01 Cr(III) 10 88 ± 5.3 0 / 20 0 / 20 - – Cr(III) 50 85 ± 6.6 0 / 20 0 / 21 - -
10.3.3 Behavior of Cr(VI) in cell-free or cell-containing culture medium
Table 35 reports the data concerning the oxidation state of chromium, determined by
Minoia’s method (Section 4.1.3), after incubation of 0.1 and 20µM 51Cr(VI) in cell-
free culture medium or in the medium after exposure of Balb/3T3 cells to the same
concentrations of chromate.

Results
97
The following remarks can be drawn:
(i) for all times of incubation considered, more than 95% of 51Cr in the cell-free
medium was recovered in the organic phase suggesting that the oxidation state +6
was unchanged (Table 35). Ultrafiltration study shows a recovery of 51Cr in the
filtrate, suggesting that no binding with proteins occurred (Table 36).
(ii) after 72h an amount of 51Cr, increasing with time, was detected in aqueous phase
suggesting that a reduced species of Cr(III) was formed from Cr(VI).
Table 35. Oxidation state of Cr after incubation of 1µM and 10µM 51Cr(VI) for 72h with cell-free or cell-containing medium.
51Cr radioactivity (% of the amount incubated)a Organic phaseb Aqueous phaseb
Time of incubation
(h) 1µM 10µM 1µM 10µM
Cell-free medium 0.25 98 98 2 2
4 96 95 4 5 24 96 99 4 1 72 98 97 2 3
Cell-containing medium 0.25 90 93 10 7
4 61 79 39 21 24 52 67 48 33 72 22 35 88 65
a: mean of 3 determinations, RSD<15% b: aqueous phase: Cr(III); organic phase: Cr(VI)
Table 36. Ultrafiltration of cell-free medium 15min and 72h after incubation with 1µM and 10µM 51Cr(VI).
51Cr radioactivity (% of the amount incubated)a Fraction 15min 72h
Cell-free medium 100 100 Ultrafiltrate 99.5 98.7 Membrane 0.5 1.3 a: mean of 3 determinations, RSD<20%

Results
98
10.3.4 Uptake
Figure 38 shows the curves of the uptake of 51Cr by Balb/3T3 cells exposed for 72h
to concentrations of 51Cr(VI) ranging from 1 to 8µM while Figure 39 illustrates the
timed uptake of 51Cr by the cells exposed to 4µM 51Cr(VI).
The following remarks can be drawn:
(i) the rate of 51Cr uptake by cells was dose-dependent for both alive and death
cells.
(ii) at the end of the exposure to 1 and 8µM the Cr content of alive cells were 24.2
and 895fgCr/cell while the corresponding values for the dead cells were 55 and
1980fgCr/cell (Figure 38).
(iii) already after 4h the accumulation of Cr in alive and died cells was obvious
(Figure 39).
(iv) the amount of total Cr into died cells was 529fgCr/cell. This value was almost
unchanged at 24h (511fgCr/cell) lowering to 450fgCr/cell at 72h.
(v) the content of Cr in alive cells at 4h was 67fgCr/cell. This value increased to
333fgCr/cell at 4h, then decreasing to 196fgCr/cell at 72h.
Figure 38. Cr uptake in alive and died Balb/3T3 cells exposed to 51Cr(VI)for 72h.

Results
99
Figure 39. Kinetic of uptake of 51Cr in Balb/3T3 cells exposed to 51Cr(VI) at different time.
10.3.5 Intracellular distribution
The intracellular distribution of absorbed 51Cr was examined after exposure of cells
for 72h to 0.1and 7µM of 51Cr(VI) (Table 37).
The following remarks can be drawn:
(i) at 0.1µM 75.3% of the intracellular 51Cr was present in the cytosol. Among
cellular organelles the nuclear fraction incorporated the highest amount of 51Cr
(15.6% of the homogenate).
(ii) at 7µM the intracellular distribution of 51Cr changed. Compared to 0.1µM the
percentage of 51Cr into the cytosol decreased to 26.2% leading to an increase of
51Cr associated to organelles (46.8% in the nuclear and 18,5% in the
mitochondrial fractions)
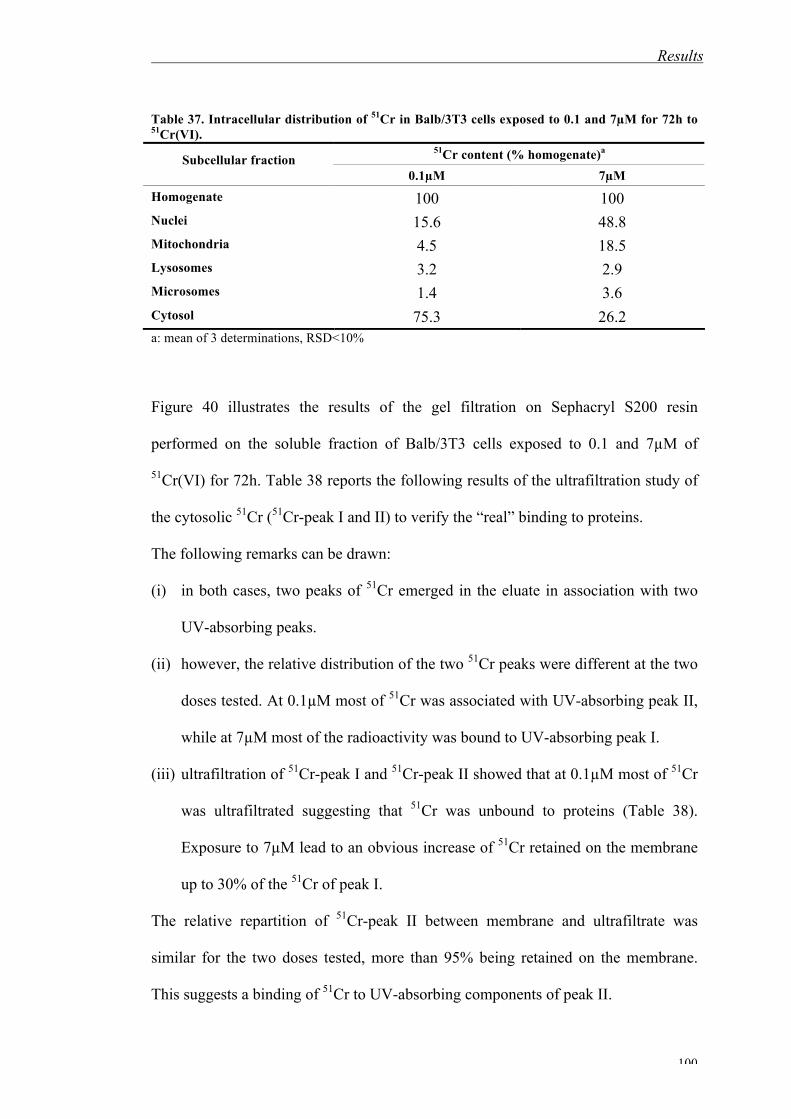
Results
100
Table 37. Intracellular distribution of 51Cr in Balb/3T3 cells exposed to 0.1 and 7µM for 72h to 51Cr(VI).
51Cr content (% homogenate)a Subcellular fraction 0.1µM 7µM
Homogenate 100 100 Nuclei 15.6 48.8 Mitochondria 4.5 18.5 Lysosomes 3.2 2.9 Microsomes 1.4 3.6 Cytosol 75.3 26.2 a: mean of 3 determinations, RSD<10%
Figure 40 illustrates the results of the gel filtration on Sephacryl S200 resin
performed on the soluble fraction of Balb/3T3 cells exposed to 0.1 and 7µM of
51Cr(VI) for 72h. Table 38 reports the following results of the ultrafiltration study of
the cytosolic 51Cr (51Cr-peak I and II) to verify the “real” binding to proteins.
The following remarks can be drawn:
(i) in both cases, two peaks of 51Cr emerged in the eluate in association with two
UV-absorbing peaks.
(ii) however, the relative distribution of the two 51Cr peaks were different at the two
doses tested. At 0.1µM most of 51Cr was associated with UV-absorbing peak II,
while at 7µM most of the radioactivity was bound to UV-absorbing peak I.
(iii) ultrafiltration of 51Cr-peak I and 51Cr-peak II showed that at 0.1µM most of 51Cr
was ultrafiltrated suggesting that 51Cr was unbound to proteins (Table 38).
Exposure to 7µM lead to an obvious increase of 51Cr retained on the membrane
up to 30% of the 51Cr of peak I.
The relative repartition of 51Cr-peak II between membrane and ultrafiltrate was
similar for the two doses tested, more than 95% being retained on the membrane.
This suggests a binding of 51Cr to UV-absorbing components of peak II.
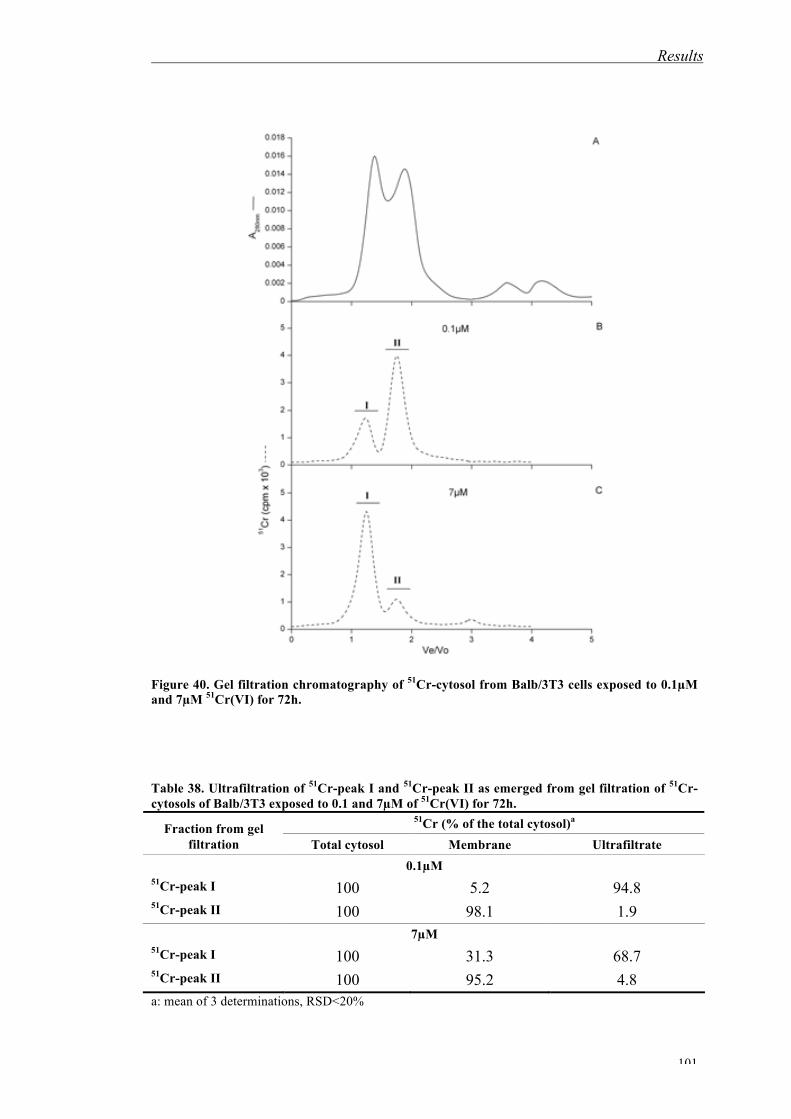
Results
101
Figure 40. Gel filtration chromatography of 51Cr-cytosol from Balb/3T3 cells exposed to 0.1µM and 7µM 51Cr(VI) for 72h. Table 38. Ultrafiltration of 51Cr-peak I and 51Cr-peak II as emerged from gel filtration of 51Cr-cytosols of Balb/3T3 exposed to 0.1 and 7µM of 51Cr(VI) for 72h.
51Cr (% of the total cytosol)a Fraction from gel filtration Total cytosol Membrane Ultrafiltrate
0.1µM 51Cr-peak I 100 5.2 94.8 51Cr-peak II 100 98.1 1.9
7µM 51Cr-peak I 100 31.3 68.7 51Cr-peak II 100 95.2 4.8 a: mean of 3 determinations, RSD<20%

Results
102
10.3.6 Oxidation state of Cr in the cytosol
Table 39 summarizes the data of the determination (Minoia’s method, Section 4.1.3)
of the oxidation state of Cr recovered in association with the two peaks emerging in
the eluates of the gel filtration of 51Cr-cytosol of Balb/3T3 cells exposed to 0.1 and
7µM of 51Cr(VI) (Figure 40).
The following remarks can be drawn:
(i) at 0.1µM 92.9% of 51Cr-peak I was recovered into the organic phase, suggesting
that the Cr was in oxidation state +6. This percentage decreased to 60.4% at
7µM exposure.
(ii) at the two doses tested more than 90% of 51Cr-peak II was recovered in the
aqueous phase suggesting that almost Cr was in the oxidation state +3.
Table 39. Oxidation state of Cr of 51Cr-peak I and 51Cr-peakII as emerged from gel filtration of 51Cr-cytosol of Balb/3T3 exposed to 0.1µM and 7µM of 51Cr(VI) for 72h.
51Cr (% of the fraction)a 0.1µMb 7µMb Fraction Aq. Phase Organic Phase Aq. Phase Organic Phase
51Cr-peak I 7.8 92.2 39.6 60.4 51Cr-peak II 91.6 8.4 90.7 9.3
a: mean of 3 determinations, RSD<10% b: aqueous phase: Cr(III); organic phase: Cr(VI)
10.3.7 Binding of Cr to DNA
Table 41 summarizes the results of the isolation by NucleoSpin of 51Cr-DNA adducts
from Balb/3T3 cells exposed to 7µM of 51Cr(VI) for 72.
The following remarks can be drawn:
(i) a significant amount of Cr was recovered associated to the total DNA fraction
(9.9ng) isolated from cells at the end of exposure.

Results
103
(ii) the 51Cr-DNA radioactivity was not ultrafiltrable (Table 42) being retained on the
membrane. When this fraction was resuspended and chromatographed on
Sephadex G25 a peak of 51Cr emerged in association with the absorbing peak of
DNA.
Table 41. Binding of 51Cr to DNA from Balb/3T3 cell exposed to 7µM of 51Cr(VI) for 72 as determnated by NucleoSpin method.
Cr contenta Fraction ng %
Cellular homogenate 235.4 100 Eluate 208.3 88.5 Washings 17.2 7.3 DNA fraction 9.9 4.2 a: mean of 3 determinations, RSD<15%
Table 42. Ultrafiltration of the 51Cr-DNA isolated from Balb/3T3 cells exposed to 7µM of 51Cr(VI) for 72h.
51Cr (% DNA fraction)a Fraction ng %
Total DNA fraction 8.3 100 Membrane 8.2 98.7 Ultrafiltrate 0.1 1.3 a: mean of 3 determinations, RSD<10%
Figure 40. Binding of 51Cr(VI) to DNA isolated from Balb/3T3 cells incubated with 7µM 51Cr(VI).

Results
104
Table 43. 51Cr-DNA adduct isolated from Balb/3T3 cells exposed to 7µM of 51Cr(VI) for 72h. Fraction 51Cr (% of the initial radioactivity)a
Submitted to solvent extraction (Minoia's method)
100
Aqueous phaseb 95.2 Organic phaseb 4.8 a: mean of 3 determinations, RSD<10% b: aqueous phase: Cr(III); organic phase: Cr(VI)

Results
105
10.4 Platinum
Hereafter are reported the results on Balb/3T3 cells exposed to inorganic cationic and
anionic Pt compounds. They concern the following studies: cytotoxicity, behaviour
in culture medium, uptake, intracellular distribution and binding to biomolecules.
10.4.1 Cytotoxicity assay (CFE)
Figures 41 and 42 display the inhibitory effect on CFE in Balb/3T3 cells exposed to
different concentrations of Na2PtCl6, Na2PtCl4, PtCl2 and PtCl4.
The following remarks can be drawn:
(i) the inhibition of CFE was dose-dependent for the four compounds tested. The
cationic Pt compounds in the oxidation state +4 (PtCl4) inhibited CFE at much
less extent compared to the corresponding divalent compound (PtCl2). On the
contrary, the tetravalent hexachloro salt (Na2PtCl6) inhibited CFE at higher extent
compared to the corresponding divalent tetrachloro salt (Na2PtCl4).
(ii) the derived IC50 from the curves of Figures 41 and 42 were: 75µM Na2PtCl4; 4µ
Na2PtCl6; 3µM PtCl4 and 0.5µM PtCl2
Figure 41. CFE of Balb/3T3 exposed to PtCl2 or PtCl4 for 72h.
[Pt] (µM)

Results
106
Figure 42. CFE of Balb/3T3 exposed to Na2PtCl4 or Na2PtCl6 for 72h.
10.4.2 Behaviour in culture medium
Figures 43 shows the elution profiles of PtCl2, PtC4, Na2PtCl4 or Na2PtCl6 after
30min incubation in DMEM as obtained by HPLC-ICPMS. Figure 44A displays the
elution profile of Na2PtCl6 after incubation with histidine while Figure 44B shows
the chromatogram of the same salt after 24h of incubation with complete culture
medium.
The following remarks can be drawn:
(i) PtCl2: two main peaks, not completely separated, emerged in the eluate
(Retention time, Rt=8.8min and 9.03min).
(ii) PtCl4: a main peak with Rt=8.35min was found.
(iii) Na2PtCl4: two main peaks were eluted at Rt=7.80min and 8.35min respectively.
(iv) Na2PtCl6: two main peaks were eluted at Rt=7.90min and 8.20min respectively.
(v) in the eluate from all four Pt compounds tested a small peak emerged at
Rt=13.5min.
(vi) incubation of Na2PtCl6 with histidine led to a main peak with Rt=7.90min.
[Pt] (µM)
Na2PtCl4 Na2PtCl6

Results
107
(vii) at 24h post-incubation of Na2PtCl6 with DMEM the elution profile drastically
changed compared to the corresponding profile at 30min.
Na2PtCl4 in complete DMEM Figure 43. Chromatograms of Pt compounds after 30min incubation with complete DMEM (by ICPMS).
Figure 44. Chromatograms of Na2PtCl6 in aqueous solution incubated with histidine for 2h (A) and after incubation with DMEM for 24h (B) (by ICPMS).
Figure 45 shows the signals of DMEM after incubation from 0 to 8days with
platinum compounds, in particular reports the NMR spectra concerning the
Time (min) Time (min)
Time (min) Time (min)
Time (min) Time (min)
Na2PtCl6 in Histidine Na2PtCl6 in DMEM after 24h
A B
C D
Na2PtCl4 in complete DMEM
A B
Arb
itrar
y u
nit
Arb
itrar
y u
nit
Arb
itrar
y u
nit
Arb
itrar
y u
nit
Arb
itrar
y u
nit
Arb
itrar
y u
nit

Results
108
experiments with PtCl2, the spectra concerning PtCl4, Na2PtCl4 and Na2PtCl6 are not
reported.
The following remarks can be drawn:
(i) PtCl4 shows the disappearance of histidine signals after 1h from the sample
preparation, Na2PtCl4 and Na2PtCl6 after 16h and PtCl2 after 3days. The
disappearance of histidine signals can be due to the formation of insoluble Pt-
His2 complex.
(ii) the histidine presence in the insoluble fraction was comfirmed by 13C-NMR
characterization, obtaining a characteristic signals of histidine carbons.
(iii) the formation of Pt-His2 complex was confirmed by mass spectrometry analysis,
obtaining the characteristic histidine mass (156.048g/mol) and the
corresponding Pt-His2 complex mass (503.128/mol).
Figure 45. NMR signals of DMEM incubated from 1h to 8days with PtCl2. Arrow: histidine signal.

Results
109
10.4.3 Uptake
Tables 44 reports the results of the uptake of Pt (fgPt/cell) by Balb/3T3 cells exposed
for 3, 24 and 72h to different concentrations of Na2PtCl6 and Na2PtCl4, while Figure
44 displays the corresponding curves expressed as pmol/106cells/h. Table 35
summarizes the corresponding data at 72h for exposure to PtCl2 and PtCl4.
The following remarks can be drawn:
(i) the amount of 191Pt associated with cells exposed to Na2PtCl6 was dose-
dependent and qualitatively similar for all the doses tested.
(ii) the uptake of Pt by cells was highest during the first hours of exposure (Figure
46). At concentrations <1µM Na2PtCl6 the uptake of Pt was linear with the dose.
The amounts of Pt associated with the cells exposed to 1µM Na2PtCl6 for 72h
were of the order of 2.0pmol/106cells/h. At higher exposure, the total Pt taken
up leveled off of decreased (Figure 46).
(iii) at equimolar concentrations of exposure (0.1µM), the amounts of Pt
incorporated were 2.34fgPt/cell (Na2PtCl4)); 1.51fgPt/cell (Na2PtCl6)) (Table
44); 0.22fgPt/cell (PtCl4) and 0.07fgPt/cell (PtCl2) (Table 45).
Table 44. Uptake of Pt by Balb/3T3 exposed to different concentrations of Na2
191PtCl6 and Na2
191PtCl4. Pt (fg·cell-1)a
Na2PtCl6 Na2PtCl4 Treatment
(µM) 4h 24h 72h 3h 24h 72h
0.03 - 0.30 0.21 0.05 0.41 0.69 0.41 0.49 1.15 0.62 0.1 0.96 1.56 1.51 1.04 3.58 2.34 0.5 4.66 12.38 7.29 5.12 15.59 19.25 1 8.02 19.71 25.44 3 9.93 21.54 28.88 2 - - 35.76 10.16 37.13 48.13 5 9.78 20.17 24.75 13.06 59.59 66.01
10 7.11 16.04 26.13 11.92 68.30 - a: mean of 3-5 determinations, RSD<10%

Results
110
Figure 46. Uptake of Pt by Balb/3T3 cells exposed for 4, 24 and 72h to different concentrations of Na2
191PtCl6.
Table 45. Uptake of Pt by Balb/3T3 exposed to PtCl4 and PtCl2 for 72h. PtCl4
a PtCl2a Treatment
(µM) pmol/106cells/hb fg/cell pmol/106cells/hb fg/cell
0.1 0.016 0.22 0.005 0.07 0.5 - - 0.038 0.52 0.7 - - 0.075 1.03 1 0.114 1.57 - - 3 - - - - 7 1.197 16.46 - -
a: mean of 3-5 determinations, RSD<15% b: basal value = <0.001fgPt·cell-1
10.4.4 Intracellular distribution and binding to biomolecules
Table 46 summarizes the results of the intracellular distribution of Pt in Balb/3T3
cells exposed for 4 and 72h to 1 and 10µM of Na2191PtCl6 and Na2
191PtCl4.
The following remarks can be drawn:
(i) after 4 and 72h of exposure to 1 and 10µM Na2191PtCl4, 62.4 to 69% of the 191Pt
cell-associated was recovered in the cytosol, while 16.6 to 20.4% of
radioactivity was found incorporated into the nuclear fraction.

Results
111
(ii) after 4 and 72h of exposure to 1µM Na2191PtCl6, the 191Pt incorporated into cells
followed an intracellular pathway similar to that of Na2PtCl4. However, at 10µM
Na2191PtCl6 a different pathway of Pt accumulated by cells was observed. The
amounts in the cytosol decreased to 55.3% (4h) and to 45.8% (72h). At the same
time, the percentages of Pt in the nuclear fraction increased to33.3% and 40.1%
at 4 and 72h respectively.
Table 46. Intracellular distribution of Pt in Balb/3T3 cells exposed for 72h to 1µM and 10µM of Na2
191PtCl6 or Na2191PtCl4.
Pt content (% of the total uptake)a 1µM 10µM Subcellular fraction
4h 72h 4h 72h Na2PtCl4
Homogenate 100 100 100 100 Nuclei 18.7 20.4 19.2 16.6 Mitoch+Lys 9.2 8.0 11.0 9.5 Microsomes 4.8 5.5 7.4 4.9 Cytosol 67.3 66.1 62.4 69.0 Na2PtCl6 Homogenate 100 100 100 100 Nuclei 16.4 15.2 33.3 40.1 Mitoch+Lys 8.7 4.9 7.5 9.4 Microsomes 5.1 3.3 4.0 4.7 Cytosol 69.8 76.6 55.3 45.8 a: mean of 3-5 determinations, RSD<10%

Results
112
Figure 46. Gel filtration chromatography of the 191Pt-cytosol from Balb/3T3 cells exposed to 1µM Na2
191PtCl6 for 72h.
Figure 47 shows the signals of the lysate of Balb/3T3 cells (Figure 46-1) compared
to the signal of the lysate of Balb/3T3 previously exposed to 4µM Na2PtCl6 (Figure
46-2). It is evident the disappearance of signals at 8.61 and 8.60ppm (glutathione
amilic proton signal) in the exposed cells lysate.

Results
113
Figure 47. NMR signals of lysate of unexposed Balb/3T3 cells and Balb/3T3 exposed to 4µM Na2PtCl6. Arrow: glutathione amilic proton signal.

Results
114
10.5 Vanadium
Results presented concern Balb/3T3 cells exposed to NaVO3 (V(V)) and
VOSO4x6H2O (V(IV)). Results are related to the following studies: cytotoxicity,
morphological neoplastic transformation, behaviour in culture medium, uptake,
intracellular distribution, binding with cytosolic biomolecules and to DNA.
10.5.1 Cytotoxicity assay (CFE)
Figure 48 illustrate the results of the CFE inhibition of V on the Balb/3T3 cells after
72h of exposure to different concentrations of V(V) or V(IV).
Increasing doses from 0.01 to 100µM caused a dose-related increase of cytotoxicity
for both V species. However, the effect of V(V) was much more obvious than that of
V(IV) being the complete CFE inhibition different of about one order of magnitude
(10µM and 100µM for V(V) and V(IV) respectively). The calculated IC50 were 5µM
and 50µM for V(V) and V(IV) respectively.
Figure 48. CFE of Balb/3T3 exposed to V(V) or V(IV) for 72h.

Results
115
10.5.2. Morphological transformation assay
Table 47 summarizes the results of the concurrent cytotoxicity and morphological
transformation assay carried out on Balb/3T3 cells exposed to V(V) or V(IV).
The following remarks can be drawn:
(i) V(V) was significantly positive (p<0.001) for the tested doses of 5 and 10µM
inducing type III foci in a dose-dependent fashion. On the contrary, V(IV) was not
significantly positive with a transformation frequency Tf=0.2.
(ii) compared to the control, the Tf was significantly higher in cells simultaneously
exposed to 10µM V(V) and 3µM of DEM (Tf=9.9) than in cells exposed to
10µMV(V) alone (Tf=3.3).
Table 47. Cytotoxicity and morphological transformation of Balb/3T3 cells induced dy vanadium salts.
Exposure
V chemical form
Dose (µM)
CFE (%) ±SD
N° type III foci / N° dishes
N° type III foci positive dishes / N°
dishes
Transformation frequency
(Tf) p
NaVO3 10 6 ± 2.2 8 / 18 9 / 18 3.3 <0.001 NaVO3 5 52 ±4.7 8 / 18 5 / 18 1.1 <0.001 NaVO3 + DEMa 10 7 ± 2.1 12 / 18 10 / 18 9.9 <0.005 VOSO4·5 H2O 10 26 ± 3.3 1 / 18 1 / 18 0.2 NS
DEMa 3 89 ± 6.4 0 / 18 0 / 18 0.05 NS H2O 0.1% 100 0 / 18 0 / 18 0.05 - a: DEM=diethylmaleate
10.5.3 Behaviour of V in culture medium
Table 48 summarizes the results of the Chelex 100 chromatography of cell-free
medium alone of incubated for 4h and 72h with 10µM of 48V(V). The same Table 48
shows also the data concerning the medium after incubation of Balb/3T3 cells for 4h

Results
116
and 72h with both 48V species. Figure 49 shows the 48V profiles from gel filtration of
cell-free medium at 4 and 72h incubation.
The following remarks can be drawn:
(i) in all cases considered at 15 min more than 94% of V was recovered in the
eluate suggesting that the element was in the oxidation state +5.
(ii) at 4h and 72h of incubation of 48V(V) with DMEM alone or as complete
medium more than 93% of 48V was still recovered in the eluate, indicating that
the original V(V) was still in pentavalent form.
(iii) after incubation with cells, the 48V of the medium recovered in the eluate
drastically decreased to 18.7 at 4h reaching 7.7% at 72h. This indicates a
biotransformation of the original V(V) to a tetravalent form.
(iv) gel filtration of 48V in cell-free medium culture medium shows two peaks of 48V
associated to high molecular weight components (about 10% of total 48V) and a
main third peak of 48V eluted in the low molecular weight region (Figure 49).
Table 48. Chelex 100 chromatography of cell-free medium incubated with 10µM 48V(V) for 15min, 4 and 72h, and of the medium after exposure of Balb/3T3 cells for 4 and 72h to both 48V species.
48V(% of V(V) chromatographed)a t=15min 4h 72h
DMEM medium
Chelex Eluate Chelex Eluate Chelex Eluate Alone 1.0 99.0 2.2 98.8 1.9 98.1 Complete (+10%FBS) 1.4 98.6 7.1 92.9 6.2 93.8 Complete after incubation with cells
5.8 94.2 81.3 18.7 90.3 9.7
a: mean of 3 determinations, RSD<20%

Results
117
Figure 49. Gel filtration chromatography of 48V after incubation of 10µM 48V(V) with complete DMEM medium for 4 of 72h.
10.5.4 Uptake
Table 49 reports the analytical data (expressed as fg/cell) of 48V incorporated into
Balb/3T3 cells after 72h of exposure to different concentrations of V(V) and V(IV)
while Figure 50 displays the corresponding incorporation rate expressed in
pmol/106cells/h.
The following remarks can be drawn:

Results
118
(i) the amount of 48V associated with the cells was dose-dependent for all doses
tested. At V(V) concentrations lower than 1µM the uptake was linear with the
dose (Figure 50). At higher exposure the total V taken by the cells decreased, the
highest amount incorporated being at 3µM (26.9fg/cell) (Table 49). At such
concentration the incorporation rate was 7.8pmol/106cells/h). (Figure 50)
(ii) the 48V uptake of V(IV) was quantitatively different compared to V(V), the
highest amount incorporated being 79.5fg/cell at 20µM (Table 49)
(incorporation rate 23pmol/106cells/h, Figure 50).
Table 49. Uptake of V by Balb/3T3 cells exposed for 72h to 48V(V) and 48V(IV). V (fg/cell)a Treatment
(µM) V(IV) V(V)
0.01 0.66 0.09 0.05 5.2 0.48 0.1 9.3 1.3 0.5 24.2 7.3 1 32.1 16.9 3 55.3 26.9 5 62.2 22.1
10 72.6 16.6 20 79.5 10.4 50 69.1 -
100 48.4 - a: mean of 3-5 determinations, RSD<10%

Results
119
Figure 50. Uptake of V by Balb/3T3 exposed for 72h to 48V(V) or 48V(IV).
10.5.5 Intracellular distribution and binding to biomolecules
Table 50 reports the results of the intracellular distribution of V in Balb/3T3 cells
exposed for 72h to V(V) or V(IV) while Figure 51 shows the corresponding gel
filtration of 48V-containing cytosol.
The following remarks can be drawn:
(i) at non-toxic dose tested (0.1µM) more than 95% of the 48V was recovered in the
cytosol for both V species while less than 5% was associated to cellular
organelles (Table 50).
(ii) at 10µM of V(IV) most of the 48V was still found in the cytosol, the intracellular
distribution being similar to that at 0.1µM. Differently, incubation of cells with
10µM V(V) led to a decrease of the amount of 48V into cytosol to 76.3% and a
corresponding increase of 48V associated to cell organelles to 23.7% (Table 50).
(iii) after exposure of cells to 10µM of 48V(V) or 48V(IV), gel filtration of the 48V-
cytosol shows that 48V radioactivity was eluted as three peaks: two in association
with UV-absorbing peaks (the first immediately after the void volume; the

Results
120
second in the region of the chromatogram corresponding to a mol.wt of 70-
80KDa); the third 48V peak emerged in the position of the 48V alone (Figure 51).
(iv) although the 48V profiles in the gel filtration chromatogram were qualitatively
similar for both V species the relative proportion of the two protein-associated
48V was different being the first 48V peak higher in the case of V(IV) compared
to the corresponding peak from V(V) exposure (Figure 51).
Table 50. Intracellular distribution of V in Balb/3T3 cells exposed to 48V(V) and 48V(IV) for 72h. V content (% of the total homogenate)a
Subcellular NaVO3 VOSO4·5H2O fraction 0.1µM 10M 0.1µM 10M
Homogenate 100 100 100 100 Nuclei 2.5 13.6 2.1 1.7 Mitoch + Lys 1.7 9.5 1.3 1.5 Microsomes 0.4 0.6 0.8 0.6 Cytosol 95.4 76.3 95.8 96.2
a: Mean of 3-5 determinations, RSD<30%.

Results
121
Figure 51. Gel filtration chromatography of 48V-cytosol from Balb/3T3 cells exposed to 10µM 48V(VI) and 48V(VI) for 72h.
10.5.6 Oxidation state of V in the cytosol
Table 51 summarizes the data, obtained bi Chelex 100 chromatography, on the
determination of the oxidation state of V associated to the three peaks from gel
filtration of 48V-cytosol from cells exposed for 72h to 10µM V(V) or V(IV) (Section
4.1.5).

Results
122
The following remarks can be drawn:
(i) for both V(V) and V(IV) exposure, more than 96% of the 48V associated with
UV-absorbing peak I and peak II was retained on the column suggesting that V
was in the oxidation state +4.
(ii) in the treatment with 48V(IV) more than 98% of the 48V eluted as peak III was
retained on the Chelex 100 resin (oxidation state +4). However, in case of V(V),
this value decrease to 74.6% (oxidation state +4) while 25.4% was recovered in
the elute still in oxidation state +5.
Table 51. Chelex 100 chromatography of 48V containing peaks obtained by gel filtration of the 48V-cytosols from Balb/3T3 cells exposed to 10µM of 48V(V) and 48V(IV) for 72h.
48V (% of the total fraction) Fraction Chelex 100 columna Eluatea
48V(V) Peak I 97.3 2.7 Peak II 96.5 3.5 Peak III 74.6 25.4
48V(IV) Peak I 99.9 0.1 Peak II 98.6 1.4 Peak III 99.0 1.0 a: Chelex 100 column=V(IV), eluate=V(V)
10.5.7 Binding of V to DNA
Figure 52 shows the chromatograms from gel filtration on Sephadex G25 resin of a
solution of 48V(V) incubated in vitro with DNA previously isolated from unexposed
Balb/3T3 cells (Figure 52A), and of a 48V-containing DNA fraction isolated from
cells exposed to 5µM of V(V) (Figure 52B) by NucleoSpin method (Table 6).
The following remarks can be drawn:

Results
123
(i) no peak of 48V radioactivity emerged in association with the UV-absorbing peak
of DNA after in vitro incubation of 48V(V) with the nucleic acid (Figure 52A).
(ii) a significant 48V radioactivity was found in DNA fraction isolated by Nucleospin
from cells exposed to 48V(V) (Table 52). When the DNA fraction was
chromatographed on Sephadex G25 the 48V radioactivity was recovered in
association with the DNA UV-absorbing peak (Figure 52B).
Figure 52. Binding of 48V(V) to DNA previously isolated from Balb/3T3 cells (A) or isolated from Balb/3T3 cells incubated with 48V(V) (B).
Table 52. Binding of 48V to DNA: (A) after in vitro incubation of 48V(V) with DNA previously isolated from cells, (B) from exposed Balb/3T3 cells incubated with 5µM 48V(V) for 72h.
48V contenta In vitro incubation DNA from exposed cells Fraction
ngV/fraction % ngV/fraction % Homogenate 120 100 120 100 Eluate 103.44 86.2 101.40 84.5 Washings 16.36 13.8 18.48 15.4 DNA fraction <0.00036 <0.0003 0.12 0.1 a: mean of 3-5 determinations, RSD<15% b: 5µM 48V(V) incubated with 317µg DNA

Results
124
11. Studies on PC12 cell line
Hereafter are reported the results concerning the studies carried out on Mn(II) and
Mn(VII) in PC12 cell line. Results are related to the following studies: behaviour in
culture medium, determination of cell viability, uptake, intracellular distribution,
effect on reactive oxygen species.
11.1 Manganese
11.1.1 Cell viability (MTT)
Figure 53 shows the results concerning the cell viability inhibition by MTT assay on
the PC12 cell line after 24h of exposure to different concentrations of Mn(II) and
Mn(VII). The following remarks can be drawn:
(i) a dose-dependent inhibition of cell viability is evident for both species
(ii) the effect of Mn(VII) is higher than the effect induced by the exposure of cells to
Mn(II). The calculated IC50 were 15 and 150µM for Mn(VII) and Mn(II)
respectively.
Figure 53. Cell viability by MTT assay of PC12 cells exposed to different concentration of Mn(II) or Mn(VII) for 24h.

Results
125
11.1.2 Behaviour in culture medium
Figure 54 shows the elution profiles from gel filtration chromatography on Sephadex
G-150 resin of RPMI medium (serum free or complete) incubated for 1h with 1µM
54Mn(II).
The following remarks can be drawn:
(i) analysis of the 54Mn in the eluate from chromatography of serum free 54Mn -
RPMI 1640 shows only one peak of radioactivity in association with a small UV
absorbing peak in the region of low molecular weight (<3KDa).
(ii) the corresponding gel chromatography of complete 54Mn-RPMI 1640 (Section
7.2) reveals two 54Mn peaks in the eluate; a first, accounting approx for 90% of
the radioactivity recovered in the eluate, in correspondence of the region of 75-
80 KDa, a second (about 10% of the total 54Mn) appearing in the low molecular
weight(<3KDa).

Results
126
Figure 54. Gel filtration chromatography of RPMI 1640 medium previously incubated for 1h with 1µM 54Mn(II). A: serum free RPMI; (B): complete RPMI; (C): after incubation of PC 12 cells for 1h.
The chemical form o Mn in culture medium was also investigated by NMR.
Figure 55 shows the NMR spectra of serum free RPMI after incubation from 1h to
4days with 100 µM Mn(II).
The following remarks can be drawn:
(i) at 1h the signals appeared larger than normal spectra (normal spectra not
showed), probably it is due to the paramagnetic properties of Mn(II).

Results
127
(ii) after 2days this effect disappears gradually, at 4days the spectra appears similar
to the normal diamagnetic spectra showing slim signal, but with disappearance
of histidine signals. The last effect is an index of: (a) the formation of a
precipitate (e.g. an insoluble Mn-histidine complex), (b) the presence of a
paramagnetic species (c) the coexistence of both previous situations.
.
Figura 55. NMR spectra of serum free RPMI incubated from 1h to 4days with 100 µM MnCl2. Circle: histidine signal.
11.1.3 Uptake
54Mn (as MnCl2 or KMnO4) uptake was quantified after incubation for 3 or 24h of
PC12 cells with concentrations of 54Mn(II) or 54Mn(VII) ranging from 0.1 to 500µM.

Results
128
Figure 56 displays the uptake of 54Mn, expressed as pmol/106cells/h, by cells
exposed to the two chemical forms of Mn.
The following remarks can be drawn:
(i) the rate of 54Mn(II) uptake was maximal at 3h of incubation and for
concentration of 10µM. At higher concentrations of exposure a constant value of
the uptake was reached up to 100µM and then decreasing at the highest
concentration tested (500 µM).
(ii) the trend of the uptake rate of 54Mn(II) at 24h was similar to that at 3h;
however, the rate of uptake at 24h was constantly lower than the corresponding
values at 3h.
(iii) in the range of the doses tested, the uptake of 54Mn(VII) at 24h was
considerably higher than the corresponding uptake of54Mn(II), although
qualitatively the trend was similar to that of the cationic species.
Figure 56. Uptake of Mn by PC12 cells exposed for 3 or 24h to different concentrations of Mn(II) or 24h for Mn(VII).
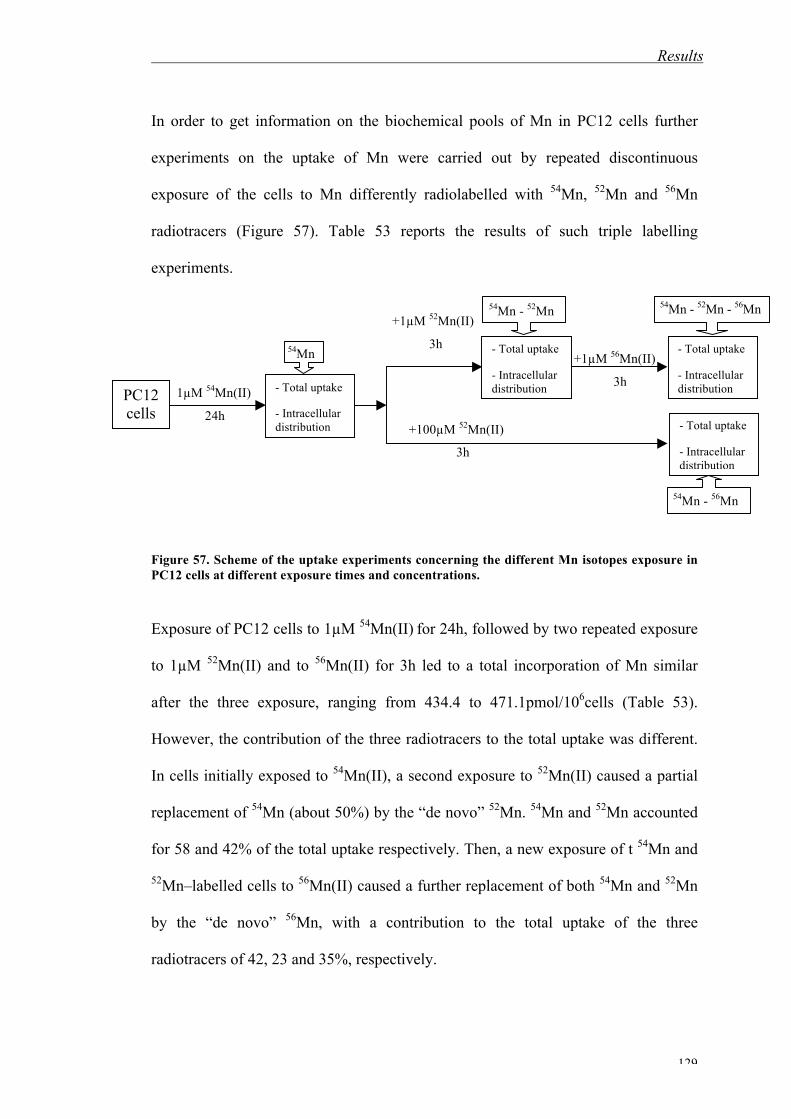
Results
129
In order to get information on the biochemical pools of Mn in PC12 cells further
experiments on the uptake of Mn were carried out by repeated discontinuous
exposure of the cells to Mn differently radiolabelled with 54Mn, 52Mn and 56Mn
radiotracers (Figure 57). Table 53 reports the results of such triple labelling
experiments.
Figure 57. Scheme of the uptake experiments concerning the different Mn isotopes exposure in PC12 cells at different exposure times and concentrations.
Exposure of PC12 cells to 1µM 54Mn(II) for 24h, followed by two repeated exposure
to 1µM 52Mn(II) and to 56Mn(II) for 3h led to a total incorporation of Mn similar
after the three exposure, ranging from 434.4 to 471.1pmol/106cells (Table 53).
However, the contribution of the three radiotracers to the total uptake was different.
In cells initially exposed to 54Mn(II), a second exposure to 52Mn(II) caused a partial
replacement of 54Mn (about 50%) by the “de novo” 52Mn. 54Mn and 52Mn accounted
for 58 and 42% of the total uptake respectively. Then, a new exposure of t 54Mn and
52Mn–labelled cells to 56Mn(II) caused a further replacement of both 54Mn and 52Mn
by the “de novo” 56Mn, with a contribution to the total uptake of the three
radiotracers of 42, 23 and 35%, respectively.
PC12 cells
1µM 54Mn(II)
24h
- Total uptake - Intracellular distribution
54Mn
+1µM 52Mn(II)
3h
54Mn - 52Mn
+1µM 56Mn(II)
3h
54Mn - 52Mn - 56Mn
+100µM 52Mn(II)
3h
54Mn - 56Mn
- Total uptake - Intracellular distribution
- Total uptake - Intracellular distribution
- Total uptake - Intracellular distribution

Results
130
A similar experiment by exposing cells to 1µM Mn(II) for 24h and then to 100µM
56Mn(II) for 3h led in an elevation of the uptake from 434.4 to 3771.2pmol/106cells.
After the second exposure, 39% of the 54Mn was replaced by the “de novo” 56Mn,
being the relative contribution of 54Mn and 56Mn to the total uptake of 7 and 93%,
respectively.
Table 53. Uptake of different Mn(II) isotopes in PC12 cells at different exposure times and concentrations.
Exposure Uptake (pmol/106cells)
Compound Dose (µM)
Time (h)
Total From 54Mn2+ From 52Mn2+
From 56Mn2+
54Mn(II) 1 24 434.4 ± 12.3 434.4 ± 12.3 - -
+ 52Mn(II) 1 3 471.7 ± 11.5 271.9 ± 10.8 199.7 ± 8.9 -
+ 56Mn(II) 1 3 450.1 ± 14.2 199.6 ± 7.4 135.5 ± 5.7 116-0 ± 4.0 54Mn(II) 1 24 434.4 ± 9.8 434.4 ± 12.3 - -
+ 56Mn(II) 100 3 4171.2 ± 32.5 268.5 ±. 12.0 - 3902.7 ± 41.9
11.1.4 Intracellular distribution
The subcellular distributon of 54Mn in PC12 cells exposed for 24h to 1, 10, 100µM
54Mn(II) is reported in Table 54.
At very low exposure concentrations the major part of 54Mn incorporatd into cells
was present in the nuclear fraction (40.2% of the homogenate), followed by
mitochondrial+lysosomal (33.6%) and cytosol (23%) fractions. These proportions
progressively changed in the same intracellular fractions at increasing dose exposure.
With the exception of microsomal fraction a significant decrease of 54Mn was
observed in the other organelle fractions that was matched by an increase in the
cytosol in which 54Mn reached the 67.4% of the total homogenate at 100µM.

Results
131
Table 54. Intracellular repartition Mn in PC12 cells exposed for 72h to different concentrations of 54Mn(II).
54Mn content (% of the homogenate) Subcellular fraction Carrier-free
(0.08µM) 1µM 10µM 100µM
Homogenate 100 100 100 100 Nuclei 40.2 ± 5.3 32.8 ± 3.4 28.8 ± 4.4 22.1 ± 6.0 Mitochondria + Lysosomes
33.6 ± 8.0 16.7 ± 5.0 14.0 ± 5.7 7.6 ± 3.2
Microsomes 3.2 ± 2.2 3.4 ± 1.6 2.2 ± 1.3 2.9 ± 0.8 Cytosol 23.0 ± 4.6 47.1 ± 8.3 55.0 ± 6.8 67.4 ± 9.2
Similarly to the uptake experiments, in order to get information on the biochemical
pools and on the movements of Mn at subcellular level and an experiment was
carried out by exposing cells firstly to 1µM 54Mn(II) for 24h and then to 1µM
52Mn(II) for 3h, detecting the proportion of the two radiotracers into the subcellular
fractions.
After the exposure of 54Mn-labelled cells to equimolar concentrations of 52Mn(II)
both radiotracers were found incorporated into all intrcellular fractions in a mean
ratio 54Mn/52Mn of 1.54.
Table 55. Intracellular repartition Mn in PC12 cells exposed to 1µM of 54Mn(II) for 24h and then to 1µM of 56Mn(II).
54Mn and 52Mn content (% of the homogenate) Subcellular fraction Total 54Mn+52Mn From 54Mn From 52Mn R=54Mn/52Mn
Homogenate 100 60.2 39.8 1.67 Nuclei 33.5 ± 4.2 20.2 ± 4.2 13.3 ± 4.2 1.51 Mitochondria + Lysosomes
16.3 ± 5.0 9.9 ± 5.0 6.4 ± 5.0 1.44
Microsomes 5.0 ± 3.6 3.5 ± 3.6 1.5 ± 3.6 2.30 Cytosol 45.2 ± 9.3 26.6 ± 9.3 18.6 ± 9.3 1.43

Results
132
Table 56 shows the intracellular distribution of 54Mn in PC12 cells exposed for 24h
to 1 and 20µM of 54Mn(VII).
The following remarks can be drawn:
(i) the radioactivity was recovered into all subcellular fractions. At 1µM more than
60% of 54Mn of the homogenate was present in the nuclear, mitochondrial and
lysosomal fractions while cytosol accounted for 34.2% of cellular 54Mn.
(ii) at 20µM the percentage of 54Mn in the cytosol didn’change significantly.
However, although the sum of 54Mn recovered in the nuclear, mitochondrial and
lysosomal fractions was the same compared to the corresponding value at 1µM a
significant decrease of the radioactivity was found in the nuclear faction that was
matched by mitochondrial+lysosomal fraction.
Table 56. Intracellular repartition of Mn in PC12 cells exposed for 24h to different concentrations of 52Mn(VII).
52Mn content (% of the homogenate) Subcellular fractions
1µM 50µM
Homogenate 100 100 Nuclei 33.0 ± 4.6 26.0 ± 3.8 Mitochondria + Lysosomes
28.2 ± 6.8 37.5 ± 8.6
Microsomes 4.6 ± 2.5 2.9 ± 1.5 Cytosol 34.2 ± 5.1 33.6 ± 4.2
The analysis of the eluate profiles of gel filtration chromatography (Figure 58) of the
cytosol fractions from cells exposed to equimolar concentration (1µM) of 54Mn (II)
for 24h (Figure 58B) shows the presence of two “54Mn pools”, in association with
high (pool A) and with low (pool B) molecular weight components.

Results
133
A repeated exposure of these 54Mn-labelled cells to 1µM of 52Mn (II) for 3h reveals
an incorporation of the “de novo” 52Mn into the two “54Mn- pools”, decreasing at the
same time the amount of 54Mn (Figure 58C). A third exposure to 1µM of 56Mn (II)
led to the incorporation of the “de novo” 56Mn into “54Mn- and 52Mn-containing pool
A and B”, with a replacement of part of of 54Mn and 52Mn.
Figure 58. Gel filtration of cytosols from PC12 cells exposed to 1µM 54Mn(II) for 24h (B), then to a second and a third exposure for 3h to 1µM 52Mn(II) (C) and 1µM 56Mn(II) (D).

Results
134
11.1.4 Reactive oxygen species (ROS)
The ROS levels were measured to examine the involvement of oxidative stress in
Mn(II) and Mn(VII) cytotoxicity. Figure 59 shows the effect of 1 and 20µM MnCl2
and KMnO4 on ROS generation in PC12 cells. Mn(VII) induced ROS at significantly
greater amounts compared to Mn(II). The heptavalent Mn(VII) induced a 8-fold
increase in ROS levels, whereas the divalent Mn(II) induced a 3-fold increase in
ROS level compared to the control levels.
Figure 59. Effect of Mn(II) and Mn(VII) on ROS generation in PC12 cells.

Results
135
12. Studies on rat brain aggregates
Hereafter are reported the results concerning:
1. uptake and identification of biomethylated forms of As in the extract from brain
aggregates, and in culture medium at the end of the exposure.
2. vitality of isolated cell components of brain aggregates exposed to As(III) and
uptake of As by the same cells.
12.1 Brain aggregates
Table 57 reports the results of the uptake of As in brain aggregates exposed for 72h
to 1-1000µM As(III) while Table 58 shows the corresponding data on the
biomethylation in the extract from brain aggregates. Table 58 reports also the data on
the speciation of As in culture medium at the end of the experiment.
The following remarks can be drawn:
(i) the highest incorporation of As incorporated into aggregates was observed at
30µM As(III) (5ngAs/aggregate). At 100µM As(III) this value decreased to
1.4ngAs/aggregate which did not significantly changed at higher doses (Table
56).
(ii) in addition to inorganic As, biomethylated MMA(V) and DMA(V) were
identified in the extract from brain aggregates. However, while the relative
percentage of MMA(V) increased from 2 to 48% with increasing dose exposure
that of DMA decreased from 57 to 17% (Table 58). At the end of exposure of
brain aggregates biomethylated forms were found released into DMEM.
However, other unidentified As species were found (0.11 and 0.57% of the dose,
Table 57, as suggested by the amounts of As retained by the resin used in Tam’s
method (Section 4.1.1).

Results
136
Table 57. As uptake in rat brain aggregates exposed for 72h to 73As(III)a. Dose (µM) ngAs/µgProteins ngAs/aggregate
0.1 0.003 2.6 1 0.010 2.5
30 0.020 5.0 100 0.056 1.4 330 0.053 1.3
1000 0.051 1.2 a: mean of 3 determinations, RSD<15%. Basal value=0.001ngAs/µgProteins.
Table 58. Repartition of the chemical forms of As identified in complete DMEM or in the extract of brain aggregates exposed for 72h to 73As(III).
As content Aggregate (% of extract) DMEM (% of dose)
Dose (µM)
Asia MMA(V) DMA(V) Asi
a MMA(V) DMA(V) Others 0.1 41 2 57 99.3 0.14 0.49 0.11 30 35 48 17 99.3 0.09 0.03 0.57
a: Asi=total inorganic As
12.2 Isolated cells of brain aggregates
Table 59 shows the results of the uptake of As in individual cell components of brain
aggregates (neurons, microglia and astrocytes) exposed to As(III) while Figure 58
illustrates the corresponding data of cell vitality.
The following remarks can be drawn:
(i) qualitatively the incorporation of As in the three types of cells was dose-
dependent. However, from the quantitative point of view the ranking of As
uptake was astrocytes>neurons>microglia.
(ii) exposure of microglial cells to As did not significantly affect cell vitality. On the
contrary, an obvious effect was observed in case of neurons and astrocytes for
which at 30µM the vitality was inhibited.

Results
137
Table 59. Uptake of As by astrocytes, neurons and microglia after exposure for 72h to As(III). pmolAs/106cells/ha Treatment (µM) Astrocytes Neurons Microglia
0.1 0.39 0.28 0.06 1 6.19 2.20 0.37 3 11.46 4.44 1.72
10 33.15 8.00 2.65 30 57.13 29.24 11.72
a: mean of 3 determinations, RSD<15%
Figure 60. Cell vitality of microglia, neurons and astrocytes exposed to As(III) for 72h.

Discussion
138
DISCUSSION
The present research is related to the development and validation of advanced test
methods and testing strategies that could be used to reduce, refine and replace the use
of animals for the testing of chemicals substances and product by in the in vitro
system (Hartung et al, 2003). The experimental acticities foresee the use of omics
technologies for improved toxicity prediction to meet ethical, political and
commercial expectations. In this context, one of the aims is the integration of
toxicological aspects of selected inorganic compounds with ECVAM activities.
Hereafter is reported the discussion of the results achieved in the present research in
relation to the planned objectives (see Objectives) which are related to metallomics,
an emerging aspect in metal toxicology (Szpunar, 2004). In particular, metal
compounds considered (As, Cd, Cr, Mn, Pt and V) were chosen taking into account
the existing in vivo knowledge on their metabolism and mechanisms of toxicity and
induced effect which are relevant to environmental and occupational exposure . They
were selected as potential models of metal compounds for future validation studies
(Sabbioni et al, 1999) concerning the toxicological areas here considered such as
neurotoxicity (PC12 cell line and rat brain re-aggregates) and carcinogenic potential
(Balb/3T3 cell line).

Discussion
139
Carcinogenic potential of As, Cd, Cr, Pt and V compounds
Hereafter a discussion is reported concerning the research on carcinogenic potential
of As, Cd, Cr, Pt and V in Blab/3T3 cell line.
Check of chemical purity of metals compounds used in cell transformation assay
A key factor of the in vitro study of the carcinogenic potential of metal compounds
concern their chemical purity. Elemental impurities of the salts tested, particularly
those with the same chemical affinity of the metal under study, could create artifacts
regarding the cytotoxic and transforming response, being in same cases the
impurities transforming by themselves. It is the case of vanadate which is in the same
chemical group of chromate, a well known potent cytotoxic and transforming
compound in mammalian cells (Elias et al., 1991). Thus, the knowledge of Cr
contamination in V salts to be tested for their carcinogenic potential.
In our work, analysis by NAA, ICPMS and GFAAS of the As, Cd, Cr, Pt and V salts
used for carcinogenicity studies showed levels of impurities which were judged too
low to induce either cytotoxic and morphological transformation in the Balb/3T3 cell
line (Table 20). Consequently, we can exclude that in our experiments the observed
type III foci were due to the presence of chemical impurities added to the culture
medium with the salts tested, being in any case the estimated contaminations in
culture medium less than 0.01µM under our experimental conditions.
Arsenic
The experiments on As compounds related to the cytotoxicity and morphological
transformation confirmed previous findings (Bertolero et al., 1987) on strictly

Discussion
140
relationships between cytotoxicity/carcinogenic potential and the chemical form of
the element to which cells were exposed (Table 22).
Interesting results have been obtained in our work by using a new pentavalent
inorganic (AsF) and organic (Ph4As and MMA(III)) As species. In spite of its
inorganic nature, NaAsF6 was not toxic and not transforming in Balb/3T3 cell line
(Table 22). In addition in spite of its organic nature Ph4As was cytotoxic and
transforming while MMA(III) was far more cytotoxic than inorganic As(III) but not
transforming. These findings are of particular interest because As toxicology
considers the inorganic but not the organic As species harmful to various types of
mammalian cells (Abernathy et al., 1990). Our findings on inorganic AsF and
organic Ph4As explode this thinking stressing the great importance of speciation of
this metalloid in inducing biological effects. In this context, the observation on the
uptake of the pentavalent AsF compared to that of the corresponding inorganic
pentavalent Na2HAsO4 is of particular value. At equimolar concentrations of
exposure (5 and 20µM) the amount of As incorporated into cells were of the same
order of magnitude for the two species, leading about 3 and 4 times lower than those
of the toxic trivalent As(III) (Table 24). Thus, the completely different effects
induced by the two pentavalent inorganic species do not seem due to the amount of
As present into the cell but rather to a different metabolisation of the two species
accumulated by cells. This was confirmed by the experiments on speciation of As
accumulated by cells exposed to As(III), As(V) and AsF (Table 25). In all cases, As
was mainly incorporated into cytosol (Table 26). However, while for As(II) and
As(V) mono- and dimethylated As species were identified in the cytosol and in
culture medium at the end of exposure, in case of AsF exposure, no biomethylated
species were detected. This suggests that into cells the fluorine-As bonding in of

Discussion
141
NaAsF6 is highly stable, compared to the oxygen-As bonding in of Na2HAsO4,
explaining why AsF is not metabolised and excreted as such in culture medium
(Table 26). A further support to this hypothesis is drawn from the experiments of gel
filtration of the As-containing cytosol of cells exposed to As(III), As(V) and AsF. In
case of As(III) about 10% of As was associated to high molecular components
(Figure 20). Similar results was found for As(V), while in the cytosol of cells
exposed to AsF no binding of As with proteins was found (data not reported).
Concerning the cytotoxicity and transforming response of Balb/3T3 cells exposed to
Ph4As we underline that at equimolar non-toxic and at toxic concentrations of Ph4As
and As(III) (0.1µM and 5µM) the uptake of the organic species was about 20 and 30
times lower compared to the corresponding values of As(III) and about of the same
order of other toxic organic species (MMA(V), DMA(V), TMAO, Asβ, AsCh,
Ph4As) (Table 24).
A particular mention merits the findings on methylarsonous MMA(III). Our results
confirm that this compound is a potent toxin (Styblo et al, 2002) and, for the first
time, we proved that is not able to induce in vitro neoplastic morphological
transformation (Table 22). We hypothised that a “metabolic deviation” of MMA(III)
from the normal pathway to non toxic DMA(V) may be linked to the carcinogenicity
of inorganic As(III). Our results don’t support this hypothesis. Interestingly, at
0,1µM MMA(III) exposure, the amount of As accumulated into cells was about 10
times higher compared to that incorporated into Balb/3T3 cells exposed to the
transforming inorganic As(III). This finding is in agreement with the hypothesis that
biomethylated As metabolites containing trivalent As may activate As as a potent
toxin, but no as carcinogen.

Discussion
142
Considering that also in Balb/3T3 the biomethylation of As(III) would be a
detoxication mechanism and that the bioreduction of As(V) to As(III) by GSH would
be part of this process (Bertolero et al., 1987) it is reasonable to assume that the
observed cytotoxicity and morphological transformation induced by As(V) in these
cells may be related to the ability of the GSH-dependent mechanism to reduce
As(V). In order to verify this hypothesis, the cells were exposed to As(V) alone or in
combination with diethylmaleate (DEM), a well known cellular GSH-depleting agent
(Bertolero et al., 1987). We found that in cells exposed to As(V) and DEM in
combination, CFE inhibition and morphological transformation were significantly
decreased compared to the corresponding results from cells exposed to As(V) alone
(Table 23). This suggests that the final neoplastic transformation of Balb/3T3 cells
by As(V) should be strictly related to changes in metabolic patterns of As(V) as a
consequence of the lack of its bioreduction to the more toxic As(III) by intracellular
GSH. The decreased transformation frequency in GSH-depleted cells confirms an
important role for GSH in protecting the cells against the neoplastic action of As(III).
In order to establish if As(III) is a genotoxic or non-genotoxic carcinogen an attempt
was done to isolate the adduct As-DNA from cells exposed to As(III). The results
were negative (Tables 27 and 28), suggesting that As(III) is a non-genotoxic
carcinogen.
Experiments on the effects of As(III) exposure on protein, nucleic acids content of
Balb/3T3 cells (Figures 22-24) showed a linear increase of total protein as a function
of incubated dose. This suggests a possible stimulation of specific protein synthesis
(Figure 21) and is in agreement with the observed: (i) linear increase of RNA that
indicates a possible stimulation of gene transcription (Figure 22), (ii) the double total
DNA compared to control values (Figure 23) that suggest a possible blocking of the

Discussion
143
cell in the S-phase of the cell cycle (after DNA replication), (iii) the RNA/DNA ratio
increase with the dose-level (stimulation of gene expression) (Figure 24).
Cadmium
In spite of new and significant information achieved in the last decade on multiple
mechanisms of action of Cd in in vitro systems, much more has to be elucidated
before the significance of the various pathways leading to the neoplastic
morphological transformation will be fully understood.
In the present work we have investigated the influence of some factors on the
cytotoxicity and the morphological transformation response in Cd-exposed Balb/3T3
cells. In particular, studies carried out concerned metabolic pathways (uptake,
intracellular distribution and analysis of biochemical forms of Cd in the cytosol) and
biochemical effects induced by Cd exposure (cellular glutathione (GSH) levels,
generation of oxygen reactive species (ROS) and lipid peroxidation, binding to DNA
and formation of amino acids crosslinks).
In agreement with previous in vitro studies (Saffiotti and Bertolero, 1989) the present
research on cytotoxicity and morphological transformation on Cd(II) in Balb/3T3
cells confirms the in vitro carcinogenic potential of this metal (Table 29 and Figure
28), in a clear dose-response fashion (Figure 25). Interestingly, the cytotoxic
response in cells exposed to Cd(II) in combination with two GSH-depleting agents,
BSO or DEM, was significantly more intensive compared to the corresponding
values observed in cells exposed to Cd(II) alone (Figure 27). Furthermore, a similar
finding was found for the morphological transformation: an increased transformation
frequency was observed in cells treated with Cd(II) and DEM compared to cells
exposed to Cd alone (Table 29).

Discussion
144
This suggests that glutathione may be involved in modulating the cellular Cd(II)
cytotoxic and transforming responses in Balb/3T3 cells. In fact, no significant effect
of DEM treatment on Cd(II) uptake in Balb/3T3 cells was observed (Figure 29),
suggesting that the reduced GSH content in the cells and the observed increase of
transforming activity were not due to alterations in Cd-accumulation.
Our study has demonstrated that after 72h the Cd-treated Balb/3T3 cells are able of
accumulating Cd(II) from culture medium in a linear fashion up to dose of 2µM
Cd(II). Interestingly, this is a dose which doesn’t yet induce statistically significant
morphological transformation (Table 29). Different modes of transport into cells are
possible for metal ions:(i) diffusion (ii) active transport via a receptor or carrier
system (Luckkey and Venugopal, 1979). Diffusion is only possible if the metal is
present as an uncharged complex. Uptake by diffusion, however, is linear with the
solute concentration while uptake via an active mechanism should level off when the
metal reaches a certain concentration, as it was observed in our study (Figure 29).
Iron proton-metal cotransporter DMT1 and voltage-gated calcium channels have
been reported as major carriers involved in Cd uptake in the intestinal epithelium and
in neurons (Martelli et al, 2006). Cadmium uptake is further complicated by its
possible binding to proteins immediately after entering the cell. Thus, the
intracellular free Cd pool can be effectively reduced and the rate of uptake, as
determined in our experiments, would depend on which step, transport or binding, is
the rate limiting one. Since the present study didn’t yield a clarification on what of
these factors influenced the uptake of Cd in Balb/3T3 cells, further investigations in
this area appear necessary.
The intracellular repartition of Cd between 110000xg cells pellet and supernatant
showed the metal was almost present in the cytosolic fraction (Table 30).

Discussion
145
Interestingly, more than 97% of the element was recovered in the cytosol of cells
treated with doses of Cd(II) not inducing transformation in Balb/3T3 cells ( 1-2µM,
Table 30); on the other hand, exposure to doses inducing morphological
transformation led to a decrease in the proportion of Cd in the cytosol to about 90%
of the cellular Cd which was matched by an increasing association, about 10% of the
cellular Cd, with cell organelles. The increase of Cd in the organelle fraction from
cell exposed at transforming (Table 30) is of particular interest in connection with the
mechanism(s) responsible for the morphological transformation response. Although
this work has not established to what organelle Cd was associated, several in vitro
studies have shown that Cd produces a variety of direct and indirect genotoxic effects
such as DNA strand breaks, DNA-protein crosslinks, oxidative DNA damage,
chromosomal aberrations mostly at high, cytotoxic concentrations (Waalkes, 2003).
In addition to a direct DNA damaging activity, Cd was reported to act as cancer
promoter (Liu and Templeton, 2007) and to have co-genotoxic activity, probably
interfering with DNA repair process (Hartwig and Beyersmann,1987), and perturbing
apoptosis (Yuan et al., 2000). In the present study, we found that in Balb/3T3 cells
Cd induced generation of oxygen active species ROS, lipid peroxidation, increased
synthesis of DNA, binding and crosslinks of amino acids to DNA (Table 32, Figures
33, 34, 35 and 36). Thus, the presence of an “excess” of Cd in cellular compartments
such as nuclei, mitochondria, lysosomes and lysosomes may play a role in creating
the conditions for the cytotoxicity and transforming responses induced by Cd in
Balb/3T3 cells.
We hypothesized that the ability of Balb/3T3 cells to accumulate Cd was related to
the presence of a cytoplasmatic metallothionein-like proteins. Metallothioneins are
cysteine-rich small proteins, which have been identified in the cytosol and in the

Discussion
146
nuclei of higher eukaryotic cells (Hamer, 1986). It was first discovered by
Margoshes and Vallee (Margoshes and Vallee, 1957) in equine kidney cortex and
was subsequently named metallothionein since about 20% of aminoacids residues
were comprised by cysteine. Our chromatographic studies revealed that Balb/3T3
cells incorporated 109Cd into an intracellular cytosolic component (Cd BP) that has
an approximate molecular weight of 6KDa, compatible with that of metallothionein
(Hamer, 1986) (Figure 30C and D). In contrast, Balb/3T3 cells growth in culture
medium, lacking Cd, didn’t show Cd-BP species under our experimental conditions
(Figure 30A). The protein nature of the identified 6KDa Cd BP in Balb/3T3 cells was
assessed by further experiments:
(i) doubly radiolabelled experiments. In 109Cd- and 35Scys-treated cells a
simultaneous incorporation of 109Cd and 35S into the 6KDa component was
observed (Figures 30C and D), suggesting that a “de novo” bio synthesis of the
Cd-BP occurred
(ii) heat stability experiments (Figure 31). A heat treatment of the 6KDa component
at 80°C failed to dissociate Cd from the apoprotein (Cherian and Goyer, 1978)
(Figure 31C) , while a significant proportion of 35S, initially associated with high
molecular weight components of the cytosol, shifted to small molecular weight
components, probably due to the heat denaturating effect (Figure 31C).
(iii) UV absorption experiments. The 6KDa Balb/3T3 Cd-binding component
exhibited spectral properties characteristic of metallothionein-like proteins,
showing little absorbance at 280nm and a significant absorption at 254nm, due to
the lack of aromatic aminoacids and the mercaptide bond formation between Cd
and the great number of cysteine residues (Hamer, 1986). For the first time these

Discussion
147
findings indicate that Cd-exposed Balb/3T3 cells resemble several other cell
types with respect to the presence of a metallothionein-like protein (Cd-BP).
Interestingly, at not transforming doses exposure all cytosolic Cd was in the form of
Cd-BP, while at higher transforming doses (5 and 7µM) the amount of metal in this
form accounted for about 90% of total cytosolic Cd (Table 30), suggesting the
presence of other biochemical species of Cd. The chromatographic experiments
(Figure 30) confirmed this observation: at 1µM all cytosolic Cd was recovered from
gel filtration as Cd-BP (Figure 30C), while at 5µM two other species of Cd were
present, the first in association with high molecular weight components (peak1,
Figure 30D), the second, smaller, present in the low molecular weight region (peak3,
Figure 30D). Although the nature of these biochemical pools of Cd has not been
clarified and their possible role in inducing cytotoxicity and morphological
transformation is unknown, the appearance of these new Cd species in the cytosol in
Cd-exposed transformed cells suggests that the “de-novo” biosynthesis of Cd-BP
was saturated. This supports the belief that the formation of Cd-BP would be a
process of cellular detoxication of Cd in Balb 3/T3 cells by sequestering the element
in the cytoplasm, efficiently reducing at physiological level the cellular concentration
of the “free metal”, and so acting as protective mechanism against Cd cytotoxicity.
However, metallothionein may not be the only intracellular Cd scavenger.
Glutathione, an abundant intracellular thiol with good chelating properties towards
Cd, was found in nearly all cell types. This peptide acts as an antioxidant to detoxify
a variety of endogenous and exogenous free radicals and its depletion is considered a
marker of oxidative stress (Spear and Aust, 1995). Decreased intracellular GSH
levels have been implicated in the pathogenesis of a number of degenerative
conditions and diseases including cancer (Reed, 1990). Interestingly, BSO and DEM

Discussion
148
treatment on 1µM Cd-exposed cells differently affect the levels of 35S-cys
incorporation into Cd-BP (Table 31). While BSO significantly increased, DEM
decreased the Cd(II)-induced 35S-cys incorporation into Cd-BP. This may be
explained by the different way of action of the two GSH-depleting agents. BSO
inhibits selectively the activity of γ-glutamilcysteine synthetase, the enzyme
catalyzing the first step of glutathione biosynthesis, to block GSH synthetic pathway
(Plummer et al., 1981). Its inhibiting effect lasts for a long period of time after
removal of BSO from medium. On the contrary, DEM conjugates with GSH to
deplete cellular GSH content (Griffith, 1981). Thus, the two GSH-depleting agents
potentially have opposite effects on cellular cysteine content: BSO, by inhibiting
GSH biosynthesis, “shaves” intracellular cysteine, so potentially enhancing Cd-BP
biosynthesis. On the contrary, DEM, by conjugating with and depleting cellular
GSH, could spend intracellular cysteine, potentially decreasing Cd-BP synthesis, in
case that cysteine content is the rate limiting. This suggests that GSH and Cd-BP
may have a differential role in protecting against Cd toxicity and that their additive
effects may contribute to enhance cell defense against Cd cytotoxicity in Balb/3T3
cells. Some observations concerning the marked reduction of cytotoxicity of
cadmium in cells pretreated with zinc supports this role (Ochi et al., 1988). Such
protective effect of zinc was dependent upon duration of pretreatment, being parallel
with the increased accumulation of MTs. Protection of cells from cadmium toxicity
by zinc pretreatment was as or a little more effective in the cells depleted of GSH as
in those not depleted. Thus, GSH appears to be an intrinsic protector against
cadmium toxicity, while MTs would serve as an induced cellular defense that is
mobilized against heavy metal stress, but takes more than 2h to accumulate in
significant amounts. Accordingly, this suggests that also in Balb/3T3 cells GSH and

Discussion
149
MTs may have cooperative protective roles against cadmium toxicity, as an initial
defense for the former and a second-stage defense for the latter.
The biochemical effects detected in the present study merit some further
considerations.
In the present study, the Cd treatment of Balb/3T3 cells increased significantly lipid
peroxidation (Figure 36). The process of lipid peroxidation determines the alteration
in the structure of cell membrane, being one of the consequences of oxidative stress,
a situation that occurs when the production of ROS exceeds that of the antioxidant
defense systems. The fact that the lipid peroxidation increased in response to Cd
exposure in our cells may either due to enhanced free radical generation (Shukla et
al., 1987) or depletion in the antioxidant capacity (Hussain et al., 1987). In Cd-
exposed Balb/3T3 cells we found the generation of oxygen active species ROS
(Figure 35), suggesting that Cd increased the oxidizing potential of cells undergoing
oxidant-mediated damage. However, Cd(II) is not a directly active redox metal , a
potential mechanism of oxidative damage-induced genotoxicity for redox active
carcinogenic metals such as Cr(VI), Ni(II), Co(II) (Valko et al., 2005). Since Cd(II)
does not catalyze Fenton-type reactions because it does not accept or donate
electrons under physiological conditions (Waisberg et al., 2003) the mechanism of
Cd in inducing ROS in Balb/3T3 cells may have a nongenotoxic epigenetic
component. Then, Cd-enhanced ROS in Balb/3T3 may occur via suppression of free
radical scavengers (e.g. glutathione) or by inhibition of detoxifying enzymes (e.g.
catalase, glutathione peroxidase and superoxide dismutase) (Waisberg et al., 2003) or
binding to sulfhydril groups of proteins (Valko et al., 2005). Moreover, other
possible indirect mechanism(s) could help to explain the increase of ROS induced by

Discussion
150
Cd. For example, the displacement of Fenton metals (Fe and Cu) by Cd from various
intracellular sites (Casalino et al, 1997) may increase the concentrations of ionic Cu
and Fe, which could cause oxidative stress by Fenton reactions. The fact that
desferrioxamine (a iron chelator) prevents the Cd-induced ROS formation and
cytotoxicity supports this hypothesis (Pourahmad and O'Brien, 2000). Since ROS can
act as signalling molecules (D'Autréaux and Toledano, 2007) our finding on the ROS
production in Balb/3T3 cells suggest to study if the increase of ROS induced by Cd
is involved in the induction of apoptosis and gene expression by this metal
(Fernandez et al., 2003). Furthermore, our finding on the ROS elevation with Cd
dose exposure is consistent with the observed increase of Cd in the organelles
fractions at transforming doses (Figure 35). In this context, future studies in this area
would be focussed on mitochondria, since it has been suggested that mitochondria
are the ROS sites for non-redox or poor cycling transition metals (Cd, Hg and As)
while lysosomes are sites of cytotoxic ROS formation of redox transition metals (Cu,
Cr, Ni and Co) (Pourahmad et al., 2003).
Cadmium is considered a weakly genotoxic agent (Bertin and Averbeck, 2006).Due
to the observed presence of Cd-BP in Balb/3T3 it is interesting from the mechanistic
point of view to discuss the possible role of Cd-BP in interfering with antioxidant
defense mechanisms. A study has reported the ability of Cd, when bound to
metallothionein, to induce DNA damage via radicals formed by the metallothionein
complex (Muller et al., 1994). On the contrary, other studies suggested that
metallothionein gene expression provides protection against Cd genotoxicity
(Coogan et al, 1994; Klassens et al., 1999).Our results are in agreement with the
second suggestion. In fact, if the binding of Cd to metallothionein induces radicals in
a whole cell system, one may expect that the binding of Cd to metallothionein within

Discussion
151
the cytosol would generate also radicals that should lead to radical-induced
cytotoxicity and not protection as is consistently observed. At present, the induction
of metallothionein by Cd is considered a paradox: on the one hand it binds and
detoxifies ROS, on the other hand mobilization of Cd from the metallothionein
complex increases the toxicity of the element.
We have found that in Cd-treated Balb/3T3 cells Cd doses inducing neoplastic
transfomation decrease the levels of cellular GSH (Table 29) which is known to
maintain cellular redox homeostasis and to scavenge intracellular ROS by a direct
reaction, or via the GSH peroxidase/GSH system, or the activities of superoxide
dismutase, glutathione peroxidase and catalase (El-Maraghy, 2001).Thus, in our
Balb/3T3 cells the decrease in the activity and/or intracellular levels of antioxidants
and the enhancement of ROS caused by Cd, together with the generation of radicals
that are produced during normal metabolism, probably damage the DNA and may
explain the increase in lipid peroxidation we have observed.
In this work, we have isolated a Cd-DNA adduct from Cd-treated cells (Figure 33B).
However, the binding of Cd to DNA per se didn’t give information on a possible role
of the metal in producing DNA -protein crosslinking, which could occur. For this, we
have investigated the crosslinking produced by Cd, analysing the residual 14C-amino
acids (AAs) associated to DNA (Figure 33).Since the DNA isolation involved a
proteinase k treatment, only AAs that were covalently complexed to DNA were
being analysed. This led to the isolation of a Cd-AA(s)-DNA complex (Figure 33C).
Interestingly, experiments on the stability of this complex (Figure 34) suggests that
AA(s) were tightly bound to the DNA, and that the stability of Cd-DNA complex
was enhanced when aminoacids were bound to DNA, having the metal a “promoting
action” in producing covalent AA(s)-DNA crosslinks. In general, it is recognised that

Discussion
152
some metals can directly bind DNA or form crosslinks between DNA strands or
between the surrounding protein and DNA (Waalkes, 2002) and that Cd binds only
weekly to DNA in ex-vivo systems, thus eliminating this as a potential mechanism of
DNA damage leading to mutation (Waalkes and Poirier, 1984). Our results are in
good agreement on this. The binding of Cd to DNA previously isolated from cells is
small (Figure 33A) while in DNA isolated from Cd- and AAs-treated cells (Figure
33B) we observed a Cd-AA(s)-DNA complex, presumably an indication of protein-
DNA crosslinks, lesions which could act as a possible prelude to mutation.
In conclusion, in spite of new and significant information concerning its multiple
mechanisms of action (Hartwig, 1989), much more has to be elucidated before the
relative significance of the various pathways leading to Cd carcinogenicity will be
known. Thus, the use of an in vitro system recognised as a valid model for testing the
carcinogenic potential of chemicals such as Balb/3T3 cell line is a great opportunity
to give new mechanistic insights. In this context, at present most of the attention is
focussed on the biological responses concerning the various pathways leading to the
morphological transformation of Cd and too little attention is paid to the metabolic
pathways of the element into the cell. Since this aspect is a fundamental determinant
in interpreting mechanistically the toxicological data we must keep well in the mind
this multidisciplinary approach when future experiments. in this field will be
planned.

Discussion
153
Proposed mechanisms for Cd carcinogenesis to be investigated in Balb/3T3 cell line. From Hartwing and Beyersmann, 1989.
Chromium
The experiments on cytotoxicity and morphological transformation on Cr(VI) and
Cr(III) confirmed the carcinogenic potential of Cr(VI) in Balb/3T3 cells and added
evidence that Cr(III) was not transforming to the same cell line (Table 34).
Interestingly, the experiments on the behaviour of Cr(VI) in cell-free medium
showed a high stability of the hexavalent form after 72h incubation (Table 35). This
situation changed when cells were exposed to Cr(VI). A considerable amount of Cr
was recovered as Cr(III) (Table 35). This suggests that a bioreduction of Cr(VI) by
cell components occurred. From our data it is not possible to establish if the observed
bioreduction was a consequence of the contact of Cr(VI) in the medium with cell-
constituent of the membrane or if it was an intracellular process with a subsequent
release of the trivalent species into the medium. Since it is well known that Cr(III) is
poorly absorbed and cannot be readily across cellular membranes (Bianchi et al.,

Discussion
154
1988) the hypothesis of the bioreduction of hexavalent Cr to trivalent form by
surface cell-components seems the most probable.
Our study on the uptake of Cr in Balb/3T3 exposed to Cr(VI) (Figure 38) is an
excellent example of a new approach to the study of the cellular uptake of
xenobiotics. For the first time, a study on the uptake has taken into account not only
the living but also the death cells, an intersting aspect for the interpretation of the
cytotoxic effects. We found that the curves of the uptake of Cr in living and died
cells approached with time (Figure 39). This suggests a possible presence of a
“mechanism of adaptation” of cells to the exposure of Cr(VI), becoming a part of
cells resistant to the toxic action of the hexavalent species.
Chromium accumulated by cells exposed to non-toxic (0.1µM) or toxic (7µM)
(Figure 40) dose of Cr(VI) was intracellularly distributed in a different way (Table
37). At non-toxic dose more than 75% of Cr was localised in the cytosol, while at
toxic dose the highest amount of the element was recovered into the nuclear fraction.
This suggests that a redistribution of Cr occurred intracellularly, probably after
saturation of the “physiological” binding sites in the cytosol. Gel filtration profiles of
the Cr from the cytosol of cells exposed to the non-toxic and toxic doses of Cr(VI)
supports this hypothesis (Figure 40). In addition, the experiments on the Cr-bound
proteins of the cytosol showed that at non-toxic dose Cr was mainly in the oxidation
state +3 while at toxic dose about 60% of Cr still persisted in the oxidation state +6
(Table 39). Furthermore, the isolation of DNA from cells exposed to the toxic dose
of Cr(VI) showed the presence of Cr-DNA adduct (Figure 40), in which the
oxidation state of Cr was +3 (Table 43).
These findings are in agreement with the litarature data. Cr(VI) is reductively
metabolised into cells leading to Cr(III) that forms tight comlexes with DNA,

Discussion
155
preference towards the formation of Cr(III)-guanine DNA adduct. During Cr(VI)
reduction, genetic lesions occur, including Cr-DNA binary adducts, single-strand
breaks, DNA protein crosslinks and oxidised bases (O'Brien et al., 2003).
Platinum
Experiments on inorganic platinum in anionic and cationic form confirmed how the
cytotoxic effects observed were dependent on the chemical form of the Pt compound
tested (Figure 41 and 42).
The study of Pt compounds in Balb/3T3 cells is an example of the great complexity
of how the initial chemical form of a xenobiotic can undergo to complex changes in
culture medium with the possibility of binding to the medium components (Figure
30). Thus, the observed different degree of cytotoxicity of the Pt compounds may
depend on the changes of the original chemical species generated in culture medium
(Figure 44). This raises to important questions: (i) what is the chemical species of Pt
penetrating into cells inducing the toxic effects? (ii) is the cytotoxicity results
cytotoxic effects induced by more than one Pt species?
Interestingly, after 72h, the ranking of the amount of Pt incorporated into cells
exposed to non toxic dose (0.1µM) of the Pt compounds (Tables 44 and 45) was
inversely proportional to the corresponding ranking of cytotoxicity
(PtCl2>PtCl4>Na2PtCl6>Na2PtCl4), being 0.007, 0.22, 1.51, 2.34fgPt·cell-1
respectively (Tables 44 and 45).
The intracellular distribution of the Pt in cells exposed to non-toxic doses (1µM) of
Pt chlorocomplexes (IV) and (VI) shows no obvious differences at 4 and 72h
exposure (Table 46). More than 66% of Pt was present in the cytosol. However, at
toxic dose of Na2PtCl6 (10µM) the cytosolic Pt decreased with a corresponding
increase of the element into the nuclear fraction. In addition, gel filtration of the Pt-

Discussion
156
containing cytosols from exposure to 1µM of both Pt chlorocomplexes shows similar
chromatographic profiles of Pt (Figure 46). These findings and the data concerning
the uptake of Na2PtCl6 compared to Na2PtCl4 is a further demonstration that the
oxidation state of Pt plays a critical role in inducing the final biological effects.
Moreover, the disappearance of signal at 8.60 and 8.61ppm in the lyaste of Balb/3T3
cells previously trated with Na2PtCl6 (Figure 47) is in contrast with the results
concerning the interaction of Pt compounds with culture medium (Figure 45) where
it was evident that Pt forms insoluble complex with histidine and hence not
bioavailable. The toxicity of Na2PtCl6 can be explained only with the hypothesis thet
uptake is faster than Pt-His2 complex formation.
Vanadium
Cytotoxicity and morphological transformation on cells exposed to V(V) and V(IV)
sodium salts confirmed previous results on the carcinogenic potential of the
ammonium salts of V(V), a species leading to the production of morphological
transformed Balb/3T3 cells, while the correponding ammonium salt of V(IV) was
ineffective in the transformation of the cells (Table 47) (Sabbioni et al., 1991). Table
47 confirmed also that exposure of cells to V(V) sodium salt in combination with
DEM lead to unreduced V(V) into cells significantly enhancing the type III foci
formation compared to the corresponding results from cells exposed to V(V) alone.
This further suggests that the GSH-mediated bioreduction of V(V) to V(IV) is a
detoxication mechanism in Balb/3T3 cells against the toxic effects of V(V).
Interestingly, new findings on the intracellular distribution of V(V) and V(IV) (Table
50), which were incorporated into cells at different rate (Figure 50 and Table 49),
gave further mechanistic insights in connection to the transforming potential of
V(V). At non-toxic dose of 0.1µM mainly of the cellular V in Balb/3T3 exposed to

Discussion
157
both the V species was present in the cytosol (Table 50). However, at 10µM V(V)
(toxic dose) the uptake was not linear with dose exposure (Figure 50) and more than
20% of cellular V shifted from cytosol to cellular organelles, particularly nuclei and
mitochondria. In this context, we were able to isolate a V-DNA adduct from exposed
cells (Table 52 and Figure 52B). The binding of V to DNA is only apparently in
contaddiction with the negative results previously reported on the in vitro binding of
V(V) to commercial nucleic acid (Sabbioni et al., 1993) by using a method at the
equilibrium of (Wood and Cooper, 1970). Also in the present work in vitro
experiments on the binding of V(V) to Balb/3T3 previously isolated from Balb/3T3
cells gave negative results (Figure 52A). This suggests that the observed binding of
V to DNA was cellular-mediated, probably previous bioreduction to the tetravalent
form. In addition, at 10µM V(V) and V(IV) differences in the binding to proteins and
in the oxidation state of V were observed in the cytosol (Figure 51 and Table 51).
The association of V with biomolecules in the cytosol (Figure 51) suggests that two
forms of V interact differently with cytosol components from quantitative point of
view. This could be explained taking into account the data of the uptake of V in cells
exposed to the two V species, about 5 times higher in case of V(IV) compared to
V(V) (Table 49). Since the amount of V incorporated into peak II was similar for
both V species while was different for peaks II and III, we can conclude that the
observed differences of the V profiles in the chromatogram from gel filtration
(Figure 51) may be due to a saturation of peak II by tetravalent V.
The simultaneous presence of the two oxidation state +4 and +5 in cells exposed to
toxic V(V) species (Table 51) can further reinforces the thinking that the
bioreduction of V(V) to V(IV) is a detoxication mechanism. Experiments on the
determination of the oxidation state of V in culture medium by using 48V radiotracer

Discussion
158
and Sabbioni’s method (Section 4.1.2) added new information to the previous
findings obtained by electron paramagnetic resonance (EPR) technique. This latter
technique is able to detect V in the oxidation state +4 but not in the higher oxidation
state (Sabbioni et al., 1993). Exposure to V(V), which is very stable in cell-free
culture medium, led to presence in cell-containing medium of V(IV) in a polymeric
form (Sabbioni, unpublished results). However, in this work, in the cell-containing
medium we found the presence of about 10% of V still in the oxidation state +5
(Table 51). This finding and the demonstration of the presence of pentavalent V into
cells after exposure to V(V) is of particular interest. Since the cellular bioreduction
of V(V) to (IV) is crucial to prevent the deleterious effects of V(V), the knowledge
of the amount of V(V) in the biological systems wuold be a “key point” in assessing
a safe limit of V cytotoxicity and morphological transformation. Again, this shows
the great potential of the combined use of the in vitro bioassay with the nuclear and
radioanalytical techniques (Sabbioni and Balls, 1995).
Neurotoxic effects of As and Mn compounds
Hereafter are reported findings concerning the research on neurotoxic effects of As
in rat brain re-aggregates and single cells and of Mn in PC12 cell line.
Arsenic
Rat brain re-aggregates exposed to As(III) led to interesting conclusions. Arsenic
was able to penetrate the whole aggregate (Table 57) with the formation of
biomethylated species (Table 58). The uptake of As into whole aggregates increased
at 30µM, then levelled decreasing up at 1000µM. This could be explained
considering cell vitality. At 30µM the vitality of neurons and almost astrocytes was
inhibited (Figure 60) and almost microglia survived.

Discussion
159
In the different types of cell constituents of the aggregates, the uptake of As was
mainly measured in the astrocytes (Table 59).
Manganese
Studies on humans have indicated that elevated levels of Mn may put humans at risk
of parkinsonism (Olanow, 2004). Manganese exposure is known to produce
neurotoxicity in vitro and in animal models. In particular, in vitro studies provide
evidence that Mn specifically targets the dopaminergic system. Because of the
similarities between the neurological symptoms associated with manganism and
Parkinson's disease, most research efforts in the past have focused on model cell
systems in which dopamine is the principal neurotransmitter. In this context, PC12
cells are a neuroendocrine cell line able to produce neurotransmitter dopamine (DA)
and contain functional DA metabolism pathways (Green and Rein, 1977). These cells
are widely used as a model for catecholaminergic neurons. However, in vitro studies
on Mn in PC12 cells mainly concern the relations between functional changes of
dopaminergic system during the development of Mn-induced damage. Little
attention has been paid to the metabolic pathways of Mn in the cell in relation to the
DA metabolism and the observed adverse cellular effects. This is a serious gap for
the mechanistic interpretation of the neurotoxic effects of Mn. In addition, being a
transition metal, Mn in living tissues can exist in various oxidation states such as +2,
+3, +4, +5, +6, +7, although the last three higher oxidation states are generally
unrecognized in biological materials (Keen, 1995). So, the variable valency of Mn is
extremely important, emphasizing the potential for Mn to act as prooxidant or an
antioxidant in biological medium (Aschner, 1997). The present study was designed
to assess the time course metabolic patterns of two Mn chemical forms, such as

Discussion
160
cationic divalent Mn(II) and anionic Mn(VII), in PC12 cells in relation to their
cytotoxicity.
Our findings show a clear dependence of the uptake and of the cytotoxic effects on
the oxidation state of Mn (Figures 53 and 54). In particular, uptake versus Mn
concentrations showed saturation-type kinetics. In addition, at equimolar
concentrations eptavalent Mn(VII) was taken up by cells at a greater extent than
Mn(II) (Figure 54). Thus, the extent of Mn uptake by PC12 seems an important
determinant of the different cytotoxicity observed in the case of the two chemical
species tested (Figure 53). It has been reported that Mn would be transported into
cells via a mechanism similar to that for iron (Heilig et al., 2006), as evidenced by
the fact that both Mn and iron, as well as several other divalent transition metals,
compete for uptake into a number of different cell systems (Roth et al., 2002). In
particular, two distinct but related mechanisms responsible for the transport of Mn
and ferrous ion: a transferrin-dependent and a transferrin independent pathway. The
transferrin dependent pathway proposes that the transferrin-Mn(III) complex initially
binds to the transferrin receptor (TfR) on the cell surface similar to that, which
occurs for iron. After attachment of Tf to the TfR, endosomal vesicles that are
formed at the cell surface are internalized, subsequently causing a release of the
metal from the Tf/TfR complex. Mn(III) released into the vesicles is presumably
reduced to Mn(II). This is a serious gap for the mechanistic interpretation of the
neurotoxic effects of Mn.
It is subsequently transported across the endosomal membrane via the transport
protein, divalent metal transporter 1 (DMT1; also named Nramp2, DCT1 or
SLC11A2) (Andrews, 1999). Since Mn(II) forms a relatively weak complex with
either a2-macroglobulin or serum albumin, there is also the possibility that transport

Discussion
161
of Mn(II) released from this complex can be taken up directly at the cell surface by
DMT1, independent of transferrin (Roth et al, 2002). Our dopaminergic cell type
PC12 cells also express DMT1 and TfR (Loder and Melikian, 1997). These
mechanisms assume that Mn in culture medium is present in different oxidation
states , Mn(II) and Mn(III), and that is differently complexed with proteins. Our gel
filtration and NMR studies on the behaviour of Mn in RPMI culture medium are in
agreement with the proposed mechanisms (Figure 54). Incubation of ionic Mn(II) in
culture medium leads to the disappearance of ionic form of Mn with the formation of
Mn-complexes with high molecular weights, of the order of albumin/transferrin, and
with low molecular weight, including histidine (Figures 54B). These findings are in
agreement with the tendency of Mn to form very tight complexes with
biocomponents, so that its free concentrations tend to be extremely low (Keen,
1995).
Our results from the intracellular distribution studies lead to completely new
information on the metabolic patterns of Mn in PC12 subcellular compartments.
Interestingly, in Mn(II)-exposed cells the relative distribution of the element among
cell organelles and cytosol is clear dose-dependent (Table 54). At physiological non
toxic doses of exposure a considerable percentage of cellular Mn was present in the
nuclei, mitochondria and lysosomes (more than 70% of the Mn accumulated by
cells). Increasing dose exposure shows a clear progressive decrease of the percentage
of the element in the nuclei, mitochondria and lysosomes. The decrease in the
proportion of Mn in these fractions is matched by an increasing in association with
cytosl. A recent study has underlined the presence of significant amount in the nuclei
of Mn(II)-treated RBE4, Z310, and N27 cells (Kalia et al, 2008). The same work
reports also a recovery of 27% and 69% of Mn in nuclei and cytoplasm of Mn(II)-

Discussion
162
treated PC12cells, respectively. Since such cells were exposed to 100µM, our results
at this dose exposure (Table 54) are in good agreement with Kalia’s findings.
In our PC12 cells exposed to1µM of Mn(VII) the intracellular distribution of Mn
(Table 56) resembles that of the element in cells treated with the same dose of Mn(II)
(Table 54). However, a substantial difference was found at exposure concentration of
the order of the IC50 (20µM) of Mn(VII). The amount in the cytosol remained
constant, while the percentage of Mn in the nuclei decreased, matched by an increase
in the mitochondria+lysosomes. This picture was different compared to the
intracellular distribution of Mn(II)-treated cells (Table 54).
The dynamic behavior of manganese exposures in biological systems is evidenced by
several recent studies indicating that the oxidation state of manganese added to cell
lysates or intact mitochondria rapidly changes, likely as a consequence of the
complex physicochemical and ligand binding properties of the local environment
(Gunter et al., 2004) .In order to study the dynamic movements of Mn incorporated
into Mn(II)-exposed cells unique experiments by a triple radiolabelling approach
have been carried out at cellular and subcellular level (Tables 53 and 55 and Figures
57 and 58). Such experiments have shown the presence of “different biochemical
pools of Mn” in PC12 cells exposed firstly to 54Mn(II) for 24h, then to 52Mn (II) and
again to 56Mn(II) for 3h. The partial replacement of 54Mn (first exposure) by 52Mn
(second exposure) and of 54Mn+52Mn by 56Mn (third exposure) suggests that the
internalized Mn is differently bound to cellular components: a “tightly bound pool”
and a “labile pool”. The first pool would be responsible for the retention of Mn in the
cell while the second pool would represent the mobile pool of Mn. This approach
seems of particular interest because the establishment of the role of such pools could

Discussion
163
be of great interest in explaining mechanistically the cytotoxic effects of Mn in PC12
cells.
Our study suggests a close relation among uptake, intracellular distribution and
cytotoxic effects of Mn(II) and Mn(VII) in PC12 cells, confirming the importance of
speciation as a key factor in inducing the biological response. In particular, in
addition to the common Mn(II) species we have considered a chemical eptavalent
form of Mn. Although the higher oxidation state +7 of Mn in the cell is not
demonstrated and probably is not physiologic, the KMnO4 considered was used as
“extreme tool” of speciation due its strong oxidising property which is useful from
the point of view of mechanistic understanding.
The findings of our experiments on the ROS generation further give evidence of this
(Figure 59). It was reported that Mn induces oxidative stress-mediated apoptosis in
catecholaminergic PC12 cells (Hirata et al. 1998), although another evidence indicate
that Mn(II), unlike that of iron, is a potent antioxidant and that the oxidative stress
doesn’t contribute to initiate Mn cytotoxicity (Roth et al, 2000). In the preset work
the production of ROS was significantly higher in Mn(VII)-treated cells compared to
Mn(II)-exposed cells (Figure 59). Thus, as whole our data support that the oxidation
state/chemical speciation of manganese exposure could be an important factor
mediating cellular uptake and toxicity.

Conclusions
164
CONCLUSIONS Analytical aspect of metallomics. The analytical challenges to metallomics must
reach a specificity of analytical response regard to a particular element species and
sensitivity allowing an analysis to be carried out with microsamples.
This research shows how the use of unique and peculiar nuclear, radioanalytical and
advanced spectrochemical techniques, particularly ICPMS, is a powerful analytical
tool in metalllomics research.
In vitro metallomics. The introduction of in vitro models such as Balb/3T3 and
PC12 cell lines as well as rat brain aggregates, which are relevant at ECVAM for in
vitro testing of carcinogenic potential and neurotoxicity of chemicals, allowed
important findings about qualitative and quantitative metallomics. There is no doubt
that in vitro metallomics will play a fundamental role in future investigations on the
molecular bases of many metal-dependent biochemical processes.
Metallomics, a multidisciplinary task. The present research confirms the complex
multidisciplinary character of speciation of metallomes, requiring a real cooperation
among different scientists including biochemists, toxicologists, analytical chemists,
metallorganic chemists, radiochemists, etc.

Bibliography
165
BIBLIOGRAPHY Abernathy C.O., Liu J.P., Longfellow D., et al.; Arsenic health effects, mechanisms of actions and research issues. Envirom. Health Persp. 1990, 107: 593-597. Al-Nasiry S., Geusens N., Hanssens M., Luyten C., Pijnenborg R. The use of Alamar Blue assay for quantitative analysis of viability, migration and invasion of choriocarcinoma cells. Hum Reprod. 2007, 22(5): 1304-9. Andrews N.C. The iron transporter DMT1. Int J Biochem Cell Biol. 1999, 31: 991-994. Aschner M. Astrocyte metallothioneins (MTs) and their neuroprotective role. Ann N Y Acad Sci. 1997, 825: 334-47. Baker M.A., Cerniglia G.J., Zaman A.. Microtiter plate assay for the measurement of glutathione and glutathione disulfide in large numbers of biological samples. Anal Biochem. 1990, 190:360-5. Bianchi V., Levis A.G. Review of genetic effects and mechanisms of action of chromium compounds. Sci. Total Environ. 1988, 71:99-172. Birattari C., Bonardi M., Groppi L., Gallorini M., Sabbioni E. and Stroosnijder M.F. Cyclotron production of “very high specific activity” platinum radiotracers in no carrier added form. Cyclotron and their applications 2001, Sixteenth International Conference. 2001: 52-54. Bertolero F., Pozzi G., Sabbioni E. & Saffiotti U. Cellular uptake and metabolic reduction of pentavalent to trivalent arsenic as determinants of cytotoxicity and morphological transformation. Carcinogenesis. 1987, 8: 803-808. Beuge J.A. and Aust S., Microsomal lipid peroxidation. Methods Enzymol. 1978, 51: 302-310. Bertin G. and Averbeck D.. Cadmium: cellular effects, modifications of biomolecules, modulation of DNA repair and genotoxic consequences (a review).Biochimie. 2006, 88: 1549-1559 Casalino E., Sblano C. and Landriscina C. Enzyme activity alteration by cadmium administration to rats: the possibility of iron involvement in lipid peroxidation. Arch Biochem Biophys. 1997, 346: 171-179. Cherian M.G. and Goyer R.A. Role of metallothioneins in disease Ann.Clin. Lab. Sci. 1978, 8: 91-94. Combes R., Balls M., Current R., Fischbach M., Fusenig N., Kirkland D., Lasne C., Landolph J., LaBoeuf R., Marquardt H., McCormick J., Muller L., Rivedal E., Sabbioni E., Tanaka N., Vasseur P. & Yamasaki H.. Cell transformation assay as predictors of human carcinogenicity. The report and recommendations of ECVAM, Workshop 39. ATLA. 1999, 27: 745-767.

Bibliography
166
Coogan T.P., Bare R.M., Bjornson E.J. and Waalkes M.P. Enhanced metallothionein gene expression is associated with protection from cadmium-induced genotoxicity in cultured rat liver cells. J Toxicol Environ Health. 1994, 41: 233-245. Cullen, W.R., McBride, B.C., and Reglinski J. The reaction of methylarsenicals withthiols. Some biological implications. J. Inorg. Biochem. 1984, 21:179-194. D'Autréaux B. and Toledano M.B. ROS as signalling molecules: mechanisms that generate specificity in ROS homeostasis. Nat. Rev. Mol. Cell. Biol. 2007, 8: 813-824. Di Paolo J.A.. Quantitative in vitro transformation of Syrian golden hamster embryo cells with the use of frozen stored cells. J. of the National Cancer Institute. 1980, 64: 1485-1489. Donaldson J., La Bella F.S. and Gesser D. Enhanced autooxidation of dopamine as a possible basis of manganese neurotoxicity. Neurotoxicology. 1991, 2: 53–64. Elias Z., Poirot O., Baruthio F. and Daniere M.C.. Role of solubilized chromium in the induction of morphological transformation of Syrian hamster embryo (SHE) cells by particulate chromium(VI) compounds. Carcinogenesis. 1991, 12/10: 1811-1816. El-Maraghy S.A., Gad M.Z., Fahim A.T., Hamdy M.A. Effect of cadmium and aluminum intake on the antioxidant status and lipid peroxidation in rat tissues. J Biochem Mol Toxicol. 2001, 15: 207-214. Eskes, C., Honegger, P., Juillerat-Jeanneret, L. and Monnet-Tschudi, F. (). Microglial reaction induced by noncytotoxic methylmercury treatment leads to neuroprotection via interaction with astrocytes and IL-6 release. Glia. 2002, 37: 43-52. Farina M. Applicazione di tecniche analitiche avanzate in studi in vitro di metalli in tracce mediante colture cellulari. Thesis degree, Università degli Studi di Pavia, 2003. Fernández E.L., Gustafson A.L., Andersson M., Hellman B. and Dencker L. Cadmium-induced changes in apoptotic gene expression levels and DNA damage in mouse embryos are blocked by zinc. Toxicol Sci. 2003, 76: 162-170. Greene S. Validation and in vitro neurotoxicity. Division of Toxicological Research, US Food and Drug Administration, Laurel, MD 20708, USA. Clin. Exp. Pharmacol. Physiol. 1995, 22: 747-755. Greene L.A., Tischler A.S. Establishment of a noradrenergic clonal line of rat adrenal pheochromocytoma cells which respond to nerve growth factor. Proc Natl Acad Sci U S A. 1976, 73: 2424-8. Griffith O.W. Depletion of glutathione by inhibition of biosynthesis. Methods Enzymol. 1981, 77: 59-63.

Bibliography
167
Gunter T.E., Miller L.M., Gavin C.E., Eliseev R., Salter J., Buntinas L., Alexandrov A., Hammond S. and Gunter K.K. Determination of the oxidation states of manganese in brain, liver, and heart mitochondria. J. Neurochem., 2004, 88: 266–280. Hamer D.H. Metallothionein. Annu Rev Biochem. 1986,55: 913-51. Haraguchi H. Metallomics as integrated biometal science. JAAS. 2004, 19: 5-14. Hartung T., Bremer S, Casati S., Coecke S, Corvi R., Fortaner S., Gribaldo L, Halder M., Hoffmann S., Roi-Janusch A., Prieto P., Sabbioni E., Scott L., Worth A. and Zuang V. ECVAM’s response to the changing political environment for alternatives: consequences of the European Union chemicals and cosmetics policies. ATLA. 2003, 31: 473-481. Hartung T., Bremer S, Casati S., Coecke S, Corvi R., Fortaner S., Gribaldo L, Halder M., Hoffmann S., Roi-Janusch A., Prieto P., Sabbioni E., Scott L., Worth A. and Zuang V. A Modular Approach to the ECVAM Principles on Test Validity. ATLA. 2004, 32: 497-472. Hartwig A. and Beyersmann D. Comutagenicity and inhibition of DNA repair by metal ions in mammalian cells. Biol Trace Elem Res. 1989, 21: 359-65. Heilig E.A., Thompson K.J., Molina R.M., Ivanov A.R., Brain J.D. and Wessling-Resnick M. Manganese and iron transport across pulmonary epithelium. Am J Physiol Lung Cell Mol Physiol. 2006, 290: 247-259. Hirata Y., Adachi K. and Kiuchi K. Activation of PNK pathway and induction of apoptosis by manganese in PC12 cells. J Neurochem. 1998, 71: 1607-1615. IARC/NCI/EPA Working-Group, Cellular and molecular mechanisms of cell transformation and standardization of transformation assays of established cell lines for the prediction of carcinogenic chemicals: overview and recommended protocols. Cancer Research. 1985, 45: 2395-2399. Honegger P. and Matthieu J.M. Aggregating brain cell cultures: a model to study meylination and demeylination. In: Cellular and Molecular Biology of Meylination. Jeserich G, Althaus HH, Waehneldt TV, ed. Berlin:Springer Verlag. 1985, 155–170. Honegger P. and Monnet-Tschudi F. Aggregating neural cell cultures. In: S. Fedoroff and A. Richardson, Editors. Protocols for Neural Cell Culture (third ed.). Humana Press. Ottawa, 2001, 199-218. Hussain T., Shukla G.S., Chandra S.V. Effects of cadmium on superoxide dismutase and lipid peroxidation in liver and kidney of growing rats: in vivo and in vitro studies: Pharmacol Toxicol. 1987; 60: 355-358. IARC. Monograph on the evaluation of carcinogenic risk to humans. Chromium, nickel and welding. IARC, International Agency for Research on Cancer, Lyon. 1990, 49.

Bibliography
168
Kakunaga T. A quantitative system for assay of malignant transformation by chemical carcinogens using a clone derived from Balb/3T3. Int. J. of Cancer. 1973, 12: 463-473. Kalia K., Jiang W., Zheng W. Manganese accumulates primarily in nuclei of cultured brain cells. Neurotoxicology. 2008, 29: 466-470. Keen C.L. Overview of manganese toxicity. In Proceedings of the Workshop on the Bioavailability and Oral Toxicity of Manganese, (Velazquez S, EPA Liaison). US EPA. Environmental Criteria and Assessment Office 1995: 3-11. Kinsner A., Pilotto V., Deininger S., Brown G.C., Coecke S., Hartung T. and Bal-Price A. Inflamatory neurodegeneration induced by lipoteichoic acid from Staphylococcus aureus is mediated by glia activation, nitrosative and oxidative stress and caspase activation. Journal of Neurochemistry. 2005, 95: 1132-1143. Kinsner A., Boveri M., Hareng L., Brown G.C., Coecke S., Hartung T. and Bal-Price A. Highly purified lipoteichoic acid induced pro-inflammatory signalling in primary culture of rat microglia through Toll-like receptor 2: selective potentiation of nitric oxide production by muramyl dipeptide. Journal of Neurochemistry. 2006, 99: 596-607. Klaassen C.D., Liu J., Choudhuri S. Metallothionein: an intracellular protein to protect against cadmium toxicity. Annu Rev Pharmacol Toxicol. 1999, 39: 267-94. Leist M,, Gantner F., Bohlinger I., Tiegs G., Germann P.G., Wendel A. Tumor necrosis factor-induced hepatocyte apoptosis precedes liver failure in experimental murine shock models. Am J Pathol. 1995, 146: 1220-34. Lin T.P., Labosky P.A., Grabel L.B. Kozak C.A. and J. Pitman L. The Pem homeobox gene is X-linked and exclusively expressed in extraembryonic tissues during early murine development. Dev. Biol. 1994, 166: 170-179. Liu Y. and Templeton D. Cadmium activates CaMK-II and initiates CaMK-II-dependent apoptosis in mesangial cells .FEBS Letters. 2007, 581: 1481–1486. Luckey T.D. and Venugopal B. Modes of intake and absorption, in Metal Toxicity in Mammals 1. Physiological and Chemical basis for Metal Toxicity, Plenum Press ed. 1979, chapter 2, 39-43. Loder M.K. Melikian HEAstrocyte metallothioneins (MTs) and their neuroprotective role. Ann N Y Acad Sci. 1997, 825: 334-47. Margoshes M. and Valleee B.L. A cadmium binding protein from equine kidney cortex. J. Am. Che. Soc. 1957, 79: 1813-14 Martelli A., Rousselet E., Dycke C., Bouron A. and Moulis J.M.. Cadmium toxicity in animal cells by interference with essential metals.Biochimie. 2006, 88: 1807-1814.

Bibliography
169
Mazzotti F., Sabbioni E., Ghiani M., Cocco B., Ceccatelli R. and Fortaner S. In vitro assessment of cytotoxicity and carcinogenic potential of chemicals: evaluation of cytotoxicity induced by 58 metal compounds in Balb/3T3 cell line. ATLA. 2001, 29: 601-611. Minoia C., Mazzuccotelli A., Cavalleri A. And Minganti V. Electrothermal atomisation atomic-absortion spectrophotometric determination of chromium(VI) in urine by solvent extration separation with liquid anion exchangers. Analyst. 1983, 108: 481-484. Minoia C., Pietra R., Sabbioni E., Ronchi A., Gatti A., Cavalleri A. and Manzo L. Trace element reference values in tissues from inhabitants of the European Community. III The control of preanalytical factors in the biomonitoring of trace elements in biological fluids. Sci. Tot. Environ. 1992, 120: 63-79. Monnet-Tschudi F., Zurich M.G., Honegger P. Aggregate cell cultures for neurotoxicity testing: the importance of cell-cell interactions. Dev Animal Vet Sciences.1997, 27: 641–649. Mosmann T. Rapid colorimetric assay for cellular growth and survival: Application to proliferation and cytotoxicity assays. J.immunol.Methods. 1983, 65: 55-63 Müller T., Schuckelt R. and Jaenicke L. Evidence for radical species as intermediates in cadmium/zinc-metallothionein-dependent DNA damage in vitro.Environ Health Perspect. 1994, 102: 27-9. O'Brien T.J., Ceryak S., Patierno S.R. Complexities of chromium carcinogenesis: role of cellular response, repair and recovery mechanisms. Mutation Research. 2003, 533: 3-36. Ochi T., Otsuka F., Takahashi K., Ohsawa M. Glutathione and metallothioneins as cellular defense against cadmium toxicity in cultured Chinese hamster cells. Chem Biol Interact. 1988, 65: 1-14. Olanow C.W. Manganese-induced parkinsonism and Parkinson's disease. Ann N Y Acad Sci. 2004, 1012: 209-223. Pietra R., Sabbioni E., Gallorini M., Orvini M. Enviromental, toxicological and biomedical research on trace metals: radiochemical separation for neutron activation analysis. Journal of Radioanalytical and nuclear Chemistry. 1986, 102: 69-98. Plummer J.L., Smith B.R., Sies H. and Bend, J.R. Chemical depletion of glutathione in vivo. Methods Enzymol. 1981, 77: 50–59. Ponti J., Munaro B., Fischbach M., Hoffmann S. and Sabbioni E. An opyimised analysis for the Balb/3T3 cell transformation assay and its application to metal compounds. Int. J. Immunopathol Pharm. 2007, 20: 673-684. Pourahmad J, O'Brien PJ. A comparison of hepatocyte cytotoxic mechanisms for Cu2+ and Cd2+. Toxicology. 2000, 143: 263-273.

Bibliography
170
Pourahmad J., O'Brien P.J., Jokar F., Daraei B. Carcinogenic metal induced sites of reactive oxygen species formation in hepatocytes. Toxicol In Vitro. 2003, 17: 803-10. Ravindra K., Bencs L. and Van Grieken R. Platinum group elements in the environment and their health risk. Sci. Total Environ. 2004, 318: 1-43. Reed D.J. Glatathione: toxicological implications. Ann. Rev. Pharmacol. Toxicol. 1990, 30: 603-631. Roth J.A., Walowitz J. and Browne R.W. Manganese-inducedrat pheochromocitoma (PC12) cell death is independent of caspase activation. J Neurosci Res. 2000, 61: 162-171. Roth J.A., Horbinski C., Higgins D., Lein P. and Garrick M.D. Mechanisms of manganese-induced rat pheochromocytoma (PC12) cell death and cell differentiation. Neurotoxicology. 2002, 23: 147-145. Sabbioni E. and Marafante E. Accumulation of cadmium in rat liver cadmium binding protein following single and repeated cadmium administration. Environ Physiol. Biochem. 1975, 5: 465:473. Sabbioni E. and Marafante E. Identification of lead-binding components in rat liver: in vivo study. Chem. Biol. Interactions. 1976, 15: 1-20. Sabbioni E. Neutron Activation Analysis: general principles and application to the analysis of biological fluids, Ispra-Course Analytical Techniques for Heavy Metals in Biological Fluids, Ispra, November 27-December 1, 1978. Sabbioni E., Edel J., Goetz L. And Pietra R. Enviromental and biochemical trace-metal speciation studies by radiotracers and neutron activation analysis. Biol. Trace Element Res. 1987, 12: 199-209. Sabbioni E., Bonardi M., Tanet G., Da Kang L., Gallorini M., Weckermann B. and Castiglioni M. Metallobiochemistry of current environmental levels of trace metals: a new method of cyclotron production o f 48V for toxicological studies. Journal of Radioanalytical and Nuclear Chemistry. 1989, 134:199-208 Sabbioni E., Pozzi G., Pintar A., Casella L.and Garattini S. Cellular retention, cytoxicity and morphological transformation by vanadium(IV) and vanadium(V) in BALB/3T3 cell lines. Carcinogenesis. 1991, 12: 47-52. Sabbioni E., Pozzi G., Devos S., Pintar A., Casella L. and Fishbach M. The intensità of vanadium(V)-indiced cytotoxicity and morphological transformation in Balb/3T3 cells is dependent on glutathione-mediated bioreduction to V(IV). Carcinogenesis. 1993, 14(12): 2565-2568. Sabbioni E. and Balls M. Use of cell culture and nuclear and radioanalitical techniques for environmental, occupational and biomedical toxicology research at the JRC-Ispra. In the World Congress on Alternatives and Animal Use in Life Sciences; education research testing (Goldberg A.M. Fanzutphen L.F. ed.), 101-108. Alternative methods in toxicology and the Life Sciences. 1995: 11 Mary Ann Libert Inc. Publishers, NY.
Bibliography
171
Sabbioni E., Balls M., Pietra R. and Fortaner S.. The IMETOX project (In Vitro Metal TOXicology). ATLA. 1999, 27: 107. Saffiotti U., Bertolero F., Bignami M., Cortesi F., Ficarella C. & Kaighn M.E. Studies on chemically induced neoplastic transformation and mutation in the Balb/3T3 Cl A31-1-1 cell line in relation to the quantitative evaluation of carcinogens. Toxicology and Pathology. 1984, 12: 383-390. Saffiotti U., Bertolero F. Neoplastic transformation of BALB/3T3 cells by metals and the quest for induction of a metastatic phenotype. Biol Trace Elem Res. 1989, 21: 475-82. Shukla G.S., Hussain T., Chandra S.V. Possible role of regional superoxide dismutase activity and lipid peroxide levels in cadmium neurotoxicity: in vivo and in vitro studies in growing rats. Life Sci. 1987; 41: 2215-2221. Smith M.T., Thor H., Hartizell P. and Orrenius S. The measurement of lipid peroxidation in isolated hepatocytes. Biochem :Pharmacol. 1982, 31: 19:26. Spear N. and Aust S. Effects of glutathione on Fenton reagent-dependent radical production and DNA oxidation. Arch Biochem Biophys. 1995, 324: 111-116. Stredrick D.L., Stokes A.H., Worst T.J., Freeman W.M., Johnson E.A., Lash L.H., Aschner M., Vrana K.E. Manganese-induced cytotoxicity in dopamine-producing cells. Neurotoxicology. 2004, 25:543-53. Styblo M., Drobna Z., Jaspers I., Lin S. and Thomas D.J. The role of biomethylation in toxicity and carcinogenicity of arsenic: a research update. Environ. Health Perspect. 2002, 110: 767-771. Suzuki K.T. Metabolomics of arsenic based on speciation studies. Analytical Chimica Acta. 2005, 540: 71-76. Szpunar J. Metallomics: a new frontier in analytical chemistry. Anal Bioanal Chem. 2004, 378: 54-56. Tam K.H., Charbonneau S.M., Bryce F., Lacroix G. Separation of arsenic metabolites in dog plasma and urine following intravenous injection of 74As. Anal Biochem. 1978, 1;86(2):505-11. Templeton D.M., Ariese F., Cornelis R., Muntau H., Van Leeuwen H.P. and Lobinski R. Guidelines for terms related to chemical speciation and fractionation of elements. Definitions, structural aspects, and methodological aspects. Pure Appl. Chem. 2000, 72: 1453-1470. Teng K.K., Angelastro J.M., Cunningham M.E., Farinelli S.E. and Greene L.A. Cultured PC12 cells: a model for neuronal function, differentiation and survival. Cell Biology: A Laborotory Handbook (2nd Ed.). 1998, 1: 244-250. Valko M., Morris H., Cronin M.T.D. Metals, Toxicity and Oxidative Stress. Current Med Chem. 2005, 12: 1161-1208.

Bibliography
172
Vescovi A., Facheris L., Faffaroni A., Malanca G. and Parati E.A. Dopamine metabolism alteration in a manganese-treated pheochromocytoma cell line (PC12). Toxicology. 1991, 67: 129-142. Zurich M.G., Honegger P., Schilter B., Costa L.G., Monnet-Tschudi F. Involvement of glial cells in the neurotoxicity of parathion and chlorpyrifos. Toxicol Appl Pharmacol. 2004, 201: 97–100. Yuan C., Kadiiska M., Achanzar W.E., Mason R.P. and Waalkes M.P. Possible role of caspase-3 inhibition in cadmium-induced blockage of apoptosis.Toxicol Appl Pharmacol. 2000, 164: 321-9. Waalkes M.P. and Poirier L.A. In vitro cadmium-DNA interactions: cooperativity of cadmium binding and competitive antagonism by calcium. Toxicol. Appl. Pharmacol. 1984. 75: 539-546. Waalkes M.P. Metal carcinogenesis, in Sarkar B. Handbook of Heavy Metals in the Environment, Marcel Dekker, New York, 2002, 121-146. Waalkes M.P. Cadmium carcinogenesis. Mutat Res. 2003, 533: 107-120. Waisberg M., Joseph P., Hale B., Beyersmann D. Molecular and cellular mechanisms of cadmium carcinogenesis. Toxicology. 2003, 192: 95-117. WHO. Environmental Health Criteria 224, Arsenic and arsenic compounds, WHO Geneve. 2001. WHO. Environmental Health Criteria, Vanadium pentoxide and other inorganic vanadium compounds, WHO, Concise International Chemical Assessment 29, Geneve. 2001. Wood G.C. and Cooper P.F. The application of gel filtration to the study of protein-binding of small molecules. Chromatog. Rev. 1970, 12: 88-107.