Embed Size (px)
Citation preview
Meteorological Message and Test Analysis Software for an
Army Meteorological System
by James Cogan and Terry Jameson
ARL-TR-3249 July 2004 Approved for public release; distribution is unlimited.

NOTICES
Disclaimers
The findings in this report are not to be construed as an official Department of the Army position, unless so designated by other authorized documents. Citation of manufacturers’ or trade names does not constitute an official endorsement or approval of the use thereof.
Army Research Laboratory White Sands Missile Range, NM 88002-5501
ARL-TR-3249 July 2004
Meteorological Message and Test Analysis Software for an Army Meteorological System
James Cogan and Terry Jameson
Battlefield Environment Division Computational and Information Sciences Directorate
Approved for public release; distribution is unlimited.
REPORT DOCUMENTATION PAGE Form Approved OMB No. 0704-0188
Public reporting burden for this collection of information is estimated to average 1 hour per response, including the time for reviewing instructions, searching existing data sources, gathering and maintaining the data needed, and completing and reviewing the collection information. Send comments regarding this burden estimate or any other aspect of this collection of information, including suggestions for reducing the burden, to Department of Defense, Washington Headquarters Services, Directorate for Information Operations and Reports (0704-0188), 1215 Jefferson Davis Highway, Suite 1204, Arlington, VA 22202-4302. Respondents should be aware that notwithstanding any other provision of law, no person shall be subject to any penalty for failing to comply with a collection of information if it does not display a currently valid OMB control number. PLEASE DO NOT RETURN YOUR FORM TO THE ABOVE ADDRESS. 1. REPORT DATE (DD-MM-YYYY)
July 2004 2. REPORT TYPE
Final 3. DATES COVERED (From - To)
July 2002-June 2004 5a. CONTRACT NUMBER
5b. GRANT NUMBER
4. TITLE AND SUBTITLE
Meteorological Message and Test Analysis Software for an Army Meteorological System
5c. PROGRAM ELEMENT NUMBER
5d. PROJECT NUMBER
AH71 5e. TASK NUMBER
6. AUTHOR(S)
James Cogan and Terry Jameson
5f. WORK UNIT NUMBER
7. PERFORMING ORGANIZATION NAME(S) AND ADDRESS(ES)
U.S. Army Research Laboratory Computational and Information Sciences Directorate Battlefield Environment Division (ATTN: AMSRD-ARL-CI-EB) White Sands Missile Range, NM 88002-5501
8. PERFORMING ORGANIZATION REPORT NUMBER
ARL-TR-3249
10. SPONSOR/MONITOR'S ACRONYM(S)
9. SPONSORING/MONITORING AGENCY NAME(S) AND ADDRESS(ES)
U.S. Army Research Laboratory 2800 Powder Mill Road Adelphi, MD 20783-1145
11. SPONSOR/MONITOR'S REPORT NUMBER(S)
ARL-TR-3249 12. DISTRIBUTION/AVAILABILITY STATEMENT
Approved for public release; distribution is unlimited.
13. SUPPLEMENTARY NOTES
14. ABSTRACT
This report describes software packages that have been developed by the Battlefield Environment Division of the Computational and Information Sciences Directorate of the U.S. Army Research Laboratory (ARL) to generate meteorological (Met) messages from modeled and measured atmospheric soundings, as well as to provide a means of statistically analyzing the accuracy of the messages and ultimately the soundings from which they were derived. This report also provides some sample results using real data. The message generation algorithms have become part of the overall software package for the Meteorological Measuring Set – Profiler (MMS-P), which is currently in System Development and Demonstration and approved for initial limited production. The Test and Evaluation (T&E) Integration Process Team (IPT) for the MMS-P selected a later version of this software (also developed by ARL) in order to generate ground-truth messages during the Developmental Test (DT). The statistical analysis programs have generated information used by the T&E IPT and has assisted in the analysis of preliminary data for the Product Manager for Target Identification and Meteorological Systems. Expanded versions of these programs will provide statistical analyses for support of the DT and the consequent report on system accuracy. Both the message generation and statistical analyses software packages may be used for experiments that require any vertical structure of layered data, including new messages types that may be devised for non-line of sight systems of the future.
15. SUBJECT TERMS
Meteorological messages, test analysis software, developmental test, Meteorological Measuring Set - Profiler
16. SECURITY CLASSIFICATION OF: 19a. NAME OF RESPONSIBLE PERSON
James Cogan a. REPORT
U b. ABSTRACT
U c. THIS PAGE
U
17. LIMITATION OF
ABSTRACT
SAR
18. NUMBER OF PAGES
48 19b. TELEPHONE NUMBER (Include area code)
505-678-2094 Standard Form 298 (Rev. 8/98) Prescribed by ANSI Std. Z39.18
Contents
List of Tables iv
List of Figures iv
Summary 1
1. Introduction 3
2. Message Generation Programs 4 2.1 Software Components .......................................................................................4
2.1.1 Reformat raob Data into Standard Data Structure................................7 2.1.2 Convert Sounding in Data Structure into Met Messages .....................8 2.1.2 Include Files .........................................................................................9
2.2 Guide to Use of Message Programs ................................................................10 2.3 Input and Output Samples ...............................................................................11
3. Statistical Analysis Programs 13
4. A Met Accuracy Program 19
5. Conclusion 26
6. References 27
Appendix 29
Acronyms 37
Distribution List 39
iii
List of Tables
Table 1. A partial 2-second sounding from a WSMR GPS radiosonde. ................................12
Table 2a. A sample of output with data for a METCM message. ...........................................13
Table 2b. A sample of output with data for a METCM message, but in the standard Teletype-style format. .......................................................................................................13
Table 3. Computer Met message comparison statistics..........................................................16
Table 4. Target acquisition and fallout Met message comparison statistics...........................18
Table 5. An excerpt from a 53-level, ground-truth data file...................................................19
Table 6: Proposed PTC, excerpted from the MMS-P test documentation, 21 May 2002. .....21
List of Figures
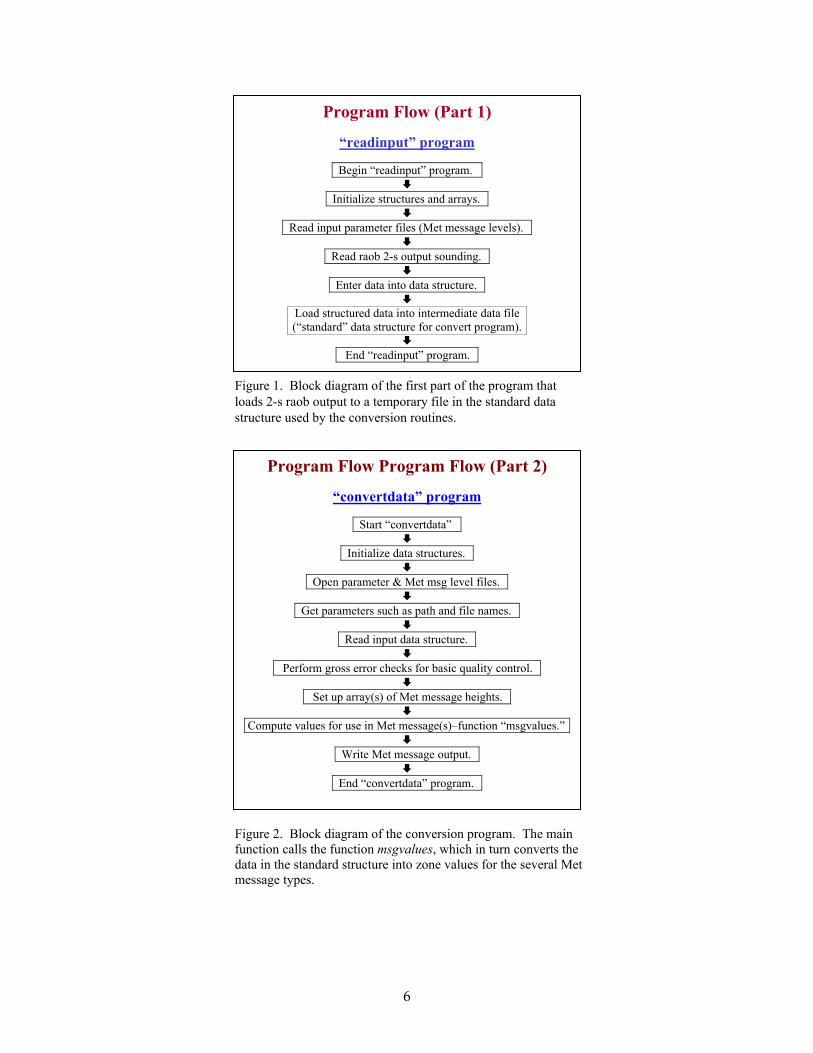
Figure 1. Block diagram of the first part of the program that loads 2-s raob output to a temporary file in the standard data structure used by the conversion routines. ..................6
Figure 2. Block diagram of the conversion program. The main function calls the function msgvalues, which in turn converts the data in the standard structure into zone values for the several Met message types. ...........................................................................................6
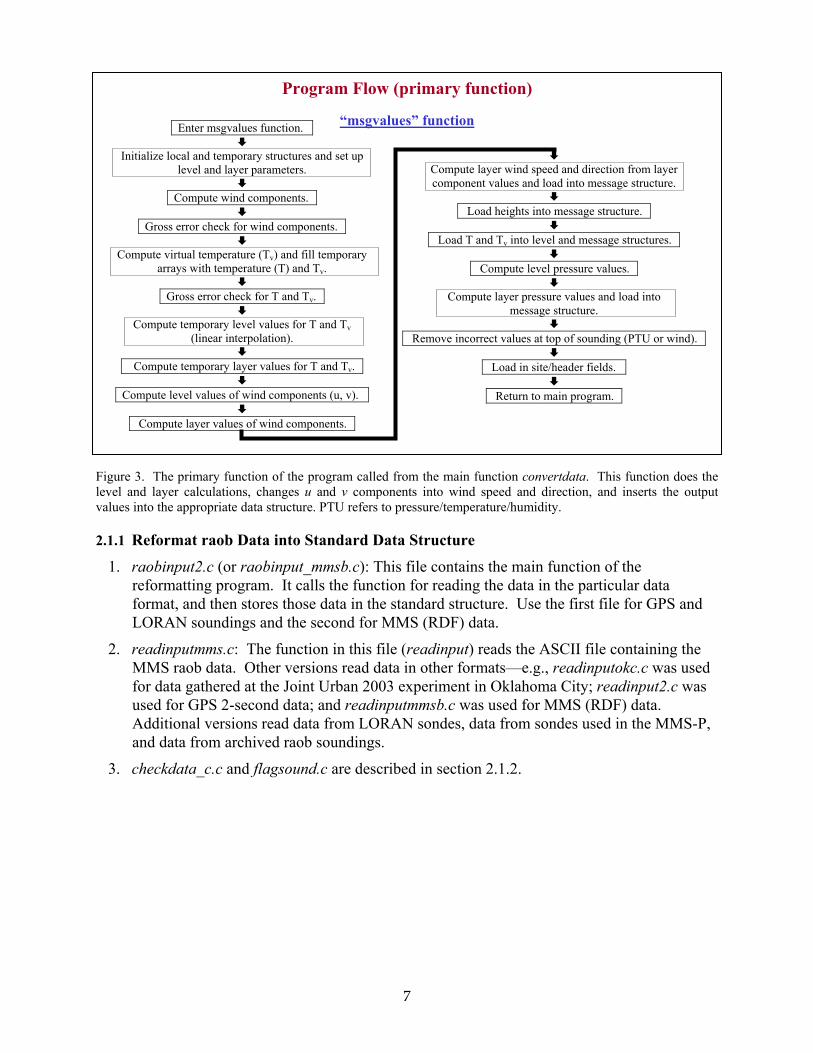
Figure 3. The primary function of the program called from the main function convertdata. This function does the level and layer calculations, changes u and v components into wind speed and direction, and inserts the output values into the appropriate data structure. PTU refers to pressure/temperature/humidity.....................................................................7
Figure 4a. metacc3 block diagram...........................................................................................23
Figure 4b. metacc3 block diagram (continued). ......................................................................24
Figure 4c. metacc3 block diagram (continued). ......................................................................25
iv
Summary
In coordination with the Product Manager – Target Identification and Meteorological Systems (PM-TIMS), we have developed a set of software programs that can compute several types of meteorological (MET) messages from atmospheric profiles produced by the Mesoscale Model Version 5 (MM5) on the Meteorological Measuring Set – Profiler (MMS-P) and from “ground truth” radiosondes. A variant of part of this software package has been incorporated into the MMS-P software and was used as the “standard” message software for the Developmental Test (DT) of the MMS-P, which was conducted at White Sands Missile Range (WSMR), NM, from January to April 2004.
In order to compare the MMS-P model’s output with ground-truth soundings, we developed a series of statistical analysis programs using the Matrix Laboratory (MATLAB) commercial software tool. The PM-TIMS adopted this statistical analysis software as a means to evaluate the accuracy of the MMS-P in several early tests of the system software and to analyze the data gathered at the DT. This software generates standard statistical measures of data quality that are specifically tailored to meet the needs of the MMS-P program. Furthermore, the programs can also be used to produce a variety of artillery accuracy comparisons, some of which have been published in earlier reports (Jameson and D’Arcy, 2004; Jameson, 2003; Jameson et al., 2002).
This technical report provides a short description of the programs in the Met message software package, followed by some real-world examples of input and output messages. The report also contains brief descriptions of the statistical analysis package, along with some examples showing comparisons between real Met data from the MMS-P and ground-truth radiosondes, as well as other accuracy evaluations.
1

INTENTIONALLY LEFT BLANK.
1. Introduction
Field artillery obtains meteorological (Met) data in the form of Met messages in several formats. While some apply to ballistic solutions for cannon or rockets, others provide detailed vertical structure for the target area. The latter types are likely to have application in future systems. In addition, vertical structure of the atmosphere is an important consideration for experiments of many types. The Battlefield Environment Division (BED) of the Computational and Information Sciences Directorate (CISD) of the U.S. Army Research Laboratory (ARL) has developed software packages for the following tasks: 1) one that can generate Met messages from model sounding output or measured atmospheric profiles from any sounding system, and 2) another that can analyze the statistical accuracy of those messages relative to those derived from “standard” or traditional sources of sounding data, and/or that can provide comparisons between messages from any two systems. In the latter case, one or both messages may be derived from model output.
Algorithms from the message generation package have become part of the overall software package for the Meteorological Measuring Set – Profiler (MMS-P) currently in System Development and Demonstration (SDD) and approved for initial limited production. The Test and Evaluation (T&E) Integration Process Team (IPT) for the MMS-P selected a later version of the message generation software (also developed by ARL) in order to generate ground-truth messages during the Developmental Test (DT). The Met Team at White Sands Missile Range (WSMR), NM, also requested this latter software to help in support of the DT and other tests. The message generation software discussed in this report is based on earlier work found in Cogan and Izaguirre (1993) and Cogan (1990). The current package provides a major upgrade and extension of those earlier message generation programs.
The statistical analysis programs have been used to generate information for the T&E IPT and have assisted the analysis of preliminary data for the Product Manager for Target Identification and Meteorological Systems (PM-TIMS). More recently these programs have provided critical support for the statistical analyses of the DT and the consequent report on system accuracy. This software is an outgrowth of a program used for earlier analyses, as described in Jameson and D’Arcy (2004), Jameson (2003), Jameson, et al. (2002), and earlier publications.
In this report we describe these software packages in some detail. The message generation software was written in the C programming language and the statistical software was written using the Matrix Laboratory (MATLAB) commercial development software environment. We also look at results from real data for several message types and provide statistical analysis of those results.
3
2. Message Generation Programs
The message generation programs produce several Met messages from vertical profiles of Met variables. They are coded in the C programming language, as per the standard set by the American National Standards Institute (ANSI). The current versions of the software can receive input soundings from a Meteorological Measuring Set (MMS), Marwin1, and other radiosonde systems, as well as “53 level”2 output soundings from the Mesoscale Model Version 5 (MM5) on the MMS-P. The first part of the program set consists of a group of format conversion programs, one program for each input sounding type that reads a sounding and puts the relevant data into a standard data structure. The second part of the program set converts the sounding data from the data structure into the several types of messages. While currently the messages are not output in the Teletype format—as found in the Department of the Army Field Manual 6-15 (1997) and other manuals such as the NATO Standardization Agreement 4082 (1984)—they do produce the same information in the same units. For example, the programs output virtual temperature in degrees K × 10 (e.g., 280.5 K represented as 2805) and wind direction in mils (to a good approximation, 1 degree = 17.7778 mils).
2.1 Software Components
The following paragraphs describe the program set and how the separate modules relate to each other. The required modules consist of C source files, include files, and two parameter files. The parameter files (input_parameters and locdata) are described in section 2.2.
There are two programs in the latest version. The first program (one of the raobinput programs) reads the rawinsonde observation (raob) data and stores the data in a standard data structure that is then used by the second program (convertdata2). Since each sounding system, even from the same manufacturer, has its own format (or set of formats), each type of raob has its own function for reading data from the sounding (hence the separate executable files). However, those functions provide a common data structure. There are two versions of the convertdata programs—one that uses the method (linear interpolation) of the MMS software package (personal communication) to compute the layer values of pressure, and another that uses the hypsometric formula (logarithmic function).
The source file names for the main functions of the raobinput set of programs include raobinput2.c for wind computation using data from a Global Positioning System (GPS), raobinput_mmsb.c for wind computation using data from a Radio Direction Finder (RDF), and
1 Marwin is a registered trademark of the Viasala OY Corporation. 2 The so-called “53 level” format is an upper-air format that was conceived and adopted early on in the MMS-P software
development. It includes height levels that could define any zone in any of the artillery Met messages that could be created by the system.
4

others for wind computation using long range navigation (LORAN) and certain archived raob data. Functions called by the main function actually read the raob output. Again, different radiosonde systems of the same type (e.g., GPS) often produce output with different formats. Section 2.1.1 presents information on the different functions needed to handle the different formats.
Note that the first of these files (raobinput2.c) will run with or without header site information, as noted in the users guide. If the header contains no site data or incomplete site data, then the parameter file locdata must be available (see section 2.2).
Both programs use flagsound.c and checkdata_c.c. The function readinputxxx.c changes for each sounding format, where “xxx” delineates the type. For example, readinputmmsb.c is the function for MMS soundings from Ft. Sill, OK.
The executable file for the Marwin (2-sec) soundings is raobinput2 (or raobinput2g.exe) for WSMR or mmsbraobinput (or mmsbraobinput.exe) for Ft. Sill, OK. Other executables handle output from other raob systems, such as raobinputlor.exe for LORAN sondes.
The convertdata programs work for all sounding types since they use the standard data structure. They also work for soundings from the MMS-P postprocessor (a version of the unified post-processor system (Stauffer, et al., 2002)) since the programs use a separate program to convert that output into the same data structure format. The source file names are as follows: convertdata2.c, msgvalues2.c, flagsound.c, flagcomp.c, level.c, layer.c, spdrfromcomp_c.c, compfromspdr_c.c, clean_data_c.c, tvfromtemp_c.c, prscomp.c, readinputdata.c, writemetcms.c, writetams.c, writetacqs.c, writebwinds.c, writebaliss.c, checkdata_c.c, fixinput.c, bal_met.c, and msg_mod.c. The include files are convert.h and metstruct.h. The executable file used after compiling is convertdata2 (or convertdata2.exe). The version using the MMS method for pressure designates the main function as msgvalues2_var.c; the write functions take the extension “var,” such as writemetcms_var.c (except for writebwinds.c, which remains the same since pressure is not part of its output). The executable file is convertdata2v (or convertdata2v.exe).
A short description of each source file follows. Brief headers in those files and in-line comments also help to describe the purpose of the files and the code within the files. Figures 1-3 provide “high level” block diagrams of the program.
5
Program Flow (Part 1)
“readinput” program
Begin “readinput” program.ss
Initialize structures and arrays. s
Read input parameter files (Met message levels). s
Read raob 2-s output sounding. s
Enter data into data structure. s
Load structured data into intermediate data file (“standard” data structure for convert program).
End “readinput” program. s
Figure 1. Block diagram of the first part of the program that loads 2-s raob output to a temporary file in the standard data structure used by the conversion routines.
Program Flow Program Flow (Part 2)
“convertdata” program
Start “convertdata”ss
Initialize data structures. s
Open parameter & Met msg level files. s
Get parameters such as path and file names. s
Read input data structure. s
Perform gross error checks for basic quality control. s
Set up array(s) of Met message heights. s
Compute values for use in Met message(s)–function “msgvalues.”s
Write Met message output. s
End “convertdata” program. s
Figure 2. Block diagram of the conversion program. The main function calls the function msgvalues, which in turn converts the data in the standard structure into zone values for the several Met message types.
6
Program Flow (primary function)
“msgvalues” function
Enter msgvalues function.ss
Initialize local and temporary structures and set up level and layer parameters.
Compute wind components. s
Gross error check for wind components. s
Compute virtual temperature (Tv) and fill temporary
arrays with temperature (T) and Tv.
Gross error check for T and Tv. s
Compute temporary level values for T and Tv (linear interpolation).
Compute temporary layer values for T and Tv. s
Compute level values of wind components (u, v). S
Compute layer values of wind components. s
Compute layer wind speed and direction from layer component values and load into message structure.
Load heights into message structure. s
Load T and Tv into level and message structures. s
Compute level pressure values. s
Compute layer pressure values and load into
message structure.
Remove incorrect values at top of sounding (PTU or wind). s
Load in site/header fields. S
Return to main program. s
Figure 3. The primary function of the program called from the main function convertdata. This function does the level and layer calculations, changes u and v components into wind speed and direction, and inserts the output values into the appropriate data structure. PTU refers to pressure/temperature/humidity.
2.1.1 Reformat raob Data into Standard Data Structure
1. raobinput2.c (or raobinput_mmsb.c): This file contains the main function of the reformatting program. It calls the function for reading the data in the particular data format, and then stores those data in the standard structure. Use the first file for GPS and LORAN soundings and the second for MMS (RDF) data.
2. readinputmms.c: The function in this file (readinput) reads the ASCII file containing the MMS raob data. Other versions read data in other formats—e.g., readinputokc.c was used for data gathered at the Joint Urban 2003 experiment in Oklahoma City; readinput2.c was used for GPS 2-second data; and readinputmmsb.c was used for MMS (RDF) data. Additional versions read data from LORAN sondes, data from sondes used in the MMS-P, and data from archived raob soundings.
3. checkdata_c.c and flagsound.c are described in section 2.1.2.
7
2.1.2 Convert Sounding in Data Structure into Met Messages
1. convertdata2.c: The convertdata2 program is the main program or function. (In an earlier version it is contained in the file convertdata.c.) This file converts sounding data in the standard structure into various Met message types (e.g., computer Met message (METCM)). The output from this program may not have the exact Met message format or formats, but it does give the correct values for Met message levels or layers.
2. msgvalues2.c: The msgvalues2 function computes level and layer values for a Met message. (For the version using the MMS method of computing layer pressure, it is found in msgvalues2_var.c.) This function also removes parts of data lines with missing or “bad” data values. In the current version, if pressure, temperature, or humidity is missing, then all three values are removed from the data line, and they are not used in the level or layer calculations. The same holds for wind speed and direction; if one is missing, both are removed from the data line. The level values are the values at the message heights as found in the input height file for each message type. For example, the file metcm_lvls contains heights for the METCM message. The layer values are the weighted mean values, or integrated mean values, for layers as defined by the array of message heights in those files.
3. level.c: The level function is a general linear interpolation program for any defined atmospheric structure of heights and layers. It produces values at levels defined in the input array of heights. It requires observations for 2 to n heights, where n is no larger than the maximum array size (e.g., 3,000). The minimum output height cannot be less than the minimum observation height, the maximum no more than the maximum observation height.
4. layer.c: The layer function generates values for weighted, or integrated mean, layers defined by the levels in the input array. It produces values for any defined atmospheric structure of heights and layers. For example, the output could contain the layer values used in the METCM message (all values above the surface). Line 0 is the lowest line in the message and contains the surface values. It is the only line that is not a layer value in the several message types.
5., 6. spdrfromcomp_c.c and compfromspdr_c.c: The spdrfromcomp and compfromspdr functions convert wind components into wind speed and direction, and wind speed and direction into components, respectively. Either can generate or use speed and direction in regular units (ms-1 and degrees) or in artillery units (knots and tens of mils). In the convertdata program, regular units are used. The conversion to artillery units takes place later in the program. Note that some messages may not use artillery units.
7. clean_data_c.c: The clean_data function provides a gross error check on the data. The primary function clean_data, and the included function sanity_check, operate to see if the data values are within predefined bounds. A data value is set to the value for missing data (ERROR = -999.0 or IERROR = -999) if it lies outside of the “useful data” envelope.
8. tvfromtemp_c.c: The tvfromtemp function converts sensible temperature into virtual temperature.
8
9. prscomp.c: The prscomp function computes pressure from height and virtual temperature using the standard hypsometric equation.
10. readinputdata.c: The readinputdata function reads one input sounding in the data structure format for conversion into one or more Met messages. It can read in any number of Met data lines up to the upper limit as defined by the define constant MAXHEIGHT. However, for processing into a Met message at least two lines are needed, one of which has to be the surface.
11.-15. writemetcms.c, writetams.c, writetarqs.c, writebwinds.c, and writebaliss.c: The respective functions (e.g., writemetcm) format the output data into METCM (metcm), Target Area (tam), Target Acquisition (tacq), Basic Wind (bwind, formerly Fallout Wind), and Ballistic Met (balis) message type values (e.g., wind direction in tens of mils in the METCM), and writes the results into the files that have most, or all, of the name of the original input file (e.g., 07-1500), plus a suffix with the name of the message type (e.g., 07-1500-MMS_metcm).
16. checkdata_c.c: The short checkdata function prints certain data in the struct_sound format. It provides an easy-to-use means to check data values at different points within the program.
17., 18. flagsound.c and flagcomp.c: The flagsound and flagcomp functions initialize numerical fields in the “sound” and “windcomp” structures, respectively, using the ERROR or IERROR values as defined in the convert.h include file. These values are -999.0 and -999, respectively.
19. fixinput.c: The fixinput function provides a simple means to adjust the input in case of a bad or missing data value within a data line (as determined by the clean_data function). The line with the bad or missing value is simply removed. This option exists in the current version.
20. msg_mod.c: The msg_mod function replaces pressure/temperature/humidity (PTU) or wind computed layer values at the top of a message with the ERROR value (-999.0) where missing input data values appear in the sounding, from the top down, and are included in the layer computations. In the latest version, layer values are computed for all variables if the PTU or wind values are “good” at the top of a message. This function removes the “bad” PTU or wind values. For example, if the values of wind speed and direction are missing at the topmost altitudes, but there are good values of temperature, pressure, and humidity, the function will replace the computed bad layer wind values with -999’s. Normally, this function would only replace values at the uppermost one or two layers.
2.1.2 Include Files
1. The file convert.h provides the function definitions, almost all of the define constants, and the standard C include files (e.g., stdio.h).
2. The file metstruct.h provides the structure definitions, plus some define constants.
9
2.2 Guide to Use of Message Programs
1. Check for the parameter file input_parameters in the same directory as the program (current configuration, but can be changed). The file in the present form has the directory or path of the input data file (see bullet point 4) followed by two numbers, the first is the minimum height used in the gross error check of the input sounding. Currently the first number (minimum height) is set to 0 m (float). A different value may be useful if the input heights are at mean sea level (MSL). The second number is an integer value used to determine which method for “fixing” an input sounding with one or more bad or missing data values; currently it has a value of 1. These parameters are called “minheight” and “fixswitch,” respectively. If the file is not found, default values are used (0 m and 1, respectively). A 0 value for fixswitch means “halt the program if a bad data value is found.” A value of 1 (default) means “either remove the data line with the bad value (some older versions)” or in the most recent version, “remove only groups of bad data fields,” that is wind speed/direction or PTU. Later versions may treat one or more of the PTU variables separately. The next-to-last line of the parameter file is the output directory. The last line has a character that is used to determine whether or not to use the locdata parameter file (raob launch site data). This parameter file is required when the header does not contain the needed site information, as for some WSMR soundings.
2. Check for the input files metcm_lvls, tam_lvls, tacq_lvls, bwind_lvls, and balis_lvls. The program will halt if no files are found, but will continue if at least one is available. These files contain the heights for each type of message: METCM, tam, tacq, bwind, and balis. These heights are the surface (0 m) and the boundary values for the message levels (e.g., for the METCM: 200 for the 0-200 m layer, 500 for the 200-500 m layer, 1000 for the 500-1000 m layer, etc.). At least one of these files is required for the program to produce at least one message. These files are in the same directory as the program (current configuration, but can be changed).
3. Check for the parameter file locdata in the same directory as the program (current version) if the soundings are from certain raobs (e.g., some LORAN soundings). It is not used for raobs in the format of the MMS (RDF) soundings or most GPS soundings (2 or 10 second). This file contains raob launch site information, such as site name (e.g., JAL for Jalen), latitude, longitude, elevation, and the nature of the input data heights—i.e., whether they are MSL (normal for 10-s and 2-s data) or above ground level (AGL). This last item must match the type of data output from the rawinsonde system. If not, the program will produce incorrect message values for levels around and below the site elevation, or it simply may not function. The site elevation should be the same as the first (surface) raob height. If not, the program will account for the difference if the elevation is too low, or default to the raob value if the elevation is too high. If the difference is large, the message values may have significant errors.
4. Check for input sounding data, that is, a raob output sounding in the 2-s (also 10-s) format in the appropriate directory (it should be the same as listed in the input_parameters file). A sample raob filename for data from Ft. Sill, OK, is 03-0700. Because of the wide variety of header size and amount and type of information, the file is edited manually in order to strip the header of duplicated and/or unneeded information. In addition, many MMS soundings have partial METCM messages embedded in the sounding, with lines of
10
sounding data before and after. A modified file is denoted with the suffix “m” or “m2” (for example, 03-0700m or WSD30271m2 for a MMS or WSMR sounding, respectively). A change in the format will abort the program or produce erroneous results. At least two data lines (one of which must be the surface) must be available for the program to run.
5. A short script may be used instead of the following paragraph, and is briefly described in bullet point 7. This paragraph will describe the programs whether they are run separately or as part of the script. Run the first program by typing, for example, mmsbraobinput for MMS raobs from Ft. Sill, OK, or okcraobinput for the MMS raobs from Oklahoma City (Joint Urban 2003 experiment), followed by the input file name. For instance, type the command line mmsbraobinput 28-0700m. With the input now in the sounding structure format (the file name is inputdata), type the command convertdata2 (see the next paragraph). NOTE: Some systems, such as Cygnus, require a “./” before the executable file.
The most recent version of convertdata (produces the same output) is called convertdata2 and is used in the same manner as convertdata. Another version named convertdata2v uses the MMS formula to compute Met message pressure. It is used in the same way as the other versions (e.g., type ./convertdata2v). The file convertdata2v was used in the set of software for the DT test.
6. The output data are found in the output directory (the next to last line of the input_parameters file). The output file has the input file name concatenated with the suffix _metcm, _tam, etc. If one of the input lvls files was not in the appropriate directory, the program will not generate the related output. For example, if tam_lvls is not found then the program skips the computation of 03-0700m_tam. The output variables are those found in the Met messages, but at this time not in the exact format. For example, for METCM wind speed is in knots and wind direction in tens of mils.
The program that uses the MMS formula for pressure generates output with the additional suffix of _var. For example, it produces a file 28-0700m_metcm_var from MMS 10-sec output having the name 28-0700m.
7. The script file name is either raobmsg_MMS (MMS RDF at Ft. Sill, OK) or raobmsg_2g (GPS 2-second sounding at WSMR) and is run by typing the name followed by the input file name (e.g., raobmsg_MMS 28-1500m for a MMS sounding at Ft. Sill, OK). Other scripts may be written for other input types (e.g., for LORAN raobs). Certain information otherwise printed on the screen is sent to a log file named msglog_raob. A new log file is created for each run in the current version.
2.3 Input and Output Samples
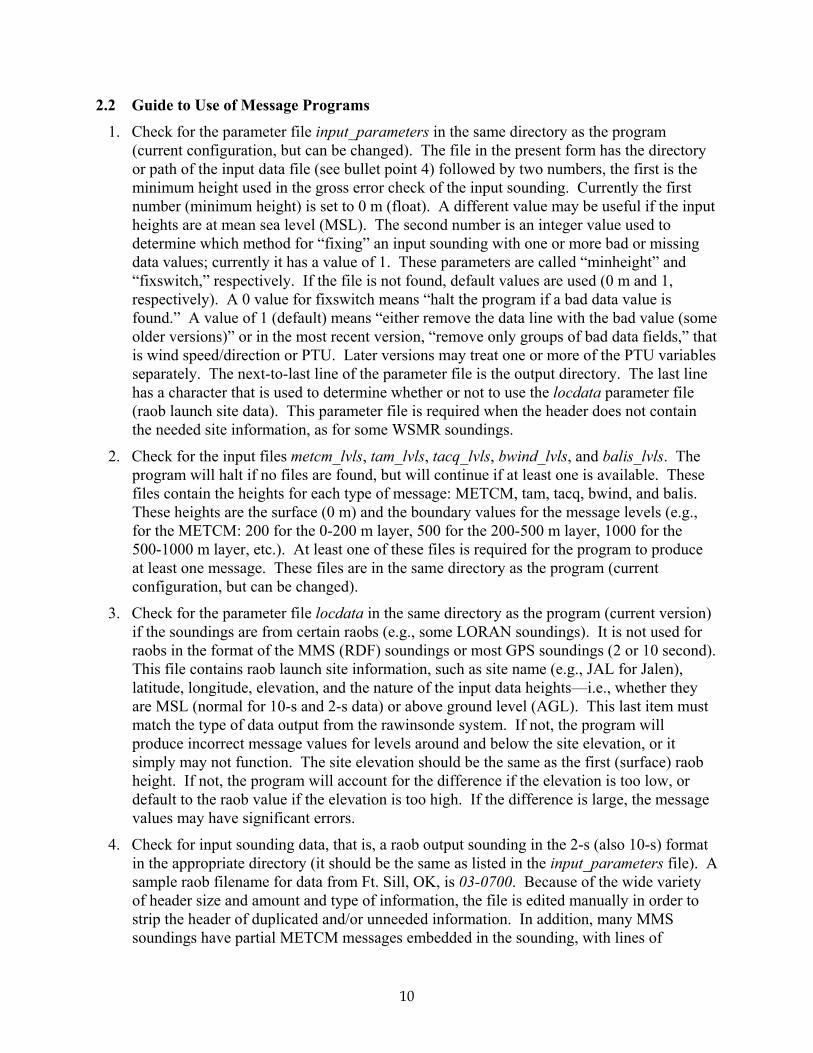
The ASCII soundings produced by rawinsonde systems have headings that vary in size and content, and in some cases, have extra heading lines or partial Met messages imbedded in the sounding data (some MMS). An example is given in the appendix. After manually editing to remove the extra lines, we have an input sounding, as seen in table 1. Table 1 shows the header information and the initial 30 seconds of “2-second data” (a data record is output once every 2 seconds) from a GPS radiosonde at WSMR. The full sounding ended after 95 minutes. In some
11
cases no location, latitude, longitude, or elevation information appears in the rawinsonde system header. In that case, a reduced header is used without those lines (not shown).
Table 1. A partial 2-second sounding from a WSMR GPS radiosonde.
Station: 72269 WSD Location: 32.40 N 106.37 W 1216 m Started at: 27 JAN 03 18:30 UTC Time AscRate Hgt/MSL Pressure Temp RH Dewp Dir Speed min s m/s m hPa degC degC deg m/s 0 0 0.0 1216 887.1 14.1 23 -6.7 240 1.0 0 2 8.0 1232 885.3 12.0 25 -7.4 297 0.9 0 4 5.0 1236 884.8 11.9 25 -7.5 318 0.9 0 6 4.2 1241 884.4 11.8 25 -7.6 325 0.9 0 8 3.6 1245 884.0 11.7 26 -7.2 327 0.8 0 10 3.3 1249 883.5 11.6 26 -7.2 327 0.8 0 12 3.1 1253 883.1 11.6 26 -7.2 329 0.7 0 14 2.9 1257 882.7 11.6 26 -7.2 333 0.7 0 16 2.8 1261 882.2 11.6 26 -7.2 337 0.6 0 18 2.6 1263 882.0 11.6 26 -7.2 341 0.6 0 20 2.7 1269 881.4 11.4 27 -6.9 346 0.6 0 22 2.7 1275 880.7 11.3 27 -7.0 356 0.5 0 24 2.7 1281 880.1 11.2 27 -7.1 8 0.5 0 26 2.7 1287 879.5 11.1 27 -7.2 22 0.5 0 28 2.9 1296 878.6 11.0 28 -6.8 37 0.5 0 30 2.9 1304 877.7 10.9 28 -6.9 60 0.6
NOTE: UTC = universal time coordinated; AscRate = ascent rate of the sonde; Dir = wind direction; and Speed = wind speed.
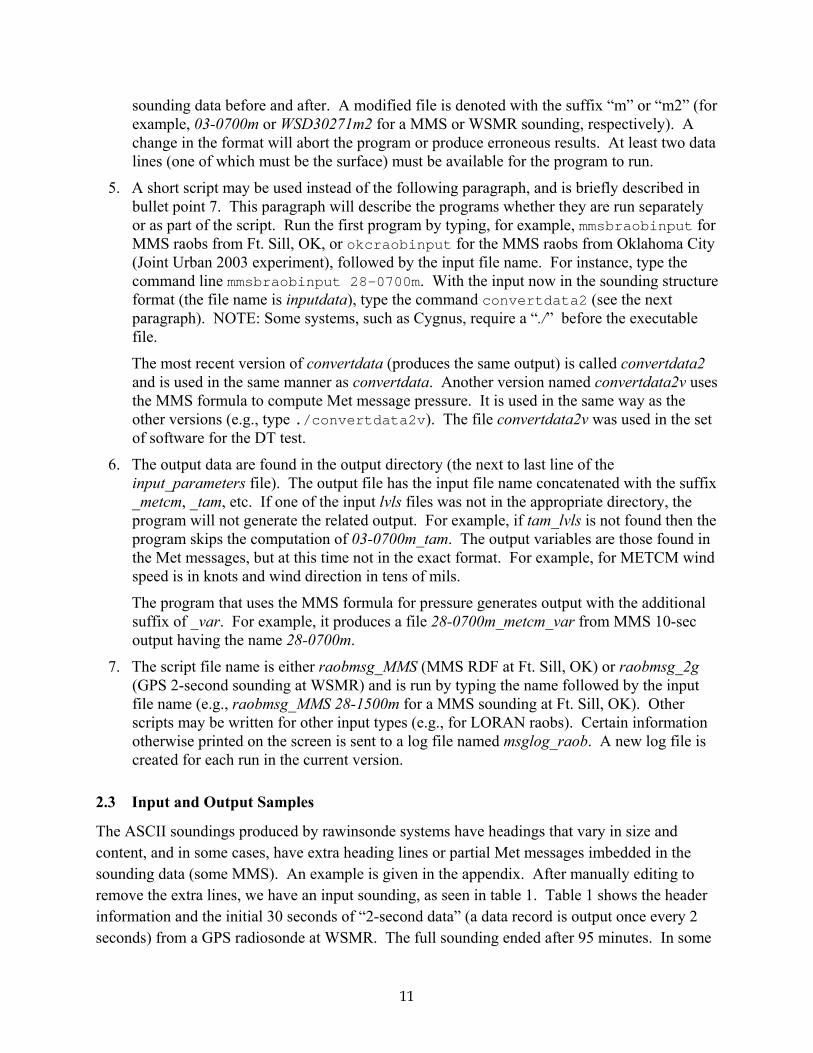
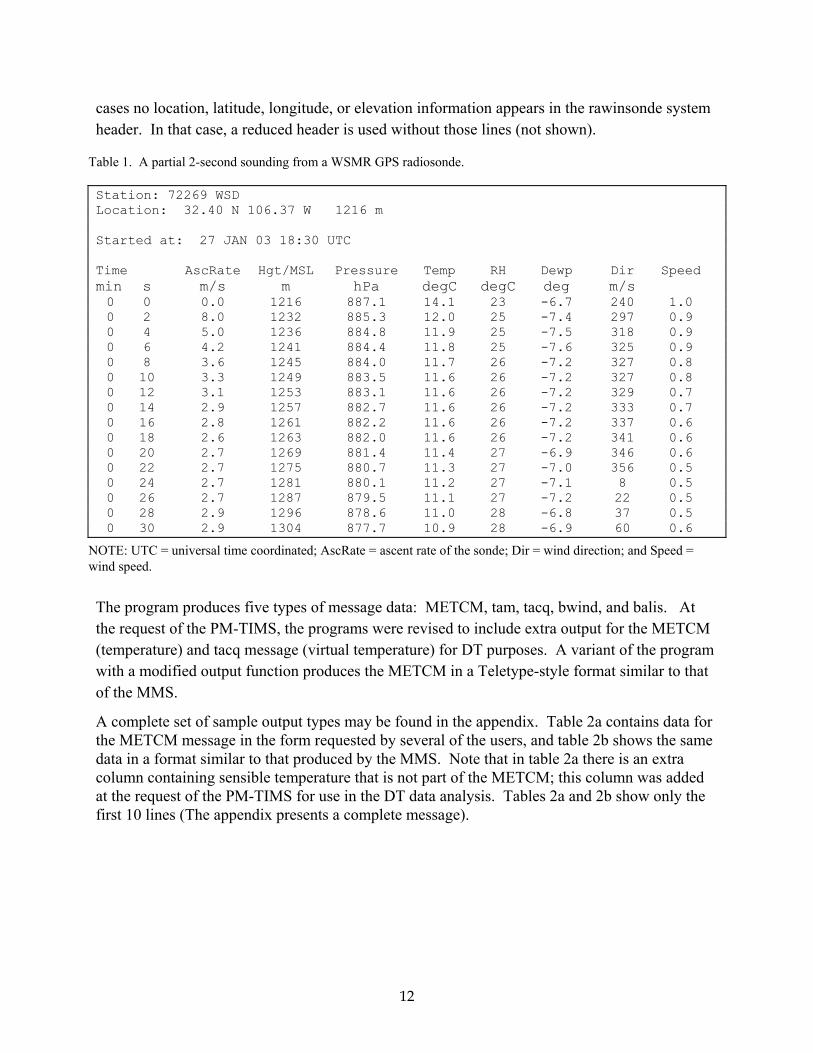
The program produces five types of message data: METCM, tam, tacq, bwind, and balis. At the request of the PM-TIMS, the programs were revised to include extra output for the METCM (temperature) and tacq message (virtual temperature) for DT purposes. A variant of the program with a modified output function produces the METCM in a Teletype-style format similar to that of the MMS.
A complete set of sample output types may be found in the appendix. Table 2a contains data for the METCM message in the form requested by several of the users, and table 2b shows the same data in a format similar to that produced by the MMS. Note that in table 2a there is an extra column containing sensible temperature that is not part of the METCM; this column was added at the request of the PM-TIMS for use in the DT data analysis. Tables 2a and 2b show only the first 10 lines (The appendix presents a complete message).
12
Table 2a. A sample of output with data for a METCM message.
METCM output Date: 28MAR04 Time: 16:02 Latitude: 32.37000 Longitude: -106.47000 Elevation: 1283.00 Ceiling: -999.0 Visibility: -999.0 Line Height Wind Direction Wind Speed Virt Temp Pressure Temperature (m) (tens of mils) (kt) (K*10) (mb) (K*10) 0 0 18 12 2890 877 2887 1 200 631 10 2860 867 2856 2 500 592 9 2840 841 2836 3 1000 573 9 2809 801 2805 4 1500 559 14 2780 754 2778 5 2000 511 13 2771 709 2769 6 2500 515 14 2750 666 2749 7 3000 535 16 2722 626 2722 8 3500 510 19 2687 588 2687 9 4000 494 23 2655 551 2655 10 4500 480 25 2621 517 2621
Table 2b. A sample of output with data for a METCM message, but in the standard Teletype-style format.
METCM1 324065 281600 128877 00018012 28900877 01631010 28600867 02592009 28400841 03573009 28090801 04559014 27800754 05511013 27710709 06515014 27500666 07535016 27220626 08510019 26870588 09494023 26550551 10480025 26210517
3. Statistical Analysis Programs
Before the T&E IPT could approve the use of the convertdata programs in the DT, we needed to ascertain whether or not the code could correctly generate Met messages. The code was intended to be used to emulate a MMS, as is currently deployed by Field Artillery (FA) units, since the MMS was considered to be the standard against which the MMS-P would be compared. The WSMR Met Team was tasked to collect raw, 2-second data files, from which convertdata would generate the appropriate ground-truth Met messages3. The T&E IPT required that messages produced by convertdata, using the 2-second format as input, be compared against messages
3 At the time of the DT planning, the Met Team did not have software installed in their Marwin units that could directly generate the appropriate Met messages.
13
coming directly out of a MMS. A high degree of correlation had to be proven before Met messages generated by convertdata could be accepted as ground truth.
During the Met accuracy phase of the SDD, sounding data files were collected by FA training units at Ft. Sill, OK. A number of these files were provided to ARL from the summer of 2001 Oklahoma collection period. Each data file contained both standard Met messages as well as 2-second format4 messages, all from the same sounding. Thus, we were able to run convertdata to generate Met messages and compare them with the standard messages coming directly from the MMS.
A MATLAB program called cmm_compare.m was written to generate the statistical comparisons between Met messages produced by convertdata and those taken directly from the MMS. In cmm_compare.m, both types of Met messages are read into arrays, zone-by-zone. The Met parameters of interest were virtual temperature, pressure, wind speed, and wind direction. Four statistical analysis values—Mean Bias (MB), Mean Absolute Error (MAE), Root Mean Square Error (RMSE), and Correlation Coefficient (CC)—were then calculated for each of the Met parameters.
MB is simply the differences between the MMS message and the convertdata-generated values, averaged over all Met message zones into one value. This value can be a positive or negative number. For example, if at every zone the convertdata virtual temperature was 1.0 K warmer than the MMS, the MB would be +1.0 K. The MB indicates the general trend in the differences (errors). It was desirable to find a very small MB, indicating the greatest conformity between convertdata and the MMS; however, it was possible that at some of the zones the differences could be largely negative and at others largely positive, and yet the MB would still average out to a small value.
The MAE is the average of the absolute value of the differences and is not susceptible to the kind of error seen with the MB. Thus, the MAE is always a positive number. For example, if at some of the zones the virtual temperature differences (MMS value minus the convertdata value) were -1.0 K, and for the remainder of the zones, the differences were +1.0 K, the MAE would simply average out to 1.0 K. The MAE is an indicator of how well the differences are falling into “error bounds,” without regard to the sign of the errors.
The RMSE is the “square root of the mean of the errors squared.” Put another way, at each zone the difference between convertdata value and MMS value (the error) was squared, the mean (average) value of the squared errors was calculated, and then the square root of that mean value was determined. The RMSE is another indicator of how well the differences are falling into error bounds. In RMSE, outliers receive greater weight, so this value is generally larger than MAE and is therefore considered to be a slightly more conservative statistical parameter.
4 The time resolution was actually in 10-second time increments; however, the format is identical to the 2-second version.
14

The CC is a dimensionless number that indicates how closely one set of data (the convertdata-generated values) is associated with another dataset (the MMS values). A CC of +1.0 indicates a perfect correlation between the two datasets (i.e. convertdata has perfectly calculating the zone values as judged against the MMS). A CC of 0.0 indicates that no correlation exists between the two datasets, which would mean the convertdata code was not correctly calculating the Met parameters values at all.
The cmm_compare.m code was originally written to compare METCM messages. There were 11 cases selected for analysis from the dataset from Ft. Sill, OK, that had full, 26-zone METCMs. For each case, convertdata was run on the portion of the data file containing the 10-s format and a METCM was produced. Next, the MMS METCM was extracted from the data file and both Met messages were input to cmm_compare.m. The results of the 11 case comparisons are listed in table 3.
15
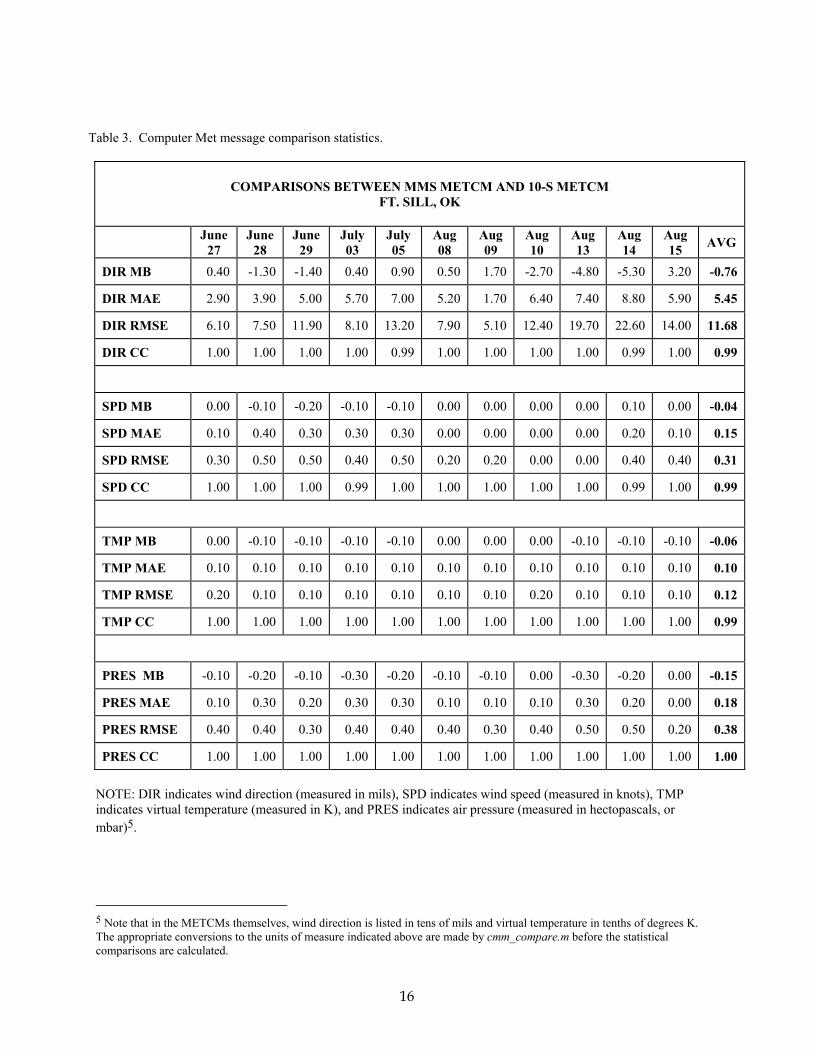
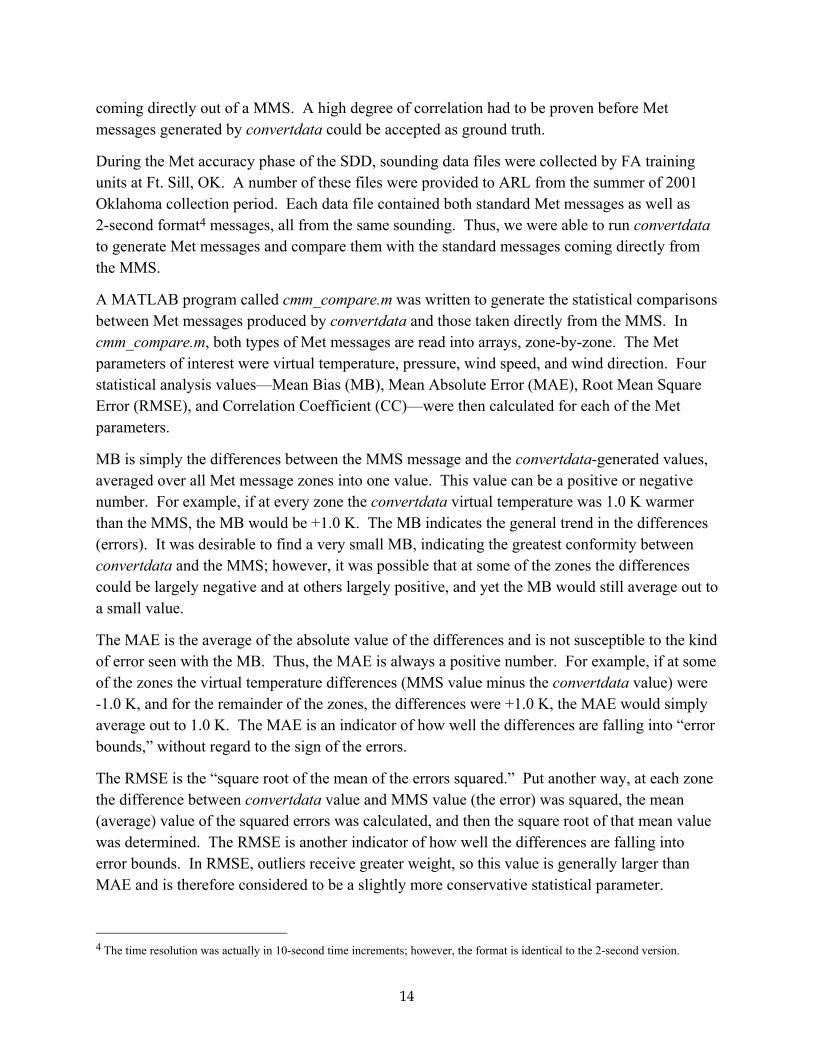
Table 3. Computer Met message comparison statistics.
COMPARISONS BETWEEN MMS METCM AND 10-S METCM FT. SILL, OK
June 27
June 28
June 29
July 03
July 05
Aug 08
Aug 09
Aug 10
Aug 13
Aug 14
Aug 15 AVG
DIR MB 0.40 -1.30 -1.40 0.40 0.90 0.50 1.70 -2.70 -4.80 -5.30 3.20 -0.76
DIR MAE 2.90 3.90 5.00 5.70 7.00 5.20 1.70 6.40 7.40 8.80 5.90 5.45
DIR RMSE 6.10 7.50 11.90 8.10 13.20 7.90 5.10 12.40 19.70 22.60 14.00 11.68
DIR CC 1.00 1.00 1.00 1.00 0.99 1.00 1.00 1.00 1.00 0.99 1.00 0.99
SPD MB 0.00 -0.10 -0.20 -0.10 -0.10 0.00 0.00 0.00 0.00 0.10 0.00 -0.04
SPD MAE 0.10 0.40 0.30 0.30 0.30 0.00 0.00 0.00 0.00 0.20 0.10 0.15
SPD RMSE 0.30 0.50 0.50 0.40 0.50 0.20 0.20 0.00 0.00 0.40 0.40 0.31
SPD CC 1.00 1.00 1.00 0.99 1.00 1.00 1.00 1.00 1.00 0.99 1.00 0.99
TMP MB 0.00 -0.10 -0.10 -0.10 -0.10 0.00 0.00 0.00 -0.10 -0.10 -0.10 -0.06
TMP MAE 0.10 0.10 0.10 0.10 0.10 0.10 0.10 0.10 0.10 0.10 0.10 0.10
TMP RMSE 0.20 0.10 0.10 0.10 0.10 0.10 0.10 0.20 0.10 0.10 0.10 0.12
TMP CC 1.00 1.00 1.00 1.00 1.00 1.00 1.00 1.00 1.00 1.00 1.00 0.99
PRES MB -0.10 -0.20 -0.10 -0.30 -0.20 -0.10 -0.10 0.00 -0.30 -0.20 0.00 -0.15
PRES MAE 0.10 0.30 0.20 0.30 0.30 0.10 0.10 0.10 0.30 0.20 0.00 0.18
PRES RMSE 0.40 0.40 0.30 0.40 0.40 0.40 0.30 0.40 0.50 0.50 0.20 0.38
PRES CC 1.00 1.00 1.00 1.00 1.00 1.00 1.00 1.00 1.00 1.00 1.00 1.00
NOTE: DIR indicates wind direction (measured in mils), SPD indicates wind speed (measured in knots), TMP indicates virtual temperature (measured in K), and PRES indicates air pressure (measured in hectopascals, or mbar)5.
5 Note that in the METCMs themselves, wind direction is listed in tens of mils and virtual temperature in tenths of degrees K. The appropriate conversions to the units of measure indicated above are made by cmm_compare.m before the statistical comparisons are calculated.
16
For example, in the June 27 comparison, the Mean Bias for wind direction was +0.40 mils. Averaged over all 11 cases, the MB was -0.76 mils. Because there was some fluctuation plus and minus, the average MB was quite small, whereas the MAE and RMSE values for direction were significantly larger (5.45 and 11.68 mils, respectively). (However, to put it in perspective, the 11.68 mils equates to about 0.65 compass degrees). The CC in direction between the two Met messages was an almost perfect 0.99.
The other three Met parameters showed extremely low RMSE values and nearly perfect CCs. Pressure was the only parameter that registered a discernable bias, which was slightly negative for this dataset (meaning that the convertdata values tended to be slightly lower than those from the MMS). This difference is likely due to the different ways in which pressure is interpolated in the two software sets. The MMS Met message software uses a linear interpolation scheme, whereas convertdata uses a more meteorologically accurate logarithmic approach. The MB of -0.15 mbar was considered to be insignificant.
While these data were extremely encouraging, the T&E IPT determined that other types of Met messages should be compared before final approval of convertdata would be granted. Three days from the 11-case dataset from Ft. Sill, OK, for which there were complete Target Acquisition Messages (METTA1) and Fallout Messages (METFM1, a.k.a., the “Basic Wind Report”), were selected. Minor modifications to cmm_compare.m were made to accommodate the different formats and Met parameters of the MMS METTA1 and METFM1 messages. The METTA1 used the ambient temperature (as opposed to the virtual temperature) and also included the relative humidity (RH). Table 4 lists the results of this follow-on comparison study.
17
Table 4. Target acquisition and fallout Met message comparison statistics.
MMS METTA1 VS. 10-S METTA1 27-Jun-2001 3-Jul-2001 15-Aug-2001 Average DIR MB -0.70 1.10 -0.70 -0.10 DIR MAE 2.90 3.90 7.10 4.63 DIR RMSE 5.30 6.80 15.10 9.07 DIR CC 1.00 1.00 1.00 1.00 SPD MB 0.00 0.00 0.00 0.00 SPD MAE 0.20 0.10 0.10 0.13 SPD RMSE 0.40 0.50 0.30 0.40 SPD CC 1.00 1.00 1.00 1.00 TMP MB 0.00 0.00 -0.10 -0.03 TMP MAE 0.10 0.10 0.10 0.10 TMP RMSE 0.20 0.10 0.10 0.13 TMP CC 1.00 1.00 1.00 1.00 RH MB -0.20 0.30 -0.30 -0.07 RH MAE 0.80 1.20 0.50 0.83 RH RMSE 1.20 1.90 1.00 1.37 RH CC 0.99 0.99 1.00 0.99
MMS METFM1 VS. 10-SEC METFM1 27-Jun-2001 3-Jul-2001 15-Aug-2001 Average DIR MB -3.30 3.30 0.00 0.00 DIR MAE 5.60 3.30 0.00 2.97 DIR RMSE 8.80 5.80 0.00 4.87 DIR CC 1.00 1.00 1.00 1.00 SPD MB 0.40 0.10 0.10 0.20 SPD MAE 0.40 0.30 0.30 0.33 SPD RMSE 0.50 0.40 0.40 0.43 SPD CC 1.00 1.00 1.00 1.00
NOTE: DIR indicates wind direction (measured in mils), SPD indicates wind speed (measured in knots), TMP indicates temperature (measured in K).
As with the 11-case comparisons, very little difference was found between the Met messages generated directly by the MMS and those produced by convertdata. For each of these analyses, the minor differences that did occur could probably be attributed to the time resolution of the raw input data. The raw data observed by the MMS were in approximately 1-second intervals, whereas the convertdata was in 10-second increments. It was assumed that by inputting 2-second data into convertdata during the DT, even less difference would result. Based upon these findings, the T&E IPT approved the use of convertdata on the DT datasets.
18
4. A Met Accuracy Program
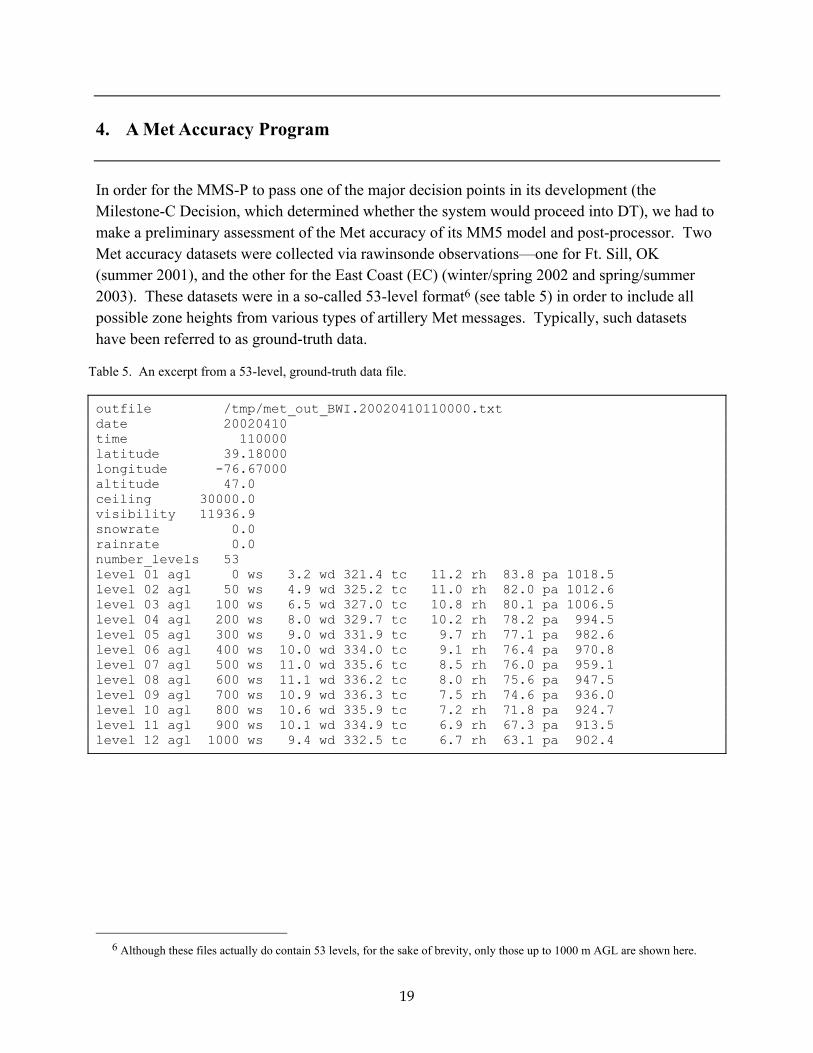
In order for the MMS-P to pass one of the major decision points in its development (the Milestone-C Decision, which determined whether the system would proceed into DT), we had to make a preliminary assessment of the Met accuracy of its MM5 model and post-processor. Two Met accuracy datasets were collected via rawinsonde observations—one for Ft. Sill, OK (summer 2001), and the other for the East Coast (EC) (winter/spring 2002 and spring/summer 2003). These datasets were in a so-called 53-level format6 (see table 5) in order to include all possible zone heights from various types of artillery Met messages. Typically, such datasets have been referred to as ground-truth data.
Table 5. An excerpt from a 53-level, ground-truth data file.
outfile /tmp/met_out_BWI.20020410110000.txt date 20020410 time 110000 latitude 39.18000 longitude -76.67000 altitude 47.0 ceiling 30000.0 visibility 11936.9 snowrate 0.0 rainrate 0.0 number_levels 53 level 01 agl 0 ws 3.2 wd 321.4 tc 11.2 rh 83.8 pa 1018.5 level 02 agl 50 ws 4.9 wd 325.2 tc 11.0 rh 82.0 pa 1012.6 level 03 agl 100 ws 6.5 wd 327.0 tc 10.8 rh 80.1 pa 1006.5 level 04 agl 200 ws 8.0 wd 329.7 tc 10.2 rh 78.2 pa 994.5 level 05 agl 300 ws 9.0 wd 331.9 tc 9.7 rh 77.1 pa 982.6 level 06 agl 400 ws 10.0 wd 334.0 tc 9.1 rh 76.4 pa 970.8 level 07 agl 500 ws 11.0 wd 335.6 tc 8.5 rh 76.0 pa 959.1 level 08 agl 600 ws 11.1 wd 336.2 tc 8.0 rh 75.6 pa 947.5 level 09 agl 700 ws 10.9 wd 336.3 tc 7.5 rh 74.6 pa 936.0 level 10 agl 800 ws 10.6 wd 335.9 tc 7.2 rh 71.8 pa 924.7 level 11 agl 900 ws 10.1 wd 334.9 tc 6.9 rh 67.3 pa 913.5 level 12 agl 1000 ws 9.4 wd 332.5 tc 6.7 rh 63.1 pa 902.4
6 Although these files actually do contain 53 levels, for the sake of brevity, only those up to 1000 m AGL are shown here.
19

In order to evaluate the system’s Met accuracy, a set of criteria was required that could compare the forecast data from the MMS-P against the OK and EC datasets.
Development of a suitable set of Met accuracy criteria was no simple task for several reasons: 1) we had to consider the specific elements within, and the underlying intent of, various requirements documents, such as the MMS-P Operational Requirement Document; 2) we had to address concerns of the Prime Contractor and several organizations within the user, test, and meteorological communities; and 3) we had to deal with the fact that the MMS-P’s MM5/post-processor software system operates at a much smaller temporal and spatial scale than any other Met model previously adopted for operational use. Furthermore, the level of scrutiny being applied to the evaluation of this modeling system was far greater than had ever been applied before (with the exception, perhaps, of meso/microscale models operating in pristine research environments). Thus, the Met accuracy criteria had to be tailor-made to address these issues.
ARL expended significant effort in developing the required set of Met accuracy criteria. Several iterations of modifications were made under the direction of the T&E IPT. Table 6 is a primarily narrative synopsis of the final set of criteria, hereafter called the Profiler Test Criteria (PTC). As indicated in table 6, the PTC are applied on a line-by-line basis, comparing MMS-P forecasts to the OK and EC ground-truth datasets. Some of the criteria are applied equally, regardless of which line (height) in the file is being compared. For example, at 80 percent of all the lines (i.e., all the samples), the MMS-P forecast pressure must fall within 3 mbar of the ground-truth value, with an overall MAE of 4 mbar. For other criteria, the threshold values (maximum allowable differences) must be computed for each line. For example, the maximum allowable wind vector error is either a function of the height within the Boundary Layer (BL) or of wind speed at levels above the top of the BL.
20
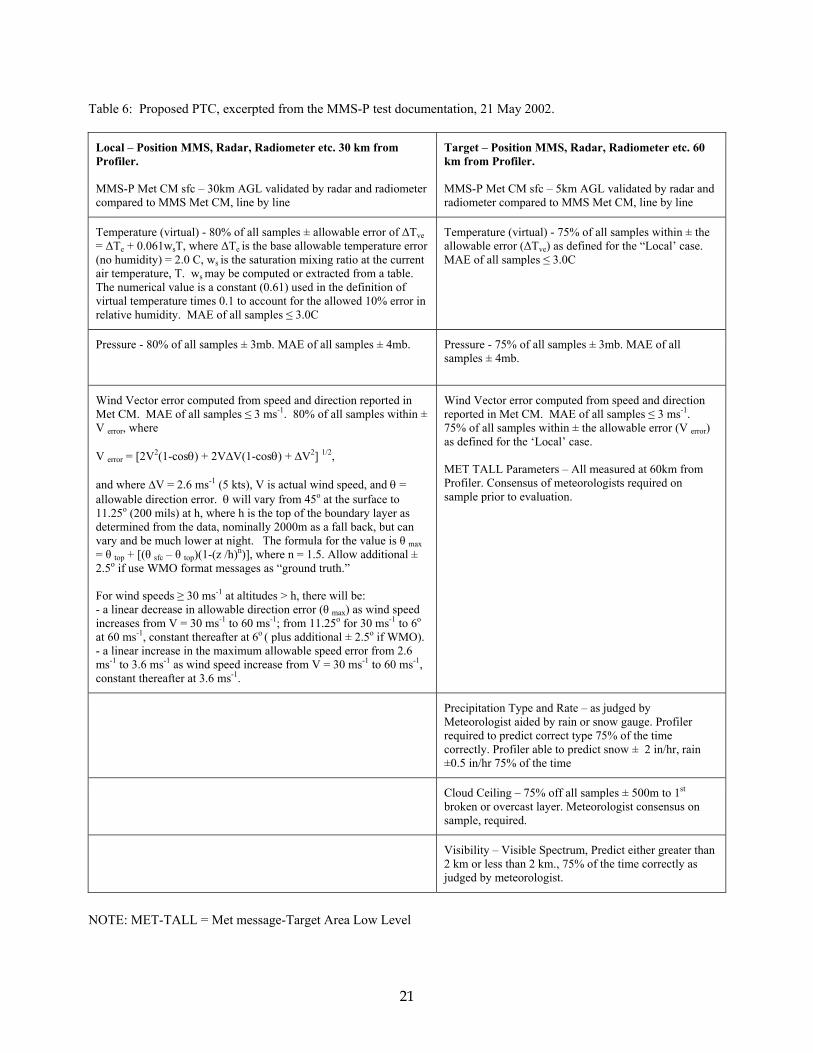
Table 6: Proposed PTC, excerpted from the MMS-P test documentation, 21 May 2002.
Local – Position MMS, Radar, Radiometer etc. 30 km from Profiler. MMS-P Met CM sfc – 30km AGL validated by radar and radiometer compared to MMS Met CM, line by line
Target – Position MMS, Radar, Radiometer etc. 60 km from Profiler. MMS-P Met CM sfc – 5km AGL validated by radar and radiometer compared to MMS Met CM, line by line
Temperature (virtual) - 80% of all samples ± allowable error of ∆Tve = ∆Te + 0.061wsT, where ∆Te is the base allowable temperature error (no humidity) = 2.0 C, ws is the saturation mixing ratio at the current air temperature, T. ws may be computed or extracted from a table. The numerical value is a constant (0.61) used in the definition of virtual temperature times 0.1 to account for the allowed 10% error in relative humidity. MAE of all samples ≤ 3.0C
Temperature (virtual) - 75% of all samples within ± the allowable error (∆Tve) as defined for the “Local’ case. MAE of all samples ≤ 3.0C
Pressure - 80% of all samples ± 3mb. MAE of all samples ± 4mb. Pressure - 75% of all samples ± 3mb. MAE of all samples ± 4mb.
Wind Vector error computed from speed and direction reported in Met CM. MAE of all samples ≤ 3 ms-1. 80% of all samples within ± V error, where V error = [2V2(1-cosθ) + 2V∆V(1-cosθ) + ∆V2] 1/2, and where ∆V = 2.6 ms-1 (5 kts), V is actual wind speed, and θ = allowable direction error. θ will vary from 45o at the surface to 11.25o (200 mils) at h, where h is the top of the boundary layer as determined from the data, nominally 2000m as a fall back, but can vary and be much lower at night. The formula for the value is θ max = θ top + [(θ sfc – θ top)(1-(z /h)n)], where n = 1.5. Allow additional ± 2.5o if use WMO format messages as “ground truth.” For wind speeds ≥ 30 ms-1 at altitudes > h, there will be: - a linear decrease in allowable direction error (θ max) as wind speed increases from V = 30 ms-1 to 60 ms-1; from 11.25o for 30 ms-1 to 6o at 60 ms-1, constant thereafter at 6o ( plus additional ± 2.5o if WMO). - a linear increase in the maximum allowable speed error from 2.6 ms-1 to 3.6 ms-1 as wind speed increase from V = 30 ms-1 to 60 ms-1, constant thereafter at 3.6 ms-1.
Wind Vector error computed from speed and direction reported in Met CM. MAE of all samples ≤ 3 ms-1. 75% of all samples within ± the allowable error (V error) as defined for the ‘Local’ case. MET TALL Parameters – All measured at 60km from Profiler. Consensus of meteorologists required on sample prior to evaluation.
Precipitation Type and Rate – as judged by Meteorologist aided by rain or snow gauge. Profiler required to predict correct type 75% of the time correctly. Profiler able to predict snow ± 2 in/hr, rain ±0.5 in/hr 75% of the time
Cloud Ceiling – 75% off all samples ± 500m to 1st
broken or overcast layer. Meteorologist consensus on sample, required.
Visibility – Visible Spectrum, Predict either greater than 2 km or less than 2 km., 75% of the time correctly as judged by meteorologist.
NOTE: MET-TALL = Met message-Target Area Low Level
21

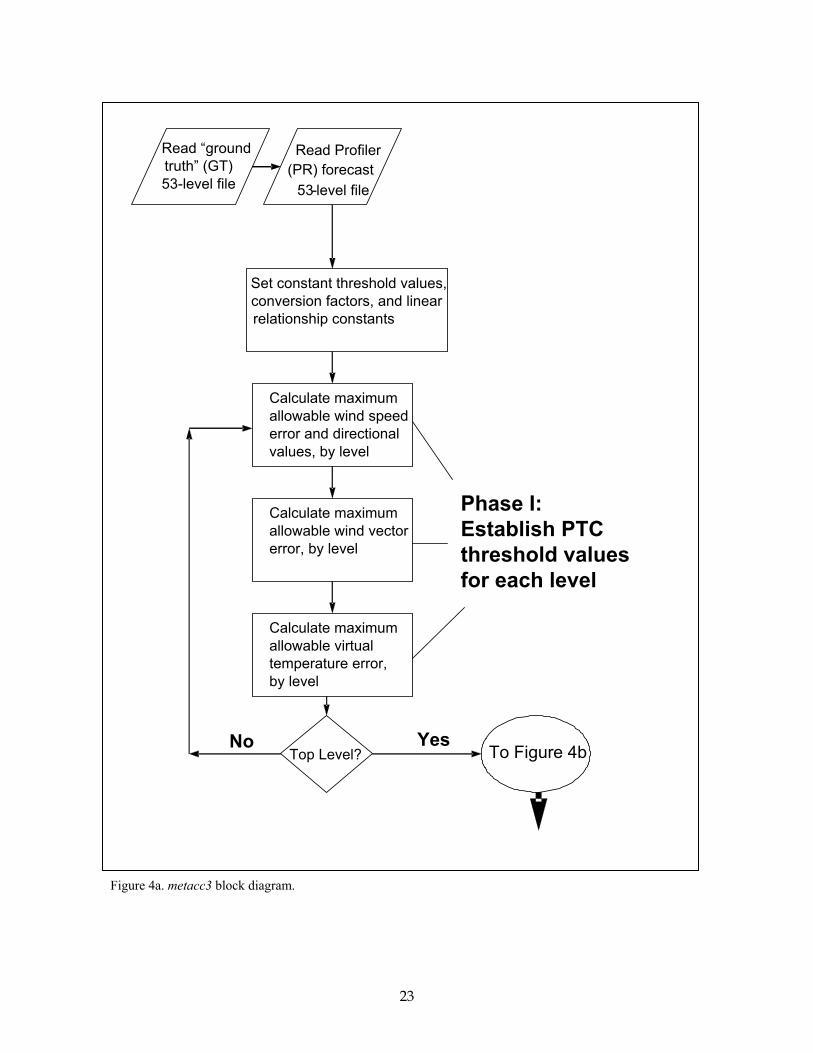
During the summer of 2002, we developed a MATLAB program called metacc3 that incorporated the PTC for wind vector, virtual temperature, and pressure error; calculated (in the case of wind vector and virtual temperature error) and applied the maximum allowable values at each line; and indicated the Pass/Fail ratios for all 53-levels in the data files. The metacc3 code only deals with the basic Met parameters of virtual temperature, wind vector, and pressure. The other parameters listed in Table 6 (precipitation type/rate, cloud ceiling height, and visibility), which require interpretation by a meteorologist, are not included in the metacc3 analysis.
A number of hand-calculations were made using the PTC, against which the output of metacc3 was compared. Also, Penn State University, the original developer of MM5, conducted some quick-look calculations using the PTC. In all cases, the results of metacc3 were verified as accurate. After the T&E IPT was briefed on the functional aspects of metacc3, the Prime Contractor, Smiths Aerospace (SA), requested a copy of the source code. Under an ARL Software Release Agreement with SA, the metacc3 code was delivered to their software developers during the summer of 2002. The MATLAB programming language is very similar to the C language, consequently metacc3 was converted to C code by SA and adopted for use in all subsequent Met accuracy analyses. Figures 4a-4c contain a block diagram of the metacc3 MATLAB code.
22
Read “ground Read Profiler truth” (GT) (PR) forecast 53-level file
Figure 4a. metacc3 block diagram.
53 - level file
Set constant threshold values, conversion factors, and linear relationship constants
Calculate maximum allowable wind speed error and directional values, by level
Phase I: Calculate maximum Establish PTC allowable wind vector
error, by level threshold values for each level
Calculate maximum allowable virtual temperature error, by level
Yes No To Figure 4b Top Level?
23
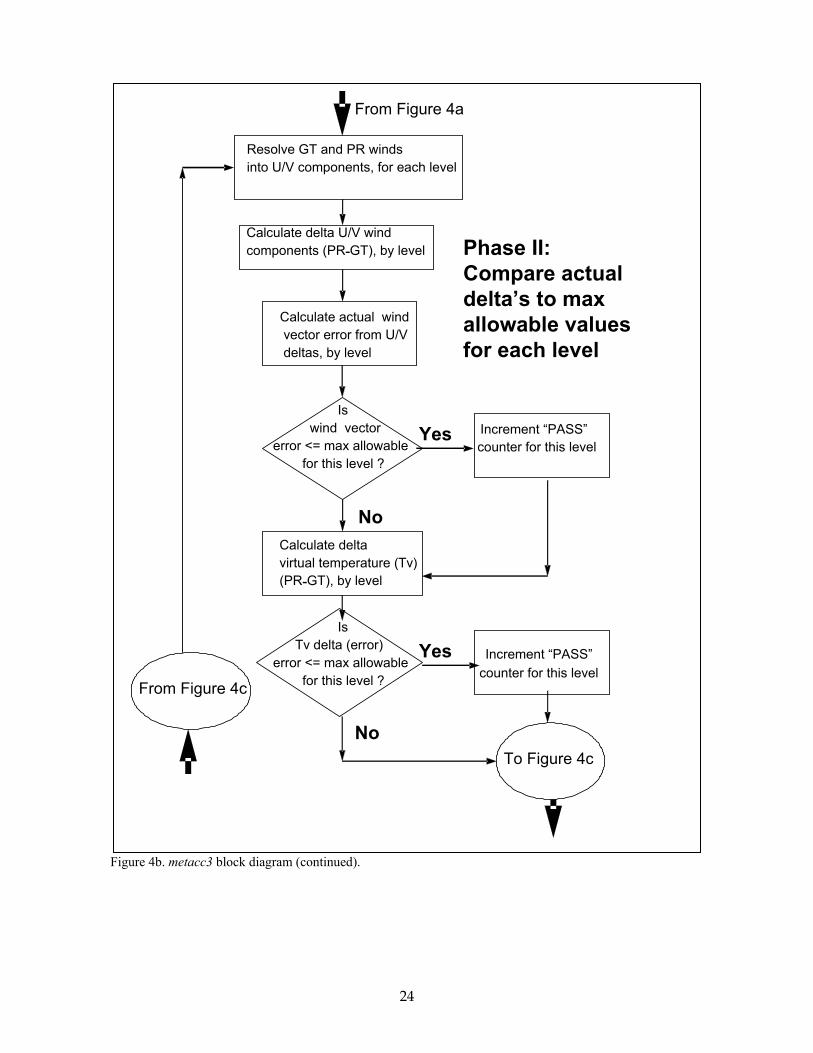
From Figure 4a
Resolve GT and PR winds into U/V components, for each level
Calculate delta U/V wind Phase II:
Figure 4b. metacc3 block diagram (continued).
Calculate actual wind vector error from U/V deltas, by level
Calculate delta virtual temperature ( Tv ) (PR - GT), by level
components (PR - GT), by level
Compare actual delta’s to max
allowable values for each level
Is wind vector Increment “PASS” Yes
error <= max allowable counter for this level for this level ?
No
Is Tv delta (error) Yes Increment “PASS” error <= max allowable
counter for this level for this level ? From Figure 4c
No
To Figure 4c
24
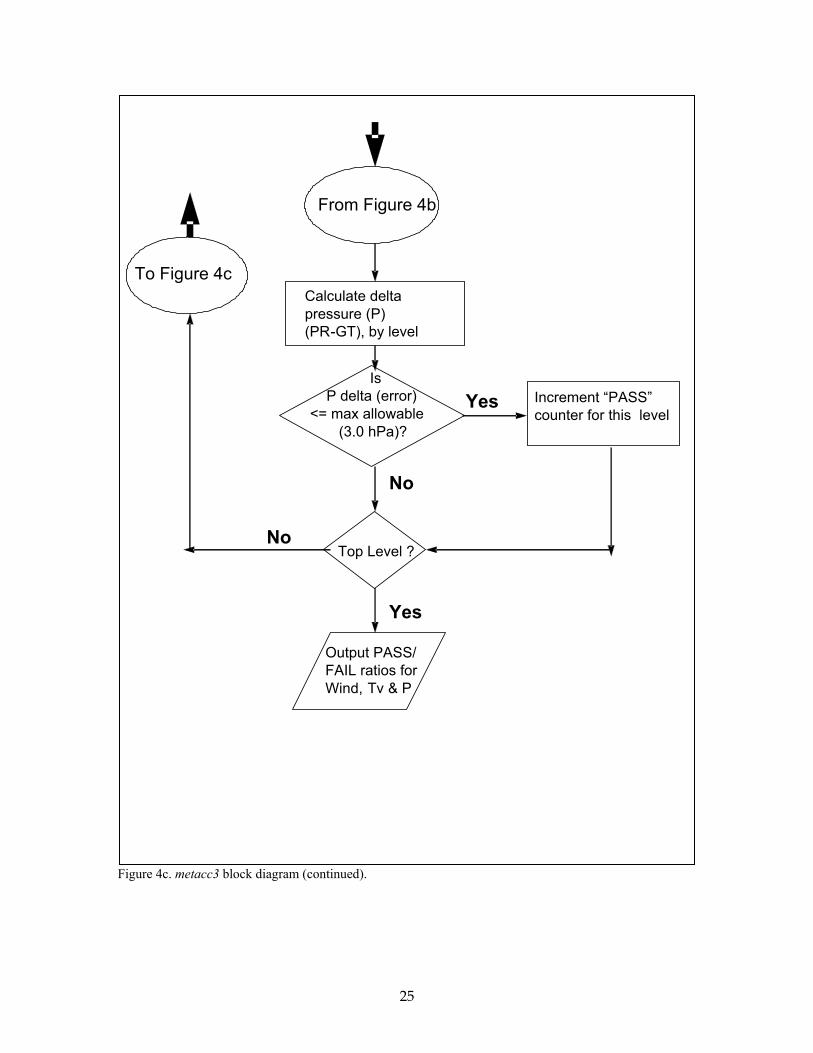
From Figure 4b
To Figure 4c Calculate delta pressure (P)
Figure 4c. metacc3 block diagram (continued).
(PR - GT), by level
Is P delta (error) Increment “PASS” Yes
<= max allowable counter for this level (3.0 hPa)?
No
No Top Level ?
Yes
Output PASS/ FAIL ratios for
Tv & P Wind,
25
In preparation for the DT, a methodology was required for evaluating the accuracy of the artillery Met messages that would be produced by the Profiler. Although the same PTC were to be applied to the evaluations, Met messages would be compared, rather than the files in the 53-level format. SA developed an Excel workbook to accomplish this analysis task. However, the T&E IPT preferred that the government conduct independent analyses of the DT datasets in order to spot-check the accuracy of the results produced by SA. Consequently, the metacc3 code was modified to accommodate this analysis (this modification was called compare_metcm), and it retained essentially the same block diagram as for metacc3. Several datasets were analyzed during the course of the DT, using both the Excel workbook and compare_metcm, and the same PASS/FAIL ratios were obtained.
5. Conclusion
At the request of the PM-TIMS, ARL/CISD/BED provided software to generate MET messages in several formats and to provide statistical analysis of these messages and tests results of the MMS-P. The PM and the T&E IPT also requested that BED transfer versions of both software products to the MMS-P prime contractor, SA. The algorithms expressed by the MET message codes became part of the MMS-P system software. Both the MET message generation program (a.k.a., convertdata) and the statistical analysis programs were used by government and contractor personnel to evaluate the performance of the MMS-P during the DT and other tests of the system. Due to the flexibility built into the MET message software, the software can be used for additional vertical structures of Met data with very minimal modification (e.g., it would require just setting up a new *_lvls file and changing input and output file names). Also both the message generation and statistical analysis software packages may be used for experiments that require any vertical structure of layered data, including new messages types that may be devised for non-line of sight systems of the future. The statistical analysis programs can be applied to other sets of Met data with minimal modification. These software packages have helped BED contribute to the development and testing of an Army system that represents the first major upgrade on artillery meteorology systems in over two decades.
26
6. References
Cogan, J. A Technique for Computation of Meteorological Variable Profiles for User Defined Heights and Layers; ASL-TMR-0005; U.S. Army Atmospheric Sciences Laboratory: White Sands Missile Range, NM, 1990.
Cogan, J.; Izaguirre, A. A preliminary Method for Atmospheric Soundings in Real Time Using Satellite and Ground-Based Remotely Sensed Data; ARL-TR-240; U.S. Army Research Laboratory: White Sands Missile Range, NM, 1993.
Department of the Army, Field Manual 6-15: Tactics, Techniques, and Procedures for Field Artillery Meteorology, Headquarters Department of the Army: Washington, DC, 1997.
Jameson, T.; D’Arcy, M.S. Artillery Firing Simulations Using “Met-Along-The-Trajectory”; ARL-TR-3221; U.S. Army Research Laboratory: White Sands Missile Range, NM, 2004.
Jameson, T. Computer Met Message Accuracy Studies Relating to the Met Measuring Set – Profiler; ARL-Project Report; U.S. Army Research Laboratory: White Sands Missile Range, NM, 2003.
Jameson, T.; Luces, S.; Knapp, D. Effects on SADARM Trajectory Simulations Using Meteorological Input from Local Balloons and the Battlescale Forecast Model for the 2000 RDAP and LUT Firings; ARL-TR-2720; U.S. Army Research Laboratory: White Sands Missile Range, NM, 2002.
North Atlantic Treaty Organization (NATO), NATO Standardization Agreement (STANAG) 4082: Adoption of a Standard Artillery Computer Meteorological Message, Brussels, Belgium, 1984.
Stauffer, D.; Seaman, N.; Schroeder A.; Deng, A.; Gibbs, A.; Hunter, G. Evaluations of a Rapidly Relocatable High-Resolution Numerical Model and Data Assimilation System for Meteorological Nowcasting. Twelfth PSU/NCAR Mesoscale Model Users’ Workshop, June 24-25, 2002; Boulder, CO; 48-51.
27

INTENTIONALLY LEFT BLANK.
Appendix
1. Sample message output
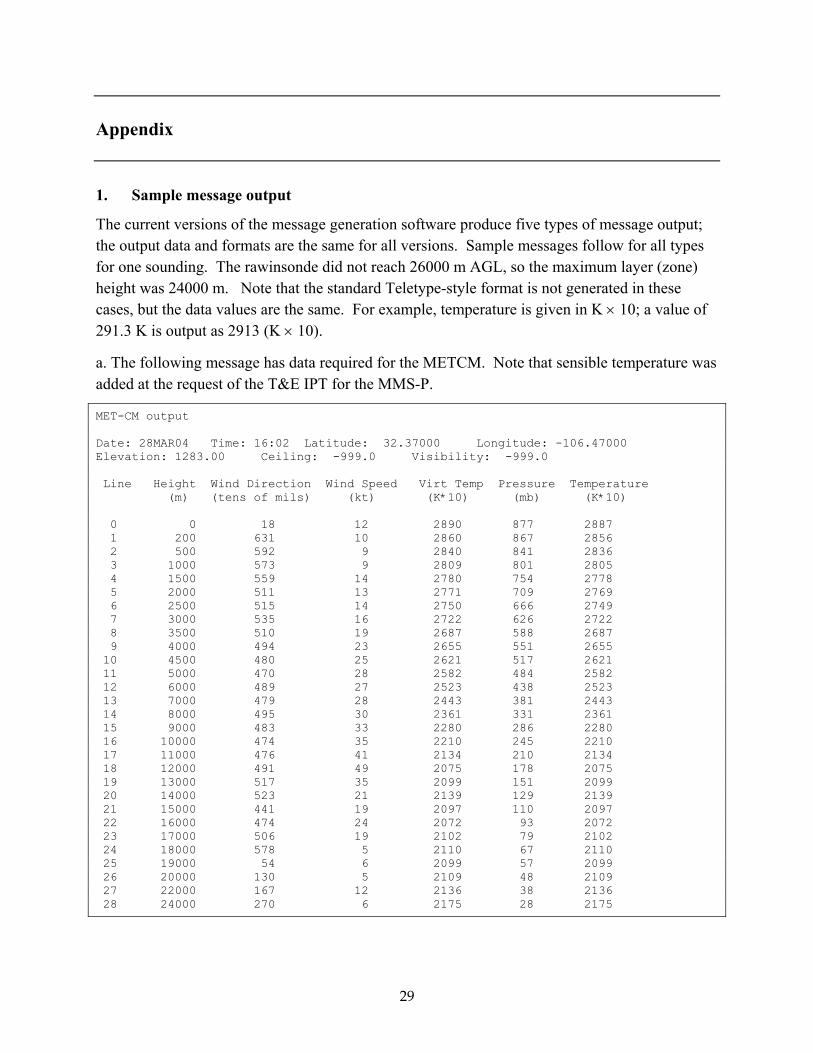
The current versions of the message generation software produce five types of message output; the output data and formats are the same for all versions. Sample messages follow for all types for one sounding. The rawinsonde did not reach 26000 m AGL, so the maximum layer (zone) height was 24000 m. Note that the standard Teletype-style format is not generated in these cases, but the data values are the same. For example, temperature is given in K × 10; a value of 291.3 K is output as 2913 (K × 10).
a. The following message has data required for the METCM. Note that sensible temperature was added at the request of the T&E IPT for the MMS-P.
MET-CM output Date: 28MAR04 Time: 16:02 Latitude: 32.37000 Longitude: -106.47000 Elevation: 1283.00 Ceiling: -999.0 Visibility: -999.0 Line Height Wind Direction Wind Speed Virt Temp Pressure Temperature (m) (tens of mils) (kt) (K*10) (mb) (K*10) 0 0 18 12 2890 877 2887 1 200 631 10 2860 867 2856 2 500 592 9 2840 841 2836 3 1000 573 9 2809 801 2805 4 1500 559 14 2780 754 2778 5 2000 511 13 2771 709 2769 6 2500 515 14 2750 666 2749 7 3000 535 16 2722 626 2722 8 3500 510 19 2687 588 2687 9 4000 494 23 2655 551 2655 10 4500 480 25 2621 517 2621 11 5000 470 28 2582 484 2582 12 6000 489 27 2523 438 2523 13 7000 479 28 2443 381 2443 14 8000 495 30 2361 331 2361 15 9000 483 33 2280 286 2280 16 10000 474 35 2210 245 2210 17 11000 476 41 2134 210 2134 18 12000 491 49 2075 178 2075 19 13000 517 35 2099 151 2099 20 14000 523 21 2139 129 2139 21 15000 441 19 2097 110 2097 22 16000 474 24 2072 93 2072 23 17000 506 19 2102 79 2102 24 18000 578 5 2110 67 2110 25 19000 54 6 2099 57 2099 26 20000 130 5 2109 48 2109 27 22000 167 12 2136 38 2136 28 24000 270 6 2175 28 2175
29
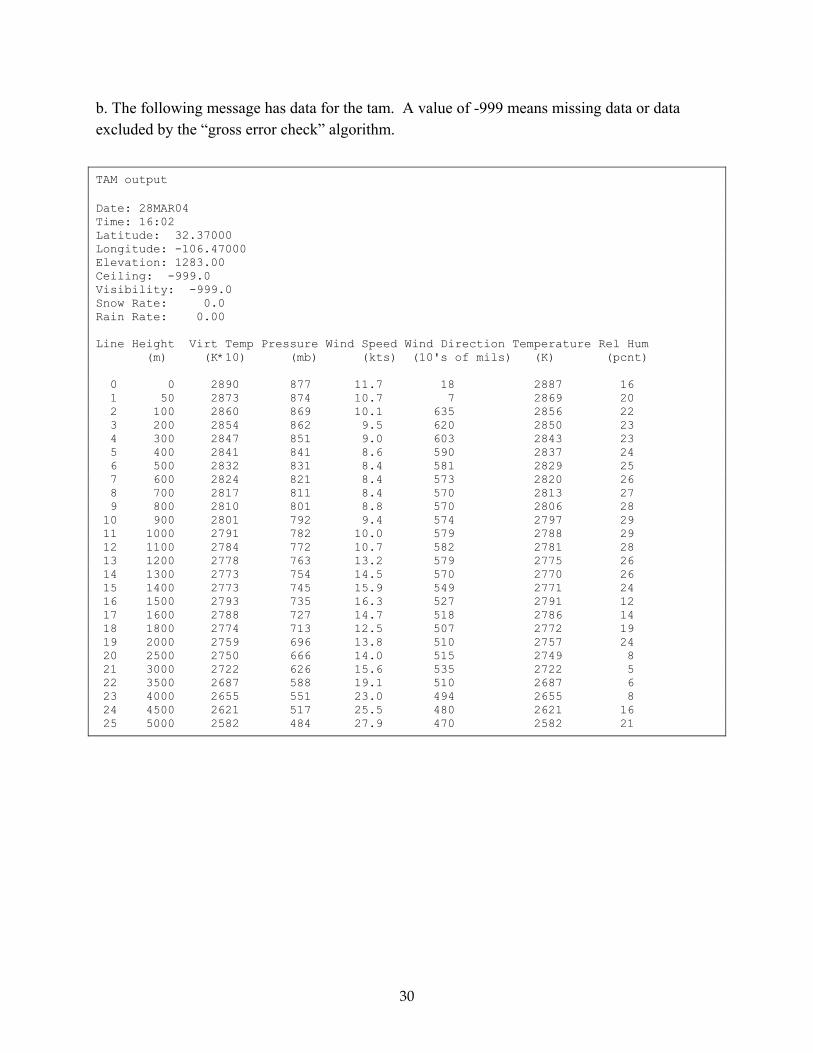
b. The following message has data for the tam. A value of -999 means missing data or data excluded by the “gross error check” algorithm.
TAM output Date: 28MAR04 Time: 16:02 Latitude: 32.37000 Longitude: -106.47000 Elevation: 1283.00 Ceiling: -999.0 Visibility: -999.0 Snow Rate: 0.0 Rain Rate: 0.00 Line Height Virt Temp Pressure Wind Speed Wind Direction Temperature Rel Hum (m) (K*10) (mb) (kts) (10's of mils) (K) (pcnt) 0 0 2890 877 11.7 18 2887 16 1 50 2873 874 10.7 7 2869 20 2 100 2860 869 10.1 635 2856 22 3 200 2854 862 9.5 620 2850 23 4 300 2847 851 9.0 603 2843 23 5 400 2841 841 8.6 590 2837 24 6 500 2832 831 8.4 581 2829 25 7 600 2824 821 8.4 573 2820 26 8 700 2817 811 8.4 570 2813 27 9 800 2810 801 8.8 570 2806 28 10 900 2801 792 9.4 574 2797 29 11 1000 2791 782 10.0 579 2788 29 12 1100 2784 772 10.7 582 2781 28 13 1200 2778 763 13.2 579 2775 26 14 1300 2773 754 14.5 570 2770 26 15 1400 2773 745 15.9 549 2771 24 16 1500 2793 735 16.3 527 2791 12 17 1600 2788 727 14.7 518 2786 14 18 1800 2774 713 12.5 507 2772 19 19 2000 2759 696 13.8 510 2757 24 20 2500 2750 666 14.0 515 2749 8 21 3000 2722 626 15.6 535 2722 5 22 3500 2687 588 19.1 510 2687 6 23 4000 2655 551 23.0 494 2655 8 24 4500 2621 517 25.5 480 2621 16 25 5000 2582 484 27.9 470 2582 21
30
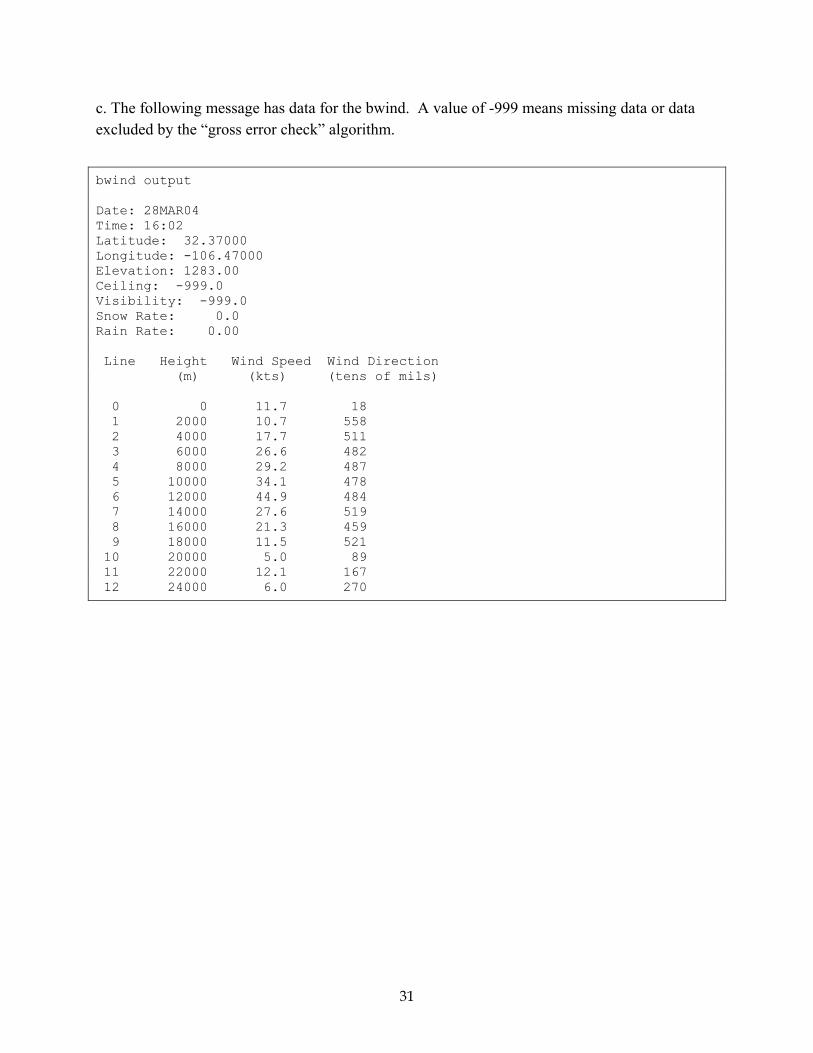
c. The following message has data for the bwind. A value of -999 means missing data or data excluded by the “gross error check” algorithm.
bwind output Date: 28MAR04 Time: 16:02 Latitude: 32.37000 Longitude: -106.47000 Elevation: 1283.00 Ceiling: -999.0 Visibility: -999.0 Snow Rate: 0.0 Rain Rate: 0.00 Line Height Wind Speed Wind Direction (m) (kts) (tens of mils) 0 0 11.7 18 1 2000 10.7 558 2 4000 17.7 511 3 6000 26.6 482 4 8000 29.2 487 5 10000 34.1 478 6 12000 44.9 484 7 14000 27.6 519 8 16000 21.3 459 9 18000 11.5 521 10 20000 5.0 89 11 22000 12.1 167 12 24000 6.0 270
31
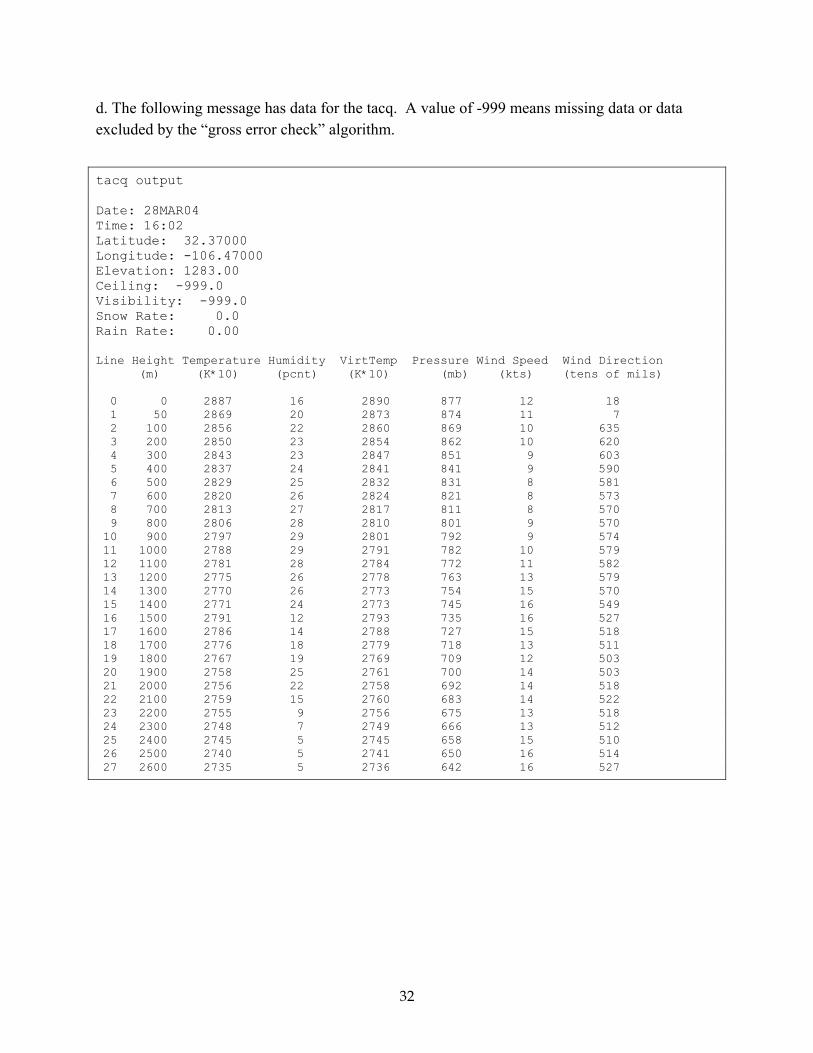
d. The following message has data for the tacq. A value of -999 means missing data or data excluded by the “gross error check” algorithm.
tacq output Date: 28MAR04 Time: 16:02 Latitude: 32.37000 Longitude: -106.47000 Elevation: 1283.00 Ceiling: -999.0 Visibility: -999.0 Snow Rate: 0.0 Rain Rate: 0.00 Line Height Temperature Humidity VirtTemp Pressure Wind Speed Wind Direction (m) (K*10) (pcnt) (K*10) (mb) (kts) (tens of mils) 0 0 2887 16 2890 877 12 18 1 50 2869 20 2873 874 11 7 2 100 2856 22 2860 869 10 635 3 200 2850 23 2854 862 10 620 4 300 2843 23 2847 851 9 603 5 400 2837 24 2841 841 9 590 6 500 2829 25 2832 831 8 581 7 600 2820 26 2824 821 8 573 8 700 2813 27 2817 811 8 570 9 800 2806 28 2810 801 9 570 10 900 2797 29 2801 792 9 574 11 1000 2788 29 2791 782 10 579 12 1100 2781 28 2784 772 11 582 13 1200 2775 26 2778 763 13 579 14 1300 2770 26 2773 754 15 570 15 1400 2771 24 2773 745 16 549 16 1500 2791 12 2793 735 16 527 17 1600 2786 14 2788 727 15 518 18 1700 2776 18 2779 718 13 511 19 1800 2767 19 2769 709 12 503 20 1900 2758 25 2761 700 14 503 21 2000 2756 22 2758 692 14 518 22 2100 2759 15 2760 683 14 522 23 2200 2755 9 2756 675 13 518 24 2300 2748 7 2749 666 13 512 25 2400 2745 5 2745 658 15 510 26 2500 2740 5 2741 650 16 514 27 2600 2735 5 2736 642 16 527
32
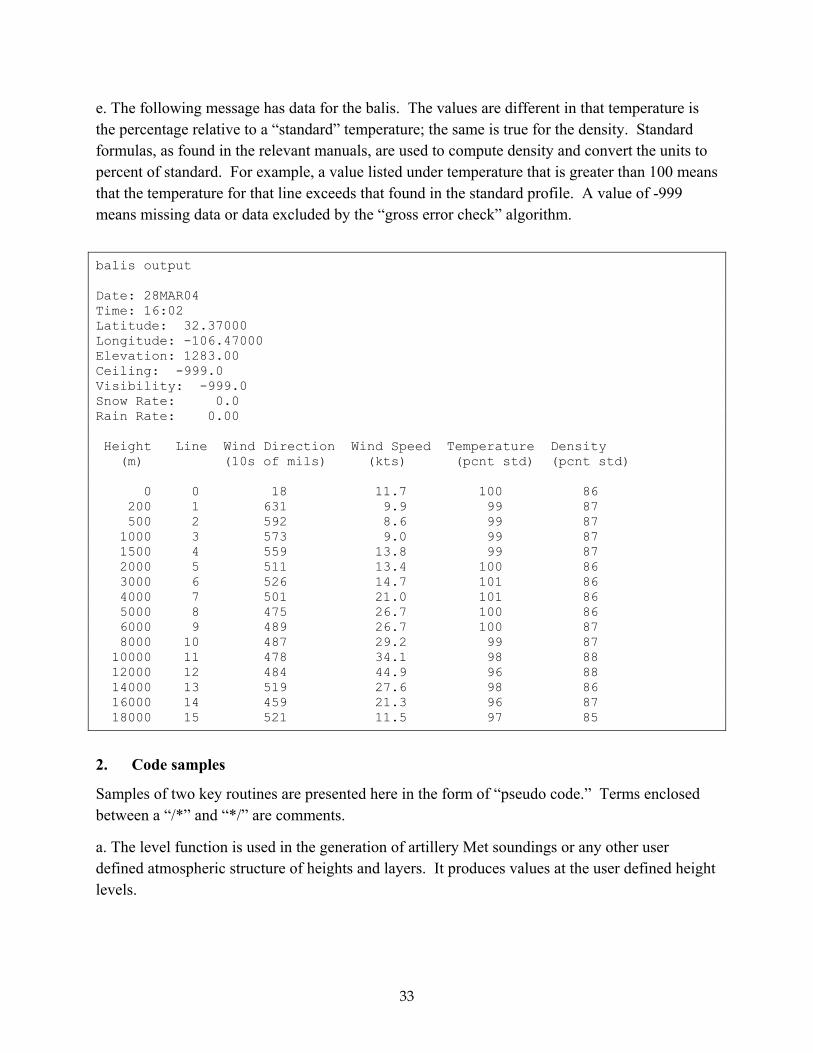
e. The following message has data for the balis. The values are different in that temperature is the percentage relative to a “standard” temperature; the same is true for the density. Standard formulas, as found in the relevant manuals, are used to compute density and convert the units to percent of standard. For example, a value listed under temperature that is greater than 100 means that the temperature for that line exceeds that found in the standard profile. A value of -999 means missing data or data excluded by the “gross error check” algorithm.
balis output Date: 28MAR04 Time: 16:02 Latitude: 32.37000 Longitude: -106.47000 Elevation: 1283.00 Ceiling: -999.0 Visibility: -999.0 Snow Rate: 0.0 Rain Rate: 0.00 Height Line Wind Direction Wind Speed Temperature Density (m) (10s of mils) (kts) (pcnt std) (pcnt std) 0 0 18 11.7 100 86 200 1 631 9.9 99 87 500 2 592 8.6 99 87 1000 3 573 9.0 99 87 1500 4 559 13.8 99 87 2000 5 511 13.4 100 86 3000 6 526 14.7 101 86 4000 7 501 21.0 101 86 5000 8 475 26.7 100 86 6000 9 489 26.7 100 87 8000 10 487 29.2 99 87 10000 11 478 34.1 98 88 12000 12 484 44.9 96 88 14000 13 519 27.6 98 86 16000 14 459 21.3 96 87 18000 15 521 11.5 97 85
2. Code samples
Samples of two key routines are presented here in the form of “pseudo code.” Terms enclosed between a “/*” and “*/” are comments.
a. The level function is used in the generation of artillery Met soundings or any other user defined atmospheric structure of heights and layers. It produces values at the user defined height levels.
33
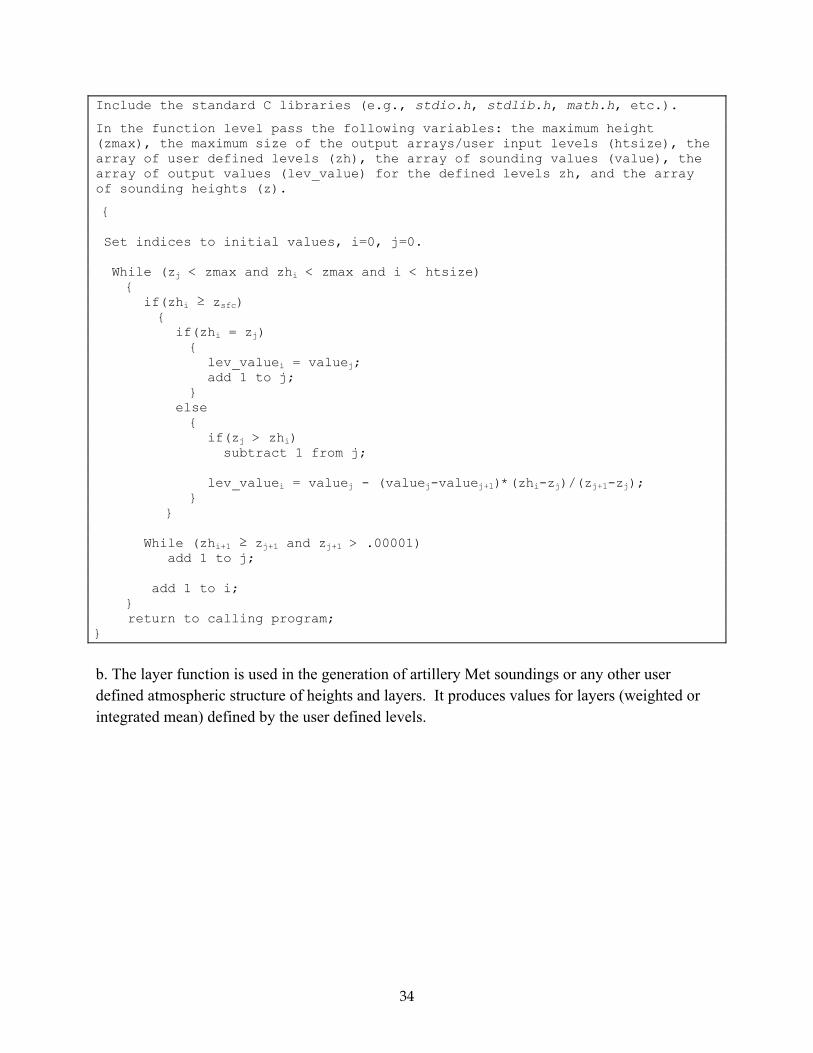
Include the standard C libraries (e.g., stdio.h, stdlib.h, math.h, etc.).
In the function level pass the following variables: the maximum height (zmax), the maximum size of the output arrays/user input levels (htsize), the array of user defined levels (zh), the array of sounding values (value), the array of output values (lev_value) for the defined levels zh, and the array of sounding heights (z).
{ Set indices to initial values, i=0, j=0. While (zj < zmax and zhi < zmax and i < htsize) { if(zhi ≥ zsfc) { if(zhi = zj) { lev_valuei = valuej; add 1 to j; } else { if(zj > zhi) subtract 1 from j; lev_valuei = valuej - (valuej-valuej+1)*(zhi-zj)/(zj+1-zj); } } While (zhi+1 ≥ zj+1 and zj+1 > .00001) add 1 to j; add 1 to i; } return to calling program; }
b. The layer function is used in the generation of artillery Met soundings or any other user defined atmospheric structure of heights and layers. It produces values for layers (weighted or integrated mean) defined by the user defined levels.
34
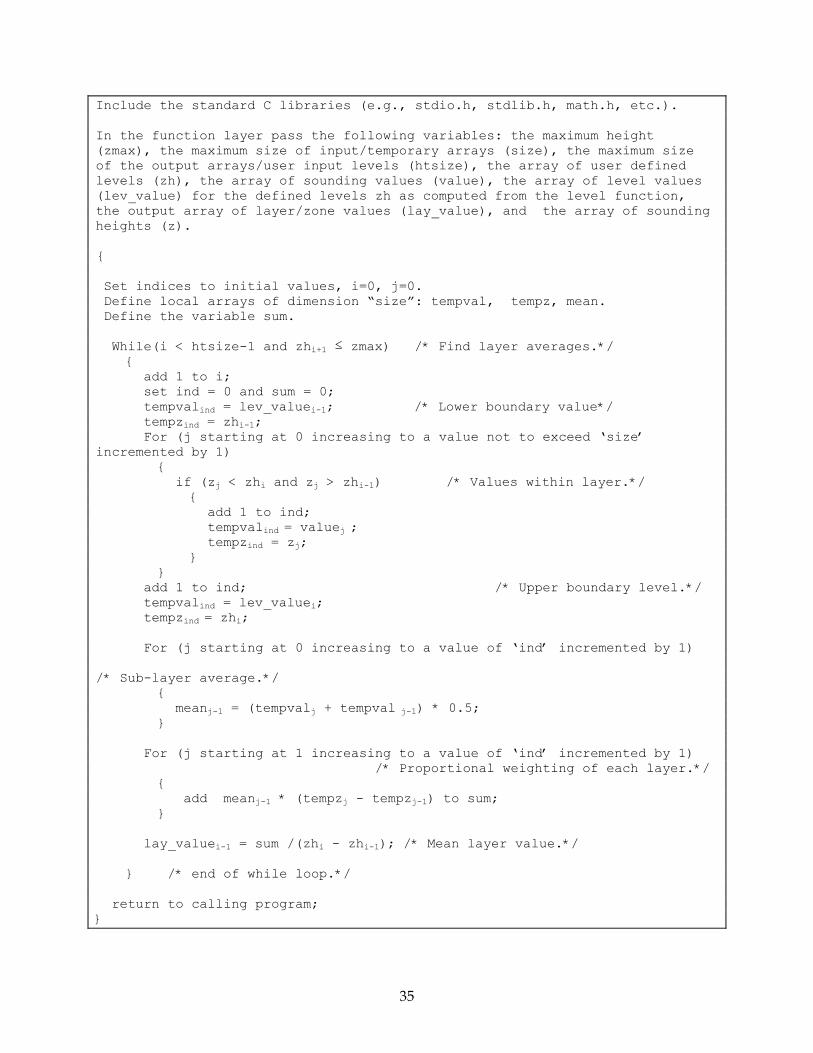
Include the standard C libraries (e.g., stdio.h, stdlib.h, math.h, etc.). In the function layer pass the following variables: the maximum height (zmax), the maximum size of input/temporary arrays (size), the maximum size of the output arrays/user input levels (htsize), the array of user defined levels (zh), the array of sounding values (value), the array of level values (lev_value) for the defined levels zh as computed from the level function, the output array of layer/zone values (lay_value), and the array of sounding heights (z). { Set indices to initial values, i=0, j=0. Define local arrays of dimension “size”: tempval, tempz, mean. Define the variable sum. While(i < htsize-1 and zhi+1 ≤ zmax) /* Find layer averages.*/ { add 1 to i; set ind = 0 and sum = 0; tempval = lev_valuei-1; /* Lower boundary value*/ ind
tempzind = zhi-1; For (j starting at 0 increasing to a value not to exceed ‘size’ incremented by 1) { if (zj < zhi and zj > zhi-1) /* Values within layer.*/ { add 1 to ind; tempvalind = valuej ; tempzind = zj; } } add 1 to ind; /* Upper boundary level.*/ tempvalind = lev_valuei; tempzind = zhi; For (j starting at 0 increasing to a value of ‘ind’ incremented by 1) /* Sub-layer average.*/ { meanj-1 = (tempvalj + tempval j-1) * 0.5; } For (j starting at 1 increasing to a value of ‘ind’ incremented by 1) /* Proportional weighting of each layer.*/ { add meanj-1 * (tempzj - tempzj-1) to sum; } lay_valuei-1 = sum /(zhi - zhi-1); /* Mean layer value.*/ } /* end of while loop.*/ return to calling program; }
35

INTENTIONALLY LEFT BLANK.
Acronyms
AGL above ground level
ANSI American National Standards Institute
ARL U.S. Army Research Laboratory
balis Ballistic Met
BED Battlefield Environment Division
BL Boundary Layer
bwind Basic Wind Message
CC Correlation Coefficient
CISD Computational and Information Sciences Directorate
DT Developmental Test
EC East Coast
FA Field Artillery
GPS Global Positioning System
GT ground truth
IPT Integration Process Team
LORAN long range navigation
MB Mean Bias
MAE Mean Absolute Error
MATLAB Matrix Laboratory
Met meteorological
METCM computer Met message
METFM1 Fallout Messages
METTA1 Target Acquisition Messages
MET-TALL Met message-Target Area Low Level
MM5 Mesoscale Model Version 5
MMS Meteorological Measuring Set
MMS-P Meteorological Measuring Set – Profiler
MSL mean sea level
NATO North Atlantic Treaty Organization
37
P pressure
PM-TIMS Product Manager – Target Identification and Meteorological Systems
PR Profiler
PTC Profiler Test Criteria
PTU pressure/temperature/humidity
raob rawinsonde observation
RDF Radio Direction Finder
RH relative humidity
RMSE Root Mean Square Error
SA Smiths Aerospace
SDD System Development and Demonstration
STANAG Standardization Agreement
tacq Target Acquisition
tam or TAM target area meteorological message
T&E Test and Evaluation
UTC universal time coordinated
WSMR White Sands Missile Range
38
Distribution List
Copies ARMY MISSILE COMMAND 1 AMSMI RD TE F ATTN MET TEAM REDSTONE ARSENAL AL 35898 ARMY MISSILE COMMAND 1 REDSTONE SCI INFO CTR AMSMI RD CE R DOCUMENTS REDSTONE ARSENAL AL 35898-5253 METEOROLOGIST IN CHARGE 1 KWAJALEIN MISSILE RANGE PO BOX 67 APO SAN FRANCISCO CA 96555 US ARMY RESEARCH LAB 1 AMSRD ARL CI ATTN J GANTT 2800 POWDER MILL ROAD ADELPHI MD 20783-1197 US ARMY RESEARCH LAB 1 AMSRD ARL SE EE ATTN DR SZTANKAY 2800 POWDER MILL ROAD ADELPHI MD 20783 USAF ROME LAB TECH LIB 1 FL2810 CORRIDOR W STE 262 RLSUL DOCUMENTS LIBRARY 26 ELECTRIC PKWY BLDG 106 GRIFFISS AFB ROME NY 13441-4514 ARMY FLD ARTILLERY SCHOOL 2 ATTN ATSF FOS E NEWTON G WEHRI FT SILL OK 73503
39
Copies PRODUCT MANAGER TIMS 2 ATTN SFAE IEW&S NS TIMS B GRIFFIES MAJ WALLINGTON FT MONMOUTH NJ 07703 ARMY DUGWAY PROVING GRND 1 STEDP MT M ATTN MR BOWERS DUGWAY UT 84022-5000 ARMY FOREIGN SCI&TECH CTR 1 DRXST IS I 220 7TH STREET NE CHARLOTTESVILLE VA 22901-5396 NAVAL SURFACE WEAPONS CTR 1 CODE G63 DAHLGREN VA 22448-5000 NIGHT VIS ELEC OPTIC LAB 1 FORT BELVOIR MET TEAM ATTN MR R SMITH FT BELVOIR VA 22060-5677 ADMNSTR 1 DEFNS TECHL INFO CTR ATTN DTIC OCP W SMITH 8725 JOHN J KINGMAN RD STE 0944 FT BELVOIR VA 22060-6218 US ARMY RESEARCH LAB 1 ATTN AMSRD ARL CI IS R MAIL & RECORDS MGMT ADELPHI MD 20783-1197 US ARMY RESEARCH LAB 2 AMSRD ARL CI OK TL 2800 POWDER MILL ROAD ADELPHI MD 20783-1197
40
Copies NAVAL RESEARCH LAB 1 MARINE MET DIV 7 GRACE HOPPER AVE STOP 2 MONTEREY CA 93943-5502 US ARMY RESEARCH LAB 1 ATTN SFAE C3T IE II ROBERT DICKENSHIED WSMR NM 88002 US ARMY RESEARCH LAB 2 ATTN AMSRD ARL CI EB T JAMESON J COGAN WSMR NM 88002-5501 TOTAL 22
41

INTENTIONALLY LEFT BLANK.