Embed Size (px)
Citation preview
METEOROLOGY
GEL-1370
Chapter NineChapter Nine
Weather ForecastingWeather Forecasting
Goal for this ChapterWe are going to learn answers to the following questions:• Is weather prediction an exact science? If not, why not?• What are the different methods of data collection?• How does weather watch differs from weather warning?• What is a prog and how does it differ from analysis?• How are computer-generated weather forecasts prepared?• What is ensemble forecasting?• What are the different methods used to predict movement
of a surface mid-latitude cyclonic storm?
Acquisition of weather information• Weather forecasting is not an exact science• Over 10,000 land-based stations and hundreds of ships
provide surface weather info 4 times/day; major airports conditions hourly
• WMO: World Meteorological Organization; over 130 nations; responsible for the international exchange of weather data
• NCEP:National Center for Environmental Prediction (NCEP) formerly called National Meteorological Center, in Camp Springs, MD – all meteorological data is analyzed, prepare weather maps and charts and prediction of weather on a global and national scale begins (this transmitted to private & public agencies)
Weather Information & forecasting tools
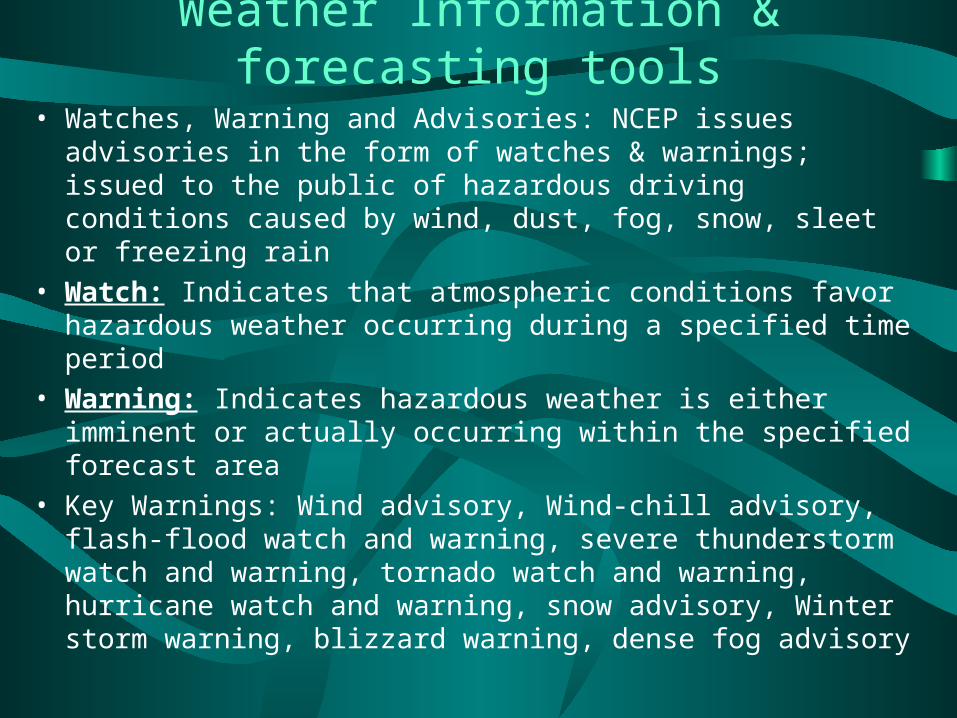
• Watches, Warning and Advisories: NCEP issues advisories in the form of watches & warnings; issued to the public of hazardous driving conditions caused by wind, dust, fog, snow, sleet or freezing rain
• Watch: Indicates that atmospheric conditions favor hazardous weather occurring during a specified time period
• Warning: Indicates hazardous weather is either imminent or actually occurring within the specified forecast area
• Key Warnings: Wind advisory, Wind-chill advisory, flash-flood watch and warning, severe thunderstorm watch and warning, tornado watch and warning, hurricane watch and warning, snow advisory, Winter storm warning, blizzard warning, dense fog advisory
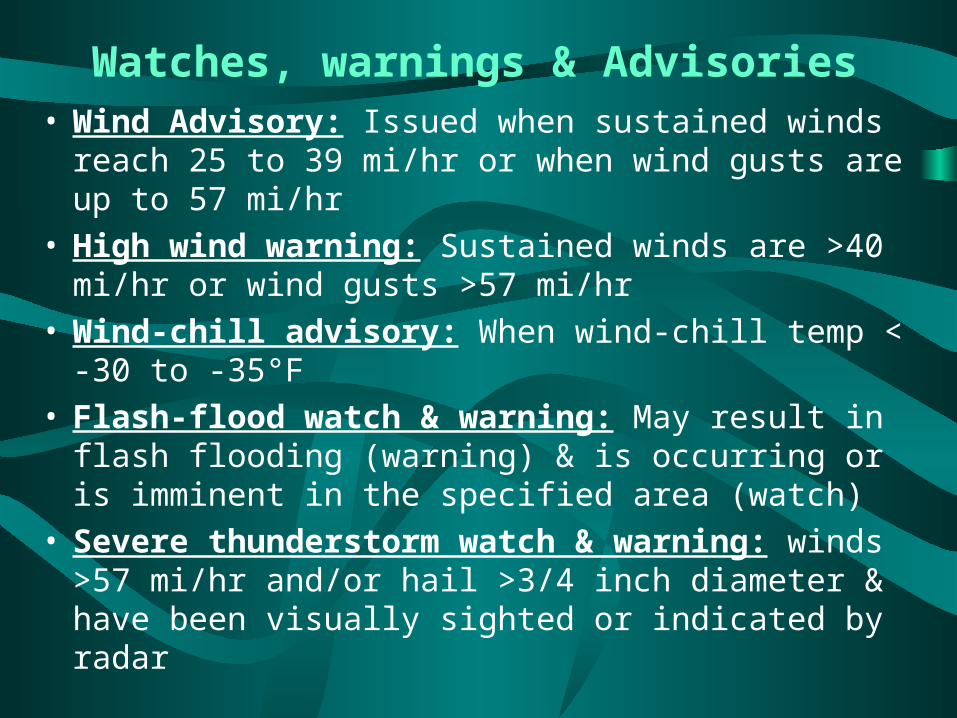
Watches, warnings & Advisories• Wind Advisory: Issued when sustained winds reach 25
to 39 mi/hr or when wind gusts are up to 57 mi/hr• High wind warning: Sustained winds are >40 mi/hr or
wind gusts >57 mi/hr• Wind-chill advisory: When wind-chill temp < -30 to -
35°F• Flash-flood watch & warning: May result in flash
flooding (warning) & is occurring or is imminent in the specified area (watch)
• Severe thunderstorm watch & warning: winds >57 mi/hr and/or hail >3/4 inch diameter & have been visually sighted or indicated by radar
Watches, warnings & advisories – contd.
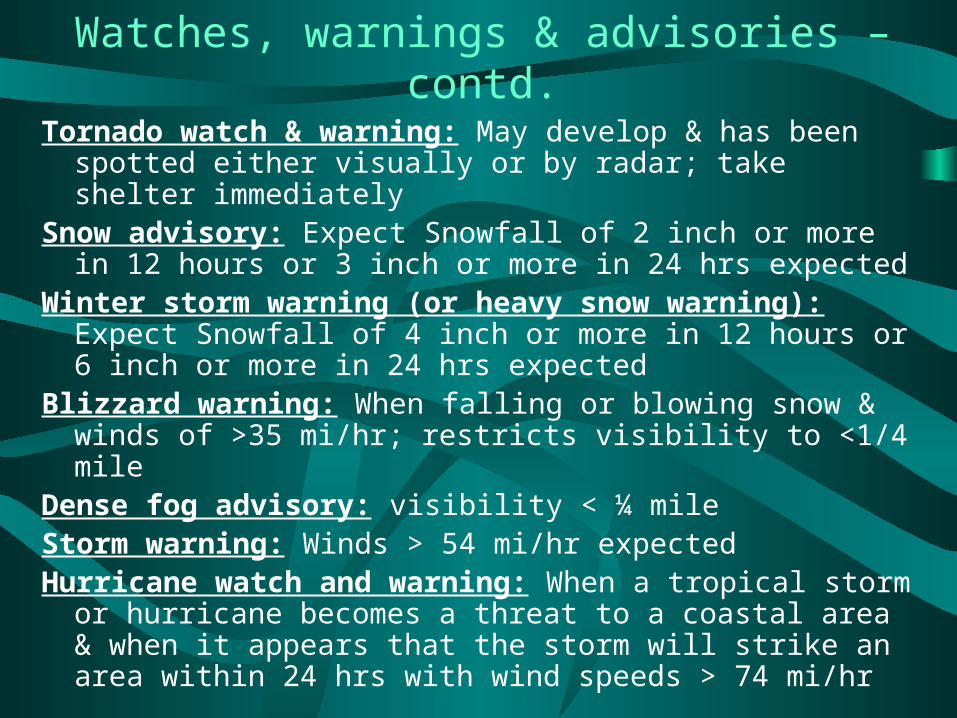
Tornado watch & warning: May develop & has been spotted either visually or by radar; take shelter immediately
Snow advisory: Expect Snowfall of 2 inch or more in 12 hours or 3 inch or more in 24 hrs expected
Winter storm warning (or heavy snow warning): Expect Snowfall of 4 inch or more in 12 hours or 6 inch or more in 24 hrs expected
Blizzard warning: When falling or blowing snow & winds of >35 mi/hr; restricts visibility to <1/4 mile
Dense fog advisory: visibility < ¼ mileStorm warning: Winds > 54 mi/hr expectedHurricane watch and warning: When a tropical storm or
hurricane becomes a threat to a coastal area & when it appears that the storm will strike an area within 24 hrs with wind speeds > 74 mi/hr
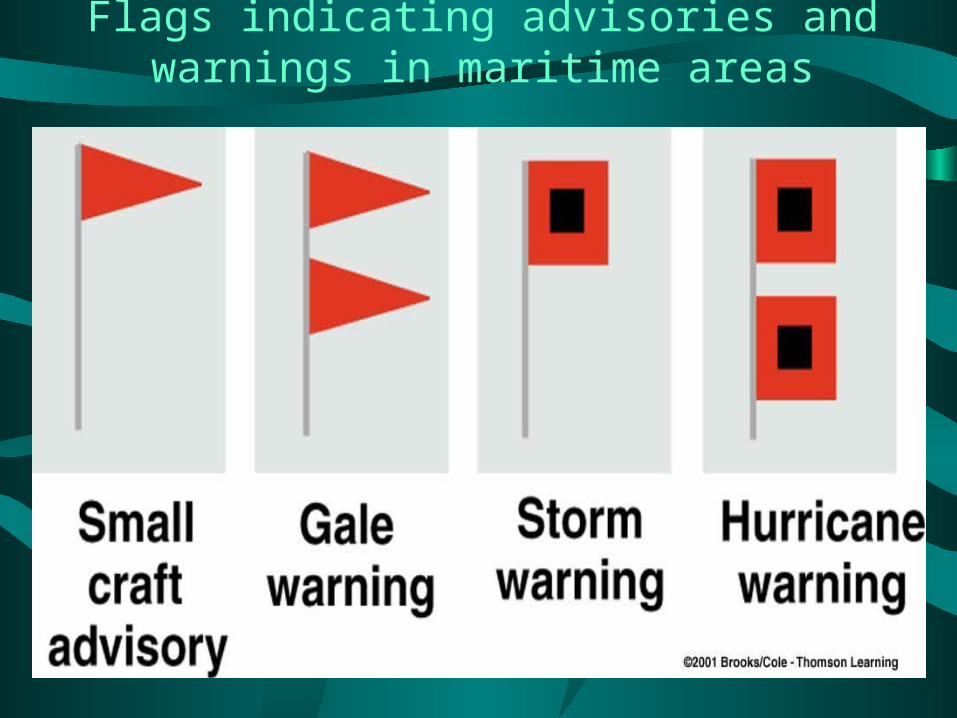
Flags indicating advisories and warnings in maritime areas
Computer and Weather Forecasting: Numerical weather prediction
• Analysis: The drawing & interpretation of the pattern of various weather elements on a surface or upper-air chart
• Numerical weather prediction: Daily forecasting of weather based upon the solutions of mathematical equations by high-speed computers
• Atmospheric models: Simulation of the atmosphere’s behavior by mathematical equations or by physical models
• Method of solution: dozens of equations describe how atmospheric parameters (temp, pressure, humidity, wind speed & direction) change with time ---each equation is solved a future t & for a large number of locations – “grid points” --- Each equation is solved for many (50) levels in the atmosphere; calculated values are put back in to those equations and calculated for the next interval of time and so on for 12, 24, 36, 48, 120 hours & so on.
Computer & Weather forecasting – contd.
• Prognostic Chart (Prog): A chart showing expected or forecasted atmospheric conditions (pressure patterns, frontal positions, and so on); forecasters use prog as a guide to predict the weather
• Variability in weather prediction: Variety of models, each produce slightly different interpretation of the weather mainly due to the way the models are used, what model is used, distance of grid points, etc. Some models are better than others for a specific task (such as predicting the position of the trough on upper-level chart, position of surface lows, etc)
Why sometimes forecasts don’t work??
• Factors that affect the prediction of weather (such as surface temp, winds, precipitation) forecasts:
• 1) Each models idealize the atmosphere and the assumptions made about the atmosphere may be on target on some times, but not all the times
• 2) Many models are not global in their coverage and thus, the model’s assumed boundaries could lead to errors (e.g., air masses entering from western Pacific in to North America, if the boundary is set as the west coast & not including the western Pacific); global model would involve longer computation time
• 3) Sparness of data: Data from oceans and high latitudes are sparse; data from satellites have helped; computer’s forecast is as good as the data fed in to it
Why sometimes forecasts don’t work?? – contd.
• 4) Inadequate representation of many pertinent processes (e.g., interactions of water, ice & local terrain on weather systems, such as radiation budget locally, etc.)
• Some models take large geographic features (oceans, mountain chains) neglecting small scale features (hills and lakes) and could have a marked influence on local weather
• 5) Inherent chaotic behavior within the atmosphere: Several small, unpredictable atmospheric fluctuations and disturbances (and the uncertainties) get amplified with time in projecting the weather farther into the future
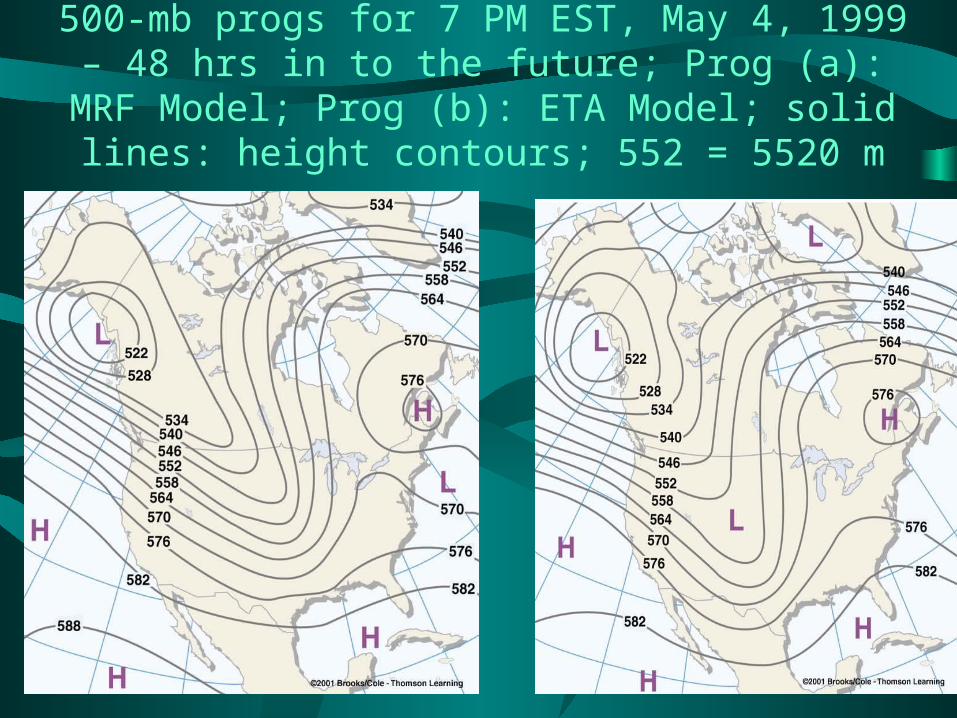
500-mb progs for 7 PM EST, May 4, 1999 – 48 hrs in to the future; Prog (a): MRF Model; Prog (b): ETA Model;
solid lines: height contours; 552 = 5520 m
Tools for Forecasting the Weather
• High-speed data modeling systems are used• AWIPS (Advanced Weather Interactive Processing
System) processes information received from the Doppler radar system and the Automated Surface Observing System (ASOS) operated in airports; ASOS systems provide continuous information on wind, temp, pressure, cloud-base height, & runway visibility
• Soundings: A two-dimensional vertical profile of temperature, dew point & winds
• Several meteorological indexes can aid in determining the likelihood of thunderstorms, tornadoes & hail
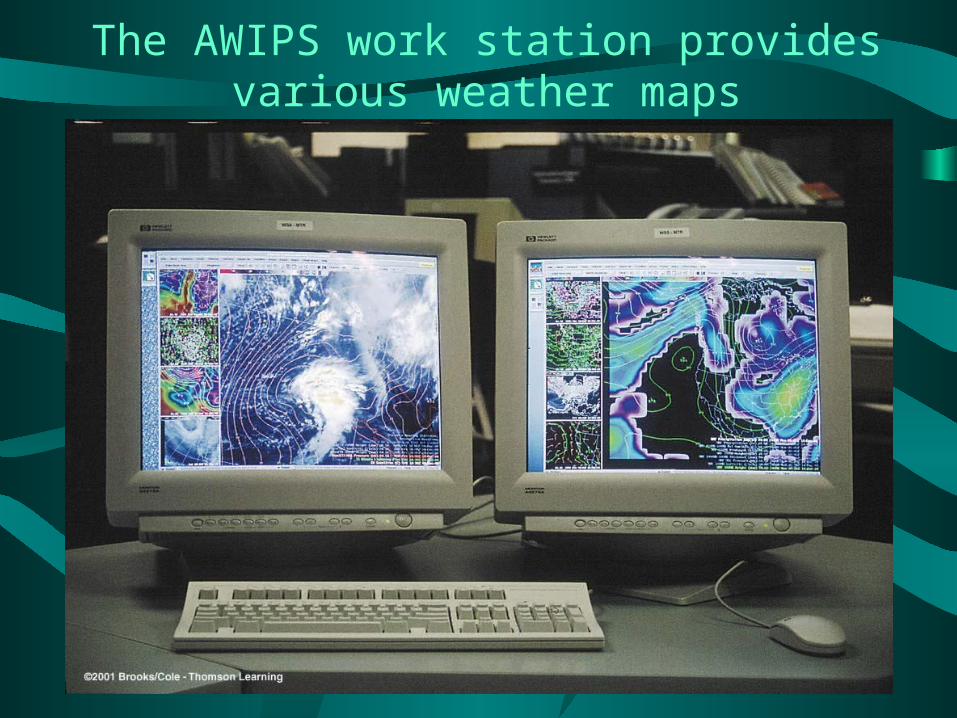
The AWIPS work station provides various weather maps
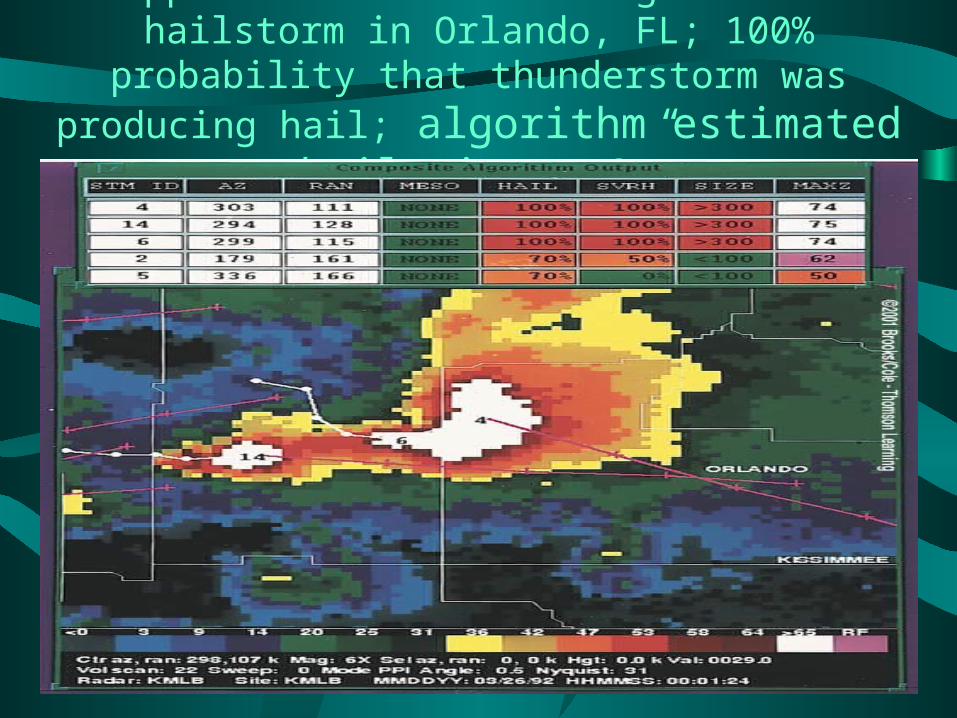
Doppler Radar data during a severe hailstorm in Orlando, FL; 100% probability that thunderstorm was producing
hail; algorithm estimated hail size > 3”
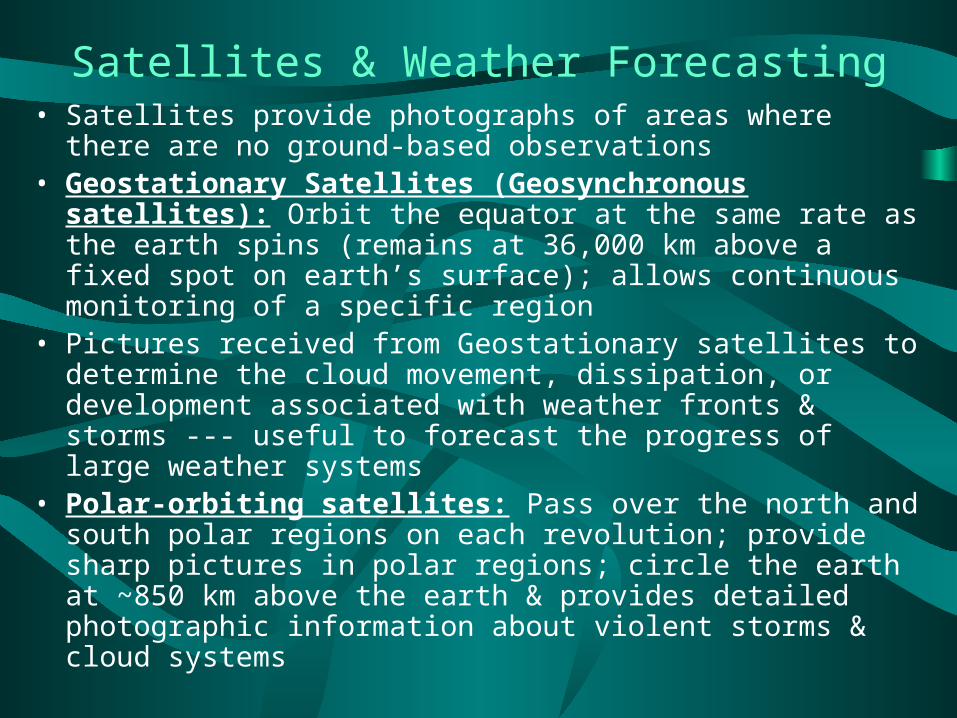
Satellites & Weather Forecasting• Satellites provide photographs of areas where there are no ground-
based observations• Geostationary Satellites (Geosynchronous satellites): Orbit the
equator at the same rate as the earth spins (remains at 36,000 km above a fixed spot on earth’s surface); allows continuous monitoring of a specific region
• Pictures received from Geostationary satellites to determine the cloud movement, dissipation, or development associated with weather fronts & storms --- useful to forecast the progress of large weather systems
• Polar-orbiting satellites: Pass over the north and south polar regions on each revolution; provide sharp pictures in polar regions; circle the earth at ~850 km above the earth & provides detailed photographic information about violent storms & cloud systems
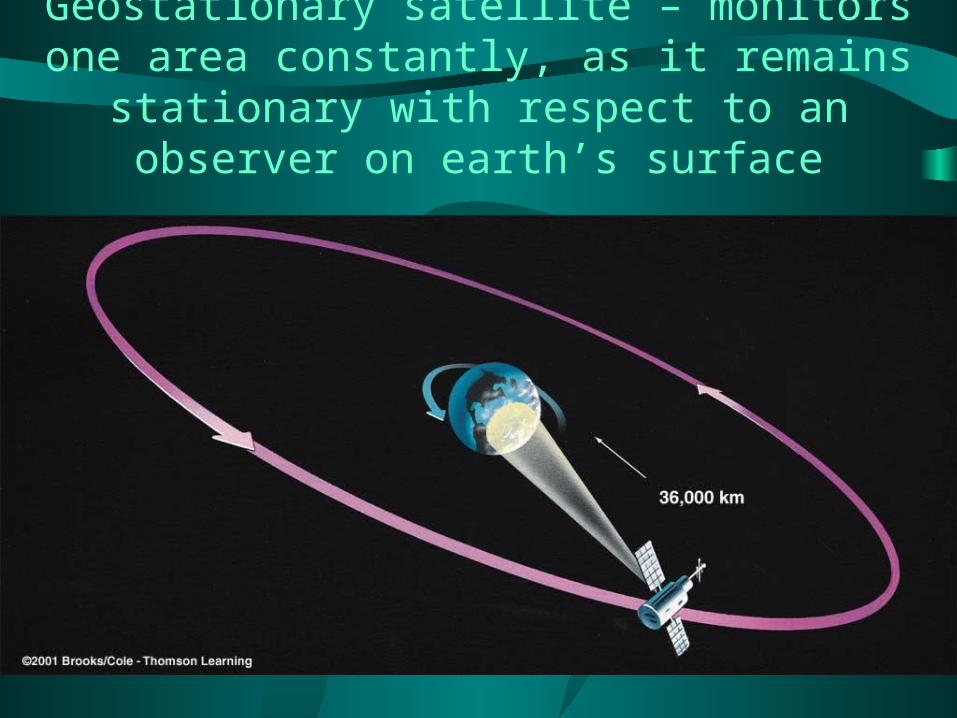
Geostationary satellite – monitors one area constantly, as it remains stationary with respect to an observer on
earth’s surface
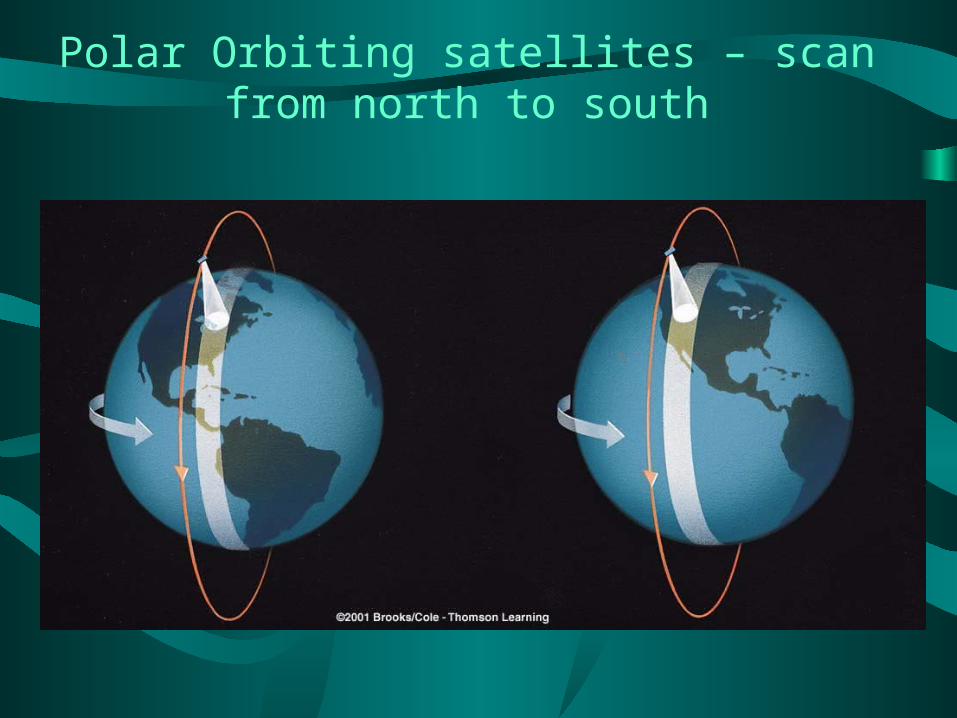
Polar Orbiting satellites – scan from north to south

Satellites – contd.
• Satellites use radiometers to observe clouds both day & night (by detecting radiation from top of the clouds)
• Imager: Advanced radiometer that satellite pictures with much better resolution
• Sounder: Advanced radiometer that provides a more accurate profile of temp, moisture at different levels in the atmosphere
• Infrared satellite picture can distinguish warm, low clouds from cold, high clouds (warm objects radiate more energy than cold objects)

Infrared satellite picture can distinguish warm, low (Gray) clouds from cold, high (white) clouds
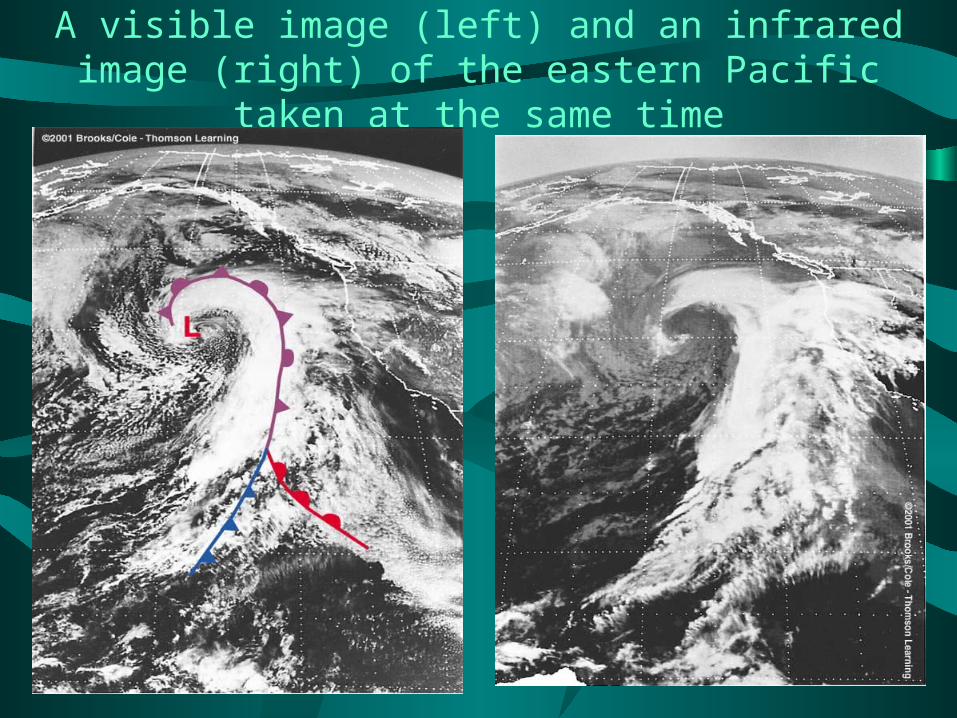
A visible image (left) and an infrared image (right) of the eastern Pacific taken at the same time
Satellites – contd.
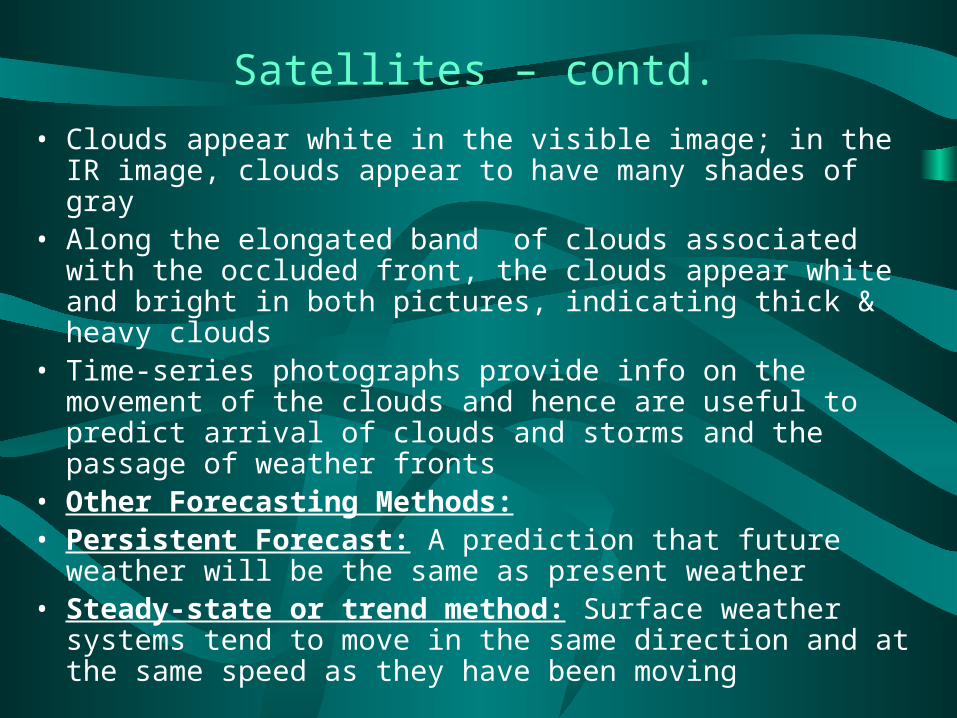
• Clouds appear white in the visible image; in the IR image, clouds appear to have many shades of gray
• Along the elongated band of clouds associated with the occluded front, the clouds appear white and bright in both pictures, indicating thick & heavy clouds
• Time-series photographs provide info on the movement of the clouds and hence are useful to predict arrival of clouds and storms and the passage of weather fronts
• Other Forecasting Methods:• Persistent Forecast: A prediction that future weather will be the
same as present weather• Steady-state or trend method: Surface weather systems tend to
move in the same direction and at the same speed as they have been moving
Other forecasting methods – contd.
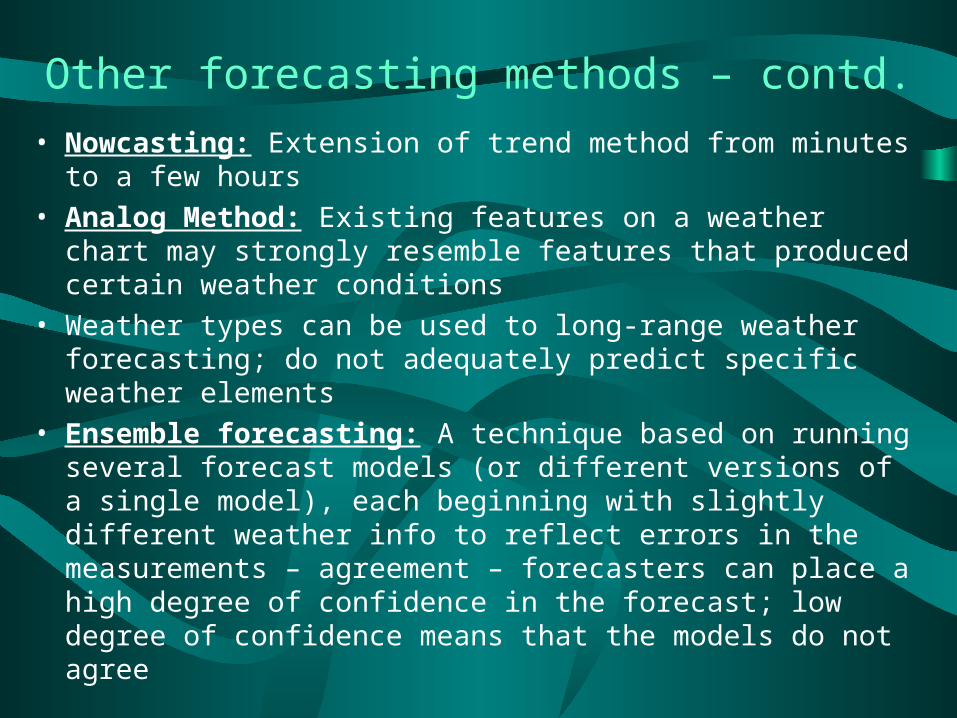
• Nowcasting: Extension of trend method from minutes to a few hours
• Analog Method: Existing features on a weather chart may strongly resemble features that produced certain weather conditions
• Weather types can be used to long-range weather forecasting; do not adequately predict specific weather elements
• Ensemble forecasting: A technique based on running several forecast models (or different versions of a single model), each beginning with slightly different weather info to reflect errors in the measurements – agreement – forecasters can place a high degree of confidence in the forecast; low degree of confidence means that the models do not agree
Forecasting – contd.
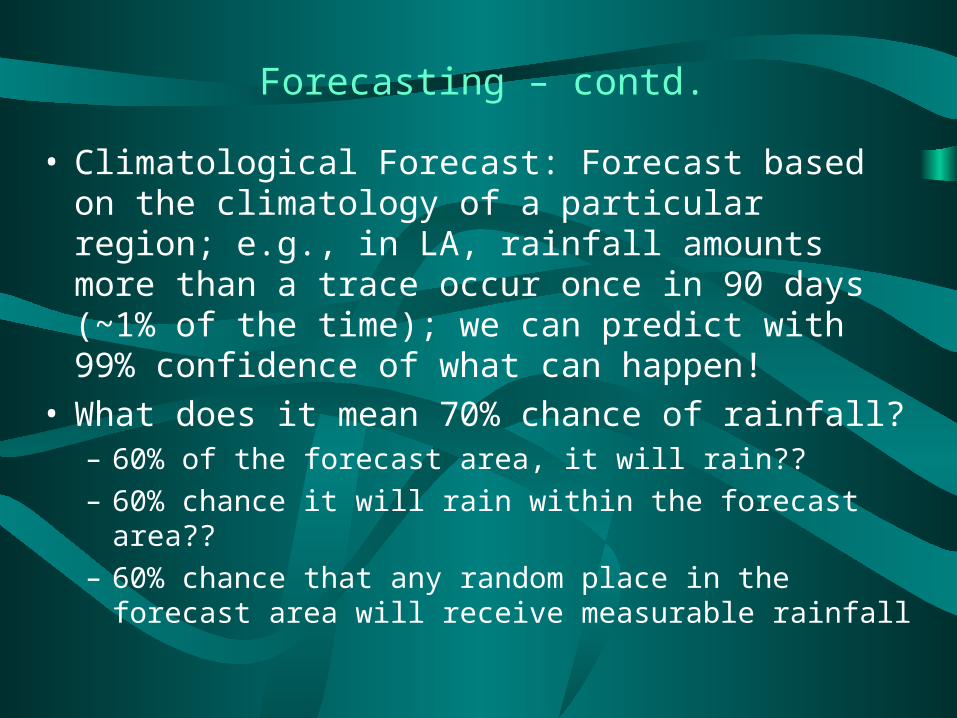
• Climatological Forecast: Forecast based on the climatology of a particular region; e.g., in LA, rainfall amounts more than a trace occur once in 90 days (~1% of the time); we can predict with 99% confidence of what can happen!
• What does it mean 70% chance of rainfall?– 60% of the forecast area, it will rain??
– 60% chance it will rain within the forecast area??
– 60% chance that any random place in the forecast area will receive measurable rainfall
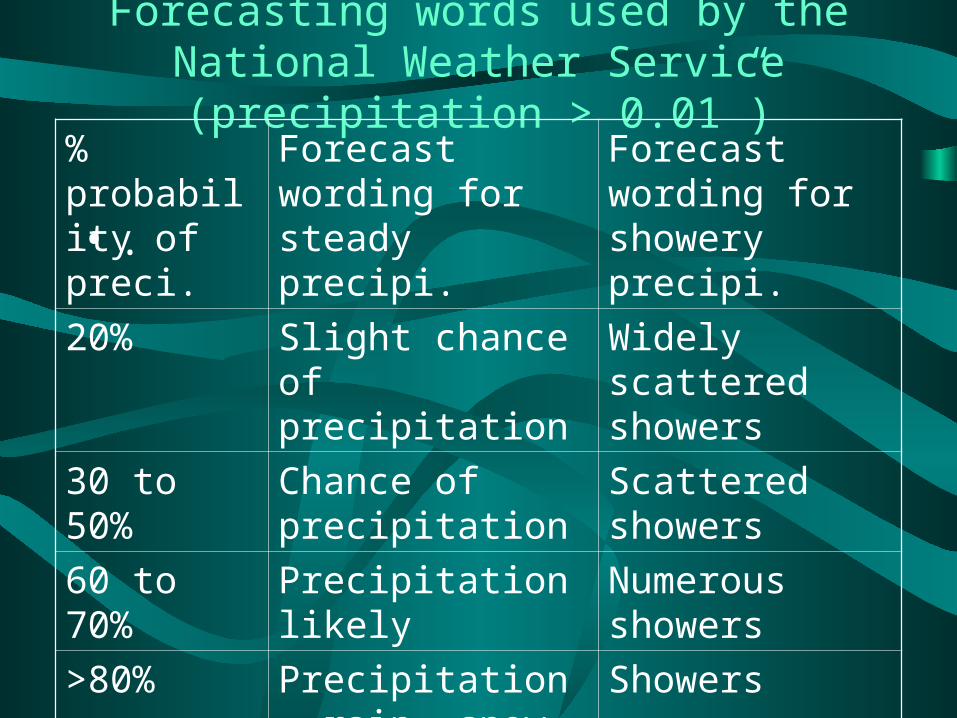
Forecasting words used by the National Weather Service (precipitation > 0.01”)
• .
% probability of preci.
Forecast wording for steady precipi.
Forecast wording for showery precipi.
20% Slight chance of precipitation
Widely scattered showers
30 to 50% Chance of precipitation
Scattered showers
60 to 70% Precipitation likely Numerous showers
>80% Precipitation, rain, snow
Showers
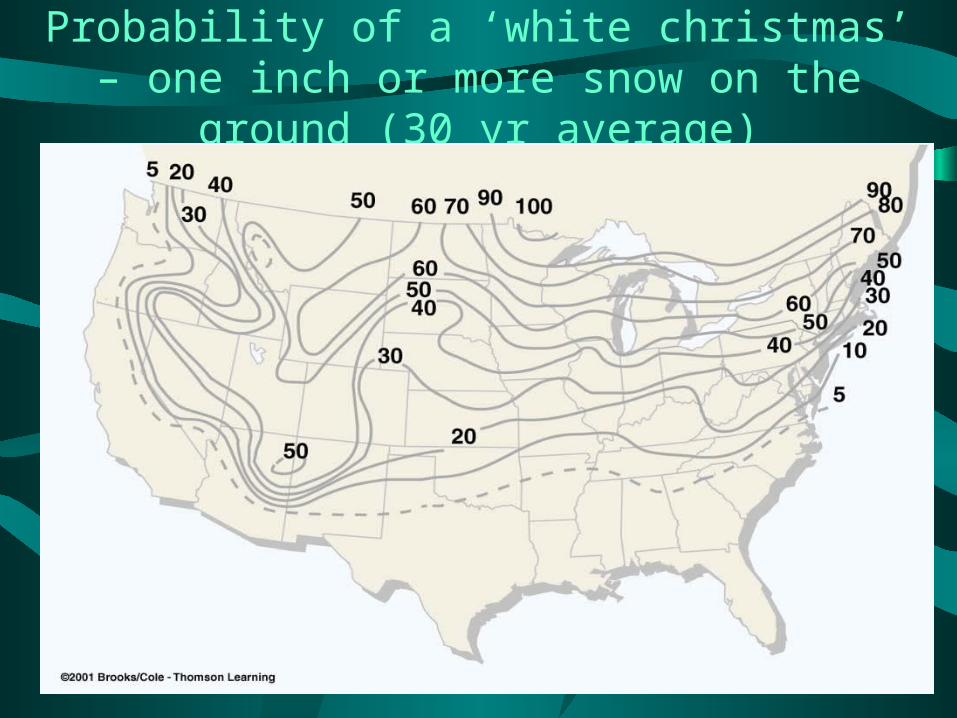
Probability of a ‘white christmas’ – one inch or more snow on the ground (30 yr average)
Accuracy and skill in weather forecasting
• Forecasts made for 12-24 hrs are usually accurate• 1-3 day forecasts are reasonably good – not perfect;
better than 50%• With longer time, the accuracy decreases and >7 days,
accuracy falls off rapidly• The forecast must be better than current weather or the
normal (climatology) weather; in LA example• Teleconnection prediction: Warming of the equatorial
tropical Pacific affects weather in different regions of the world; the interactions, where a warmer tropical Pacific can influence rainfall in CA are called ‘teleconnections’ – aids to predict seasonal changes, but not diurnal
Predicting weather from local signs
• A halo around the moon portends rain – Why?– Halo is caused by by the bending of light as it passes through
ice crystals and that ice crystals-type clouds (cirrostratus) are often the forerunners of an approaching storm
Few forecasting rules that may be applied when making a short-range local weather forecast
Observation Indication Local weather forecast
Surface winds from Possible cool Possible
S or SW; clouds front & thunder- showers;
Building to the west; storms approaching possibly,
Warm (hot) & humid from the west turning cooler;
windy
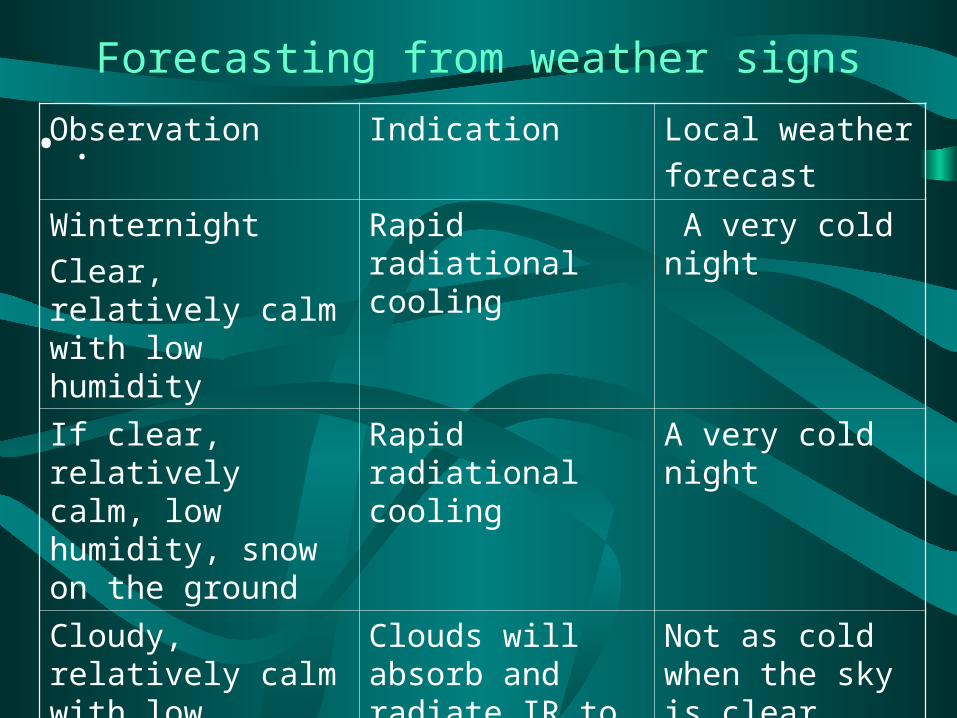
Forecasting from weather signs
• .Observation Indication Local weather
forecast
Winternight
Clear, relatively calm with low humidity
Rapid radiational cooling
A very cold night
If clear, relatively calm, low humidity, snow on the ground
Rapid radiational cooling
A very cold night
Cloudy, relatively calm with low humidity
Clouds will absorb and radiate IR to surface
Not as cold when the sky is clear
Summer night:
Clear, hot, humid
Strong absorption/emission of IR
High minimum temp

Contd. Observation Indication Local weather
forecast
Clear and relatively dry More rapid radiational cooling
Lower min temp
If surface winds are from N and become NE, then E, then SE
Surface high pressure area moving to E; low pressure approaching from W
Increasing clouds with the possibility of precipitation within 24 hours
If surface winds are from NE then N, then NW
Surface low pressure area is moving to the east, surface high press. Approaching from W
Possible showers or thunderstorms with gusty winds
Afternoon cumulus clouds with flat bases, and tops at just about the same level
Stable layer above the clouds
Partly cloud, with no precipitation
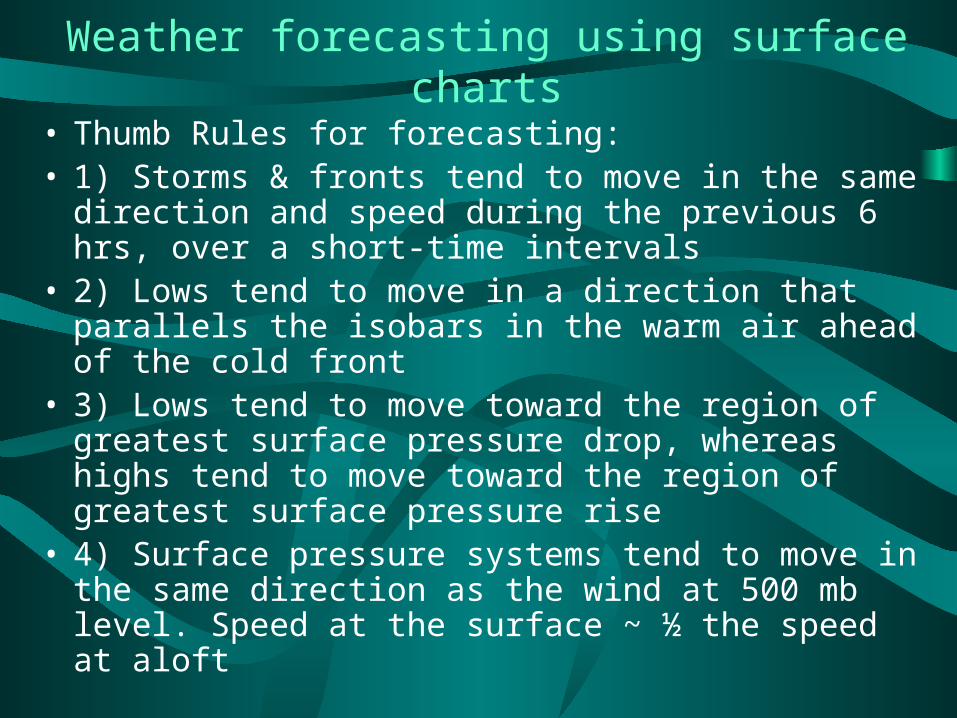
Weather forecasting using surface charts
• Thumb Rules for forecasting:• 1) Storms & fronts tend to move in the same direction
and speed during the previous 6 hrs, over a short-time intervals
• 2) Lows tend to move in a direction that parallels the isobars in the warm air ahead of the cold front
• 3) Lows tend to move toward the region of greatest surface pressure drop, whereas highs tend to move toward the region of greatest surface pressure rise
• 4) Surface pressure systems tend to move in the same direction as the wind at 500 mb level. Speed at the surface ~ ½ the speed at aloft
Forecast example
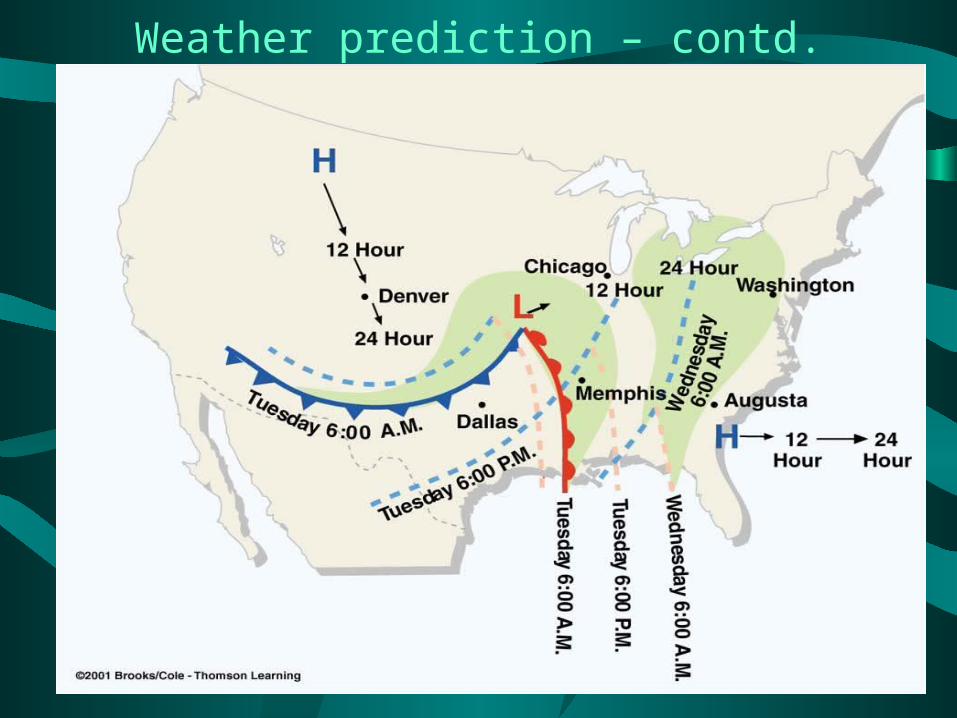
• Projection of pressure systems, fronts and current weather in to the future by assuming steady-state conditions (12- 24 hours projection)
• The storm center over the Central Plains and should move northeast; the 500-mb chart suggests that the surface low should move northeast at a speed of 25 knots
• Six Cities:• Augusta (GA), Washington D.C., Chicago, Memphis,
Dallas, and Denver
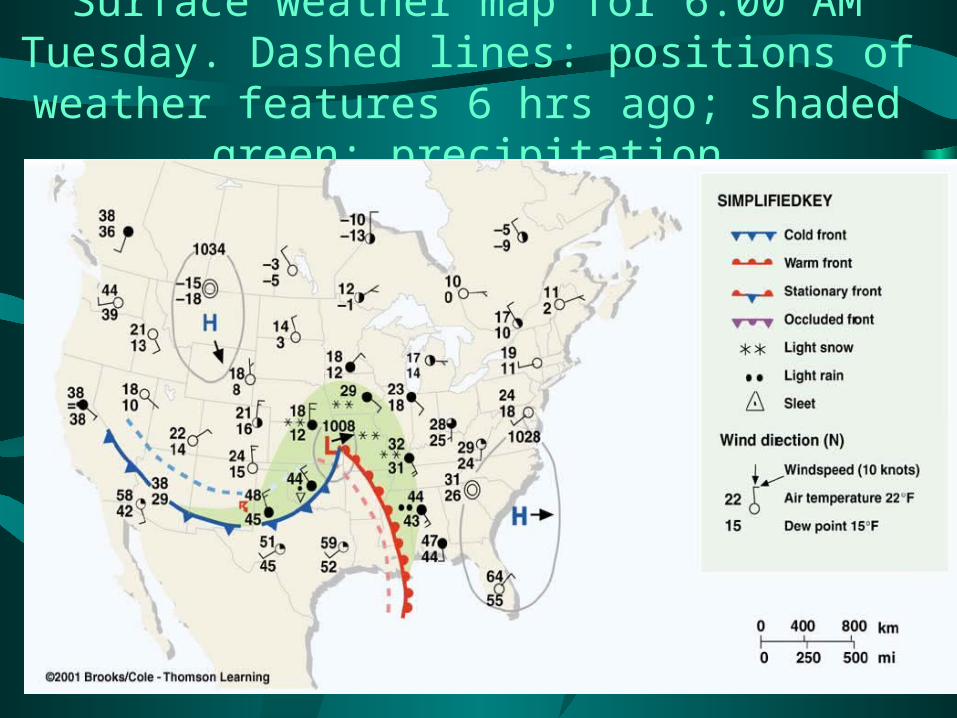
Surface weather map for 6:00 AM Tuesday. Dashed lines: positions of weather features 6 hrs ago; shaded
green: precipitation
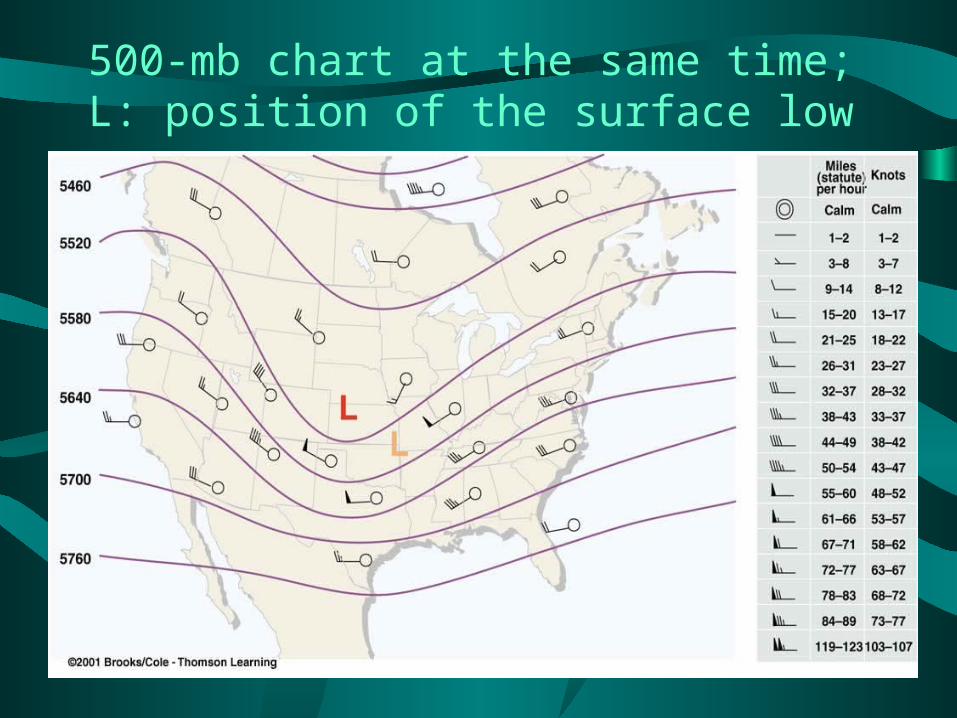
500-mb chart at the same time; L: position of the surface low
Weather Forecast
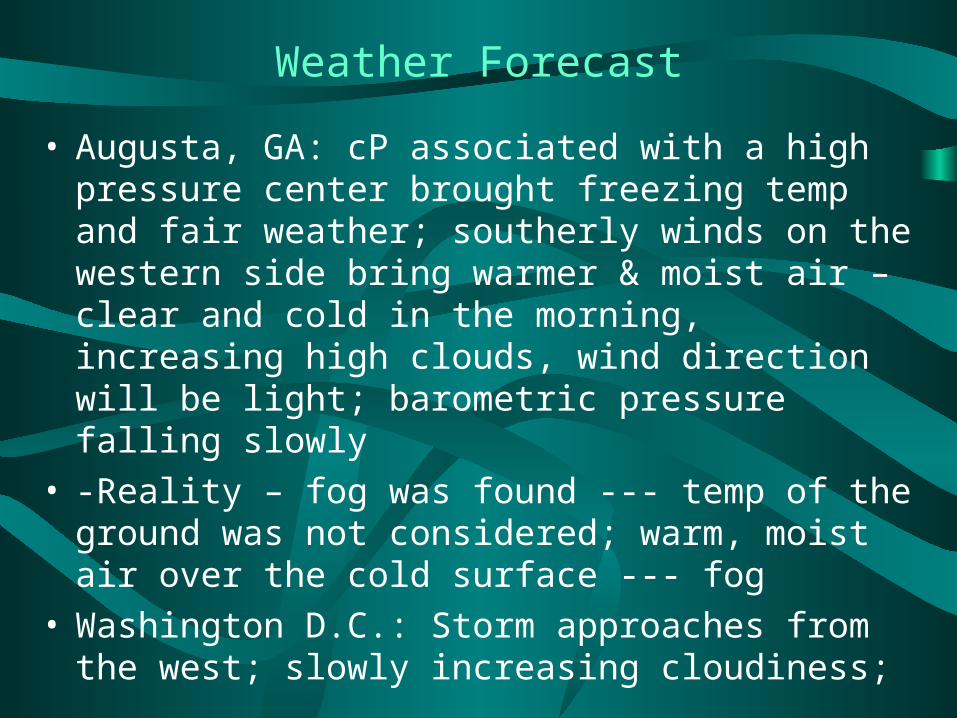
• Augusta, GA: cP associated with a high pressure center brought freezing temp and fair weather; southerly winds on the western side bring warmer & moist air – clear and cold in the morning, increasing high clouds, wind direction will be light; barometric pressure falling slowly
• -Reality – fog was found --- temp of the ground was not considered; warm, moist air over the cold surface --- fog
• Washington D.C.: Storm approaches from the west; slowly increasing cloudiness;
Weather prediction – contd.
Weather prediction – contd.
• Sleet was found – not predicted – Why?? Intensification of the storm; influx of warmer air from the ocean slowly raised the surface temp and the sleet soon became rain
• Chicago: Major snowstorm – total snowfall is 12 inches – actual snowfall is 13 inch – problem storm system slowed as it became occluded
• Memphis, TN: Predicted thunderstorm did not materialize; winds were not strong enough to mix the cold, moist air that had settled in the valleys with the warm air above
Weather prediction – contd.
• Dallas: Gulf of Mexico effect• Denver: Rocky mountain effect• Problems associated with the prediction

Surface weather map for 6:00 AM wednesday
Summary – Chapter -9
• Warning and Watch• Problem with modern day weather prediction• Prog, numerical weather prediction• Geosynchronous satellites• IR images vs visible images• Persistent forecast, Steady-state forecast, nowcasting,
analogue weather prediction• Ensemble weather forecasting & probability forecasting• Problems associated with forecasting