Embed Size (px)
Citation preview
Metformin promotes isolated rat liver mitochondria impairment
Cristina Carvalho Æ Sonia Correia Æ Maria S. Santos ÆRaquel Seica Æ Catarina R. Oliveira Æ Paula I. Moreira
Received: 4 July 2007 / Accepted: 13 September 2007 / Published online: 2 October 2007
� Springer Science+Business Media, LLC. 2007
Abstract Metformin, a drug widely used in the treatment
of type 2 diabetes, has recently received attention due to
the new and contrasting findings regarding its effects on
mitochondrial function. In the present study, we evaluated
the effect of metformin in isolated rat liver mitochondria
status. We observed that metformin concentrations ‡8 mM
induce an impairment of the respiratory chain characterized
by a decrease in RCR and state 3 respiration. However,
only metformin concentrations ‡10 mM affect the oxida-
tive phosphorylation system by decreasing the
mitochondrial transmembrane potential and increasing the
repolarization lag phase. Moreover, our results show that
metformin does not prevent H2O2 production, neither
protects against lipid peroxidation induced by the pro-
oxidant pair ADP/Fe2+. In addition, we observed that
metformin exacerbates Ca2+-induced permeability transi-
tion pore opening by decreasing the capacity of
mitochondria to accumulate Ca2+ and increasing the oxi-
dation of thiol groups. Taken together, our results show
that metformin can promote liver mitochondria injury
predisposing to cell death.
Keywords Liver � Metformin � Mitochondria �Oxidative phosphorylation system �Permeability transition pore � Respiratory chain
Introduction
Metformin is an oral antihyperglycemic drug widely used
in the treatment of type 2 diabetes [1]. The primary action
of this biguanide derivative is the suppression of hepatic
glucose production and the enhancement of peripheral
glucose uptake. Therefore, metformin normalizes plasma
glucose levels without any stimulation of insulin produc-
tion and for this reason it is considered an insulin
sensitizer. Despite the success of this antidiabetic agent in
the treatment of type 2 diabetes, its mechanism(s) of action
remain(s) unclear. Zhou et al. [2] reported that metformin
activates AMP-activated protein kinase (AMPK), a major
cellular regulator of lipid and glucose metabolism, in
hepatocytes. Furthermore, it has been shown that metfor-
min possesses a direct scavenging effect against
oxygenated free radicals generated in vitro [3], and
decreases intracellular production of reactive oxygen spe-
cies (ROS) in aortic endothelial cells through the reduction
of both NAD(P)H oxidase and/or the mitochondrial respi-
ratory chain pathways [4]. Moreover, it has also been
shown that metformin inhibits mitochondrial complex I
activity leading to the impairment of mitochondrial func-
tion [5–7]. However, it has also been shown that metformin
prevents the mitochondrial permeability transition pore
(PTP) opening in both permeabilized and intact KB cells
[8], and in permeabilized human microvascular endothelial
Cristina Carvalho and Sonia Correia contributed equally to this work.
C. Carvalho � S. Correia � M. S. Santos
Department of Zoology – Faculty of Sciences and Technology,
University of Coimbra, Coimbra 3000-354, Portugal
M. S. Santos � R. Seica � C. R. Oliveira � P. I. Moreira (&)
Center for Neuroscience and Cell Biology, University of
Coimbra, Coimbra 3004-517, Portugal
e-mail: [email protected]
R. Seica � P. I. Moreira
Institute of Physiology – Faculty of Medicine, University of
Coimbra, Coimbra 3000-354, Portugal
C. R. Oliveira
Institute of Biochemistry – Faculty of Medicine, University of
Coimbra, Coimbra 3000-354, Portugal
123
Mol Cell Biochem (2008) 308:75–83
DOI 10.1007/s11010-007-9614-3
cells (HMEC-1) [9]. In opposition, Isakovic et al. [10]
reported that metformin acts as a PTP inducer in C6 rat
glioma cell line.
Mitochondria are intracellular organelles mainly devo-
ted to energy production but they also play a crucial role in
the production of reactive species and the onset of cell
death [11]. A common mechanism involved in mitochon-
drial dysfunction is the PTP which is modulated by several
physiological factors [12, 13]. Although Ca2+ is considered
to be the most important inducer, matrix pH, transmem-
brane electrical potential (DWm), Mg2+, Pi, cyclophilin D,
oxidative stress and adenine nucleotides are also effective
regulators, while the immunosuppressive agent cyclosporin
A (CsA) is considered to be a specific inhibitor of PTP
[13–15].
Due to the contradictory results concerning the action of
metformin on mitochondrial status, in the present study, we
aimed to evaluate the effect of metformin in isolated rat
liver mitochondria. Our first task was the evaluation of the
impact of increasing concentrations of metformin (0.5, 1, 2,
4, 8 and 10 mM) in the mitochondrial respiratory chain and
oxidative phosphorylation system. For that purpose, we
analysed the respiratory indexes (RCR and ADP/O), DWm,
repolarization level and repolarization lag phase. The sec-
ond part of this study consisted of the evaluation of the
effect of metformin in hydrogen peroxide (H2O2) produc-
tion, lipid peroxidation and Ca2+-induced PTP. The lipid
peroxidation was evaluated by analysing TBARS forma-
tion and oxygen consumption, while the induction of PTP
was characterized by analysing the DWm, Ca2+ fluxes and
protein thiol groups’ oxidation. The choice of rat liver
mitochondria as experimental model was based on the fact
that liver is the major site for the uptake and metabolism of
drugs, liver mitochondria being primary targets for their
hepatotoxicity [16].
Materials and methods
Materials
Metformin (1,1-dimethylbiguanide hydrochloride) was
obtained from Sigma (Portugal). All the other chemicals
were of the highest grade of purity commercially available.
In the present study, we used metformin dissolved in dis-
tilled H2O.
Animals
Male Wistar rats (10 weeks old) were housed in our animal
colony (Laboratory Research Center, Faculty of Medicine,
Coimbra, Portugal). They were maintained under
controlled light (12 h day/night cycle) and humidity with
free access (except in the fasting period) to water and
powdered rodent chow (URF1; Charles River). Adhering to
procedures approved by the Institutional Animal Care and
Use Committee, the animals were killed by cervical dis-
placement and decapitation.
Isolation of liver mitochondria
Mitochondria were isolated from liver by conventional
methods [17] with slight modifications. Briefly, the liver
mitochondria were isolated in a medium containing
250 mM sucrose, 10 mM Hepes, 0.5 mM EGTA and 0.1%
fat-free bovine serum albumin (BSA) (pH 7.4). EGTA and
BSA were omitted from the final washing medium. The
mitochondrial pellet was washed twice and suspended in
the washing medium. Mitochondrial protein was deter-
mined by the biuret method [18] calibrated with BSA.
Mitochondrial respiration measurements
Oxygen consumption of isolated liver mitochondria was
monitored polarographically with a Clark oxygen electrode
(YSI Model 5331, Yellow Springs Inst) connected to a
suitable recorder in a 1 ml thermostated, water-jacketed
closed chamber with magnetic stirring [19]. The reactions
were carried out at 30�C in 1 ml of the reaction medium
(130 mM sucrose, 50 mM KCl, 2.5 mM MgCl2, 2.5 mM
KH2PO4, 100 lM EGTA, 5 mM Hepes and pH 7.4). Mito-
chondria (1 mg/ml) were incubated with metformin 1 min
before the addition of 5 mM glutamate/2.5 mM malate.
Membrane potential (DWm) measurements
The mitochondrial transmembrane potential (DWm) was
monitored by evaluating transmembrane distribution of the
lipophilic cation TPP+ (tetraphenylphosphonium) with a
TPP+-selective electrode prepared according to Kamo et al.
[20] using an Ag/AgCl-saturated electrode (Tacussel, model
MI 402) as reference. TPP+ uptake has been measured from
the decreased TPP+ concentration in the medium sensed by
the electrode. The potential difference between the selective
electrode and the reference electrode was measured with an
electrometer and recorded continuously in a Linear 1200
recorder. The voltage response of the TPP+ electrode to
log[TPP+] was linear with a slope of 59 ± 1, in a good
agreement with the Nernst equation. Reactions were carried
out in a chamber with magnetic stirring in 1 ml of the
standard medium (130 mM sucrose, 50 mM KCl, 2.5 mM
MgCl2, 2.5 mM KH2PO4, 100 lM EGTA, 5 mM Hepes
76 Mol Cell Biochem (2008) 308:75–83
123
and pH 7.4 supplemented with 2 lM rotenone) containing
3 lM TPP+. This TPP+ concentration was chosen in order to
achieve high sensitivity in measurements and to avoid
possible toxic effects on mitochondria [21]. The DWm was
estimated by the equation:
DWm (mV) = 59 log(v/V) � 59 log(10DE=59 � 1)
as indicated by Kamo et al. [20] and Muratsugu et al. [22].
v, V, and DE stand for mitochondrial volume, volume of the
incubation medium and deflection of the electrode potential
from the baseline, respectively. This equation was derived
assuming that TPP+ distribution between the mitochondria
and the medium follows the Nernst equation, and that the
law of mass conservation is applicable. A matrix volume of
1.1 ll/mg protein was assumed. No correction was made
for the ‘‘passive’’ binding contribution of TPP+ to the
mitochondrial membranes, because the purpose of the
experiments was to show relative changes in potentials
rather than absolute values. As a consequence, we can
anticipate a slight overestimation on DWm values. However,
the overestimation is only significant at DWm values below
90 mV, therefore, far from our measurements. Mitochon-
dria (1 mg/ml) were incubated with metformin for 1 min
before the addition of 5 mM glutamate/2.5 mM malate.
After a steady-state distribution of TPP+ had been reached
(ca. 1 min of recording), DWm fluctuations recorded. In the
PTP experiments, two or three pulses of Ca2+ (1st pulse:
50 nmol Ca2+/mg protein; 2nd and 3rd pulses: 40 nmol
Ca2+/mg protein) were added, and DWm was recorded. CsA
was added 2 min before Ca2+ addition.
Measurement of hydrogen peroxide (H2O2) levels
The H2O2 levels were measured fluorimetrically using a
modification of the method described by Barja [23].
Briefly, liver mitochondria (0.375 mg) were incubated at
30�C with 5 mM glutamate/2.5 mM malate in 1.5 ml of
phosphate buffer, pH 7.4, containing 0.1 mM EGTA,
5 mM KH2PO4, 3 mM MgCl2, 145 mM KCl, 30 mM
Hepes, 0.1 mM homovalinic acid and 6 U/ml horseradish
peroxidase in the absence or presence of metformin. After
15 min, the reaction was stopped with 0.5 ml cold stop
solution (0.1 M glycine, 25 mM EDTA-NaOH, pH 12).
Fluorescence of supernatants was determined at 312 nm
excitation and 420 nm emission wavelengths. The H2O2
levels were calculated using a standard curve of H2O2.
Measurement of lipid peroxidation
The extent of lipid peroxidation was evaluated by oxygen
consumption monitored polarographically at 30�C using a
Clark-type oxygen electrode (YSI Model 5331, Yellow
Springs Inst) placed in a glass chamber equipped with mag-
netic stirring [24]. Reactions were carried out in 1 ml of
reaction medium containing 175 mM KCl, 10 mM Tris–HCl,
pH 7.4 and 1 mg of protein. Reactions were started by the
addition of 1 mM ADP/0.1 mM Fe2+, and the changes in
oxygen tension were calculated assuming a concentration of
240 nmol O2/ml. Mitochondria were incubated with metfor-
min 1 min before the addition ofADP/Fe2+. The extentof lipid
peroxidation was also determined by measuring thiobarbituric
acid reactive substances (TBARS), using the thiobarbituric
acid assay, according to a modified procedure as described
elsewhere [24]. The amount of TBARS formed was calculated
using a molar extinction coefficient of 1.56 · 105 M–1 cm–1
and expressed as nmol TBARS/mg protein.
Measurements of Ca2+ fluxes
Mitochondrial Ca2+ fluxes were measured by monitoring
the changes in Ca2+ concentration in the reaction medium
using a Ca2+-selective electrode [25]. The reactions were
conducted in an open vessel with magnetic stirring in 1 ml
of the standard reaction medium supplemented with 5 mM
glutamate/2.5 mM malate and 90 nmol/mg protein of
CaCl2. The reaction started with the addiction of mito-
chondria. Metformin was added 1 min after mitochondria
addition. CsA was added 2 min before Ca2+ addition.
Mitochondrial thiol oxidation
A variation of Ellman’s method was used to determine the
mitochondrial content in protein thiol groups [26]. At the
end of the DWm experiments, 750 ll of each mitochondrial
suspension were frozen and thawed three times. Then,
750 ll of sulphosalicilic acid 4% were added. The samples
were submitted to centrifugation at 10,000 rpm for 15 min.
The supernatant was removed and the pellet was suspended
in 1 ml of phosphate buffer 100 mM, pH 8. The suspension
was sonicated and diluted to 2.6 ml in phosphate buffer
medium containing 385 mM DTNB [5,50-dithiobis
(2-nitrobenzoic) acid]. After 15 min of reaction, the
absorption was measured at 412 nm, and the results were
expressed as percentage of control.
Statistical analysis
Results are presented as mean ± SEM of the indicated
number of experiments. Statistical significance was deter-
mined using the student t-test and one-way ANOVA test
for multiple comparisons, followed by the posthoc Tukey–
Kramer test.
Mol Cell Biochem (2008) 308:75–83 77
123
Results
High concentrations of metformin impair mitochondrial
respiration
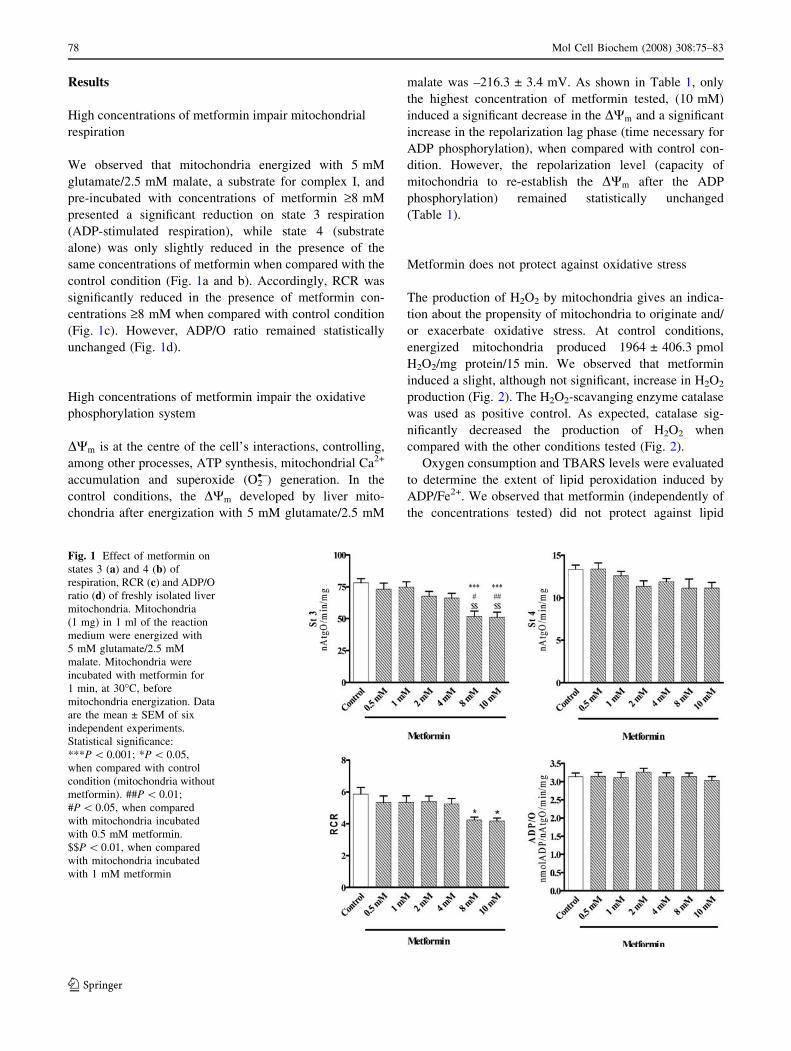
We observed that mitochondria energized with 5 mM
glutamate/2.5 mM malate, a substrate for complex I, and
pre-incubated with concentrations of metformin ‡8 mM
presented a significant reduction on state 3 respiration
(ADP-stimulated respiration), while state 4 (substrate
alone) was only slightly reduced in the presence of the
same concentrations of metformin when compared with the
control condition (Fig. 1a and b). Accordingly, RCR was
significantly reduced in the presence of metformin con-
centrations ‡8 mM when compared with control condition
(Fig. 1c). However, ADP/O ratio remained statistically
unchanged (Fig. 1d).
High concentrations of metformin impair the oxidative
phosphorylation system
DWm is at the centre of the cell’s interactions, controlling,
among other processes, ATP synthesis, mitochondrial Ca2+
accumulation and superoxide (O2•–) generation. In the
control conditions, the DWm developed by liver mito-
chondria after energization with 5 mM glutamate/2.5 mM
malate was –216.3 ± 3.4 mV. As shown in Table 1, only
the highest concentration of metformin tested, (10 mM)
induced a significant decrease in the DWm and a significant
increase in the repolarization lag phase (time necessary for
ADP phosphorylation), when compared with control con-
dition. However, the repolarization level (capacity of
mitochondria to re-establish the DWm after the ADP
phosphorylation) remained statistically unchanged
(Table 1).
Metformin does not protect against oxidative stress
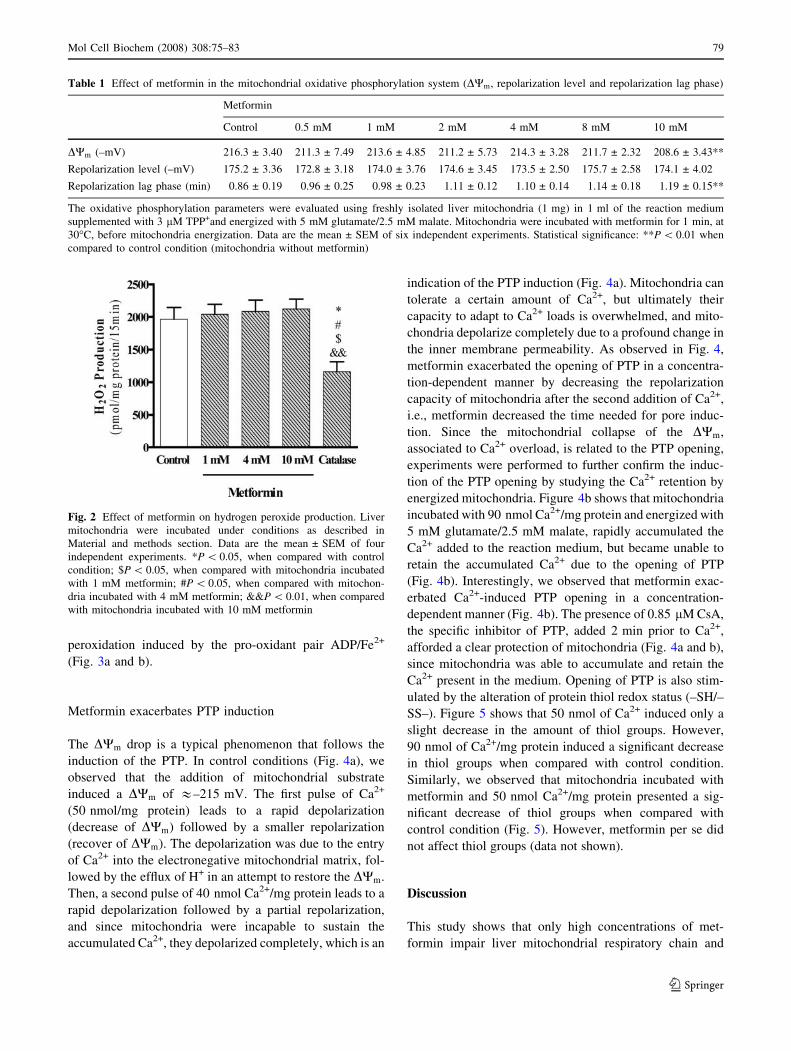
The production of H2O2 by mitochondria gives an indica-
tion about the propensity of mitochondria to originate and/
or exacerbate oxidative stress. At control conditions,
energized mitochondria produced 1964 ± 406.3 pmol
H2O2/mg protein/15 min. We observed that metformin
induced a slight, although not significant, increase in H2O2
production (Fig. 2). The H2O2-scavanging enzyme catalase
was used as positive control. As expected, catalase sig-
nificantly decreased the production of H2O2 when
compared with the other conditions tested (Fig. 2).
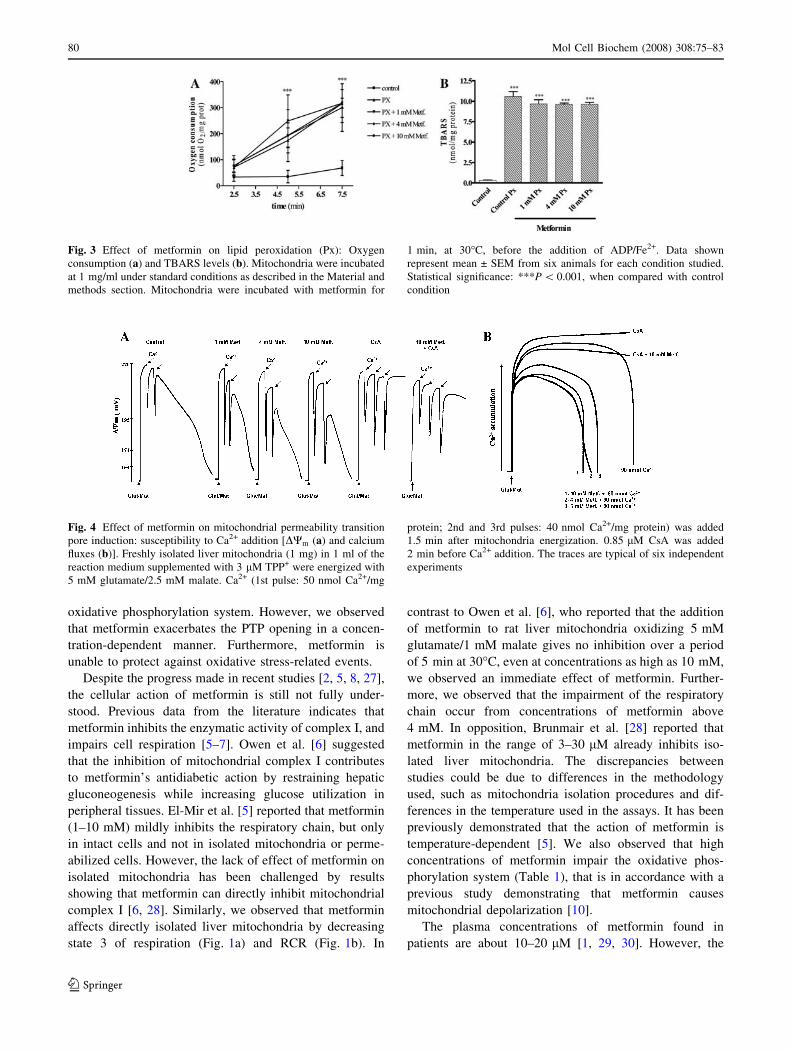
Oxygen consumption and TBARS levels were evaluated
to determine the extent of lipid peroxidation induced by
ADP/Fe2+. We observed that metformin (independently of
the concentrations tested) did not protect against lipid
Fig. 1 Effect of metformin on
states 3 (a) and 4 (b) of
respiration, RCR (c) and ADP/O
ratio (d) of freshly isolated liver
mitochondria. Mitochondria
(1 mg) in 1 ml of the reaction
medium were energized with
5 mM glutamate/2.5 mM
malate. Mitochondria were
incubated with metformin for
1 min, at 30�C, before
mitochondria energization. Data
are the mean ± SEM of six
independent experiments.
Statistical significance:
***P \ 0.001; *P \ 0.05,
when compared with control
condition (mitochondria without
metformin). ##P \ 0.01;
#P \ 0.05, when compared
with mitochondria incubated
with 0.5 mM metformin.
$$P \ 0.01, when compared
with mitochondria incubated
with 1 mM metformin
78 Mol Cell Biochem (2008) 308:75–83
123
peroxidation induced by the pro-oxidant pair ADP/Fe2+
(Fig. 3a and b).
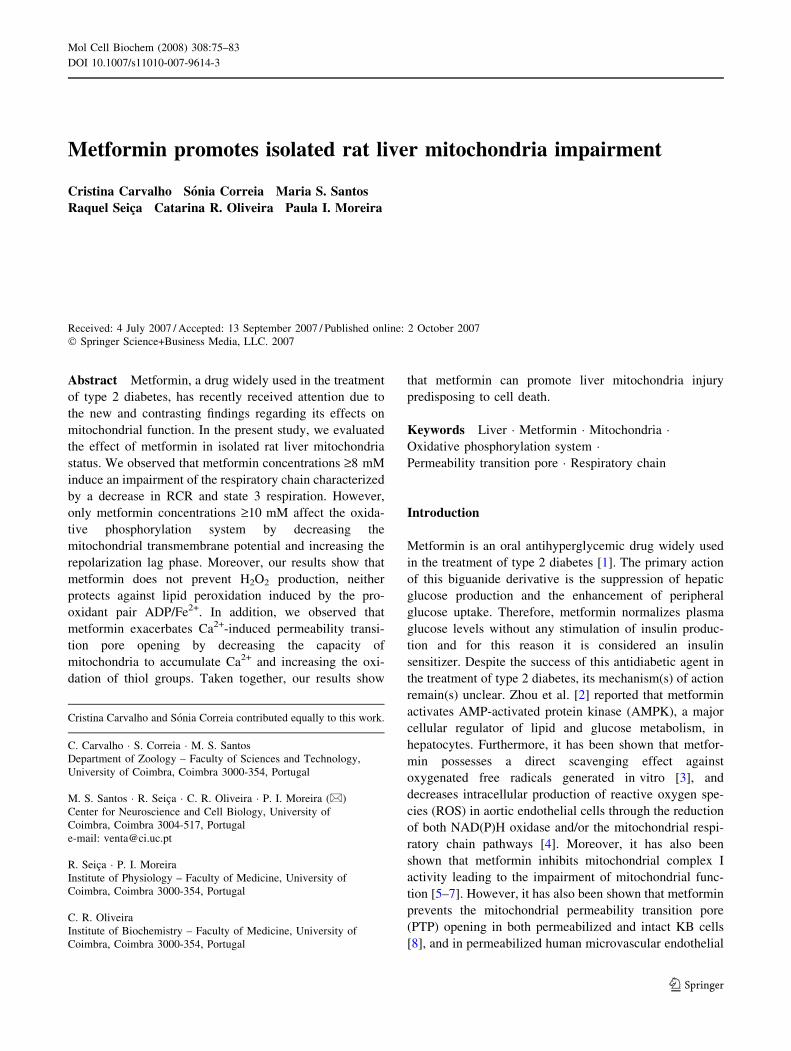
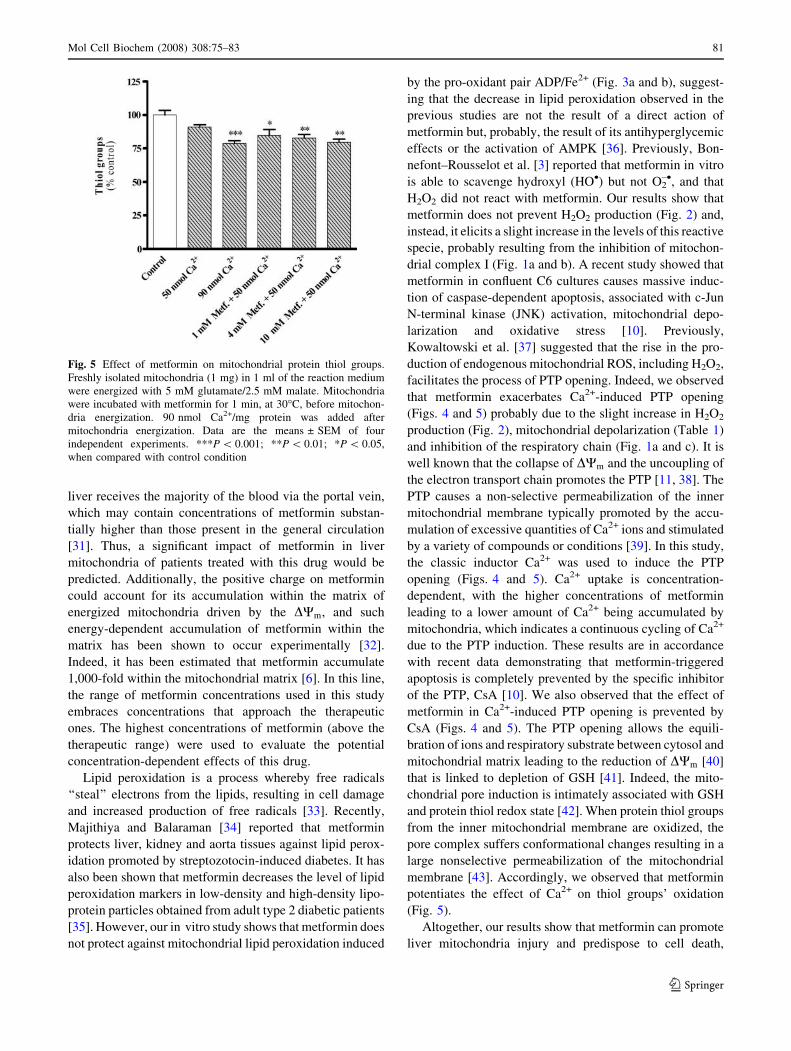
Metformin exacerbates PTP induction
The DWm drop is a typical phenomenon that follows the
induction of the PTP. In control conditions (Fig. 4a), we
observed that the addition of mitochondrial substrate
induced a DWm of &–215 mV. The first pulse of Ca2+
(50 nmol/mg protein) leads to a rapid depolarization
(decrease of DWm) followed by a smaller repolarization
(recover of DWm). The depolarization was due to the entry
of Ca2+ into the electronegative mitochondrial matrix, fol-
lowed by the efflux of H+ in an attempt to restore the DWm.
Then, a second pulse of 40 nmol Ca2+/mg protein leads to a
rapid depolarization followed by a partial repolarization,
and since mitochondria were incapable to sustain the
accumulated Ca2+, they depolarized completely, which is an
indication of the PTP induction (Fig. 4a). Mitochondria can
tolerate a certain amount of Ca2+, but ultimately their
capacity to adapt to Ca2+ loads is overwhelmed, and mito-
chondria depolarize completely due to a profound change in
the inner membrane permeability. As observed in Fig. 4,
metformin exacerbated the opening of PTP in a concentra-
tion-dependent manner by decreasing the repolarization
capacity of mitochondria after the second addition of Ca2+,
i.e., metformin decreased the time needed for pore induc-
tion. Since the mitochondrial collapse of the DWm,
associated to Ca2+ overload, is related to the PTP opening,
experiments were performed to further confirm the induc-
tion of the PTP opening by studying the Ca2+ retention by
energized mitochondria. Figure 4b shows that mitochondria
incubated with 90 nmol Ca2+/mg protein and energized with
5 mM glutamate/2.5 mM malate, rapidly accumulated the
Ca2+ added to the reaction medium, but became unable to
retain the accumulated Ca2+ due to the opening of PTP
(Fig. 4b). Interestingly, we observed that metformin exac-
erbated Ca2+-induced PTP opening in a concentration-
dependent manner (Fig. 4b). The presence of 0.85 lM CsA,
the specific inhibitor of PTP, added 2 min prior to Ca2+,
afforded a clear protection of mitochondria (Fig. 4a and b),
since mitochondria was able to accumulate and retain the
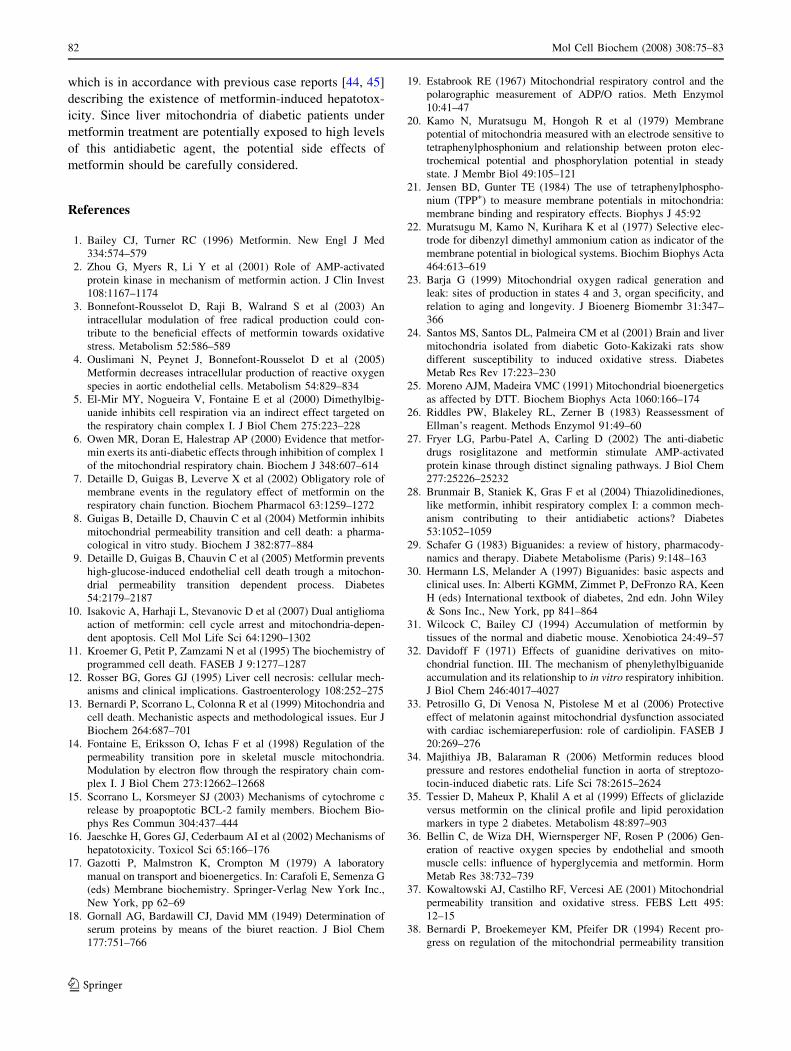
Ca2+ present in the medium. Opening of PTP is also stim-
ulated by the alteration of protein thiol redox status (–SH/–
SS–). Figure 5 shows that 50 nmol of Ca2+ induced only a
slight decrease in the amount of thiol groups. However,
90 nmol of Ca2+/mg protein induced a significant decrease
in thiol groups when compared with control condition.
Similarly, we observed that mitochondria incubated with
metformin and 50 nmol Ca2+/mg protein presented a sig-
nificant decrease of thiol groups when compared with
control condition (Fig. 5). However, metformin per se did
not affect thiol groups (data not shown).
Discussion
This study shows that only high concentrations of met-
formin impair liver mitochondrial respiratory chain and
Table 1 Effect of metformin in the mitochondrial oxidative phosphorylation system (DWm, repolarization level and repolarization lag phase)
Metformin
Control 0.5 mM 1 mM 2 mM 4 mM 8 mM 10 mM
DWm (–mV) 216.3 ± 3.40 211.3 ± 7.49 213.6 ± 4.85 211.2 ± 5.73 214.3 ± 3.28 211.7 ± 2.32 208.6 ± 3.43**
Repolarization level (–mV) 175.2 ± 3.36 172.8 ± 3.18 174.0 ± 3.76 174.6 ± 3.45 173.5 ± 2.50 175.7 ± 2.58 174.1 ± 4.02
Repolarization lag phase (min) 0.86 ± 0.19 0.96 ± 0.25 0.98 ± 0.23 1.11 ± 0.12 1.10 ± 0.14 1.14 ± 0.18 1.19 ± 0.15**
The oxidative phosphorylation parameters were evaluated using freshly isolated liver mitochondria (1 mg) in 1 ml of the reaction medium
supplemented with 3 lM TPP+and energized with 5 mM glutamate/2.5 mM malate. Mitochondria were incubated with metformin for 1 min, at
30�C, before mitochondria energization. Data are the mean ± SEM of six independent experiments. Statistical significance: **P \ 0.01 when
compared to control condition (mitochondria without metformin)
Fig. 2 Effect of metformin on hydrogen peroxide production. Liver
mitochondria were incubated under conditions as described in
Material and methods section. Data are the mean ± SEM of four
independent experiments. *P \ 0.05, when compared with control
condition; $P \ 0.05, when compared with mitochondria incubated
with 1 mM metformin; #P \ 0.05, when compared with mitochon-
dria incubated with 4 mM metformin; &&P \ 0.01, when compared
with mitochondria incubated with 10 mM metformin
Mol Cell Biochem (2008) 308:75–83 79
123
oxidative phosphorylation system. However, we observed
that metformin exacerbates the PTP opening in a concen-
tration-dependent manner. Furthermore, metformin is
unable to protect against oxidative stress-related events.
Despite the progress made in recent studies [2, 5, 8, 27],
the cellular action of metformin is still not fully under-
stood. Previous data from the literature indicates that
metformin inhibits the enzymatic activity of complex I, and
impairs cell respiration [5–7]. Owen et al. [6] suggested
that the inhibition of mitochondrial complex I contributes
to metformin’s antidiabetic action by restraining hepatic
gluconeogenesis while increasing glucose utilization in
peripheral tissues. El-Mir et al. [5] reported that metformin
(1–10 mM) mildly inhibits the respiratory chain, but only
in intact cells and not in isolated mitochondria or perme-
abilized cells. However, the lack of effect of metformin on
isolated mitochondria has been challenged by results
showing that metformin can directly inhibit mitochondrial
complex I [6, 28]. Similarly, we observed that metformin
affects directly isolated liver mitochondria by decreasing
state 3 of respiration (Fig. 1a) and RCR (Fig. 1b). In
contrast to Owen et al. [6], who reported that the addition
of metformin to rat liver mitochondria oxidizing 5 mM
glutamate/1 mM malate gives no inhibition over a period
of 5 min at 30�C, even at concentrations as high as 10 mM,
we observed an immediate effect of metformin. Further-
more, we observed that the impairment of the respiratory
chain occur from concentrations of metformin above
4 mM. In opposition, Brunmair et al. [28] reported that
metformin in the range of 3–30 lM already inhibits iso-
lated liver mitochondria. The discrepancies between
studies could be due to differences in the methodology
used, such as mitochondria isolation procedures and dif-
ferences in the temperature used in the assays. It has been
previously demonstrated that the action of metformin is
temperature-dependent [5]. We also observed that high
concentrations of metformin impair the oxidative phos-
phorylation system (Table 1), that is in accordance with a
previous study demonstrating that metformin causes
mitochondrial depolarization [10].
The plasma concentrations of metformin found in
patients are about 10–20 lM [1, 29, 30]. However, the
Fig. 3 Effect of metformin on lipid peroxidation (Px): Oxygen
consumption (a) and TBARS levels (b). Mitochondria were incubated
at 1 mg/ml under standard conditions as described in the Material and
methods section. Mitochondria were incubated with metformin for
1 min, at 30�C, before the addition of ADP/Fe2+. Data shown
represent mean ± SEM from six animals for each condition studied.
Statistical significance: ***P \ 0.001, when compared with control
condition
Fig. 4 Effect of metformin on mitochondrial permeability transition
pore induction: susceptibility to Ca2+ addition [DWm (a) and calcium
fluxes (b)]. Freshly isolated liver mitochondria (1 mg) in 1 ml of the
reaction medium supplemented with 3 lM TPP+ were energized with
5 mM glutamate/2.5 mM malate. Ca2+ (1st pulse: 50 nmol Ca2+/mg
protein; 2nd and 3rd pulses: 40 nmol Ca2+/mg protein) was added
1.5 min after mitochondria energization. 0.85 lM CsA was added
2 min before Ca2+ addition. The traces are typical of six independent
experiments
80 Mol Cell Biochem (2008) 308:75–83
123
liver receives the majority of the blood via the portal vein,
which may contain concentrations of metformin substan-
tially higher than those present in the general circulation
[31]. Thus, a significant impact of metformin in liver
mitochondria of patients treated with this drug would be
predicted. Additionally, the positive charge on metformin
could account for its accumulation within the matrix of
energized mitochondria driven by the DWm, and such
energy-dependent accumulation of metformin within the
matrix has been shown to occur experimentally [32].
Indeed, it has been estimated that metformin accumulate
1,000-fold within the mitochondrial matrix [6]. In this line,
the range of metformin concentrations used in this study
embraces concentrations that approach the therapeutic
ones. The highest concentrations of metformin (above the
therapeutic range) were used to evaluate the potential
concentration-dependent effects of this drug.
Lipid peroxidation is a process whereby free radicals
‘‘steal’’ electrons from the lipids, resulting in cell damage
and increased production of free radicals [33]. Recently,
Majithiya and Balaraman [34] reported that metformin
protects liver, kidney and aorta tissues against lipid perox-
idation promoted by streptozotocin-induced diabetes. It has
also been shown that metformin decreases the level of lipid
peroxidation markers in low-density and high-density lipo-
protein particles obtained from adult type 2 diabetic patients
[35]. However, our in vitro study shows that metformin does
not protect against mitochondrial lipid peroxidation induced
by the pro-oxidant pair ADP/Fe2+ (Fig. 3a and b), suggest-
ing that the decrease in lipid peroxidation observed in the
previous studies are not the result of a direct action of
metformin but, probably, the result of its antihyperglycemic
effects or the activation of AMPK [36]. Previously, Bon-
nefont–Rousselot et al. [3] reported that metformin in vitro
is able to scavenge hydroxyl (HO•) but not O2–•, and that
H2O2 did not react with metformin. Our results show that
metformin does not prevent H2O2 production (Fig. 2) and,
instead, it elicits a slight increase in the levels of this reactive
specie, probably resulting from the inhibition of mitochon-
drial complex I (Fig. 1a and b). A recent study showed that
metformin in confluent C6 cultures causes massive induc-
tion of caspase-dependent apoptosis, associated with c-Jun
N-terminal kinase (JNK) activation, mitochondrial depo-
larization and oxidative stress [10]. Previously,
Kowaltowski et al. [37] suggested that the rise in the pro-
duction of endogenous mitochondrial ROS, including H2O2,
facilitates the process of PTP opening. Indeed, we observed
that metformin exacerbates Ca2+-induced PTP opening
(Figs. 4 and 5) probably due to the slight increase in H2O2
production (Fig. 2), mitochondrial depolarization (Table 1)
and inhibition of the respiratory chain (Fig. 1a and c). It is
well known that the collapse of DWm and the uncoupling of
the electron transport chain promotes the PTP [11, 38]. The
PTP causes a non-selective permeabilization of the inner
mitochondrial membrane typically promoted by the accu-
mulation of excessive quantities of Ca2+ ions and stimulated
by a variety of compounds or conditions [39]. In this study,
the classic inductor Ca2+ was used to induce the PTP
opening (Figs. 4 and 5). Ca2+ uptake is concentration-
dependent, with the higher concentrations of metformin
leading to a lower amount of Ca2+ being accumulated by
mitochondria, which indicates a continuous cycling of Ca2+
due to the PTP induction. These results are in accordance
with recent data demonstrating that metformin-triggered
apoptosis is completely prevented by the specific inhibitor
of the PTP, CsA [10]. We also observed that the effect of
metformin in Ca2+-induced PTP opening is prevented by
CsA (Figs. 4 and 5). The PTP opening allows the equili-
bration of ions and respiratory substrate between cytosol and
mitochondrial matrix leading to the reduction of DWm [40]
that is linked to depletion of GSH [41]. Indeed, the mito-
chondrial pore induction is intimately associated with GSH
and protein thiol redox state [42]. When protein thiol groups
from the inner mitochondrial membrane are oxidized, the
pore complex suffers conformational changes resulting in a
large nonselective permeabilization of the mitochondrial
membrane [43]. Accordingly, we observed that metformin
potentiates the effect of Ca2+ on thiol groups’ oxidation
(Fig. 5).
Altogether, our results show that metformin can promote
liver mitochondria injury and predispose to cell death,
Fig. 5 Effect of metformin on mitochondrial protein thiol groups.
Freshly isolated mitochondria (1 mg) in 1 ml of the reaction medium
were energized with 5 mM glutamate/2.5 mM malate. Mitochondria
were incubated with metformin for 1 min, at 30�C, before mitochon-
dria energization. 90 nmol Ca2+/mg protein was added after
mitochondria energization. Data are the means ± SEM of four
independent experiments. ***P \ 0.001; **P \ 0.01; *P \ 0.05,
when compared with control condition
Mol Cell Biochem (2008) 308:75–83 81
123
which is in accordance with previous case reports [44, 45]
describing the existence of metformin-induced hepatotox-
icity. Since liver mitochondria of diabetic patients under
metformin treatment are potentially exposed to high levels
of this antidiabetic agent, the potential side effects of
metformin should be carefully considered.
References
1. Bailey CJ, Turner RC (1996) Metformin. New Engl J Med
334:574–579
2. Zhou G, Myers R, Li Y et al (2001) Role of AMP-activated
protein kinase in mechanism of metformin action. J Clin Invest
108:1167–1174
3. Bonnefont-Rousselot D, Raji B, Walrand S et al (2003) An
intracellular modulation of free radical production could con-
tribute to the beneficial effects of metformin towards oxidative
stress. Metabolism 52:586–589
4. Ouslimani N, Peynet J, Bonnefont-Rousselot D et al (2005)
Metformin decreases intracellular production of reactive oxygen
species in aortic endothelial cells. Metabolism 54:829–834
5. El-Mir MY, Nogueira V, Fontaine E et al (2000) Dimethylbig-
uanide inhibits cell respiration via an indirect effect targeted on
the respiratory chain complex I. J Biol Chem 275:223–228
6. Owen MR, Doran E, Halestrap AP (2000) Evidence that metfor-
min exerts its anti-diabetic effects through inhibition of complex 1
of the mitochondrial respiratory chain. Biochem J 348:607–614
7. Detaille D, Guigas B, Leverve X et al (2002) Obligatory role of
membrane events in the regulatory effect of metformin on the
respiratory chain function. Biochem Pharmacol 63:1259–1272
8. Guigas B, Detaille D, Chauvin C et al (2004) Metformin inhibits
mitochondrial permeability transition and cell death: a pharma-
cological in vitro study. Biochem J 382:877–884
9. Detaille D, Guigas B, Chauvin C et al (2005) Metformin prevents
high-glucose-induced endothelial cell death trough a mitochon-
drial permeability transition dependent process. Diabetes
54:2179–2187
10. Isakovic A, Harhaji L, Stevanovic D et al (2007) Dual antiglioma
action of metformin: cell cycle arrest and mitochondria-depen-
dent apoptosis. Cell Mol Life Sci 64:1290–1302
11. Kroemer G, Petit P, Zamzami N et al (1995) The biochemistry of
programmed cell death. FASEB J 9:1277–1287
12. Rosser BG, Gores GJ (1995) Liver cell necrosis: cellular mech-
anisms and clinical implications. Gastroenterology 108:252–275
13. Bernardi P, Scorrano L, Colonna R et al (1999) Mitochondria and
cell death. Mechanistic aspects and methodological issues. Eur J
Biochem 264:687–701
14. Fontaine E, Eriksson O, Ichas F et al (1998) Regulation of the
permeability transition pore in skeletal muscle mitochondria.
Modulation by electron flow through the respiratory chain com-
plex I. J Biol Chem 273:12662–12668
15. Scorrano L, Korsmeyer SJ (2003) Mechanisms of cytochrome c
release by proapoptotic BCL-2 family members. Biochem Bio-
phys Res Commun 304:437–444
16. Jaeschke H, Gores GJ, Cederbaum AI et al (2002) Mechanisms of
hepatotoxicity. Toxicol Sci 65:166–176
17. Gazotti P, Malmstron K, Crompton M (1979) A laboratory
manual on transport and bioenergetics. In: Carafoli E, Semenza G
(eds) Membrane biochemistry. Springer-Verlag New York Inc.,
New York, pp 62–69
18. Gornall AG, Bardawill CJ, David MM (1949) Determination of
serum proteins by means of the biuret reaction. J Biol Chem
177:751–766
19. Estabrook RE (1967) Mitochondrial respiratory control and the
polarographic measurement of ADP/O ratios. Meth Enzymol
10:41–47
20. Kamo N, Muratsugu M, Hongoh R et al (1979) Membrane
potential of mitochondria measured with an electrode sensitive to
tetraphenylphosphonium and relationship between proton elec-
trochemical potential and phosphorylation potential in steady
state. J Membr Biol 49:105–121
21. Jensen BD, Gunter TE (1984) The use of tetraphenylphospho-
nium (TPP+) to measure membrane potentials in mitochondria:
membrane binding and respiratory effects. Biophys J 45:92
22. Muratsugu M, Kamo N, Kurihara K et al (1977) Selective elec-
trode for dibenzyl dimethyl ammonium cation as indicator of the
membrane potential in biological systems. Biochim Biophys Acta
464:613–619
23. Barja G (1999) Mitochondrial oxygen radical generation and
leak: sites of production in states 4 and 3, organ specificity, and
relation to aging and longevity. J Bioenerg Biomembr 31:347–
366
24. Santos MS, Santos DL, Palmeira CM et al (2001) Brain and liver
mitochondria isolated from diabetic Goto-Kakizaki rats show
different susceptibility to induced oxidative stress. Diabetes
Metab Res Rev 17:223–230
25. Moreno AJM, Madeira VMC (1991) Mitochondrial bioenergetics
as affected by DTT. Biochem Biophys Acta 1060:166–174
26. Riddles PW, Blakeley RL, Zerner B (1983) Reassessment of
Ellman’s reagent. Methods Enzymol 91:49–60
27. Fryer LG, Parbu-Patel A, Carling D (2002) The anti-diabetic
drugs rosiglitazone and metformin stimulate AMP-activated
protein kinase through distinct signaling pathways. J Biol Chem
277:25226–25232
28. Brunmair B, Staniek K, Gras F et al (2004) Thiazolidinediones,
like metformin, inhibit respiratory complex I: a common mech-
anism contributing to their antidiabetic actions? Diabetes
53:1052–1059
29. Schafer G (1983) Biguanides: a review of history, pharmacody-
namics and therapy. Diabete Metabolisme (Paris) 9:148–163
30. Hermann LS, Melander A (1997) Biguanides: basic aspects and
clinical uses. In: Alberti KGMM, Zimmet P, DeFronzo RA, Keen
H (eds) International textbook of diabetes, 2nd edn. John Wiley
& Sons Inc., New York, pp 841–864
31. Wilcock C, Bailey CJ (1994) Accumulation of metformin by
tissues of the normal and diabetic mouse. Xenobiotica 24:49–57
32. Davidoff F (1971) Effects of guanidine derivatives on mito-
chondrial function. III. The mechanism of phenylethylbiguanide
accumulation and its relationship to in vitro respiratory inhibition.
J Biol Chem 246:4017–4027
33. Petrosillo G, Di Venosa N, Pistolese M et al (2006) Protective
effect of melatonin against mitochondrial dysfunction associated
with cardiac ischemiareperfusion: role of cardiolipin. FASEB J
20:269–276
34. Majithiya JB, Balaraman R (2006) Metformin reduces blood
pressure and restores endothelial function in aorta of streptozo-
tocin-induced diabetic rats. Life Sci 78:2615–2624
35. Tessier D, Maheux P, Khalil A et al (1999) Effects of gliclazide
versus metformin on the clinical profile and lipid peroxidation
markers in type 2 diabetes. Metabolism 48:897–903
36. Bellin C, de Wiza DH, Wiernsperger NF, Rosen P (2006) Gen-
eration of reactive oxygen species by endothelial and smooth
muscle cells: influence of hyperglycemia and metformin. Horm
Metab Res 38:732–739
37. Kowaltowski AJ, Castilho RF, Vercesi AE (2001) Mitochondrial
permeability transition and oxidative stress. FEBS Lett 495:
12–15
38. Bernardi P, Broekemeyer KM, Pfeifer DR (1994) Recent pro-
gress on regulation of the mitochondrial permeability transition
82 Mol Cell Biochem (2008) 308:75–83
123
pore; a cyclosporin-sensitive pore in the inner mitochondrial
membrane. J Bioenerg Biomembr 26:509–517
39. Zoratti M, Szabo I (1995) The mitochondrial permeability tran-
sition. Biochim Biophys Acta 1241:139–176
40. Bernardi P, Vassanelli S, Veronese P et al (1992) Modulation of
the mitochondrial permeability transition pore. Effect of protons
and divalent cations. J Biol Chem 267:2934–2939
41. Macho A, Hirsch T, Marzo I et al (1997) Glutathione depletion is
an early and calcium elevation is a late event of thymocyte
apoptosis. J Immunol 158:4612–4619
42. Le Quoc D, Le Quoc K, Gaudemer Y (1976) Energy-dependent
variation of thiol groups reactivity or accessibility in rat liver
mitochondria, revealed by measurements of labelled thiol
reagents incorporation. Biochem Biophys Res Commun
68:106–113
43. Kowaltowski AJ, Netto LE, Vercesi AE (1998) The thiol-specific
antioxidant enzyme prevents mitochondrial permeability transi-
tion. Evidence for the participation of reactive oxygen species in
this mechanism. J Biol Chem 273:12766–12769
44. Nammour FE, Fayad NF, Peikin SR (2003) Metformin-induced
cholestatic hepatitis. Endocr Pract 9:307–309
45. Kutoh E (2005) Possible metformin-induced hepatotoxicity. Am J
Geriatr Pharmacother 3:270–273
Mol Cell Biochem (2008) 308:75–83 83
123