Embed Size (px)
Citation preview
Meth-related Emergency Department Attendances
Report for July to December 2017
Prepared by: Emergency Department Data Collections Data and Information Branch Information and System Performance Directorate
NH CH3
CH3
© Emergency Department Data Collection 2018. E: [email protected] The contents of this report are protected by copyright law. Copyright in this material resides with the Commonwealth of Australia or various other rights holders, as indicated.
Contents
Purpose of this report
Gender
Age
Ethnicity
Hospital Distribution
Demographic Notes
1
3 4
5
6
14
Diagnosis & Symptoms
Median Times
Frequent Attendances
Time of Day
Arrival to an ED
Departure from an ED
Urgency Category
7
8 9
10
11 12 13
Basic Characteristics Notes 15 Further Characteristics Notes 16
Summary Infographic 2
Glossary 17
Purpose of this report
Alcohol and other drug services are available to help you and your loved ones.
For free help, call the Meth Helpline on 1800 874 878
1
The use of Crystal Methamphetamine, better known as Meth or Ice, is a significant community health concern. The negative effects experienced between Meth users and first-hand encounters from health professionals in the Emergency Department have been well-documented in the media. Of those who use amphetamines in Western Australia, more are choosing to use methamphetamine, a more potent form, and they are using it more frequently than in the past. Analysis of seizures by enforcement authorities shows that methamphetamine potency has increased in recent years. Amphetamine use can cause anxiety, depression, paranoia and psychosis in those people who have a vulnerability to mental health problems. However, alcohol use is of significant concern to the community and there are a range of problems that may occur as a result of drinking too much, resulting in a substantial number of hospitalisations and emergency department presentations. Therefore, it is important to note that substantial harm is also experienced from alcohol and other drugs – not just methamphetamine. Both the Department of Health and the Mental Health Commission have identified a need for information about patients attending an ED who are affected or likely affected by Meth. From 1 July 2017, Meth-related ED attendances data are being captured across the three main Tertiary sites and four selected metropolitan and rural hospitals, accounting for 50% of state-wide ED attendances. These sites all use the Emergency Department Information System (EDIS). There are on-going efforts to collect data from the remaining public hospitals. This report provides information and aggregated data on the key findings, demographics and characteristics of Meth-related Emergency Department Attendances from July to December 2017.
Key Findings
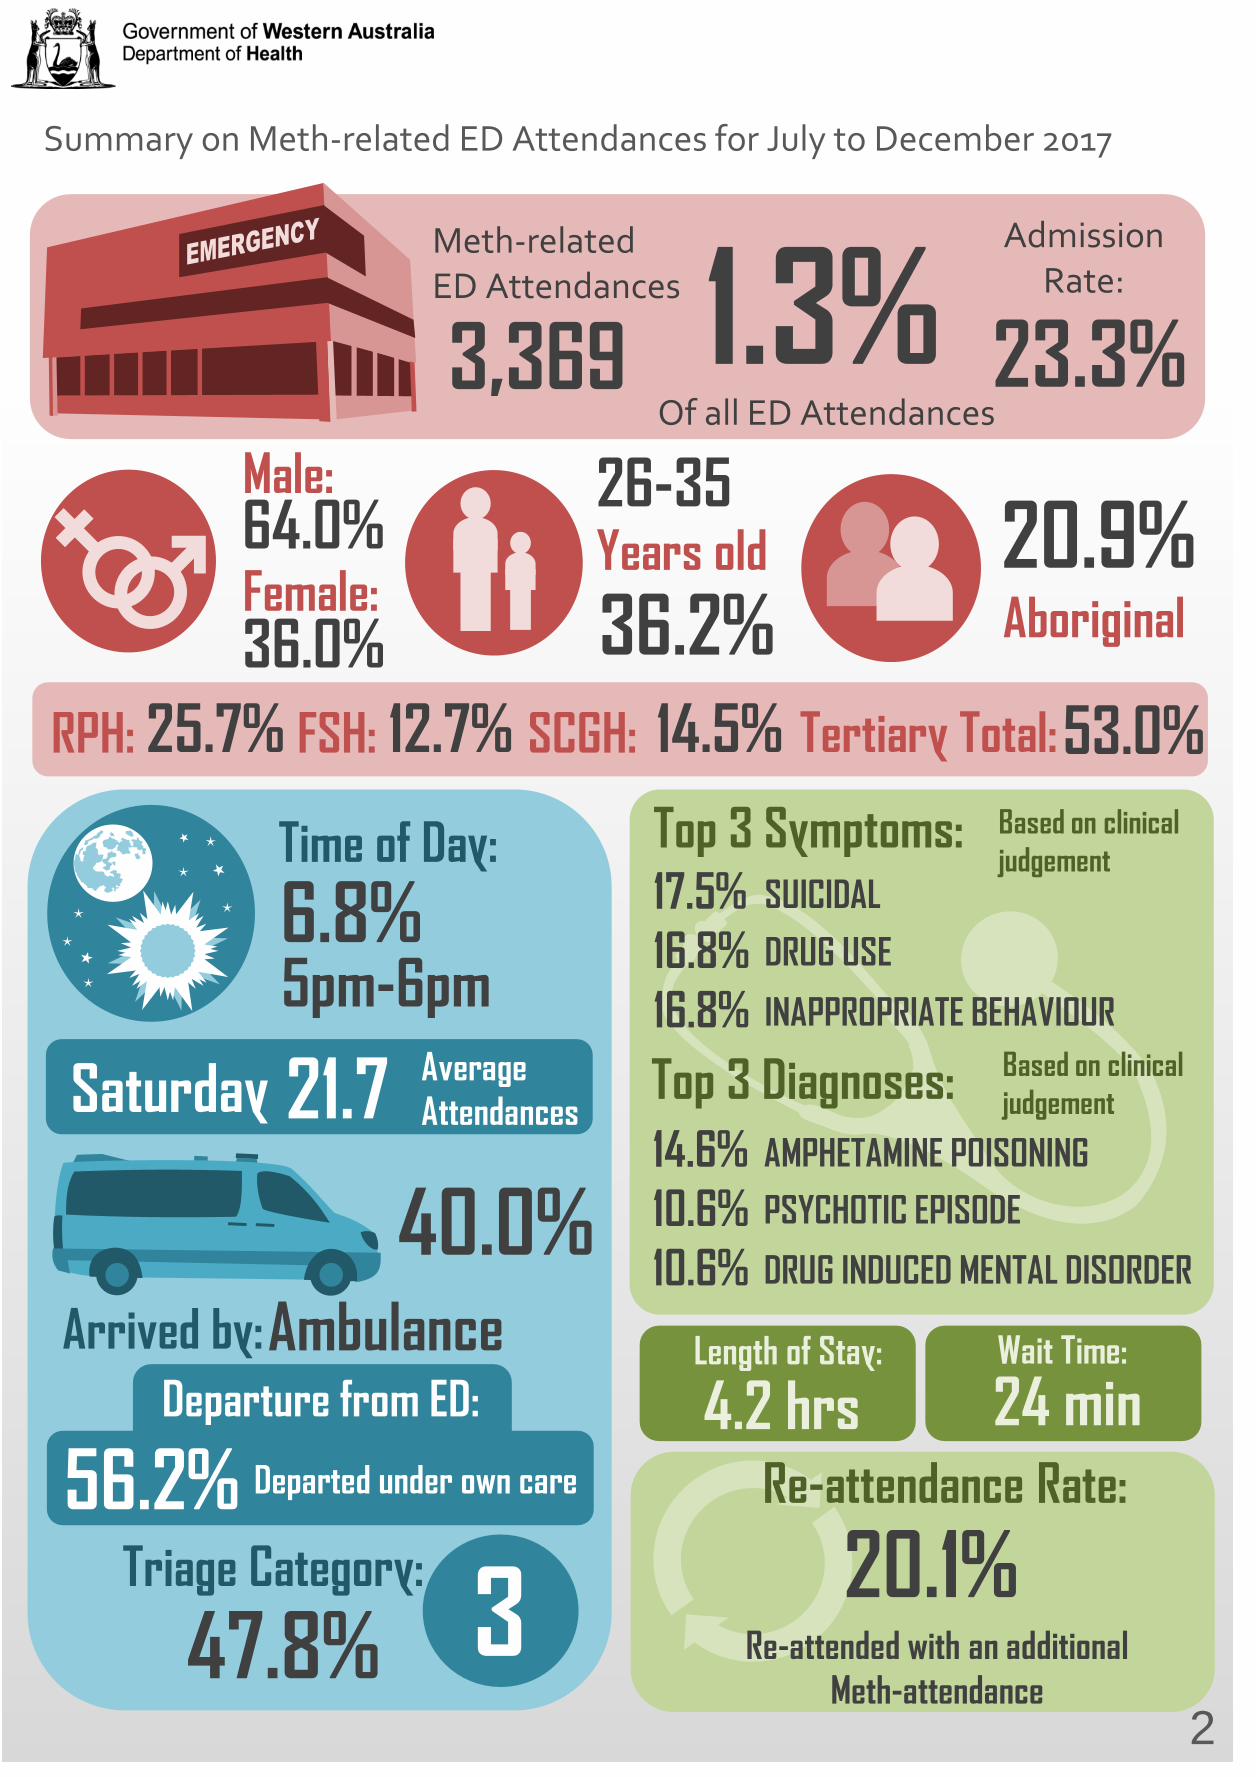
Summary on Meth-related ED Attendances for July to December 2017
3,369
Meth-related ED Attendances 1.3%
Of all ED Attendances
64.0%
36.0%
26-35
36.2% Years old
Male:
Female: 20.9% Aboriginal
RPH: FSH: SCGH: 25.7% 14.5% 12.7% Tertiary Total: 53.0%
5pm-6pm 6.8% Time of Day:
Saturday 21.7 Average Attendances
Ambulance
40.0% Arrived by:
Departed under own care 56.2% Triage Category: 3 47.8%
Departure from ED:
Top 3 Symptoms: SUICIDAL
DRUG USE
INAPPROPRIATE BEHAVIOUR
17.5% 16.8% 16.8% Top 3 Diagnoses:
AMPHETAMINE POISONING
PSYCHOTIC EPISODE
DRUG INDUCED MENTAL DISORDER
14.6% 10.6% 10.6%
Length of Stay: Wait Time:
4.2 hrs 24 min Re-attendance Rate:
20.1% Re-attended with an additional
Meth-attendance 2
Admission Rate:
23.3%
Based on clinical judgement
Based on clinical judgement
Demographic and Geographic Distribution of Meth-related ED Attendances
Gender Distribution
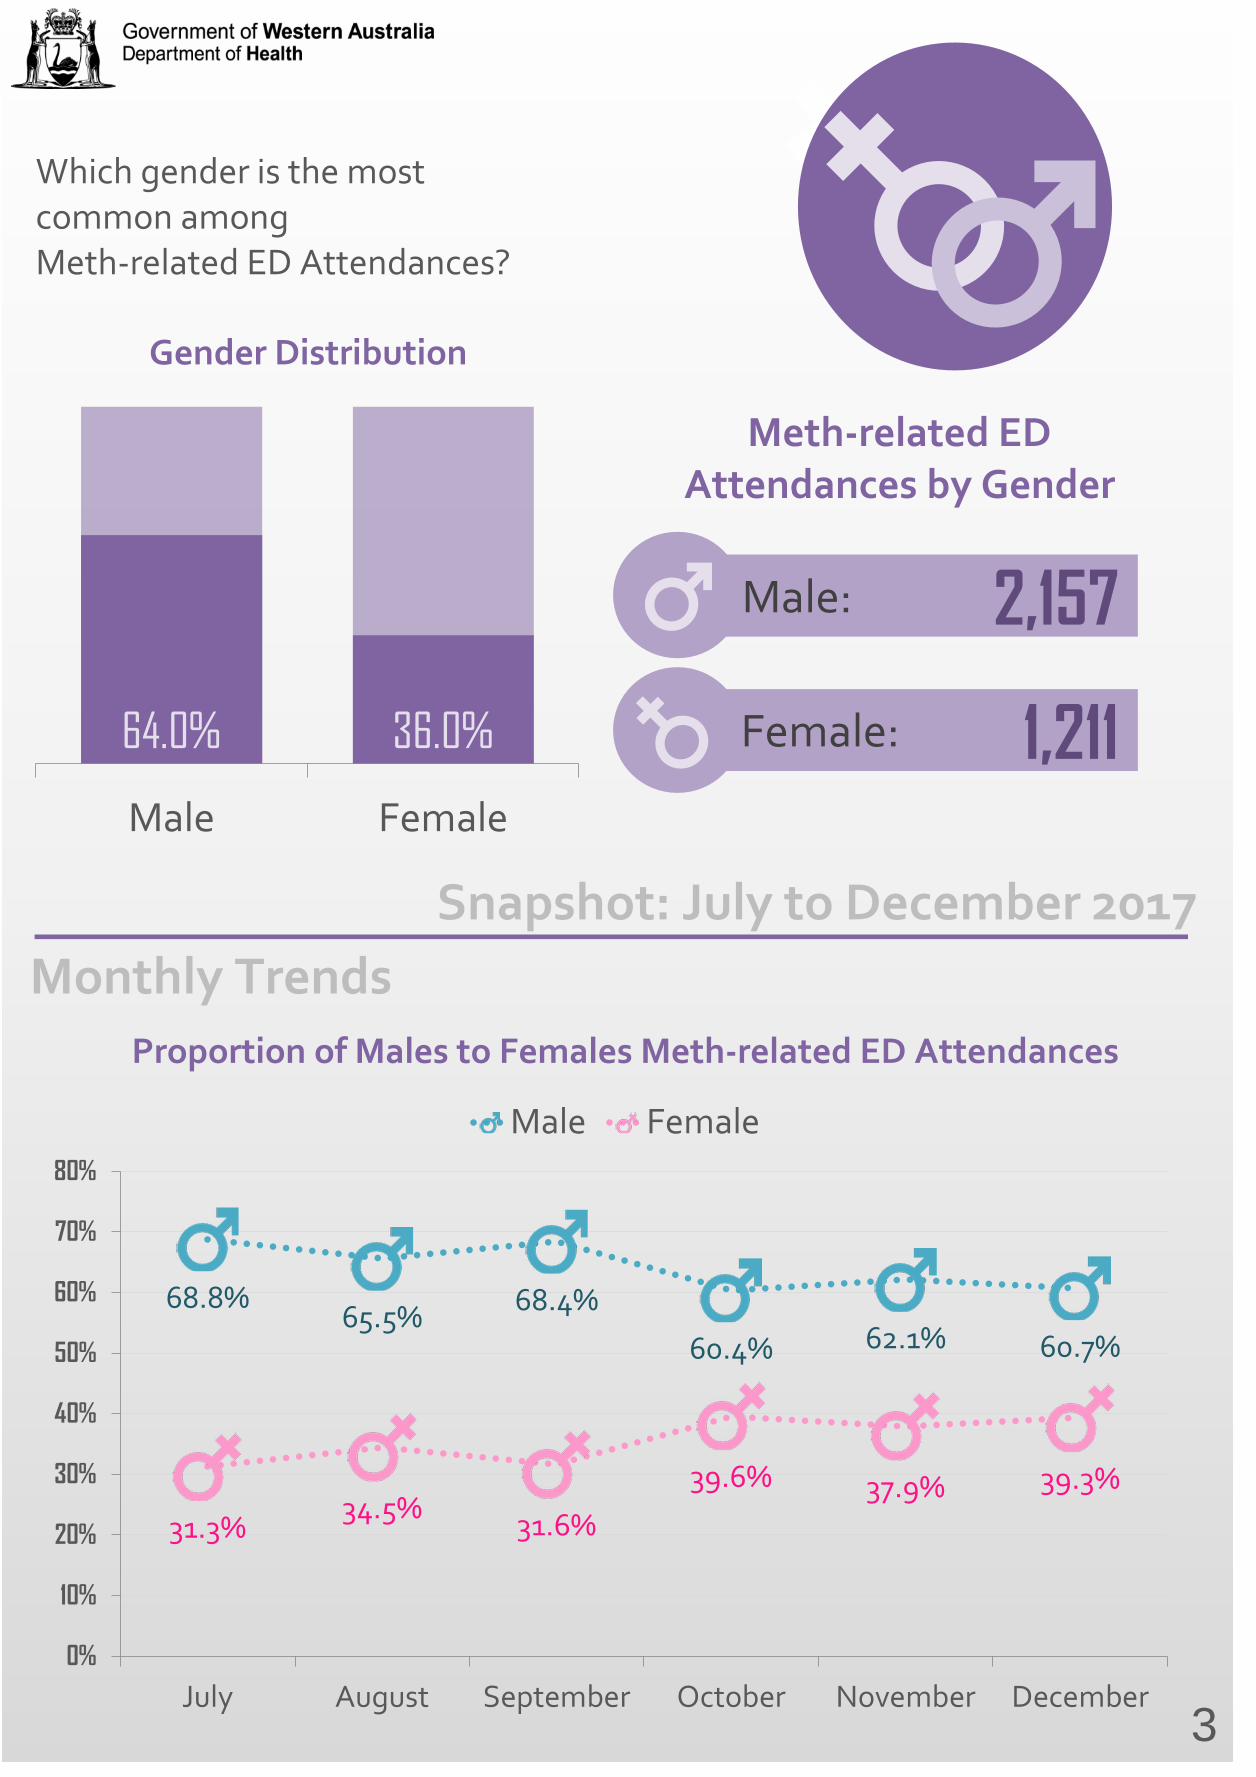
Which gender is the most common among Meth-related ED Attendances?
64.0% 36.0%
Male Female
Meth-related ED Attendances by Gender
2,157
Female: 1,211
68.8% 65.5% 68.4%
60.4% 62.1% 60.7%
31.3% 34.5% 31.6%
39.6% 37.9% 39.3%
0%
10%
20%
30%
40%
50%
60%
70%
80%
July August September October November December
Male Female
Proportion of Males to Females Meth-related ED Attendances
Male:
3
Snapshot: July to December 2017 Monthly Trends
Age-group Breakdown
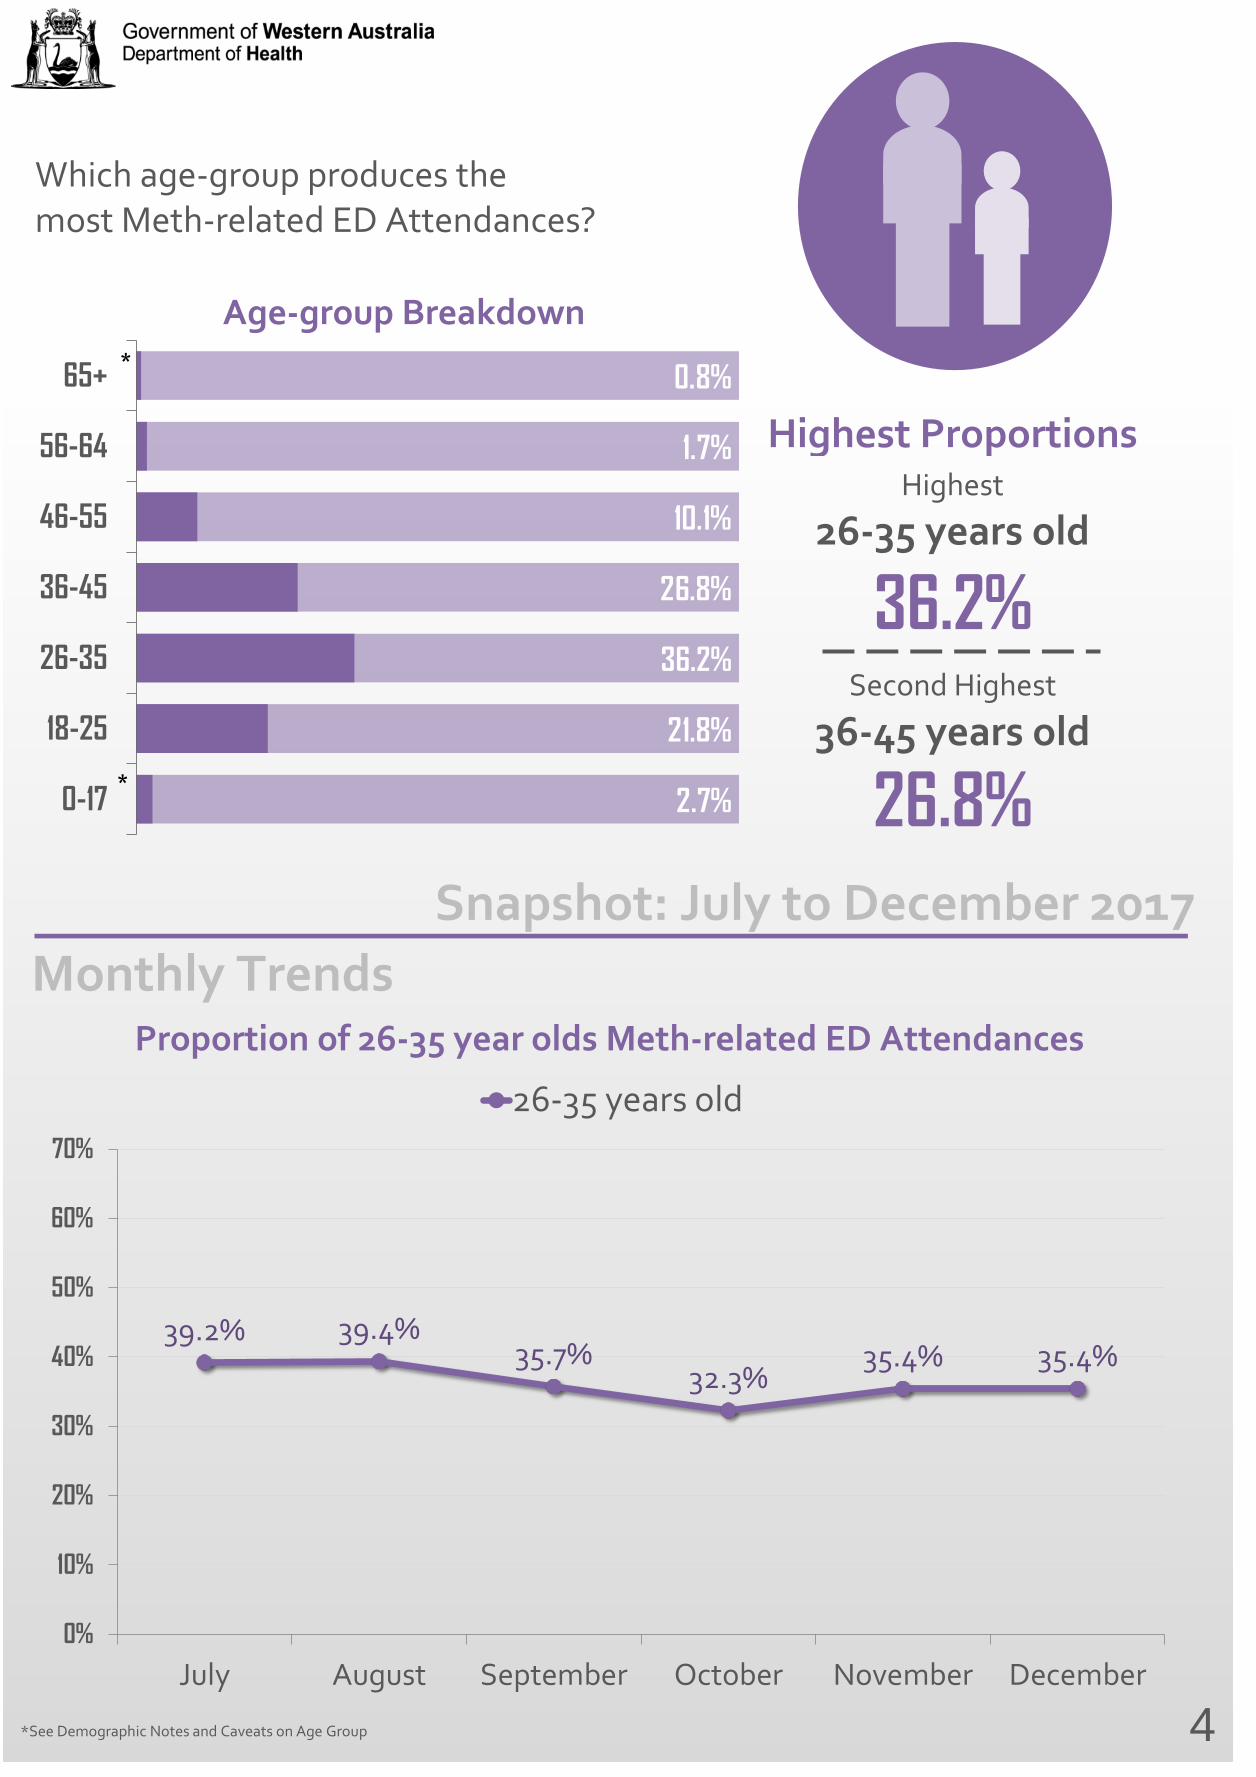
Which age-group produces the most Meth-related ED Attendances?
2.7%
21.8%
36.2%
26.8%
10.1%
1.7%
0.8%
0-17
18-25
26-35
36-45
46-55
56-64
65+*
*
Highest Proportions
26-35 years old Highest
Second Highest
36-45 years old
36.2%
26.8%
39.2% 39.4% 35.7%
32.3% 35.4% 35.4%
0%
10%
20%
30%
40%
50%
60%
70%
July August September October November December
26-35 years old
Proportion of 26-35 year olds Meth-related ED Attendances
4
Snapshot: July to December 2017 Monthly Trends
*See Demographic Notes and Caveats on Age Group
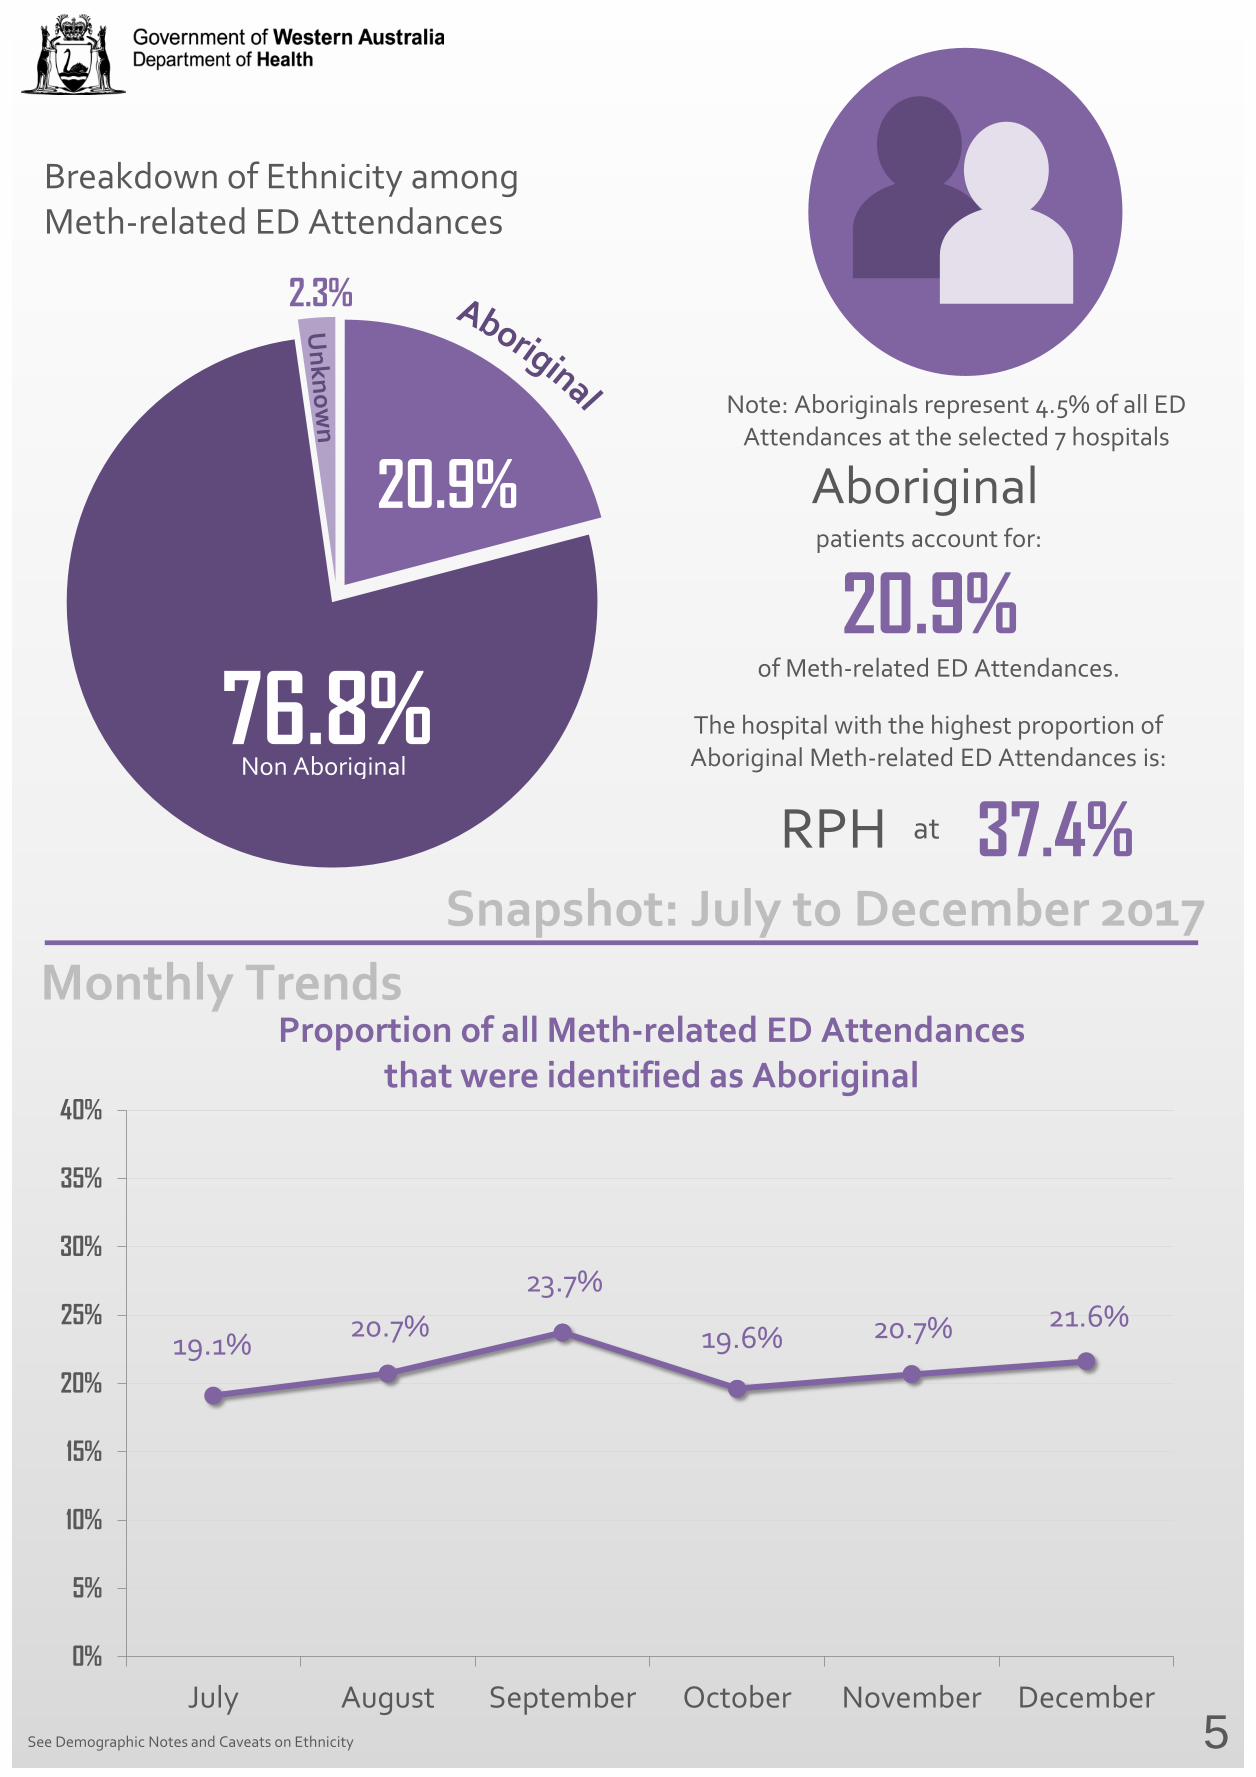
Breakdown of Ethnicity among Meth-related ED Attendances
76.8%
20.9%
2.3%
Aboriginal patients account for:
of Meth-related ED Attendances.
Non Aboriginal
20.9% The hospital with the highest proportion of Aboriginal Meth-related ED Attendances is:
RPH at 37.4%
19.1% 20.7% 23.7%
19.6% 20.7% 21.6%
0%
5%
10%
15%
20%
25%
30%
35%
40%
July August September October November December
Proportion of all Meth-related ED Attendances that were identified as Aboriginal
5
Snapshot: July to December 2017 Monthly Trends
See Demographic Notes and Caveats on Ethnicity
Note: Aboriginals represent 4.5% of all ED Attendances at the selected 7 hospitals
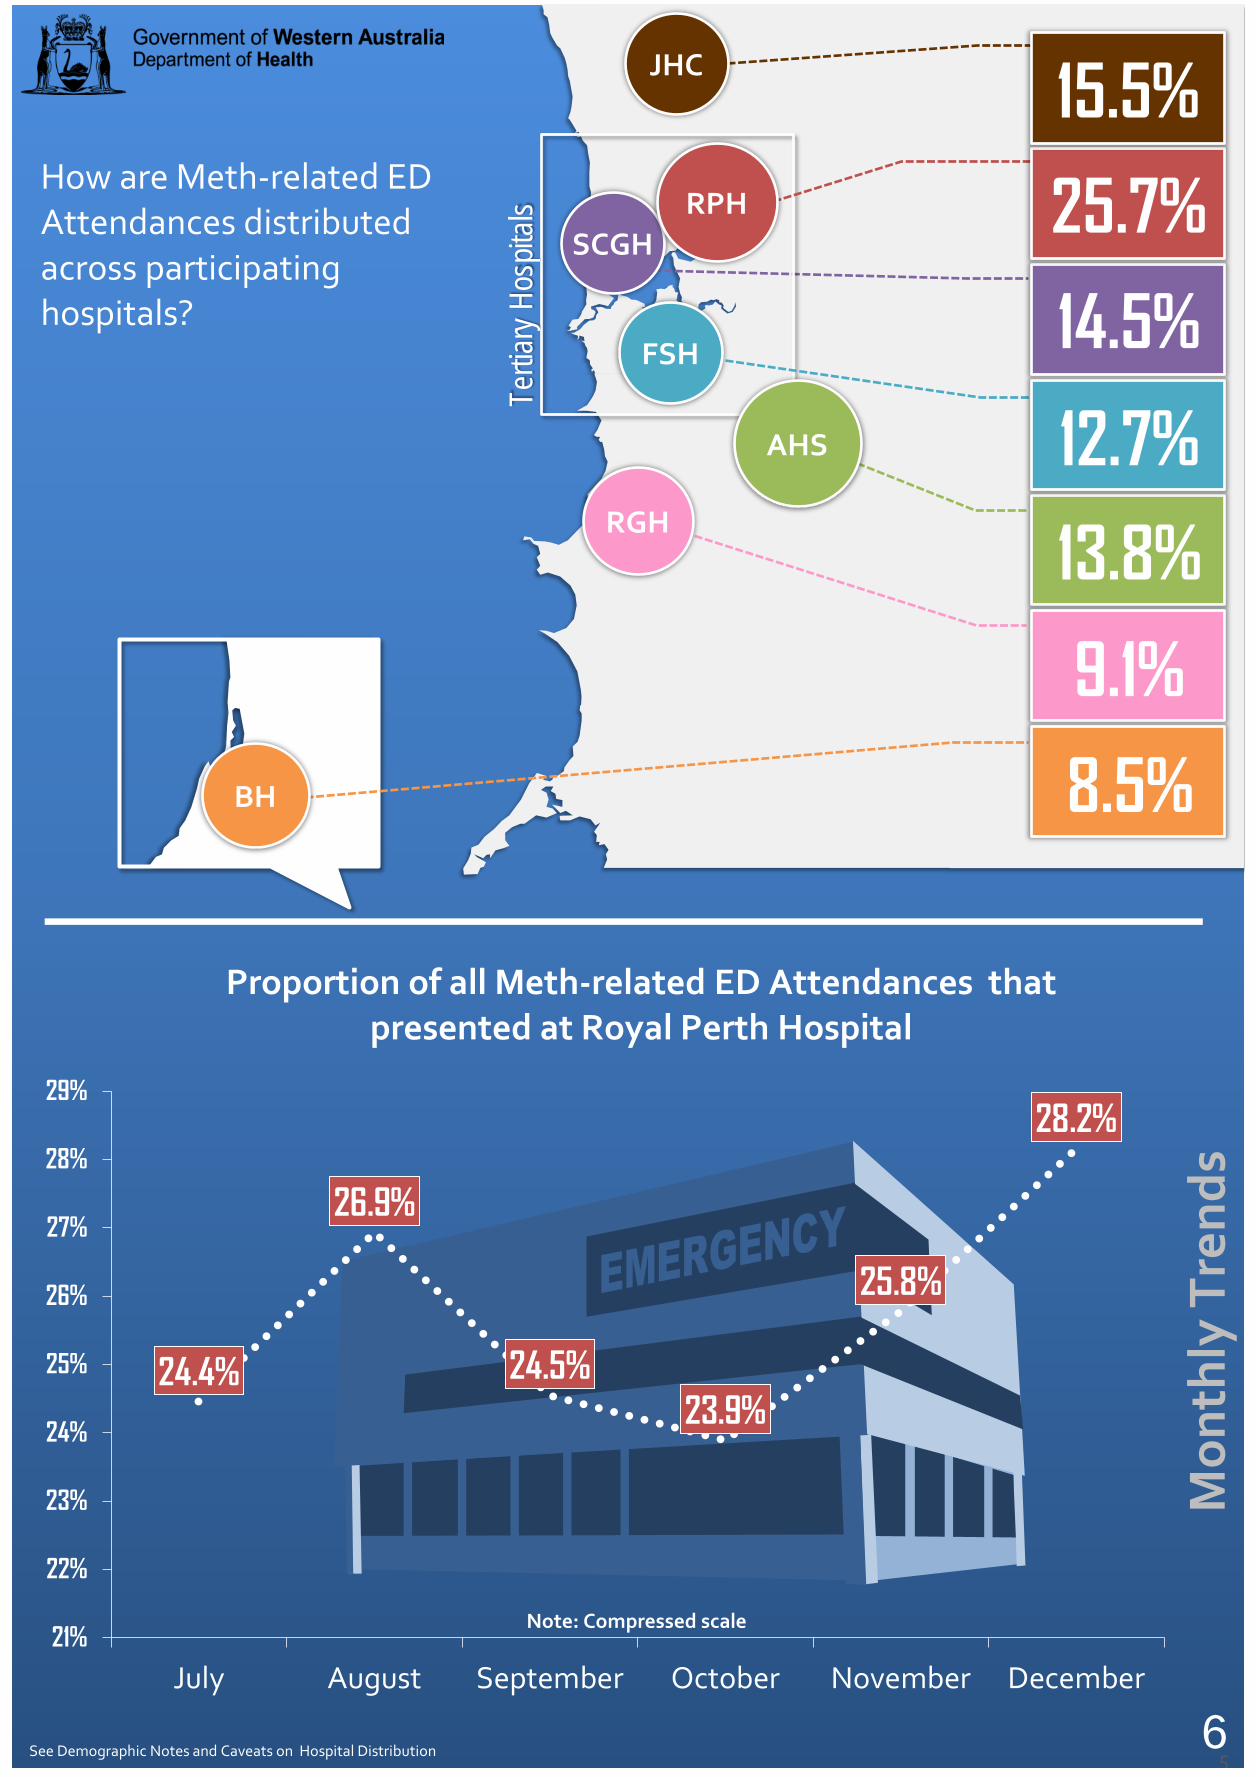
How are Meth-related ED Attendances distributed across participating hospitals?
Tertia
ry Ho
spita
ls
5
Proportion of all Meth-related ED Attendances that presented at Royal Perth Hospital
JHC
AHS
SCGH
RGH
BH
FSH
RPH
13.8%
12.7%
9.1%
8.5%
14.5%
25.7%
15.5%
6
Mon
thly
Tre
nds
See Demographic Notes and Caveats on Hospital Distribution
24.4%
26.9%
24.5% 23.9%
25.8%
28.2%
21%
22%
23%
24%
25%
26%
27%
28%
29%
July August September October November December
Note: Compressed scale

Basic Characteristics
0
50
100
150
200
250
Num
ber o
f Att
enda
nces
Time of Day
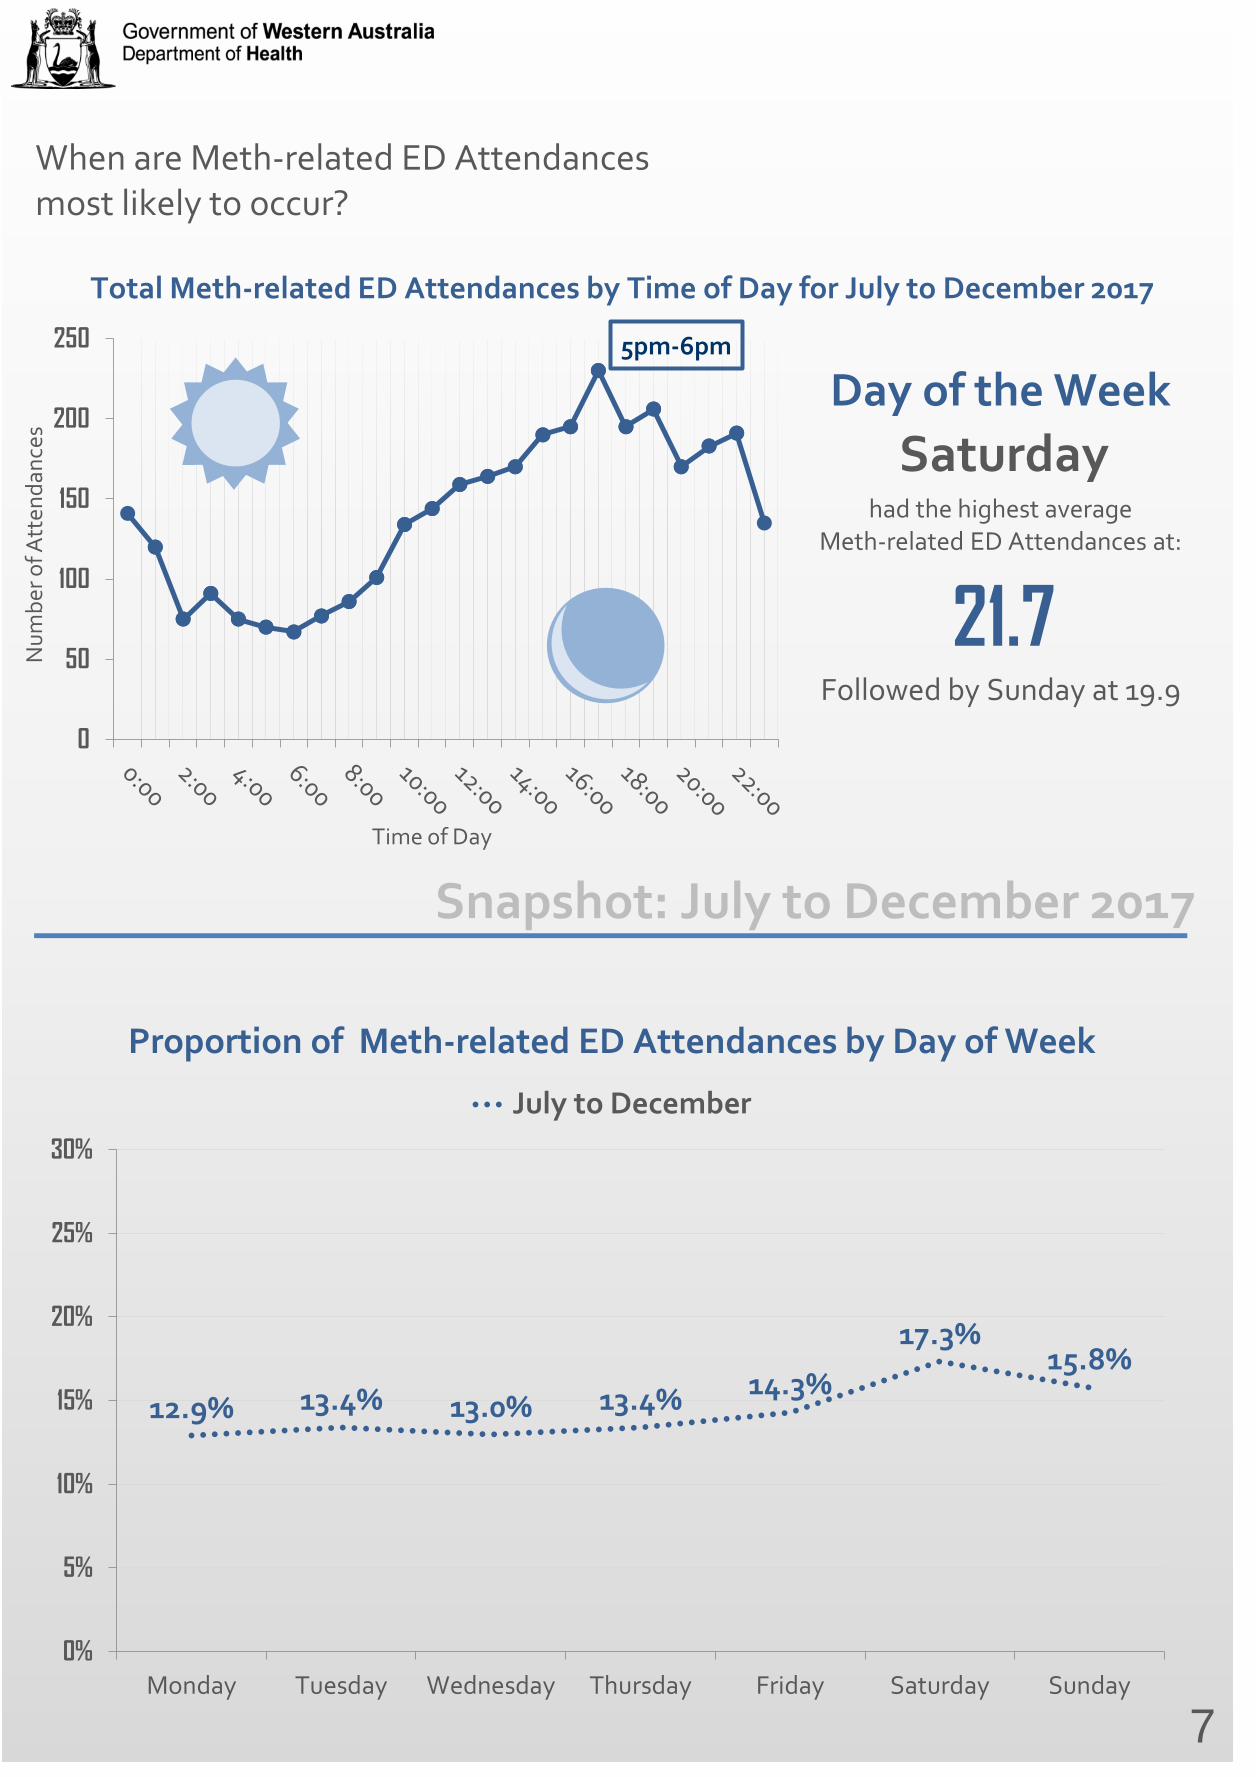
Total Meth-related ED Attendances by Time of Day for July to December 2017
When are Meth-related ED Attendances most likely to occur?
Day of the Week Saturday
had the highest average Meth-related ED Attendances at:
21.7 Followed by Sunday at 19.9
12.9% 13.4% 13.0% 13.4% 14.3%
17.3% 15.8%
0%
5%
10%
15%
20%
25%
30%
Monday Tuesday Wednesday Thursday Friday Saturday Sunday
July to December
Proportion of Meth-related ED Attendances by Day of Week
7
Snapshot: July to December 2017
5pm-6pm
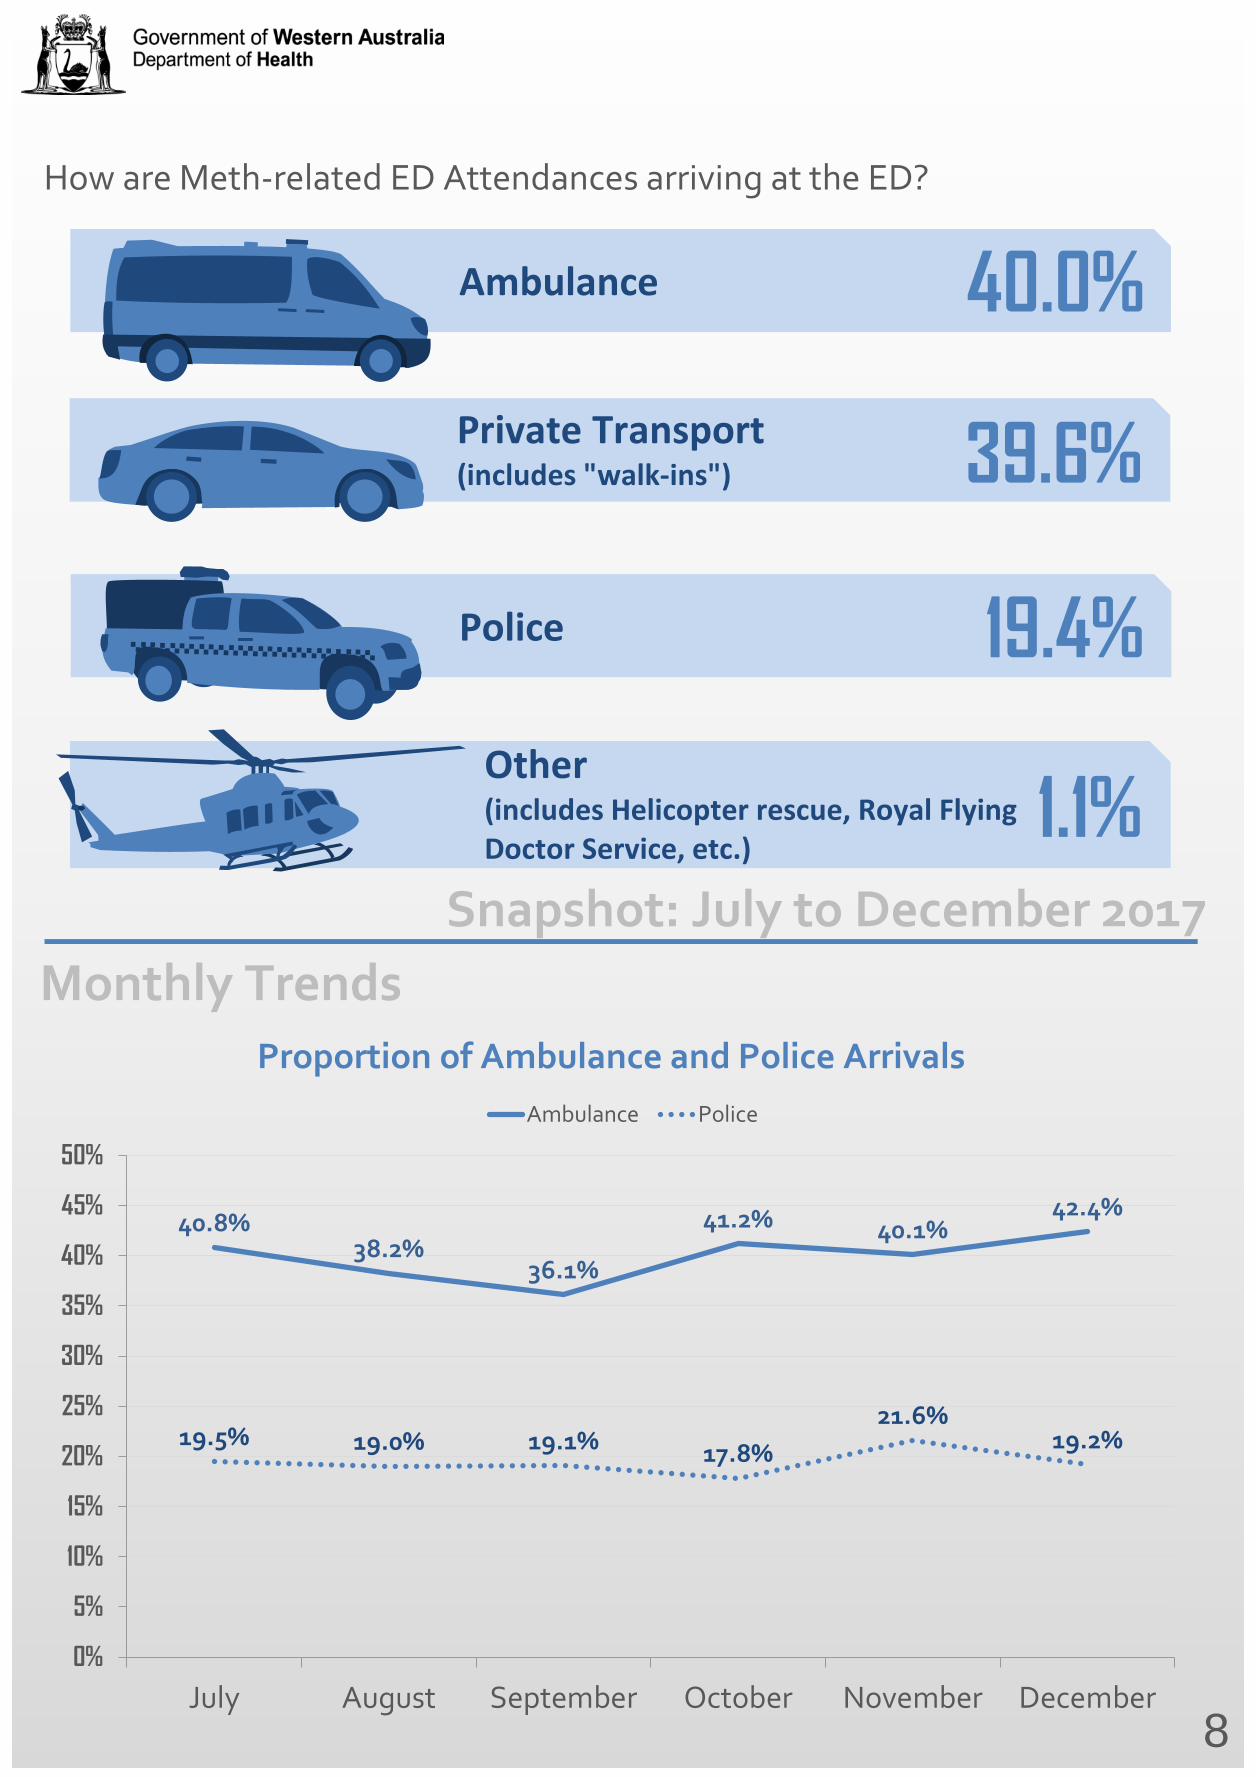
How are Meth-related ED Attendances arriving at the ED?
40.8% 38.2%
36.1%
41.2% 40.1% 42.4%
19.5% 19.0% 19.1% 17.8% 21.6%
19.2%
0%
5%
10%
15%
20%
25%
30%
35%
40%
45%
50%
July August September October November December
Ambulance Police
Proportion of Ambulance and Police Arrivals
Ambulance 40.0%
39.6%
Police 19.4%
Other (includes Helicopter rescue, Royal Flying Doctor Service, etc.)
1.1%
8
Snapshot: July to December 2017 Monthly Trends
Private Transport (includes "walk-ins")
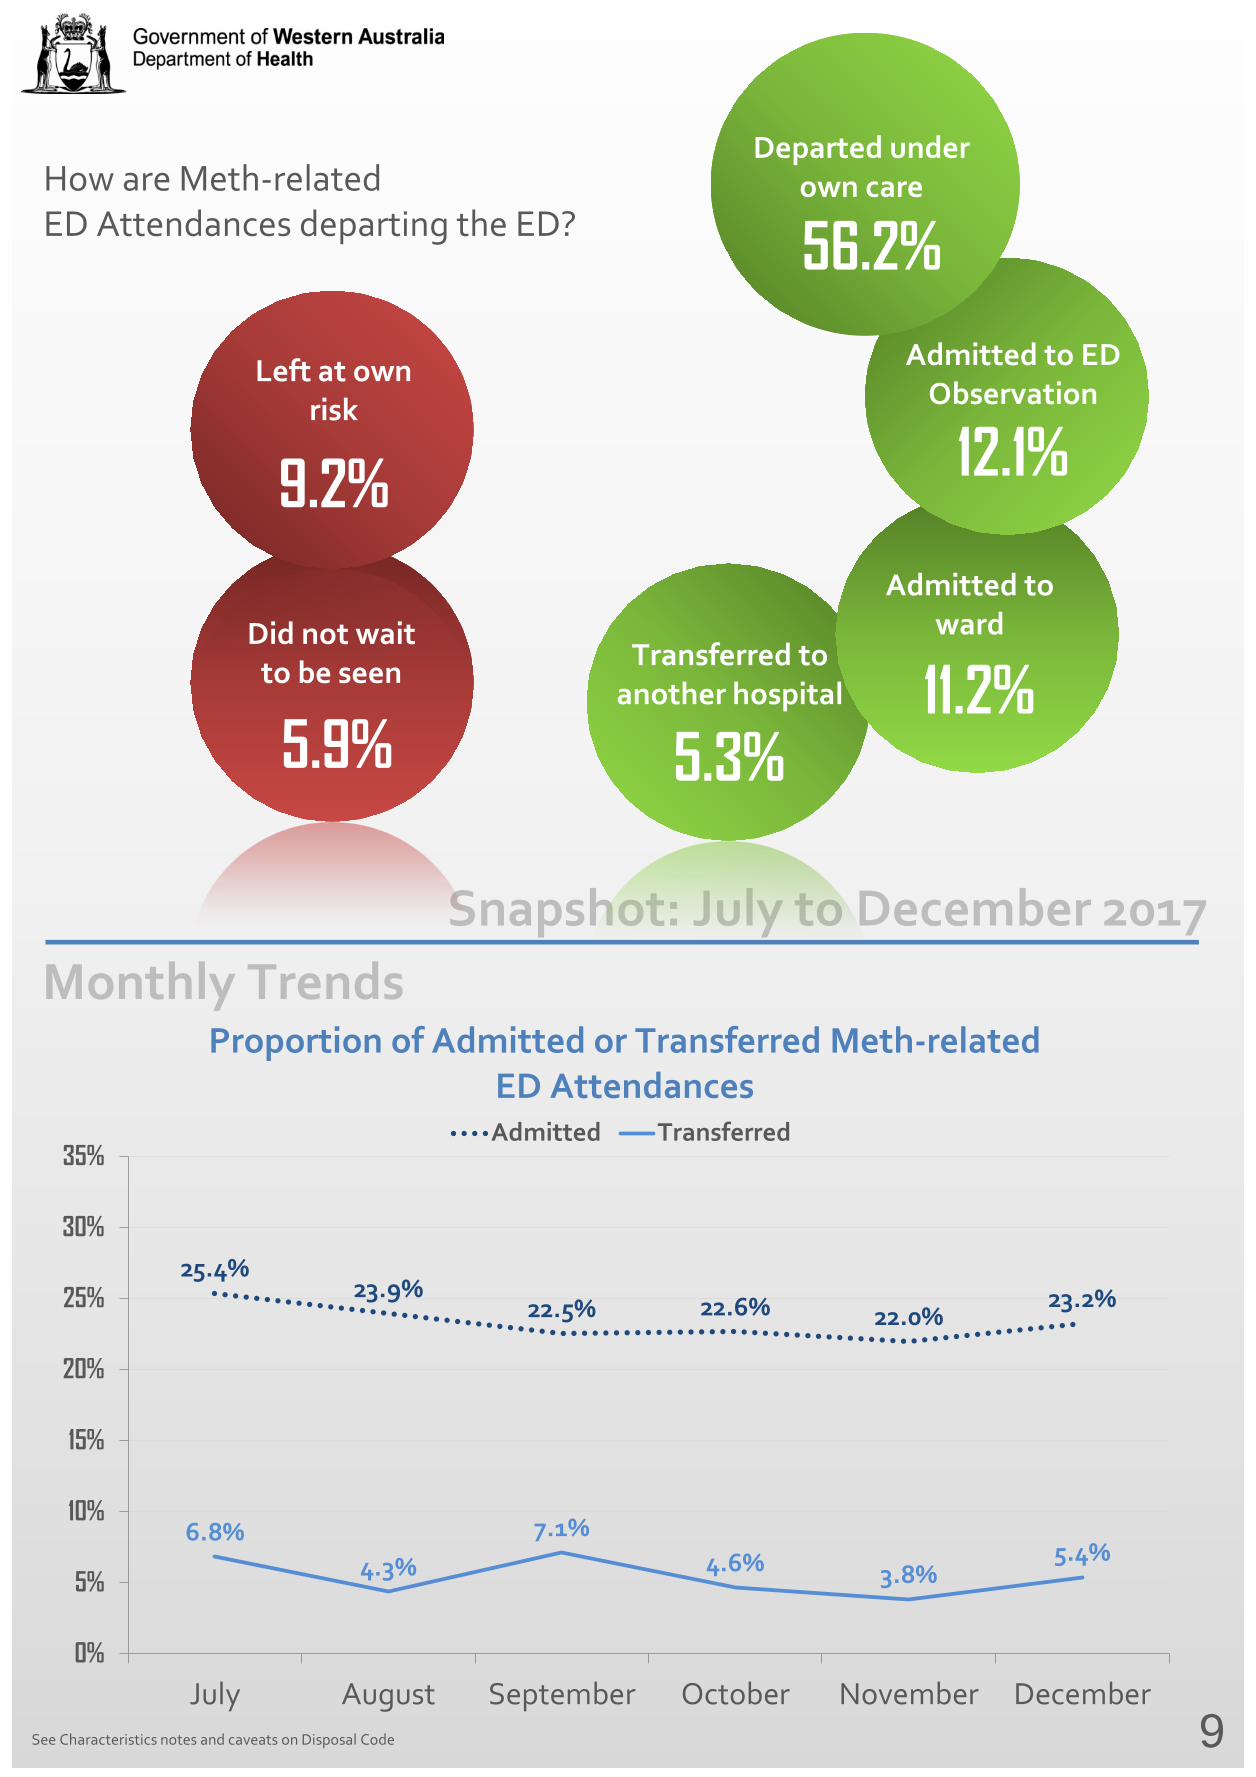
How are Meth-related ED Attendances departing the ED?
25.4% 23.9%
22.5% 22.6% 22.0% 23.2%
6.8% 4.3%
7.1% 4.6% 3.8%
5.4%
0%
5%
10%
15%
20%
25%
30%
35%
July August September October November December
Admitted Transferred
Proportion of Admitted or Transferred Meth-related ED Attendances
9
Snapshot: July to December 2017 Monthly Trends
See Characteristics notes and caveats on Disposal Code
Transferred to another hospital
5.3%
Did not wait to be seen
5.9%
Left at own risk
9.2% Admitted to
ward
11.2%
Admitted to ED Observation
12.1%
Departed under own care
56.2%
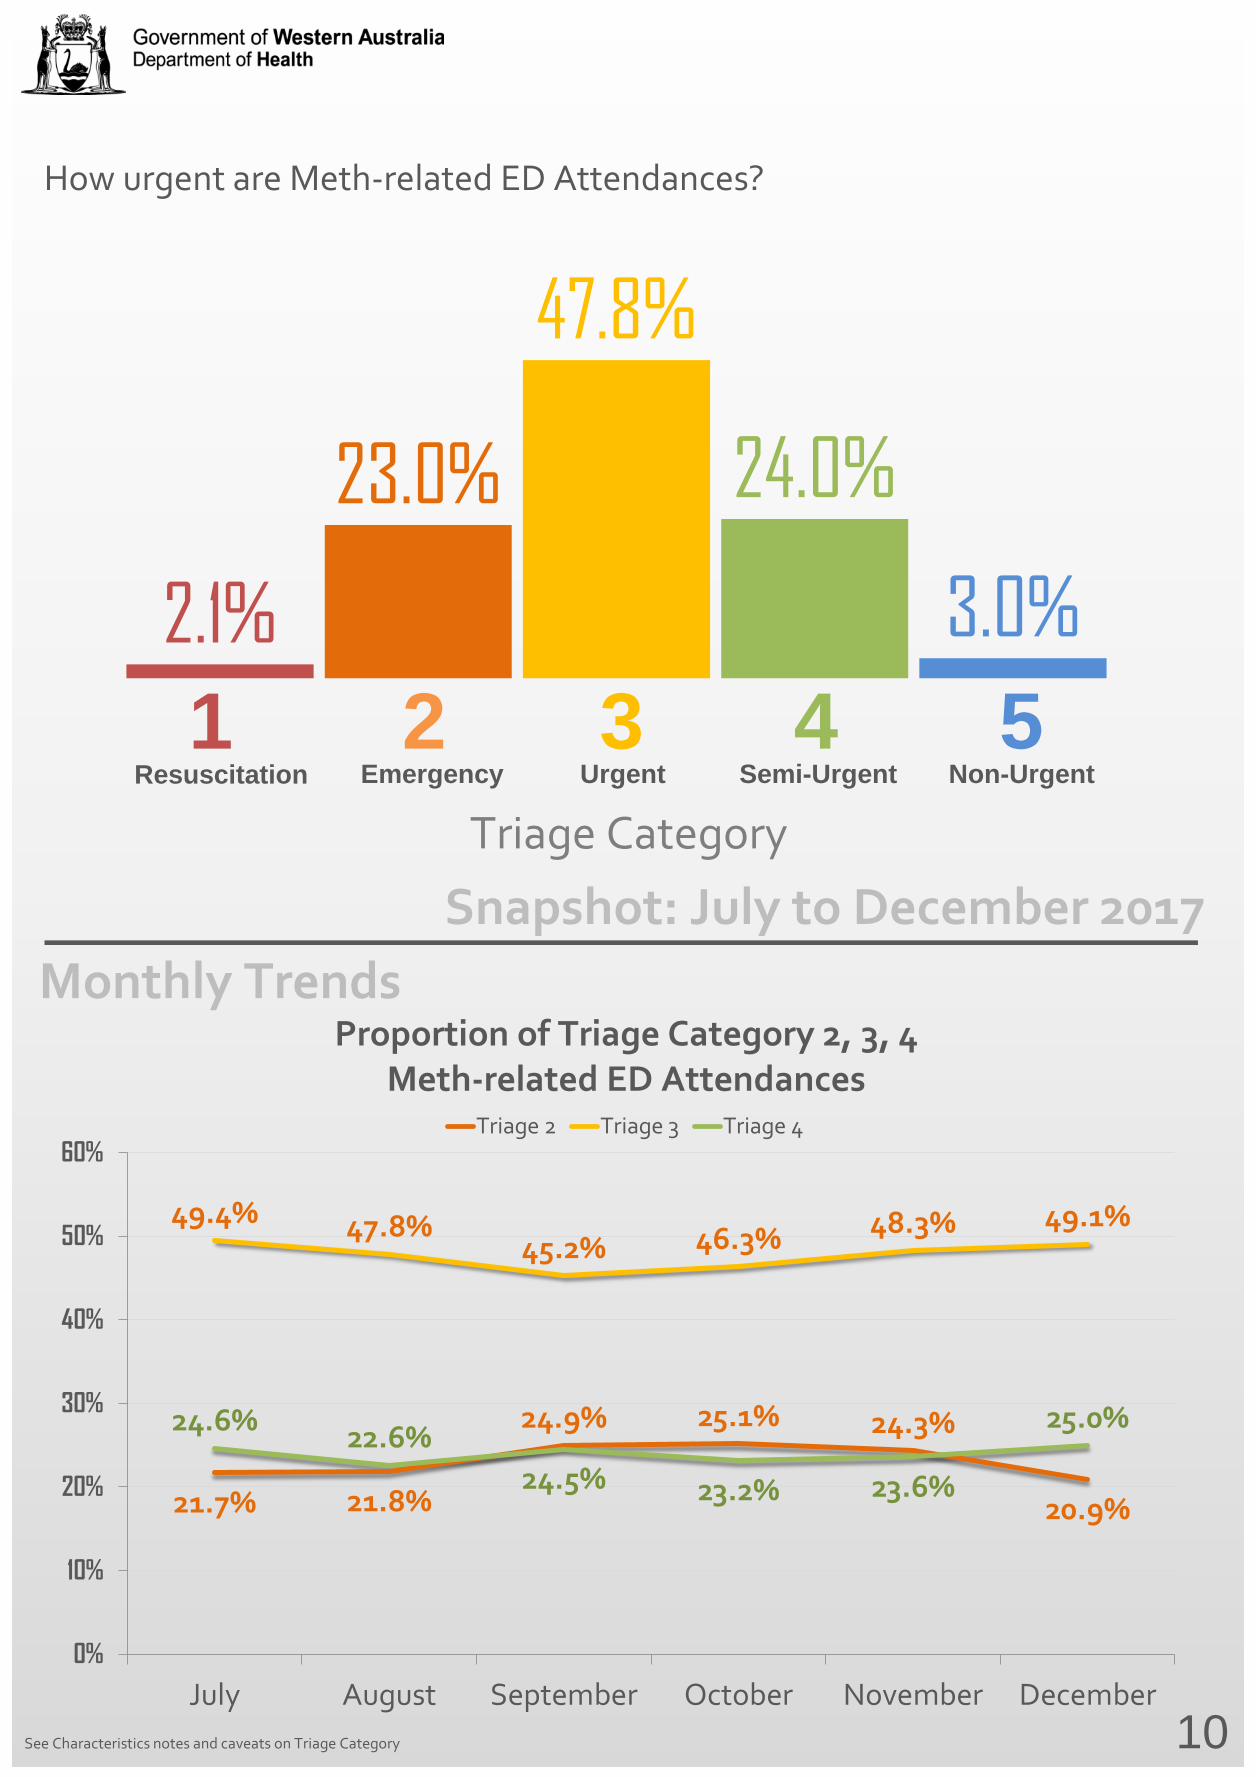
How urgent are Meth-related ED Attendances?
Resuscitation Emergency Urgent Semi-Urgent Non-Urgent
21.7% 21.8%
24.9% 25.1% 24.3%
20.9%
49.4% 47.8% 45.2% 46.3% 48.3% 49.1%
24.6% 22.6% 24.5% 23.2% 23.6%
25.0%
0%
10%
20%
30%
40%
50%
60%
July August September October November December
Triage 2 Triage 3 Triage 4
Proportion of Triage Category 2, 3, 4 Meth-related ED Attendances
2.1%
23.0%
47.8%
24.0%
3.0% 1 2 3 4 5
10
Snapshot: July to December 2017 Monthly Trends
See Characteristics notes and caveats on Triage Category
Triage Category


Diagnosis and Symptom classifications
Symptom Diagnosis Admission Meth-related subsequent admissions Assigned at triage Assigned at clinical assessment
Proportion of Meth-related ED Attendances who left the ED prematurely*
SUICIDAL
17.5% DRUG USE
16.8% INAPPROPRIATE BEHAVIOUR
16.8%
PSYCHOTIC EPISODE
15.3% AMPHETAMINE POISONING
14.1% DRUG INDUCED MENTAL DISORDER
10.6%
11
Snapshot: July to December 2017 Monthly Trends
AMPHETAMINE POISONING
14.6% PSYCHOTIC EPISODE
10.6% DRUG INDUCED MENTAL DISORDER
10.6%
* See Glossary for more information on patients who left the ED prematurely
13.6% 15.1%
19.1% 19.8%
14.7%
19.0%
0%
5%
10%
15%
20%
25%
July August September October November December
Left ED Prematurely
Categories are independent of each other
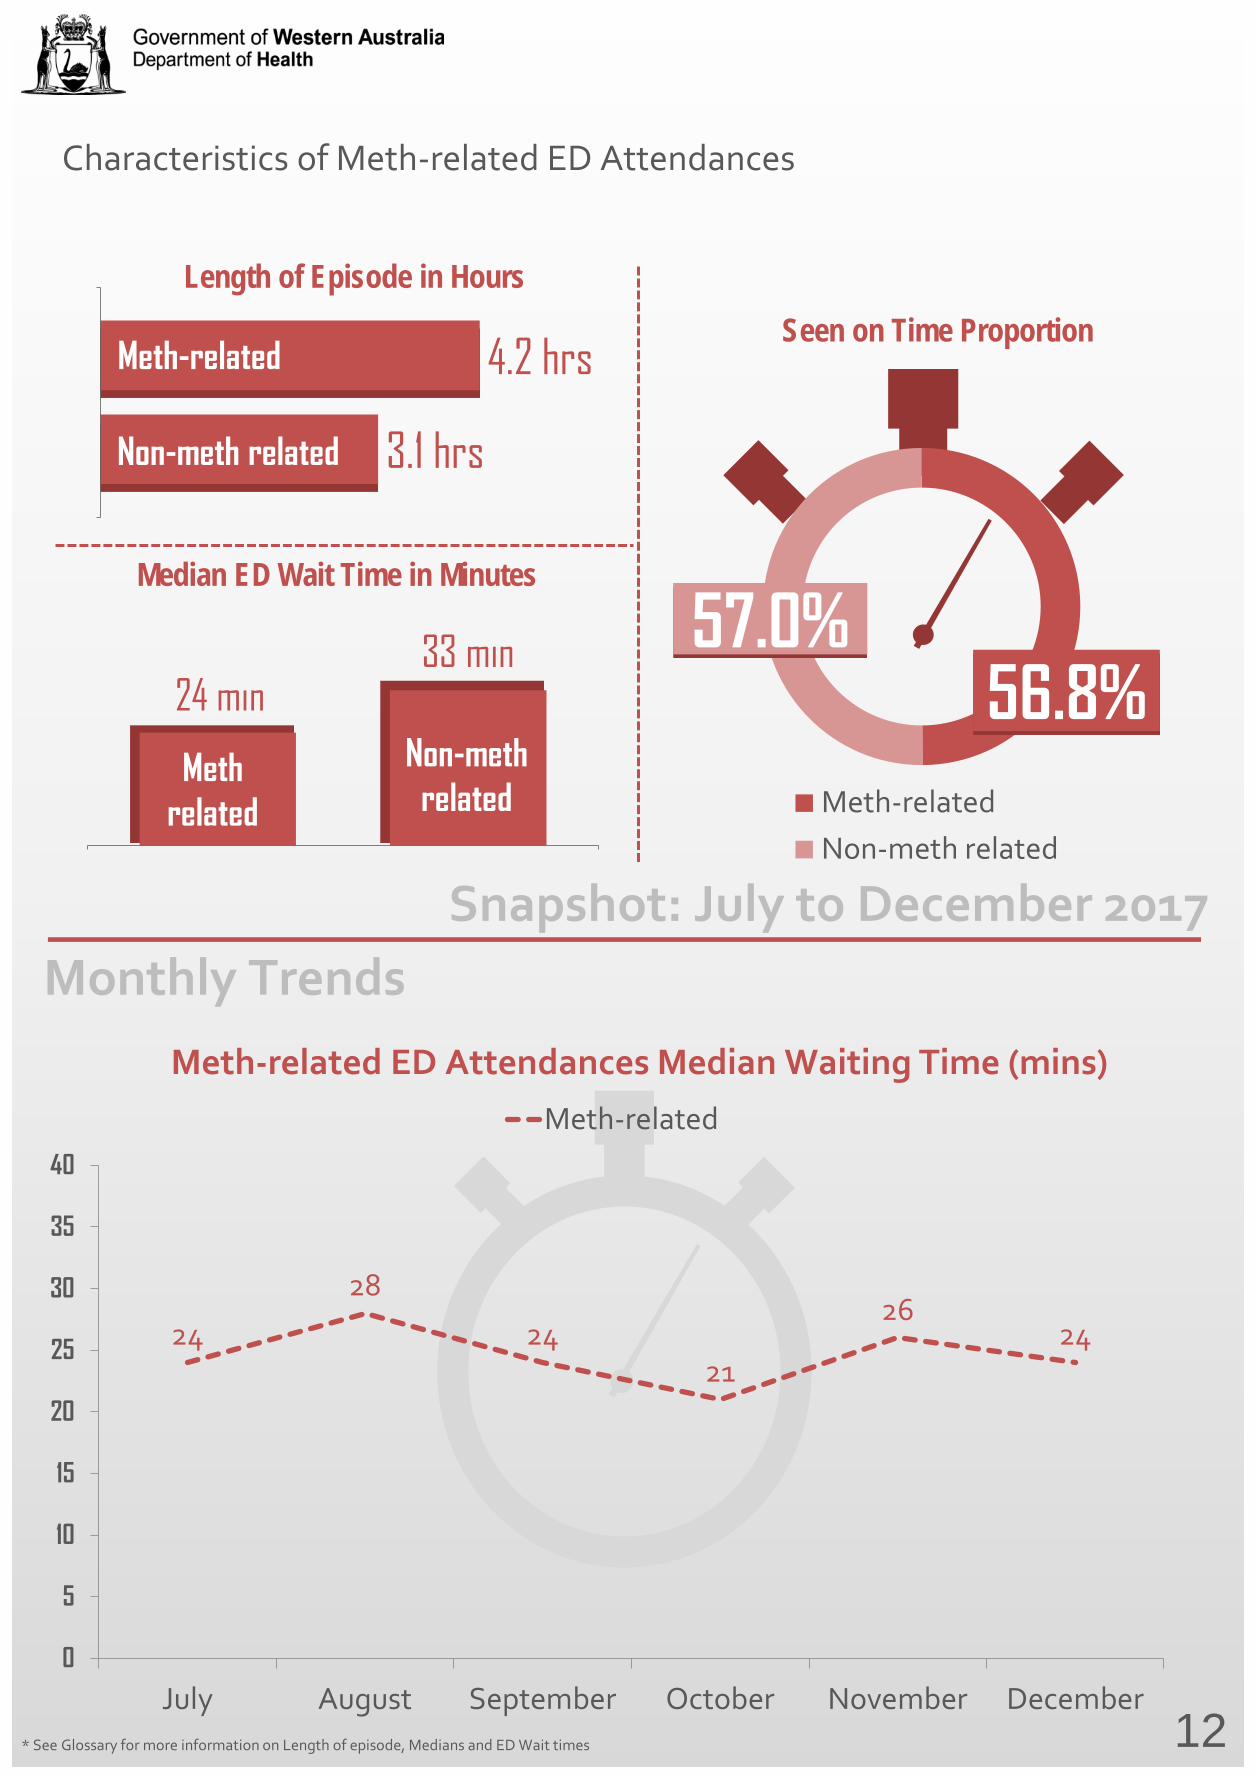
Characteristics of Meth-related ED Attendances
Meth-relatedNon-meth related
56.8%
Seen on Time Proportion
3.1 hrs
4.2 hrs
Length of Episode in Hours
Non-meth related
Meth-related
24 min 33 min
Median ED Wait Time in Minutes
Meth related
Non-meth related
24
28
24 21
26 24
0
5
10
15
20
25
30
35
40
July August September October November December
Meth-related
Meth-related ED Attendances Median Waiting Time (mins)
57.0%
12
Snapshot: July to December 2017 Monthly Trends
* See Glossary for more information on Length of episode, Medians and ED Wait times
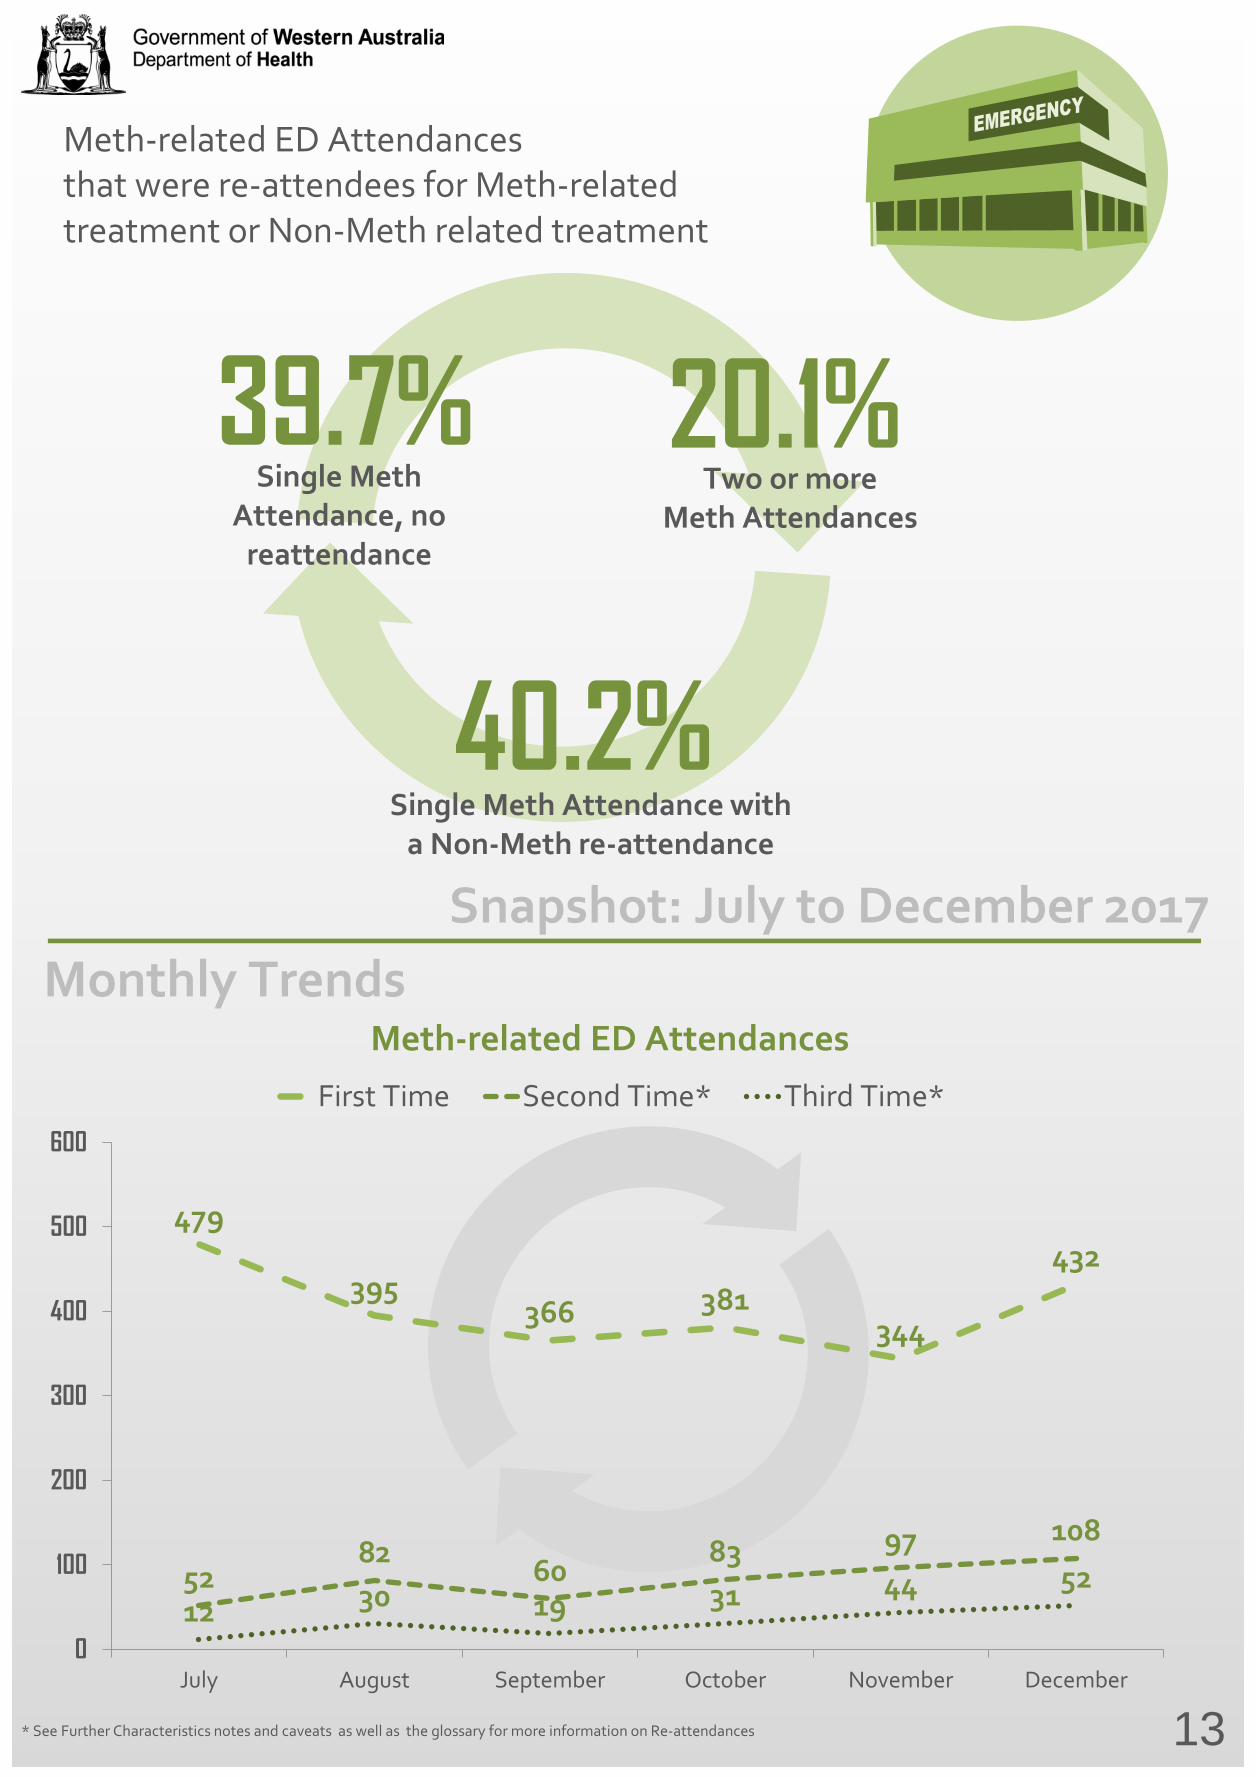
* See Further Characteristics notes and caveats as well as the glossary for more information on Re-attendances
479
395 366 381
344
432
52 82 60
83 97 108
12 30 19 31 44 52
0
100
200
300
400
500
600
July August September October November December
First Time Second Time* Third Time*
Meth-related ED Attendances
13
Snapshot: July to December 2017 Monthly Trends
39.7% Single Meth
Attendance, no reattendance
40.2% Single Meth Attendance with
a Non-Meth re-attendance
20.1% Two or more
Meth Attendances
Meth-related ED Attendances that were re-attendees for Meth-related treatment or Non-Meth related treatment
Demographic Notes and Caveats
Meth-related ED Attendances
ED Attendances are considered Meth-related based on the opinion of the treating doctor or nurse. The decision to flag an ED Attendance as Meth-related can be made at the time of triage, diagnosis or at any other time during a patient's ED episode.
A specific list of symptom codes (when assigning triage) and diagnosis codes (when assigning diagnosis) will prompt ED staff to consider whether or not they believe a patient's ED Attendance is related to Meth.
Age-group
Any records in the 65+ and 0-17 years age groups are returned to hospitals as part of the quality assurance process for validations.
Age group figures and totals exclude ED Attendances with a missing date of birth.
Percentages may not sum to 100% due to rounding.
Ethnicity
Within Western Australia, the term Aboriginal is used in preference to Aboriginal and Torres Strait Islander, in recognition that Aboriginal people are the original inhabitants of Western Australia.
No disrespect is intended to our Torres Strait Islander colleagues and community.
Aboriginal figures and totals include ED Attendances where a patient's ethnicity is both Aboriginal and Torres Strait Islander.
14
Basic Characteristics Notes and Caveats
Hospital Distribution
Percentages refer to Meth-related ED Attendances at each hospital divided by the total Meth-related ED Attendances. Hospital figures and totals may not sum due to rounding.
Departed from the ED
Disposal code figures and totals include the following categories: Transferred to another hospital; Did not wait to be seen; Left at own risk; Admitted to Ward; Admitted to ED Obs and Departed under own care. These are pre-set options that are selected by medical staff.
15
Triage Category
Triage Category figures and totals exclude Direct admissions to the hospital. Direct admissions are low in number and would not normally occur for meth-related patients. Triage category 1 Life-threatening condition. Requires treatment Immediately or within two minutes . Triage category 2 Imminently life-threatening condition. Requires treatment within 10 minutes. Triage category 3 Potentially life-threatening condition. Requires treatment within 30 minutes. Triage category 4 Potentially serious condition. Requires treatment within one hour. Triage category 5 Less urgent condition. Requires treatment within two hours.
Further Characteristics Notes and Caveats
16
Re-attendances
The Emergency Department Data Collection began receiving Meth-related ED Data as of July 2017 and a patient's re-attendance history can only commence from this date. It is expected subsequent Meth-related ED Attendances will rise for a period of time given the commencement of the data collection.
Left the ED prematurely
Meth-related ED Attendances who left the ED prematurely include patients who departed the ED before being treated or patients who departed the ED against medical advice. Clinical Judgement If a patient presents to an ED with a pre-determined set of presenting complaint or primary diagnosis which may be indicative of being Meth affected, the “Meth-related” pop-up will be triggered once the matched presenting complaint or primary diagnosis is entered into the triage screen or clinical screen. ED staff then exercise judgement (if possible) to identify whether or not the patient is likely under the influence of Meth, or their ED attendance has resulted from taking Meth.
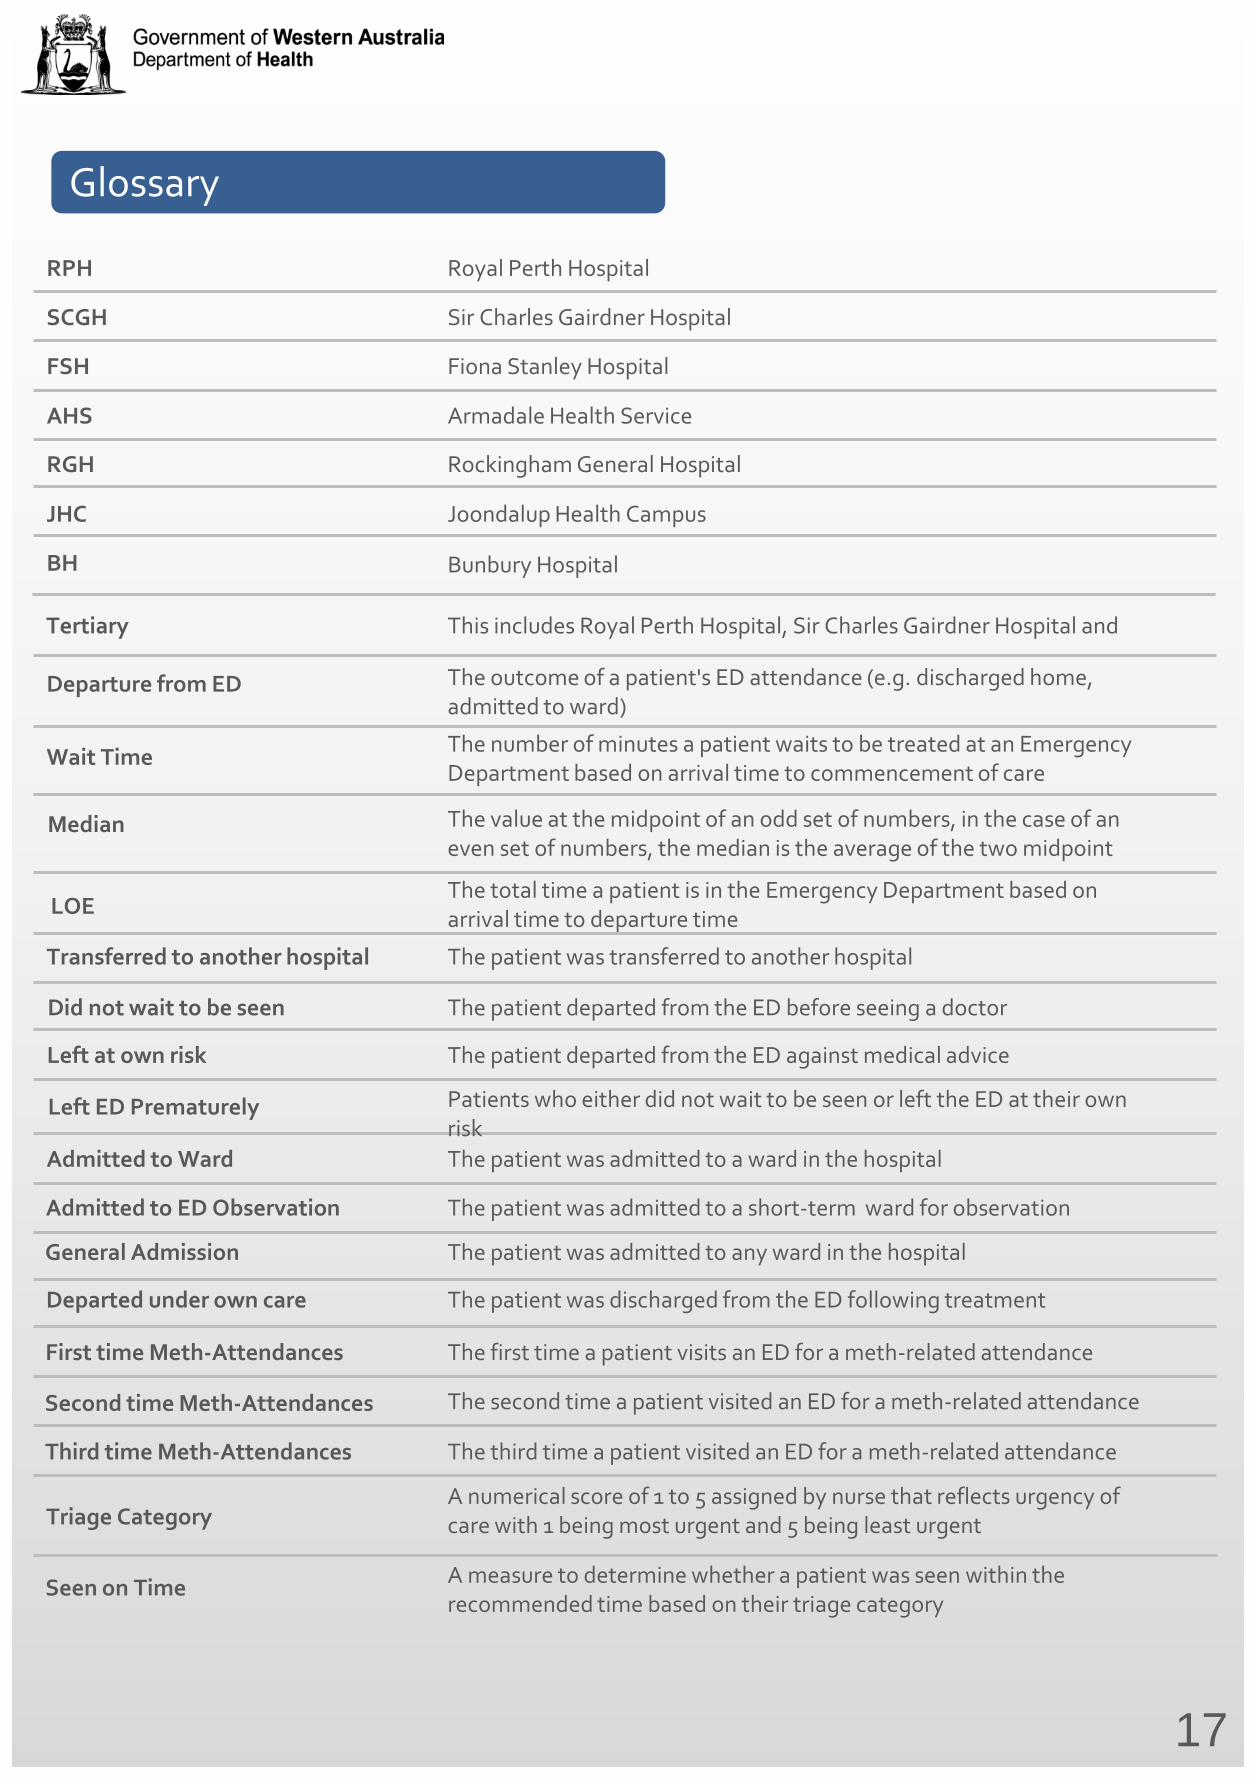
Glossary
RPH
17
Royal Perth Hospital
SCGH Sir Charles Gairdner Hospital
Wait Time The number of minutes a patient waits to be treated at an Emergency Department based on arrival time to commencement of care
FSH Fiona Stanley Hospital
AHS Armadale Health Service
RGH Rockingham General Hospital
JHC Joondalup Health Campus
BH Bunbury Hospital
Departure from ED The outcome of a patient's ED attendance (e.g. discharged home, admitted to ward)
Transferred to another hospital The patient was transferred to another hospital
Did not wait to be seen The patient departed from the ED before seeing a doctor
Left at own risk The patient departed from the ED against medical advice
Admitted to Ward The patient was admitted to a ward in the hospital
Admitted to ED Observation The patient was admitted to a short-term ward for observation
General Admission The patient was admitted to any ward in the hospital
Departed under own care The patient was discharged from the ED following treatment
Median The value at the midpoint of an odd set of numbers, in the case of an even set of numbers, the median is the average of the two midpoint
First time Meth-Attendances The first time a patient visits an ED for a meth-related attendance
Second time Meth-Attendances The second time a patient visited an ED for a meth-related attendance
Third time Meth-Attendances The third time a patient visited an ED for a meth-related attendance
LOE The total time a patient is in the Emergency Department based on arrival time to departure time
Tertiary This includes Royal Perth Hospital, Sir Charles Gairdner Hospital and
Triage Category A numerical score of 1 to 5 assigned by nurse that reflects urgency of care with 1 being most urgent and 5 being least urgent
Seen on Time A measure to determine whether a patient was seen within the recommended time based on their triage category
Left ED Prematurely Patients who either did not wait to be seen or left the ED at their own risk
Produced by Purchasing and System Performance Division © Department of Health 2018 Copyright to this material is vested in the State of Western Australia unless otherwise indicated. Apart from any fair dealing for the purposes of private study, research, criticism or review, as permitted under the provisions of the Copyright Act 1968, no part may be reproduced or re-used for any purposes whatsoever without written permission of the State of Western Australia.
This document can be made availablein alternative formats on request for a person with disability.
health.wa.gov.au


![RANKING 10+ [frekwencje w Europie, European attendances ]](https://img.pdfslide.net/doc/110x75/568c385b1a28ab02359e9e5a/ranking-10-frekwencje-w-europie-european-attendances-.jpg)