Embed Size (px)
Citation preview

Journal Pre-proof
Methane to ethylene by pulsed compression
Y. Slotboom, S. Roosjen, A. Kronberg, M. Glushenkov, S.R.A. Kersten
PII: S1385-8947(21)00415-0DOI: https://doi.org/10.1016/j.cej.2021.128821Reference: CEJ 128821
To appear in: Chemical Engineering Journal
Received date : 10 November 2020Revised date : 25 January 2021Accepted date : 30 January 2021
Please cite this article as: Y. Slotboom, S. Roosjen, A. Kronberg et al., Methane to ethylene bypulsed compression, Chemical Engineering Journal (2021), doi:https://doi.org/10.1016/j.cej.2021.128821.
This is a PDF file of an article that has undergone enhancements after acceptance, such as theaddition of a cover page and metadata, and formatting for readability, but it is not yet the definitiveversion of record. This version will undergo additional copyediting, typesetting and review before itis published in its final form, but we are providing this version to give early visibility of the article.Please note that, during the production process, errors may be discovered which could affect thecontent, and all legal disclaimers that apply to the journal pertain.
© 2021 Published by Elsevier B.V.

Graphical Abstract
Journal Pre-proof
Jour
nal P
re-p
roof

Highlights (for review)
Journal Pre-proof
Highlights
Replaced argon diluent by nitrogen gas
Non-oxidative & non-catalytic
Achieved compression ratios of up to 132
Conversion of 26% and selectivity of 81% to ethylene + acetylene obtained
Jour
nal P
re-p
roof

Manuscript Click here to view linked References
1 2 3 4 5 6 7 8 9 10 11 12 13 14 15 16 17 18 19 20 21 22 23 24 25 26 27 28 29 30 31 32 33 34 35 36 37 38 39 40 41 42 43 44 45 46 47 48 49 50 51 52 53 54 55 56 57 58 59 60 61 62 63 64 65
Journal Pre-proof
Methane to ethylene by pulsed compression
Y. Slotbooma,∗, S. Roosjena, A. Kronbergb, M. Glushenkovb, S.R.A. Kerstena,∗
aSustainable Process Technology, Faculty of Science and Technology, University of Twente, PO Box 217, 7500AE Enschede, The Netherlands
bEncontech B.V., P.O. Box 217, 7500 AE, Enschede, The Netherlands
Abstract
Pulsed compression is introduced for the conversion of methane, by pyrolysis, into ethylene.
At the point of maximal compression temperatures of 900 to 1620 K were reached, while the
initial and final temperature of the gas did not exceed 523 K. By the use of a free piston
reactor concept pressures of up to 460 bar were measured with nitrogen as a diluting gas.
From 1100 K onwards methane conversion was measured. By increasing the temperature, the
mechanism of pyrolytic methane conversion, being subsequent production of ethane, ethylene,
acetylene, ..., benzene, and ultimately tar/soot, was clearly observed. Without hydrogen in the
feed, the attainable operating window (C2-selectivity vs. methane conversion) observed was
similar to other catalytic oxidative and non-oxidative coupling processes. With hydrogen, in a
first attempt to optimize the product yield, 24% C2-yield (62% ethylene selectivity, 93% C2-
selectivity) at 26% conversion was reached without producing observable soot. It is worthwhile
to explore pulsed compression further because it does not require a catalyst and therefore, does
not deactivate over time and it operates at low reactor temperature.
Keywords: Methane, thermal coupling, ethylene, compression, non-oxidative, non-catalytic
∗Corresponding authors:Email addresses: [email protected] (Y. Slotboom), [email protected] (S.R.A. Kersten)
Preprint submitted to Chemical Engineering Journal January 25, 2021
Jour
nal P
re-p
roof

1 2 3 4 5 6 7 8 9 10 11 12 13 14 15 16 17 18 19 20 21 22 23 24 25 26 27 28 29 30 31 32 33 34 35 36 37 38 39 40 41 42 43 44 45 46 47 48 49 50 51 52 53 54 55 56 57 58 59 60 61 62 63 64 65
Journal Pre-proof
For many decades, the direct coupling of methane to olefins has been studied [1–3]. This
process is considered to be attractive because: 1) methane is abundantly available and produc-
tion is increasing, e.g. by recent fracturing techniques [4], 2) it poses a more cost-effective and
environmentally friendly alternative to the energy intensive naphtha steam crackers [2, 5], 3)
it provides the possibility of local and small-scale production of olefins [6], e.g. from methane
that would have been flared otherwise [7, 8]. The impact of replacing naphtha by methane can
be substantial, since products like ethylene and propylene are bulk chemicals with respectively
a demand of 150 and 100 megatonnes/year [9].
There are two direct routes from methane towards olefins being investigated: oxidative
coupling of methane (OCM) and non-oxidative coupling of methane (NCM, investigated in
this work). To date, both routes require catalysis and many catalytic systems for OCM and
NCM have been investigated [1–4, 10, 11]. Plasma techniques (NCM) can convert methane
non-catalytically. However, acetylene is the main product [12] and thus catalysis is required to
hydrogenate to ethylene [13].
Typically, C2-yields of OCM are between 10 and 20% with peaks to 30% [3, 14]. Most of
the research was carried out at laboratory-scale and a small number of pilot-plants have been
in operation [15]. A drawback of using OCM is the downgrading of a part of the feedstock
(i.e. producing CO2), thus having a low carbon efficiency. The challenge lies in selectivity
control, since any (oxygenated) hydrocarbon is more reactive than methane itself [1]. Other
challenges reported are the heating of a gaseous feed to the temperatures of around 1073-
1173 K, the difficulty in heat management of the exothermic reaction and the stability of the
catalyst [14]. High energy consumption of the separation train in combination with low C2-
yields (<25%) make the process still far from competitive on both capital expenditures and
operational expenditures compared to the conventional naphtha steam cracking [5, 16]. The
drawbacks of OCM increased the interest in NCM [1, 17–19]. NCM is essentially the pyrolysis
of methane. The main challenge of methane pyrolysis for the production of olefins is to achieve
high conversion and prevent soot formation, as no oxygen is there to prevent that [17, 19]. At
temperatures of 973-1173 K reported C2-yields (ethane, ethylene and acetylene) were typically
limited to 5% (Pt-Bi or Ni-P catalyst) [20, 21]. Somewhat higher temperatures (≈ 1373 K)
resulted in yields of around 23% of ethylene using a single iron site catalyst [22]. At the Institut
2
Jour
nal P
re-p
roof

1 2 3 4 5 6 7 8 9 10 11 12 13 14 15 16 17 18 19 20 21 22 23 24 25 26 27 28 29 30 31 32 33 34 35 36 37 38 39 40 41 42 43 44 45 46 47 48 49 50 51 52 53 54 55 56 57 58 59 60 61 62 63 64 65
Journal Pre-proof
Francais du Petrole pilot scale research was conducted [23]. However, the severe conditions and
catalyst deactivation in combination with low yields have limited NCM from commercialization
[4, 17].
In this work we introduce a low temperature (<573 K) non-oxidative, non-catalytic and non-
plasma method to convert methane to ethylene and other valuable products. We report here
our first observations, without a complete understanding of the underlying phenomena yet, to
make the findings available to the community for further exploration of its opportunities. The
method is based on pulsed compression of methane. Pulsed stands for very fast compression
and subsequent decompression. The high temperatures reached by the compression enable the
pyrolysis of methane.
CH4 � CH3 · +H·
C2H6
C2H4
C2H2
C6H6
Tar
C(s) + 2 H2
High activation energy
Fast subsequent reactions
Stop reaction
Figure 1: Simplified reaction path of methane pyrolysis [17, 24–27].
The difficulty of thermal is that the first step has a very high activation energy between
419 and 452 kJ mol−1 [28] and thus requires a high temperature, but once that is overcome
methane can react all the way down to soot, as displayed in Figure 1. Hence, the desired
products are intermediates in the reaction chain. The only way to produce ethylene is to stop
it in the middle by quenching with unconventional speeds. Or in other words: only allow for a
very short reaction time at high temperature.
The pulsed compression reactor (PCR) can achieve the required conditions of fast heating
to high temperatures and rapid quenching [29, 30]. The first description of a compression
3
Jour
nal P
re-p
roof

1 2 3 4 5 6 7 8 9 10 11 12 13 14 15 16 17 18 19 20 21 22 23 24 25 26 27 28 29 30 31 32 33 34 35 36 37 38 39 40 41 42 43 44 45 46 47 48 49 50 51 52 53 54 55 56 57 58 59 60 61 62 63 64 65
Journal Pre-proof
0 2 4 6 8 10 12 14 160
50
100
150
200
250
Time (ms)
Pre
ssure
(bar
)
Experimental pressureModel pressureModel temperature 400
600
800
1000
1200
1400
Tem
per
ature
(K)
1
2
3
4
5
6
Gas in Sample out
Figure 2: Schematic representation of the pulsed compression reactor. The reactor is operated batch wise. Thefigure shows a pressure and temperature curve of a typical pulse. 1. Pressure sensor 2. Laser sensor 3. Launchgas release holes 4. Moveable piston 5. Reactant chamber 6. Launch mechanism.
reactor dates back to 1926 and was invented by M. Brutzkus [31], who proposed it for cracking
hydrocarbons. More recent versions of that are rapid compression machines. Recently the
potential of a rapid compression machine is discussed in detail [32–34]. The PCR used in this
study is shown in Figure 2. It is a compression reactor with a free piston, which was designed
for research purposes at the University of Twente. The PCR has many similarities with a
ballistic compressor, of which the first research on methane pyrolysis was conducted in 1958 by
P.A. Longwell [35]. The difference is the ability to perform shots repeatedly after each other,
without the need for re-assembly of the set-up.
The PCR has the feature of being able to reach high temperatures of up to 1300 K as
in Figure 2 in 8 ms, reaching heating rates of 1·105 K/s, see Supporting Information for the
calculation. More importantly, it quenches the reaction products at the same rate during
expansion back to atmospheric pressure (see Figure 2), thereby stopping the reactions towards
soot. There are two energy inputs for this system, one is the pre-heating of the gas and the
other is the amount of work supplied through the launch gas. The amount of energy needed for
4
Jour
nal P
re-p
roof

1 2 3 4 5 6 7 8 9 10 11 12 13 14 15 16 17 18 19 20 21 22 23 24 25 26 27 28 29 30 31 32 33 34 35 36 37 38 39 40 41 42 43 44 45 46 47 48 49 50 51 52 53 54 55 56 57 58 59 60 61 62 63 64 65
Journal Pre-proof
methane pyrolysis in the PCR is the endothermic internal energy change of the reaction, the
friction losses and heat losses during compression. The heat losses are not quantified at this
point, so for this work it is assumed during calculations that the gas is compressed adiabatically.
We will report on the energy balance in an upcoming publication.
The piston and cylinder were machined in such a precise manner that a gap of only 10-30
µm exists between piston and stainless steel wall. This creates a sealing and causes the gas to be
the lubricant itself, replacing the need for oil. The reactor body was made out of stainless steel.
For reducing friction between materials the piston was made out of graphite (Entegris (POCO)
ACF-10Q grade) and it weighs 0.869 kg. Pre-heating of the reactor and inlet gas in order to
achieve higher compression temperatures and pressures was possible. Tests were done at initial
temperatures of 303, 423 and 523 K. The difference between the thermal expansion coefficient of
stainless steel and graphite causes the gap to become bigger at elevated temperatures, thus three
pistons were machined with different diameters. To perform a compression on a mixture the
reactant chamber (nr. 5 in Figure 2) was filled with a certain feed composition at atmospheric
pressure. Then the piston (nr. 4) was launched by releasing a fraction of a 130 ml volume of
pressurized nitrogen (nr. 6, up to 140 bar) underneath the piston. Typical launch pressures
used were between 50 and 110 bar. To make sure only a single shot is performed most of the
launch gas was released through the holes on the side (nr. 3). Release holes in the bottom part
(not shown) damp the next bounce of the piston. The position of the piston (either piston is
seen or not seen) was measured by a Keyence FS-V31M laser (nr. 2) to determine the time
at which the piston first moves. The pressure was measured in the top (nr. 1) by an Optrand
D732A8 pressure sensor using a sampling frequency of 150 kHz. The compositions of the
mixture were measured before and after a shot using a Varian-450 gas chromatograph (GC).
This GC is able to measure a range of permanent gases and identify separate hydrocarbons up
to C5. Everything from C6 to C8 cannot be separately identified and is therefore grouped under
the name C6-C8. Solid carbonaceous deposits were observed inside the reactor and condensed
tar was found in the gas samples. The sum of carbonaceous deposits and the tar is termed soot
and/or carbon balance, the amount of which is quantified by calculation. The conversion and
selectivities are on carbon basis. The absolute error margin on the conversion is 1.4%, on the
C2 selectivity it is 2.0% and on the C2 yield it is 0.53%. The complete experimental procedure
5
Jour
nal P
re-p
roof

1 2 3 4 5 6 7 8 9 10 11 12 13 14 15 16 17 18 19 20 21 22 23 24 25 26 27 28 29 30 31 32 33 34 35 36 37 38 39 40 41 42 43 44 45 46 47 48 49 50 51 52 53 54 55 56 57 58 59 60 61 62 63 64 65
Journal Pre-proof
and calculations can be found in the Supporting Information.
The maximum point which the piston reaches is called the top dead center (TDC), which
is variable for each shot. The TDC temperature was not measured, however it was calculated
according to adiabatic compression relations [36] and a reactor model using real gas approxi-
mations from the GERG-2008 equation of state [37]. In this calculation the heat of reaction
was neglected, because of the uncertainty of the soot composition. It was estimated that by
inclusion of the heat of reaction the temperature would be 0-200 K lower in the range between
0 and 78 % conversion (see Supporting information). The fast expansion after reaching TDC
causes the reaction time to be as short as <100 µs (see graph in Figure 2). The achievable TDC
temperature depends on the isentropic exponent of the mixture. As an example: compressing
a gas from atmospheric pressure to 100 bar starting at 523 K results in a TDC temperature
of 3370 K for pure argon, of 1220 K for pure nitrogen and of 1310 K for 10% (molar basis)
methane in argon.
1000 1200 1400 16000
10
20
30
40
50
60
70
80
90
100
Calculated temperature at TDC (K)
Sel
ecti
vit
yor
Con
vers
ion
(%)
Overall
ConversionC2
C3-C4 olefinsC6-C8
C balance
1000 1200 1400 16000
5
10
15
20
25
30
35
40
45
50
Calculated temperature at TDC (K)
Sel
ecti
vit
y(%
)
Individual components
EthaneEthyleneAcetylenePropylene
Figure 3: Single shot results of 8% of methane in argon at an initial reactor temperature of 523 K. Conversionand selectivies are plotted. Lines are for guidance purposes only. A similar graph was obtained for the series innitrogen, as displayed in the Supporting Information.
6
Jour
nal P
re-p
roof
feed
1 2 3 4 5 6 7 8 9 10 11 12 13 14 15 16 17 18 19 20 21 22 23 24 25 26 27 28 29 30 31 32 33 34 35 36 37 38 39 40 41 42 43 44 45 46 47 48 49 50 51 52 53 54 55 56 57 58 59 60 61 62 63 64 65
Journal Pre-proof
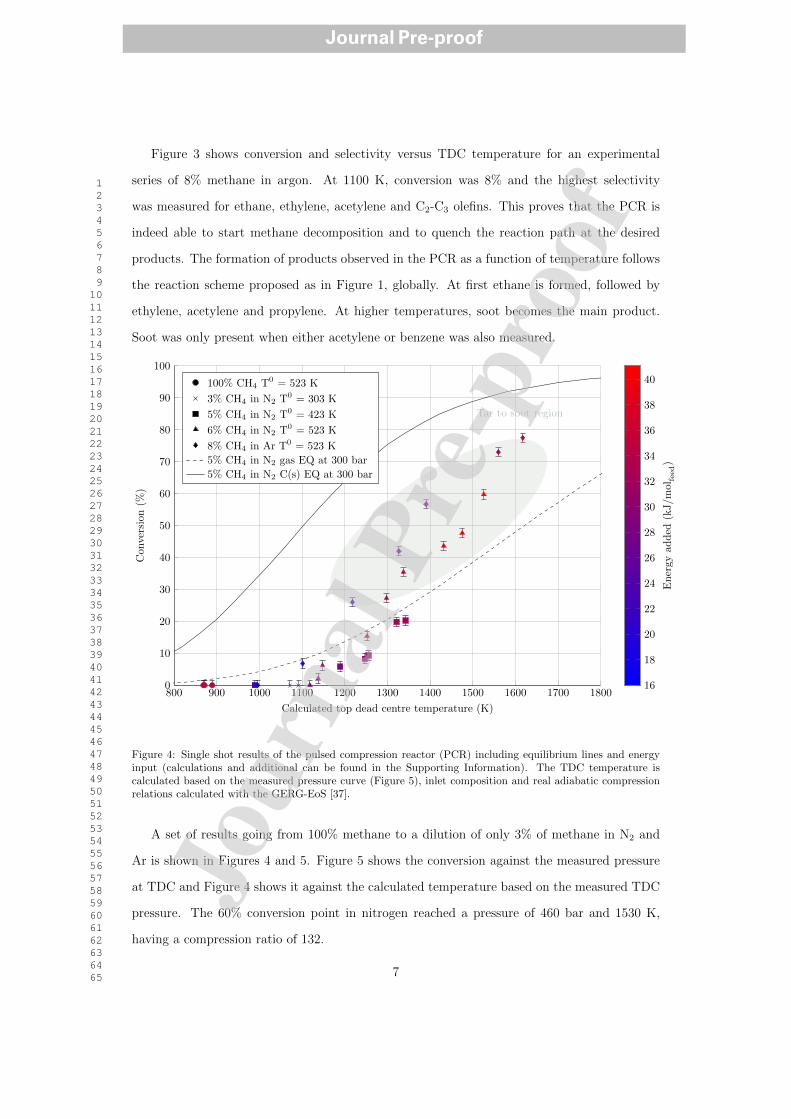
Figure 3 shows conversion and selectivity versus TDC temperature for an experimental
series of 8% methane in argon. At 1100 K, conversion was 8% and the highest selectivity
was measured for ethane, ethylene, acetylene and C2-C3 olefins. This proves that the PCR is
indeed able to start methane decomposition and to quench the reaction path at the desired
products. The formation of products observed in the PCR as a function of temperature follows
the reaction scheme proposed as in Figure 1, globally. At first ethane is formed, followed by
ethylene, acetylene and propylene. At higher temperatures, soot becomes the main product.
Soot was only present when either acetylene or benzene was also measured.
800 900 1000 1100 1200 1300 1400 1500 1600 1700 18000
10
20
30
40
50
60
70
80
90
100
Tar to soot region
Calculated top dead centre temperature (K)
Con
vers
ion
(%)
100% CH4 T0 = 523 K
3% CH4 in N2 T0 = 303 K
5% CH4 in N2 T0 = 423 K
6% CH4 in N2 T0 = 523 K
8% CH4 in Ar T0 = 523 K
5% CH4 in N2 gas EQ at 300 bar
5% CH4 in N2 C(s) EQ at 300 bar
16
18
20
22
24
26
28
30
32
34
36
38
40
Ener
gy
added
(kJ/m
ol
)
Figure 4: Single shot results of the pulsed compression reactor (PCR) including equilibrium lines and energyinput (calculations and additional can be found in the Supporting Information). The TDC temperature iscalculated based on the measured pressure curve (Figure 5), inlet composition and real adiabatic compressionrelations calculated with the GERG-EoS [37].
A set of results going from 100% methane to a dilution of only 3% of methane in N2 and
Ar is shown in Figures 4 and 5. Figure 5 shows the conversion against the measured pressure
at TDC and Figure 4 shows it against the calculated temperature based on the measured TDC
pressure. The 60% conversion point in nitrogen reached a pressure of 460 bar and 1530 K,
having a compression ratio of 132.
7
Jour
nal P
re-p
roof

1 2 3 4 5 6 7 8 9 10 11 12 13 14 15 16 17 18 19 20 21 22 23 24 25 26 27 28 29 30 31 32 33 34 35 36 37 38 39 40 41 42 43 44 45 46 47 48 49 50 51 52 53 54 55 56 57 58 59 60 61 62 63 64 65
Journal Pre-proof
0 50 100 150 200 250 300 350 400 450 5000
10
20
30
40
50
60
70
80
Tavg = 1570 K
Tavg = 1432 K
Tavg = 1325 K
Tavg = 1232 K
Tavg = 1129 K
Measured top dead centre pressure (bar)
Conve
rsio
n(%
)
20
25
30
35
40
Ener
gy
added
(kJ/m
ol feed)
Figure 5: Single shot results of the pulsed compression reactor (PCR). The shown isotherms are average valuesof the points adjacent to the lines. The same legend of Figure 4 applies here. The isotherms do not apply forexperimental points with zero conversion.
In Figure 4 two equilibrium (EQ) lines are plotted (see Supporting Information for cal-
culations): one giving the conversion versus temperature when assuming that only gaseous
compounds are present (gas EQ line in Figure 4), the other assuming that gases are in equilib-
rium with solid carbon (C(s) EQ line in Figure 4). These calculations show that there is also
a thermodynamic limit to the conversion of methane. When a measurement was positioned in
the region between the predicted equilibrium lines with and without solid carbon, the prod-
uct slate contained intermediate products like polycyclic aromatic hydrocarbons and/or soot.
For an industrial process it is favourable to stay away from tar/soot production. In that case
chemical equilibrium will dictate low single pass conversion, e.g. 20% for 5% CH4 in nitrogen
at 1300 K (see Figure 4).
It is confirmed that the determining factor for the reaction to start is temperature, or in
other words the collision of molecules instead of a unimolecular dissociation. The threshold lies
8
Jour
nal P
re-p
roof

1 2 3 4 5 6 7 8 9 10 11 12 13 14 15 16 17 18 19 20 21 22 23 24 25 26 27 28 29 30 31 32 33 34 35 36 37 38 39 40 41 42 43 44 45 46 47 48 49 50 51 52 53 54 55 56 57 58 59 60 61 62 63 64 65
Journal Pre-proof
between 1100 and 1150 K, only if this temperature or higher is achieved the reactions start.
Energy input is not the determining factor. This is most supported by the 100% methane shots
where high amounts of energy were put in, but no conversion was observed. While the total
energy input was amongst the highest, 900 K is by far too low to start the reaction. The same
conclusion can be drawn from experiments at similar energy input around 25 kJ mol−1 of feed
gas. When this amount of energy was added to 8% CH4 in argon a conversion of 26% was
observed. Adding the same amount of energy to 6% CH4 in N2 resulted in no conversion at
all. The energy input to the whole feed is defined as the sum of the heating of the gas from
298K to the initial reactor temperature and the amount of work that was put in, which can be
calculated by evaluating the integral of -pdV using a reactor model (for details see Supporting
Information). Note, this is not the energy needed for the process, but it is the energy put into
a single compression. In a continuous process, this energy minus the reaction heat and the
friction losses can be recovered.
For methane concentrations below 10% (volume), the compression temperature can easily
reach the required 1150 K (and above). Using nitrogen is only possible in the PCR, because
it is able to withstand and keep the high pressure of up to 460 bar that is present at the
TDC. A conventional (diesel) combustion engine can reach pressures up to 150 and 180 bar
at frequencies between 8 to 35 Hz [38]. Possibly these engines can go higher, but the PCR
design at this point already grants the possibility to replace the expensive argon that is used in
compression research [32, 33, 39, 40]. A disadvantage of introducing nitrogen is the possibility
of the formation of nitrated species. The most unwanted one is hydrogen cyanide. According
to equilibrium calculations (See Supporting Information) around 1500 K an amount of 0.2 vol%
could be present in the product mixture. However, the likelihood of nitrogen bonds breaking
at these temperatures is low, as nitrogen bonds are very strong. This will be investigated and
reported on in further publications.
The effect of pressure on the conversion at the same temperature is shown with the isotherms
in Figure 5. Around the TDC temperature of 1325 K the pressure is lower in argon and higher
in nitrogen mixtures. Starting from an initial reactor temperature of 423 K results in an
even higher pressure in order to obtain the same temperature. This high pressure of 460 bar
compared to the 80 bar in argon reduces the conversion by a factor 2. The effect of pressure is
9
Jour
nal P
re-p
roof

1 2 3 4 5 6 7 8 9 10 11 12 13 14 15 16 17 18 19 20 21 22 23 24 25 26 27 28 29 30 31 32 33 34 35 36 37 38 39 40 41 42 43 44 45 46 47 48 49 50 51 52 53 54 55 56 57 58 59 60 61 62 63 64 65
Journal Pre-proof
quite significant, but the temperature remains the most important factor. The temperature and
pressure are strongly linked. Therefore, inevitably the conversion is limited more in nitrogen
mixtures. However, a higher conversion results in a lower selectivity, so the high conversion
region is not the preferred operating window. This is shown in the left graph of Figure 6,
which shows the C2 selectivity (ethane, ethylene and acetylene) plotted against the conversion.
Experimental results from this work are compared to OCM [3] and NCM [3, 21, 22].
0 20 40 60 80 1000
10
20
30
40
50
60
70
80
90
100
10% yield
40%
30%
20%
50%
Conversion of methane (%)
C2
sele
ctiv
ity
(%)
5% CH4 + N2 experiments this work
8% CH4 + argon experiments this work
5% CH4 + 15% H2 + N2 experiments this work
5% CH4 + 25% H2 + Ar experiments this work
Oxidative coupling of methane (OCM) [3]
Non-oxidative coupling of methane (NCM) [21, 22, 41]
0 20 40 60 80 1000
10
20
30
40
50
60
70
80
90
100
10% yield
40%
30%
20%
50%
Conversion of methane (%)
Eth
yle
ne
+ace
tyle
ne
sele
ctiv
ity
(%)
100
200
300
400
500
600
700
800
900
1,000
Tem
per
ature
(◦C
)
Figure 6: Comparison of pulsed compression versus OCM [3] and NCM [21, 22, 41]. Adapted and partlyreproduced from Gao et al. [3]. C2 selectivity includes ethane, ethylene and acetylene.
The OCM data obtained in the temperature range between 873 and 1073 K follow nearly
the same C2-selectivity-conversion path as the PCR at 423-523 K. The difference is the fact
that CO2 and CO are the remainder of the balance, instead of the soot in the PCR. At high
10
Jour
nal P
re-p
roof

1 2 3 4 5 6 7 8 9 10 11 12 13 14 15 16 17 18 19 20 21 22 23 24 25 26 27 28 29 30 31 32 33 34 35 36 37 38 39 40 41 42 43 44 45 46 47 48 49 50 51 52 53 54 55 56 57 58 59 60 61 62 63 64 65
Journal Pre-proof
temperatures (>1073 K) combined with the use of a selective catalyst OCM is able to achieve
C2 yields above 20%. Although many of these catalysts still suffer from thermal stability issues
[14].
The right graph of Figure 6 shows that the selectivity and yield towards the unsaturated
C2 components ethylene and acetylene is comparable for OCM, NCM and pulsed compression.
The absence of a catalyst in the PCR seems to have no significant effect on selectivities. The
main difference is observed in a lower ethane production compared to OCM. Catalytic NCM
has similar selectivities, though the challenge still lies in maintaining the activity by preventing
coke formation [4, 17].
The most interesting experiments from this work are the ones containing hydrogen, as
displayed in Figure 6. In a continuous process hydrogen does not have to be added externally,
as it is a reaction product. The best shot with 5% CH4, 15% H2 and 80% nitrogen reached
a conversion of methane of 19% with a selectivity to ethylene of 63% and a C2 selectivity of
95%. The remainder of the selectivities are 20% ethane, 11% acetylene, 3% of propylene and
3% of C6-C8. It is considered that hydrogen suppresses the initial methyl radical formation
and as a result leading to less ethylene consumption and less soot formation [17, 42, 43]. The
combination of the hydrogen addition with the high quenching rate of the PCR results in an
interesting operating window with high C2 selectivities and no soot at a conversion above 15%.
This is not necessarily the case, since only adding hydrogen is not sufficient for fully reducing
soot formation in this conversion region [23, 44].
Experiments in argon (Figure 6 and more detail in Supporting Information) show that con-
version can still be increased while maintaining similar C2 and ethylene + acetylene selectivities,
without the formation of soot. The addition of hydrogen is a variable that can steer towards
high selectivity with minimal to no soot formation. More research towards the optimal ratio
between hydrogen and carbon can provide a viable operating window for pulsed compression.
The wall effects are difficult to quantify, but the conversion over a large time span stays constant
(see Supporting Information). The reactor cap is made out of stainless steel and after initial
shots it is covered with soot. This soot covered situation was the case for all the experiments
presented in this paper and over the course of three months of experimenting the reactor cap
was never cleaned. In a continuous situation a layer of soot will be quickly formed, thus our
11
Jour
nal P
re-p
roof

1 2 3 4 5 6 7 8 9 10 11 12 13 14 15 16 17 18 19 20 21 22 23 24 25 26 27 28 29 30 31 32 33 34 35 36 37 38 39 40 41 42 43 44 45 46 47 48 49 50 51 52 53 54 55 56 57 58 59 60 61 62 63 64 65
Journal Pre-proof
results are representative of that situation. The effect of the soot on the gas phase reactions is
difficult to quantify, but based on the measurements discussed in the previous paragraph it is
possible to operate without producing additional tar or soot.
A disadvantage of compression is that a high dilution is needed, but at a potential piston
reciprocation frequency of 62 Hz and 60% scavenging efficiency (40% of product mixture remains
in the reactor chamber) the PCR with the current reactor volume of 0.452·10−3 m3 with the
best shot in nitrogen described previously could theoretically produce 2.7 mol/m3reactor/s of
ethylene plus acetylene (268 kg/m3reactor/h). This is a promising starting point considering that
the industrial range lies between 1 and 15 mol/m3reactor/s [45]. Alternatives techniques like OCM
produce 0.5 mol/m3reactor/s of C2 [46] and plasma reaches 2.1 mol/m3
reactor/s of C2 species [13].
Research on higher methane feed concentrations is ongoing. A major advantage of compression
is the absence of a catalyst and the low operating temperature.
Concluding, pulsed compression in the pulsed compression reactor (PCR) has opened up a
new possibility for converting methane under non-oxidative and non-catalytic conditions into
ethylene with promising conversion and selectivity, worthwhile exploring further.
1. Acknowledgements
We thank Benno Knaken, Johan Agterhorst and Ronald Borst for their skilled support
in getting this set-up operational. We also thank Erna Franzel-Luiten for her support with
the analysis. The machining companies Ten Heggeler and Vossebelt are acknowledged for their
precision skills that make the PCR work. Furthermore we thank the project partners ISPT, Dow
Benelux B.V. and Shell Global Solutions International B.V. for their support and contribution.
This work has received co-funding with subsidy from the Topsector Energy by the Ministry of
Economic Affairs and Climate Policy in the Netherlands (project number TEEI118005).
12
Jour
nal P
re-p
roof
1 2 3 4 5 6 7 8 9 10 11 12 13 14 15 16 17 18 19 20 21 22 23 24 25 26 27 28 29 30 31 32 33 34 35 36 37 38 39 40 41 42 43 44 45 46 47 48 49 50 51 52 53 54 55 56 57 58 59 60 61 62 63 64 65
Journal Pre-proof
References
[1] P. Schwach, X. Pan, X. Bao, Direct Conversion of Methane to Value-Added Chemicals over
Heterogeneous Catalysts: Challenges and Prospects, Chemical Reviews 117 (13) (2017)
8497–8520. doi:10.1021/acs.chemrev.6b00715.
[2] Y. Chen, X. Mu, X. Luo, K. Shi, G. Yang, T. Wu, Catalytic Conversion of Methane at Low
Temperatures: A Critical Review, Energy Technologydoi:10.1002/ente.201900750.
[3] Y. Gao, L. Neal, D. Ding, W. Wu, C. Baroi, A. M. Gaffney, F. Li, Recent Advances
in Intensified Ethylene Production - A Review, ACS Catalysis 9 (9) (2019) 8592–8621.
doi:10.1021/acscatal.9b02922.
[4] P. Tang, Q. Zhu, Z. Wu, D. Ma, Methane activation: the past and future, Energy Environ.
Sci. 7 (8) (2014) 2580–2591. doi:10.1039/C4EE00604F.
[5] V. Spallina, I. C. Velarde, J. A. M. Jimenez, H. R. Godini, F. Gallucci, M. Van Sint
Annaland, Techno-economic assessment of different routes for olefins production through
the oxidative coupling of methane (OCM): Advances in benchmark technologies, Energy
Conversion and Management 154 (2017) 244–261. doi:10.1016/j.enconman.2017.10.
061.
[6] Dow Benelux B.V., Personal communication (May 2020).
[7] U.S. Department of energy, Office of Oil and Natural Gas and Energy, Office of Fossil
Energy, Natural Gas Flaring and Venting: State and Federal Regulatory Overview, Trends,
and Impacts, https://www.energy.gov/sites/prod/files/2019/08/f65/Natural Gas Flaring
and Venting Report.pdf (2019).
[8] M. Ghanta, D. Fahey, B. Subramaniam, Environmental impacts of ethylene production
from diverse feedstocks and energy sources, Applied Petrochemical Research 4 (2) (2014)
167–179. doi:10.1007/s13203-013-0029-7.
[9] Market Research Future: Industry Analysis Report, Business Consulting and Research-
Https://www.marketresearchfuture.com/ accessed at 08-05-2020.
13
Jour
nal P
re-p
roof

1 2 3 4 5 6 7 8 9 10 11 12 13 14 15 16 17 18 19 20 21 22 23 24 25 26 27 28 29 30 31 32 33 34 35 36 37 38 39 40 41 42 43 44 45 46 47 48 49 50 51 52 53 54 55 56 57 58 59 60 61 62 63 64 65
Journal Pre-proof
[10] Y. Gambo, A. A. Jalil, S. Triwahyono, A. A. Abdulrasheed, Recent advances and future
prospect in catalysts for oxidative coupling of methane to ethylene: A review, Journal of
Industrial and Engineering Chemistry 59 (2018) 218–229. doi:10.1016/j.jiec.2017.
10.027.
[11] B. Wang, S. Albarracın-Suazo, Y. Pagan-Torres, E. Nikolla, Advances in methane conver-
sion processes, Catalysis Today 285 (2017) 147–158. doi:10.1016/j.cattod.2017.01.
023.
[12] M. Scapinello, E. Delikonstantis, G. D. Stefanidis, The panorama of plasma-assisted non-
oxidative methane reforming (jul 2017). doi:10.1016/j.cep.2017.03.024.
[13] E. Delikonstantis, M. Scapinello, G. D. Stefanidis, Low energy cost conversion of methane
to ethylene in a hybrid plasma-catalytic reactor system, Fuel Processing Technology 176
(2018) 33–42. doi:10.1016/j.fuproc.2018.03.011.
[14] A. Galadima, O. Muraza, Revisiting the oxidative coupling of methane to ethylene in the
golden period of shale gas: A review (may 2016). doi:10.1016/j.jiec.2016.03.027.
[15] L. Fan, Chemical Looping Partial Oxidation: Gasification, Reforming, and Chemical Syn-
theses, Cambridge Series in Chemical Engineering, Cambridge University Press, 2017.
[16] A. Penteado, E. Esche, D. Salerno, H. R. Godini, G. Wozny, Design and Assessment of a
Membrane and Absorption Based Carbon Dioxide Removal Process for Oxidative Coupling
of Methane, Industrial and Engineering Chemistry Research 55 (27) (2016) 7473–7483.
doi:10.1021/acs.iecr.5b04910.
[17] T. V. Choudhary, E. Aksoylu, D. Wayne Goodman, Nonoxidative Activation of Methane,
Catalysis Reviews 45 (1) (2003) 151–203. doi:10.1081/CR-120017010.
[18] A. I. Olivos-Suarez, A. Szecsenyi, E. J. Hensen, J. Ruiz-Martinez, E. A. Pidko, J. Gascon,
Strategies for the Direct Catalytic Valorization of Methane Using Heterogeneous Catalysis:
Challenges and Opportunities, ACS Catalysis 6 (5) (2016) 2965–2981. doi:10.1021/
acscatal.6b00428.
14
Jour
nal P
re-p
roof

1 2 3 4 5 6 7 8 9 10 11 12 13 14 15 16 17 18 19 20 21 22 23 24 25 26 27 28 29 30 31 32 33 34 35 36 37 38 39 40 41 42 43 44 45 46 47 48 49 50 51 52 53 54 55 56 57 58 59 60 61 62 63 64 65
Journal Pre-proof
[19] K. Sun, D. M. Ginosar, T. He, Y. Zhang, M. Fan, R. Chen, Progress in Nonoxidative
Dehydroaromatization of Methane in the Last 6 Years, Industrial & Engineering Chemistry
Research 57 (6) (2018) 1768–1789. doi:10.1021/acs.iecr.7b04707.
[20] Y. Xiao, A. Varma, Highly Selective Nonoxidative Coupling of Methane over Pt-Bi
Bimetallic Catalysts, ACS Catalysis 8 (4) (2018) 2735–2740. doi:10.1021/acscatal.
8b00156.
[21] A. L. Dipu, S. Ohbuchi, Y. Nishikawa, S. Iguchi, H. Ogihara, I. Yamanaka, Direct Nonox-
idative Conversion of Methane to Higher Hydrocarbons over Silica-Supported Nickel Phos-
phide Catalyst, ACS Catalysis 10 (1) (2020) 375–379. doi:10.1021/acscatal.9b03955.
[22] X. Guo, G. Fang, G. Li, H. Ma, H. Fan, L. Yu, C. Ma, X. Wu, D. Deng, M. Wei, D. Tan,
R. Si, S. Zhang, J. Li, L. Sun, Z. Tang, X. Pan, X. Bao, Direct, nonoxidative conversion
of methane to ethylene, aromatics, and hydrogen, Science 344 (6184) (2014) 616–619.
doi:10.1126/science.1253150.
[23] L. Albright, Novel Production Methods for Ethylene, Light Hydrocarbons, and Aromatics,
Chemical Industries, Taylor & Francis, 1991.
[24] C.-J. Chen, M. H. Back, R. A. Back, Mechanism of the Thermal Decomposition of Methane
(1976) 1–16doi:10.1021/bk-1976-0032.ch001.
[25] M. Frenklach, H. Wang, Detailed modeling of soot particle nucleation and growth,
Symposium (International) on Combustion 23 (1) (1991) 1559–1566. doi:10.1016/
S0082-0784(06)80426-1.
[26] W. Sun, A. Hamadi, S. Abid, N. Chaumeix, A. Comandini, An experimental and ki-
netic modeling study of phenylacetylene decomposition and the reactions with acety-
lene/ethylene under shock tube pyrolysis conditions, Combustion and Flame 220 (2020)
257–271. doi:10.1016/j.combustflame.2020.06.044.
[27] W. Sun, A. Hamadi, S. Abid, N. Chaumeix, A. Comandini, Probing PAH formation chem-
ical kinetics from benzene and toluene pyrolysis in a single-pulse shock tube, Proceedings
of the Combustion Institutedoi:10.1016/j.proci.2020.06.077.
15
Jour
nal P
re-p
roof
1 2 3 4 5 6 7 8 9 10 11 12 13 14 15 16 17 18 19 20 21 22 23 24 25 26 27 28 29 30 31 32 33 34 35 36 37 38 39 40 41 42 43 44 45 46 47 48 49 50 51 52 53 54 55 56 57 58 59 60 61 62 63 64 65
Journal Pre-proof
[28] Y. Kolbanovskij, V. Shchipachev, N. Chernyak, A. Chernyshova, A. Grigoriev, Impulsnoe
sgatie gasov v chimii i technologii (Pulsed compression of gases in chemistry and technol-
ogy), Moskow, Nauka, 1982.
[29] T. Roestenberg, M. Glushenkov, A. Kronberg, H. Krediet, T. vd Meer, Heat transfer
study of the pulsed compression reactor, Chemical Engineering Science 65 (1) (2010) 88–
91. doi:10.1016/J.CES.2009.01.057.
[30] T. Roestenberg, M. Glushenkov, A. Kronberg, A. Verbeek, T. vd Meer, Experimental study
and simulation of syngas generation from methane in the Pulsed Compression Reactor, Fuel
90 (5) (2011) 1875–1883. doi:10.1016/J.FUEL.2010.11.002.
[31] B. Marcus, Apparatus for chemical production research, US patent 1,586,508 (1926).
[32] B. Atakan, Compression–Expansion Processes for Chemical Energy Storage: Thermody-
namic Optimization for Methane, Ethane and Hydrogen, Energies 12 (17) (2019) 3332.
doi:10.3390/en12173332.
[33] B. Atakan, S. A. Kaiser, J. Herzler, S. Porras, K. Banke, O. Deutschmann, T. Kasper,
M. Fikri, R. Schießl, D. Schroder, C. Rudolph, D. Kaczmarek, H. Gossler, S. Drost,
V. Bykov, U. Maas, C. Schulz, Flexible energy conversion and storage via high-temperature
gas-phase reactions: The piston engine as a polygeneration reactor, Renewable and Sus-
tainable Energy Reviews 133 (2020) 110264. doi:10.1016/j.rser.2020.110264.
[34] C. Rudolph, B. Atakan, Investigation of natural gas/hydrogen mixtures for exergy storage
in a piston engine, Energy 218 (2020) 119375. doi:10.1016/j.energy.2020.119375.
[35] P. Longwell, Chemical reaction of methane and of n-hexane in ballistic piston apparatus,
Ph.D. thesis, California Institute of Technology (1957).
[36] D. A. Kouremenos, X. K. Kakatsios, The three isentropic exponents of dry steam,
Forschung im Ingenieurwesen 51 (4) (1985) 117–122. doi:10.1007/BF02558416.
[37] O. Kunz, W. Wagner, The GERG-2008 Wide-Range Equation of State for Natural Gases
and Other Mixtures: An Expansion of GERG-2004, Journal of Chemical & Engineering
Data 57 (11) (2012) 3032–3091. doi:10.1021/je300655b.
16
Jour
nal P
re-p
roof

1 2 3 4 5 6 7 8 9 10 11 12 13 14 15 16 17 18 19 20 21 22 23 24 25 26 27 28 29 30 31 32 33 34 35 36 37 38 39 40 41 42 43 44 45 46 47 48 49 50 51 52 53 54 55 56 57 58 59 60 61 62 63 64 65
Journal Pre-proof
[38] I. Bilousov, M. Bulgakov, V. Savchuk, Modern Marine Internal Combustion Engines, 8th
Edition, 2020. doi:10.1007/978-3-030-49749-1.
[39] M. G. Matturro, H. W. Deckman, F. Hershkowitz, A. M. Dean, Rapid thermal pyrolysis
of gaseous feeds containing hydrocarbon molecules mixed with an inert working gas, US
patent 5,162,599 (1992).
[40] Y. Hidaka, K. Sato, Y. Henmi, H. Tanaka, K. Inami, Shock-tube and modeling study of
methane pyrolysis and oxidation, Combustion and Flame 118 (3) (1999) 340–358. doi:
10.1016/S0010-2180(99)00010-3.
[41] M. Sakbodin, Y. Wu, S. C. Oh, E. D. Wachsman, D. Liu, Hydrogen-Permeable Tubular
Membrane Reactor: Promoting Conversion and Product Selectivity for Non-Oxidative
Activation of Methane over an FeSiO2 Catalyst, Angewandte Chemie International Edition
55 (52) (2016) 16149–16152. doi:10.1002/anie.201609991.
[42] O. Rokstad, O. Olsvik, A. Holmen, Thermal Coupling of Methane, Studies in Surface
Science and Catalysis 61 (4) (1991) 533–539. doi:10.1016/S0167-2991(08)60120-2.
[43] H. Drost, H. D. Klotz, G. Schulz, H. J. Spangenberg, The influence of hydrogen on the
kinetics of plasmapyrolytic methane conversion, Plasma Chemistry and Plasma Processing
5 (1) (1985) 55–65. doi:10.1007/BF00567909.
[44] F. G. Billaud, F. Baronnet, C. P. Gueret, Thermal Coupling of Methane in a Tubular Flow
Reactor: Parametric Study, Industrial and Engineering Chemistry Research 32 (8) (1993)
1549–1554. doi:10.1021/ie00020a003.
[45] J. Moulijn, M. Makkee, A. van Diepen, Chemical Process Technology, Wiley, 2013.
[46] J. Wu, H. Zhang, S. Qin, C. Hu, La-promoted Na2WO4/Mn/SiO2 catalysts for the oxidative
conversion of methane simultaneously to ethylene and carbon monoxide, Applied Catalysis
A: General 323 (2007) 126–134. doi:10.1016/j.apcata.2007.02.009.
17
Jour
nal P
re-p
roof

Declaration of Interest Statement
Journal Pre-proof
Declaration of interests
☒ The authors declare that they have no known competing financial interests or personal relationships that could have appeared to influence the work reported in this paper.
☐The authors declare the following financial interests/personal relationships which may be considered as potential competing interests:
Jour
nal P
re-p
roof


![Pulsed Nd:YAG laser induced high throughput stereospecific ... · Pulsed Nd:YAG laser induced high throughput stereospecific [2+2] cycloaddition of highly organized 1,2-bis(4-pyridyl)ethylene](https://img.pdfslide.net/doc/110x75/5f109e017e708231d449fcbd/pulsed-ndyag-laser-induced-high-throughput-stereospecific-pulsed-ndyag-laser.jpg)