Embed Size (px)
Citation preview
146
METHANOL SYNTHESIS IN A THREE PHASE REACTOR. Dr. Martin 6. Sherwin, Or. David B. - Blum.
Chem Systems, under the sponsorship of the Electr ic Power Research I n s t i t u t e , is de-
Chem Systems Inc., 275 Hudson St ree t , Hackensack, Flew Jersey 07601.
veloping what i t considers t o be both an e f f i c i e n t and re l iab le system t o manufacture methanol f o r peak shaving power generation from coal-derived synthesis gas. The reac- t ion scheme consists of a three-phase fluidized bed reactor. Synthesis gas containing CO, CO and H2 i s passed upward i n the reactor cocurrent to an i n e r t l i q u i d which serves t o bot2 f lu id ize the c a t a l y s t and absorb the exothermic heat o f react ion. The conversion level i s limited by equilibrium considerations b u t a close approach should b e obtainable by this system. realized by u t i l i z ing a cornnercially avai lable copper-based c a t a l y s t . The exothermic heat o f reaction is taken up by the l iquid as sensible heat and by vaporization. The overhead product gases are condensed t o remove the product nethano1 and water and t o re- cover any vaporized l iquid f o r recycle. heat exchanger f o r temperature control . t o the reactor or burned d i r e c t l y f o r base-load power generation.
A t 800-1000 psig and 260O-3OO0C, about 25-301 conversion should be
The main l iquid flow is circulatory through a Unreacted synthesis gas can e i t h e r be recycled
I
I
COPRODUCTION OF METIUNOL AND SNG mort COAL:
uSIHC ~~i(EnDY NOWss TPC'dJOLOGY A ROUTE TO CLEAN PRODUCTS P11ON COAL
R. M. HcGhee Transco Energy Comnnnv, Houston, Teras 77001
INTRODUCTION
Clean fuels and chemicals have been produced from coal for more than a century.
When natural gas and crude oil became readily available at low cost, coal use
decreased. In most of the developed countries, only limited research and develop-
ment efforts continued. However, where gas and o i l were not readily available and
coal was, the development has continued, and today we have three primary processes
to convert coal into a synthesis gas which can be cleaned up to remove sulphur
and other objectional impurities and which can be used as a fuel as is, upgraded
to a pipeline quality or high Btu gas or converted into other products (liquid
fuels or chemicals). The main processes in use today on a commercial scale are
the Winkler, the Koppers Totzek, and the LURGI process. These processes are
competitive, and the choice for any particular application is made on both the
quality and characteristics of the coal available and on the products desired.
Many other processes are in various stages of development--bench scale, pilot plant,
and demonstration plant--but none are in full scale commercial operation, nor have
any of them been selected for f u l l commercial scale plants that have been announced.
I am excluding all of these from "ready now" technology on the basis that no com-
panies or investors have selected any of the new processes for major new plant in-
vestments.
majority have selected the LURGI process.
high Btu gas essentially equivalent t o natural gas for augmenting the diminishing
supplies of natural gas being produced in the United States.
Of those plants announced for construction in the United States, the
These plants are designed to produce
The Winkler and Koppers Totzek processes produce a gas from coal consLsting essen-
tially of carbon monoxide and hydrogen as worthwhile and usable constituents. These
- 1 -
148
processes minimize the production of by-products such as tars, phenols, naptha,
etc.
The LURGI process, which operates a t substant ia l ly higher preseures, produces in
addition t o the carbon monoxide and hydrogen, a Substantial amount of methane and
a l so substantial quan t i t i e s o f ammonia, naptha, phenol, and tars. The amount of
methane, depending on the type of coal being used, can be as high as 33% of the
methane, CO and hydrogen produced.
The writer and h i s associates were working on and t ry ing t o develop an economic
production f a c i l i t y f o r SNG from a spec i f ic Western coal. We had decided tha t the
LURGI technology was the best fo r our par t icular conditions, coal feed and desired
product.
methane, CO and hydrogen.
stoichiometrically what is required t o produce methanol, and w e therefore decided
t o evaluate a pro jec t which would make methanol out of the carbon monoxide and
The pa r t i cu la r coal that w e were using resul ted in a 1-1-2 mol r a t i o of
We were intrigued by the CO-hydrogen r a t i o which i s
hydrogen and save the methane f o r our or ig ina l purpose, and tha t is, t he production
of SNG f o r addition t o t h e U. S. natural gas supply.
The equipment, processing steps, etc. for cleaning up the synthesis gas produced
from coal proved t o be e s sen t i a l ly the same, whether we converted the gas t o SNG
via a methanation s t ep o r whether we converted it t o methanol using exis t ing tech-
nology. We therefore developed cap i t a l and operating cos t f igures for a coproduct
plant producing SNG and methanol for comparison with our already completed SNG from
coal plant. We elected no t to make a th i rd study. and t ha t is the production of
methanol, only, from the synthesis gas produced from the coal, but studies on t h i s
subject have been made by others, and one of the papers in t h i s session covers such
a study.
the much lower thermal e f f i c i ency going from coal t o methanol would not be anphere
The reason we d i d not conduct the th i rd study was because we f e l t t ha t
- 2 -
14Q
near as economically a t t r a c t i v e as the coproduct p l a n t or the s t ra ight SNG plant.
The lower Btu eff ic iency of a methanol from coal p l a n t , between 45 and SO%, a r e
confirmed by Dr. Dennis Eastland of DaG Powergas i n h i s paper a t t h i s session.
We believe that our evaluation shows tha t there are some substant ia l advantages
f o r the coproduction of SNG and methanol and tha t a very large advantage e x i s t s
if the methanol can be sold at a premium price above fue l value as it h i s t o r i c a l l y
has sold and currently sells as a chemical, ra ther than a fuel.
, /I
'J I
This report w i l l describe the s imi la r i t i es and differences between a plant t o
produce SNG and a plant t o produce methanol and SNG.
* * * * * *
TECHNOLOGY
Exhibits 1 through 7 summarize technology, cap i ta l and operating cost
of a coal derived coproduct SNG/methyl fuel project compared t o a coal
derived SNG project alone.
It should be pointed out a t the outset tha t these s tudies do not
include capi ta l or operating costs of developing a mine.
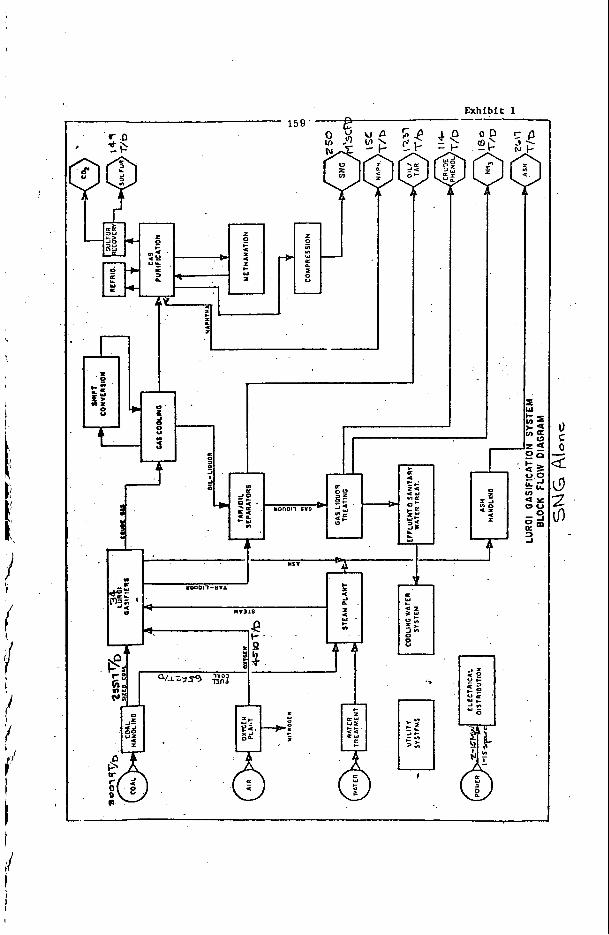
Exhibit No. 1, an abbreviated block flow diagram, depicts a simplified
flaw configuration on a LURGI technology based coal gas i f ica t ion project.
This is a typical configuration and is almost ident ica l with t h a t in t h e
Wesco coal gasif icat ion f i l i n g and with much fundamental s imi la r i ty in the
E l Paso gasif icat ion schemes as submitted t o the Federal Power Commission
(although there a r e some differences). The point t o be made here is tha t
a l l process s t e p s are conrmercially proven.
Output i n t h i s case is a standard 250 M2SCFD of SNG a t 987 HHV with
an input of 30,079 ST/D of Buffalo, Wyoming, coal , which is the bas i s of
a study conducted for Transco by Fluor.
fuel by-products a s fuel o i l , naptha and ta rs .
There a r e some 8,100 BPD of l iquid
150 ST/D sulphur i s produced,
- 3 -
150
180 T/D ammonia and 114 T/D phenols.
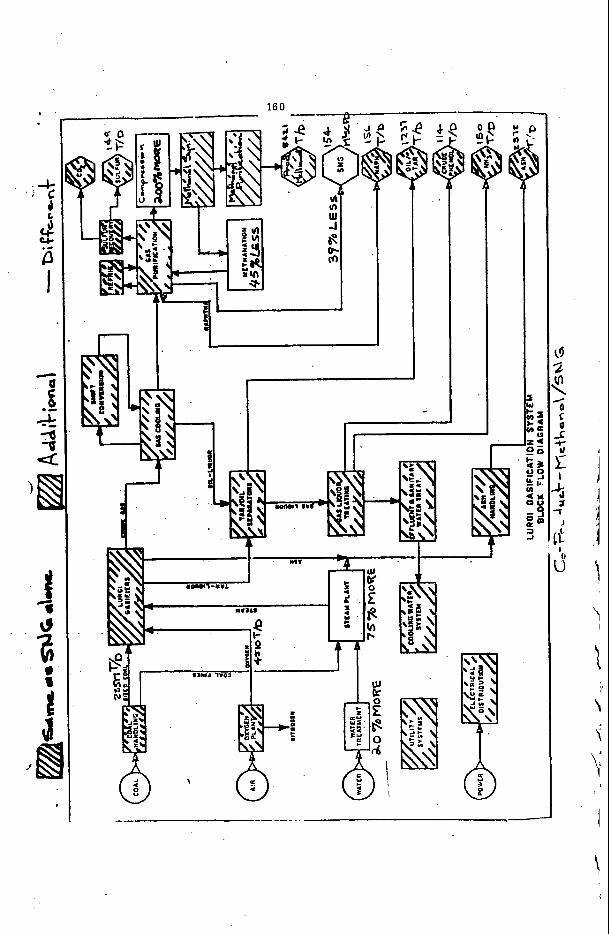
Exhibit NO. 2 shows a block flow diagram of how t h i s e x i s t i n g study
configurat ion would be modified f o r coproduction of SNG and methanol.
is t o be remembered tha t the whole coal gas i f ica t ion process would s t i l l
be based e s s e n t i a l l y on LURGI coa l gas i f ica t ion technology.
I t
In t h i s e x h i b i t , the red c ross hatching ind ica tes i d e n t i c a l ba t te ry .
l i m i t s u n i t s ( i n s i d e the gas i f ica t ion complex) compared t o SNG only.
green ind ica tes u n i t s and systems tha t would change i n size--mare o r less .
The blue c ross hatching would be u n i t s tha t are net addi t ions needed t o
r e a l i z e the f u e l coproducts.
The
fie methanol s p t h e s i s technology f o r t h i s report has been evaluated
from Information received from Imperial Chemical Indus t r ies , Ltd. (ICI),
who are l icensors of a'methanol process.
f o r the methanol y i e l d data.
I C 1 has reviewed the Transco concepti
I Gross coal input for the coproduct mode is 33,185 STID, some 10% more
than the s t r a i g h t SNG mode.
remain the same f o r e i t h e r mode, but the increased quant i ty of coa l i n
the coproduct mode is required for the increased &team dad power require-
ments.
The quant i ty of gas i f ica t ion feedstock would
A 1 1 o ther by-products such as t h e l iqu id fue ls , sulphur, armnonia and
. phenols, would be produced i n ekact ly t h e same quant i ty as i n the SNG
alone mode.
- 4 -
I
i
I
1 i 1/' L I
J
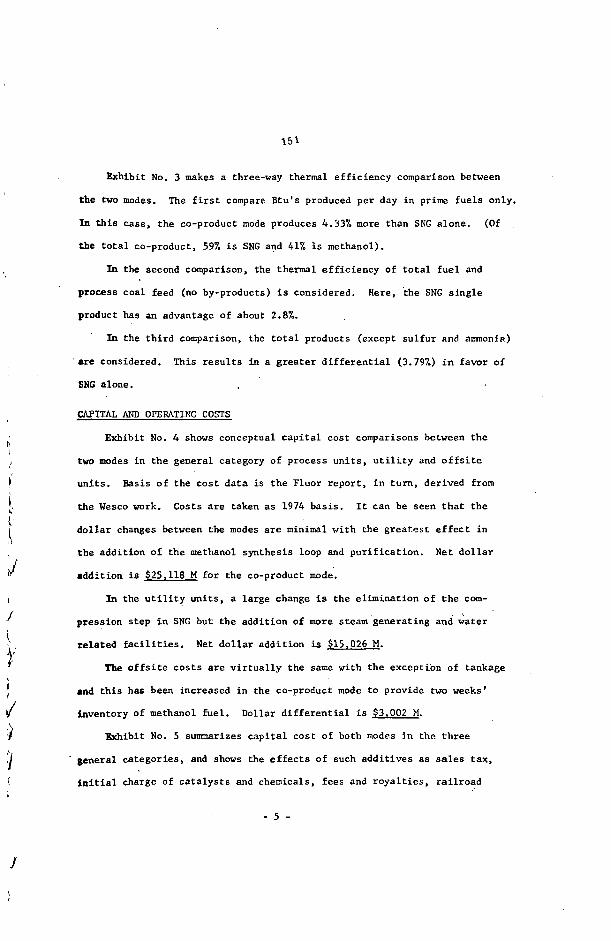
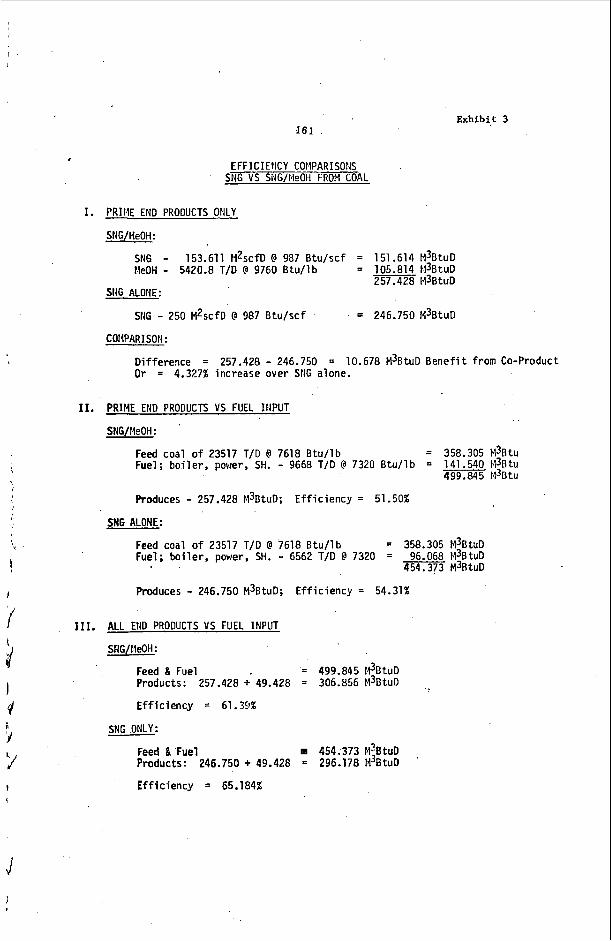
Exhibit No. 3 makes a three-way thermal efficiency comparison between
the two modes.
In this case, the co-product mode produces 4.33% more than SNG alone.
the total co-product, 59% is SNG and 41% is methanol).
The first compare Btu's produced per day in prime fuels only.
(Of
In the second comparison, the thermal efficiency of total fuel and
process coal feed (no by-products) is considered. Here, 'the SNG single
product has an advantage of about 2.8%.
In the third comparison, the total products (except sulfur and ammonia)
are considered. This results in a greater differential (3.79%) in favor of
SNG alone.
CAPITAL AND OPERATIFX COSTS
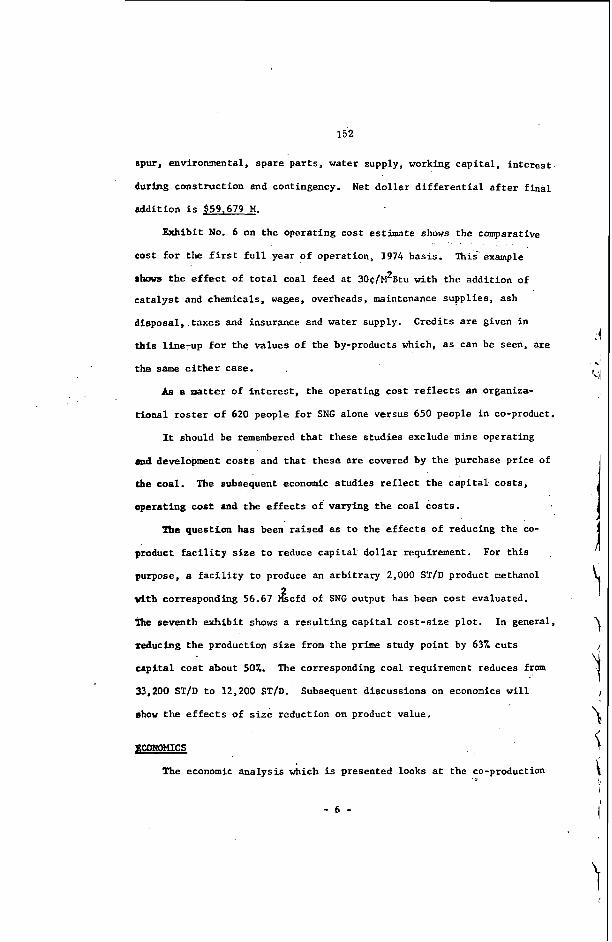
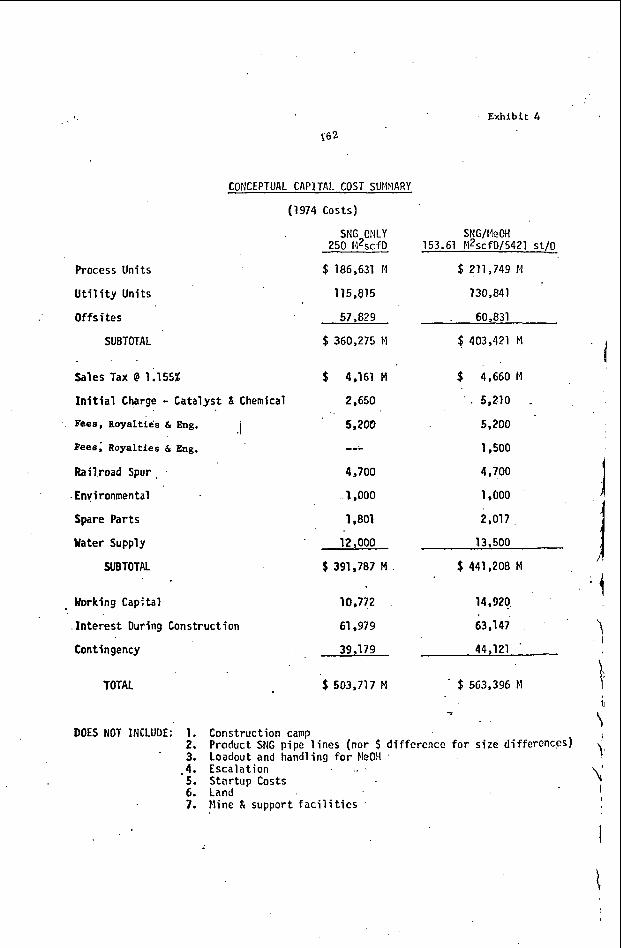
Exhibit No. 4 shows conceptual capital cost comparisons between the
two modes in the general category of process units, utility and offsite
units. Basis of the cost data is the Fluor report, in turn, derived from
the Wesco work. Costs are taken as 1974 basis. It can be seen that the
dollar changes between the modes are minimal with the greatest effect in
the addition of the methanol synthesis loop and purification. Net dollar
addition is 325.118 M for the co-product mode.
In the utility units, a large change is the elimination of the com-
pression step in SNG but the addition of more steam generating and water
related facilities. Net dollar addition is 315,026 M.
The offsite costs are virtually the same with the exception of tankage
and this has been increased in the co-product mode to provide two weeks'
inventory of methanol fuel. Dollar differential is 93,002 M.
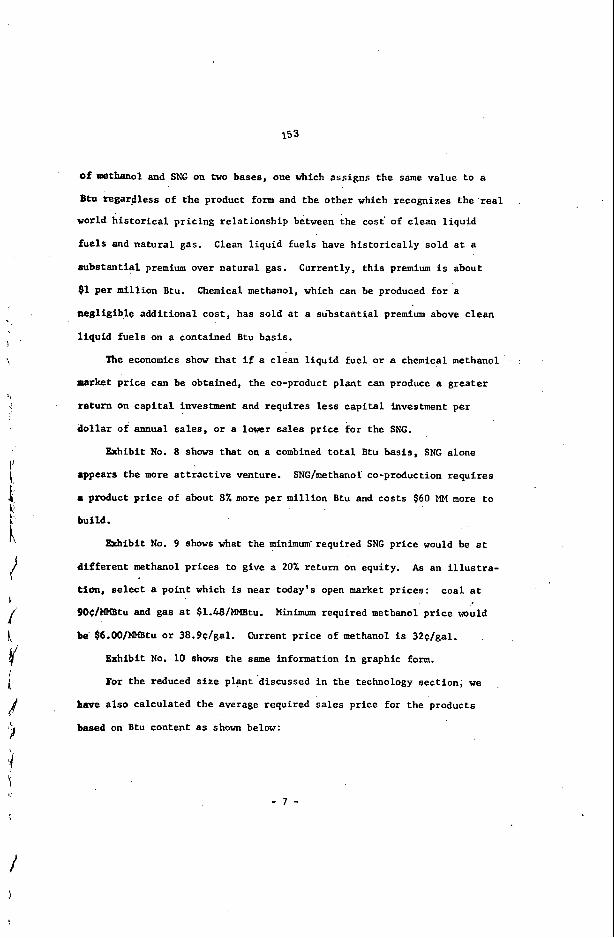
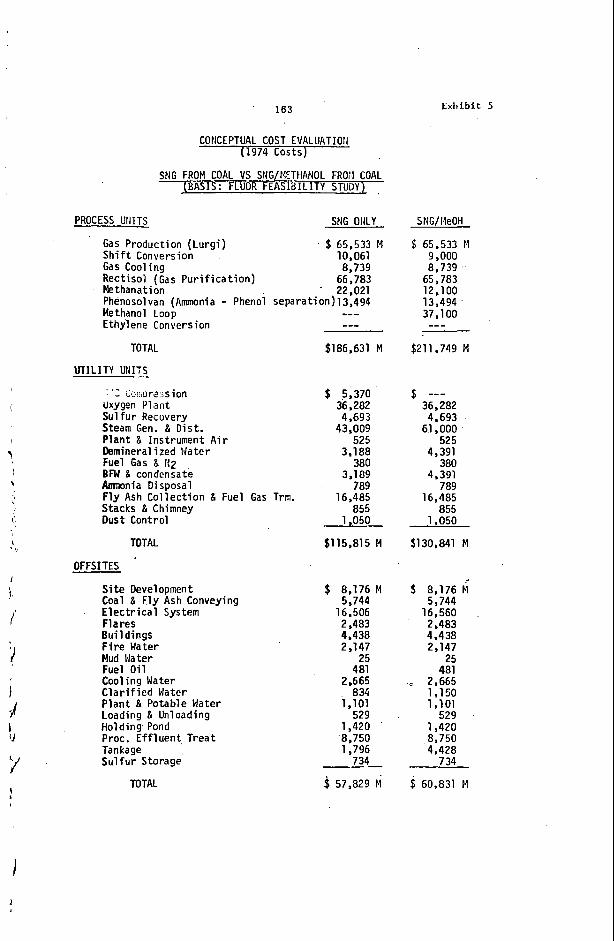
Exhibit No. 5 summarizes capital cost of both modes In thc three
general categories, and shows the effects of such additives as sales tax,
initial charge of catalysts and chemicals, fees and royalties, railroad
- 5 -
152
Epur, environmental, spare par t s , water supply, working capi ta l , i n t e r e s t .
during construct ion and contingency.
addi t ion i s 359,679 M.
Net d o l l a r d i f f e r e n t i a l a f t e r f i n a l
Exhibi t No. 6 on the operating cost estimate shows the comparative
cost f o r the f irst f u l l year of operation, 1974 basis.
rhars t h e e f f e c t of t o t a l coal feed a t 30~/bl*Btu with the addi t ion of
ca ta lys t and chemicals, wages, overheads, maintenance suppl ies , ash
disposal, t axes and insurance and water supply.
this line-up f o r the values of the by-products which, a s can be seen, a r e
the same e i t h e r case.
This' example
Credi ts a r e given i n
ks a matter of i n t e r e s t , the operating cost r e f l e c t s an organiza-
t iona l r o s t e r of 620 people for SNG alone versus 650 people in co-product.
It should be remembered t h a t these s tud ies exclude mine operating
and development c o s t s and that these a r e covered by the purchase price of
the coal. The subsequent economic s tudies r e f l e c t the c a p i t a l costs ,
operating cost and the e f f e c t s of varying t h e coal cos ts .
The question has been raised as t o the e f f e c t s of reducing the co-
product f a c i l i t y s i z e t o reduce c a p i t a l do l la r requirement.
purpose, a f a c i l i t y to produce an a r b i t r a r y 2,000 ST/D product methanol
with corresponding 56.67 Mscfd of SNG output has been cost evaluated.
The seventh exhib i t shows a r e s u l t i n g c a p i t a l cost-s ize p lo t .
reducing the production s i z e from t h e prime study point by 63% c u t s
For t h i s
2
In general,
c a p i t a l cos t about 50%.
33,200 ST/D t o 12,200 STID.
show t h e e f f e c t s of s i z e reduction on product value.
The corresponding coal requirement reduces from
Subsequent discussions on economics w i l l
~ c C m m C S
The economic a n a l y s i s which is presented looks a t the co-production -:
- 6 -
Of methanol and SKG on two bases, one which assigns t h e same value to a
Btu regardless of t h e product form and the other which recognizes the real
world h i s t o r i c a l p r ic ing re la t ionship between the cos t of clean l iqu id
.
f u e l s and na tura l gas. Clean l iqu id fue ls have h i s t o r i c a l l y sold a t a
i
\
I!
subs tan t ia l premium over na tura l gas. Currently, t h i s premium is about
$1 per mil l ion Btu.
negl igible addi t ional cost , has sold a t a su'bstantial premium above clean
l iqu id fue ls on a contained Btu basis.
Chemical methanol, which can be produced f o r a
The economics show t h a t i f a clean l iqu id fue l o r a chemical methanol
market p r i c e can be obtained, the co-product p lan t can produce a grea te r
re turn on c a p i t a l investment and requires less c a p i t a l investment per
d o l l a r of annual sa les , o r a lower sa les p r i c e f o r the SNG.
Exhibit No. 8 shows that on a combined t o t a l Btu basis , SNG alone
appears the more a t t r a c t i v e venture. SNGhthanol co-production requi res
a product p r i c e of about 8% more per mil l ion Btu and cos ts $60 MM more to
build.
Exhibit No. 9 shows what the minimmirequired SNG pr ice would be a t
d i f f e r e n t methanol pr ices to give a 20% re turn on equity.
tion, s e l e c t a point which is near today's open market pr ices:
As an i l l u s t r a -
c o a l a t
9O&MEtu and gas a t $1.48/MMBtu.
be $6.OO/>IMBtu o r 38 .9~Iga l .
Minimum required methanol pr ice would
Current p r i c e of methanol i s 3 2 ~ / g a l .
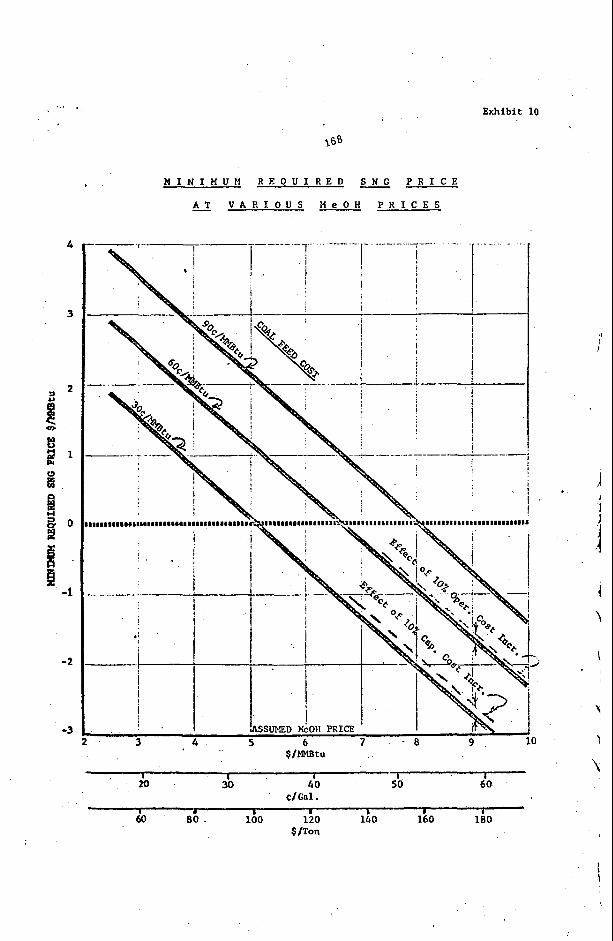
Exhibit No. 10 shows the same information i n graphic form.
For the reduced s i z e pl+t 'discussed i n the technology sect ion, we
have elso calculated the average required s a l e s pr ice for the products
based on Btu content as shown below:
- 7 -
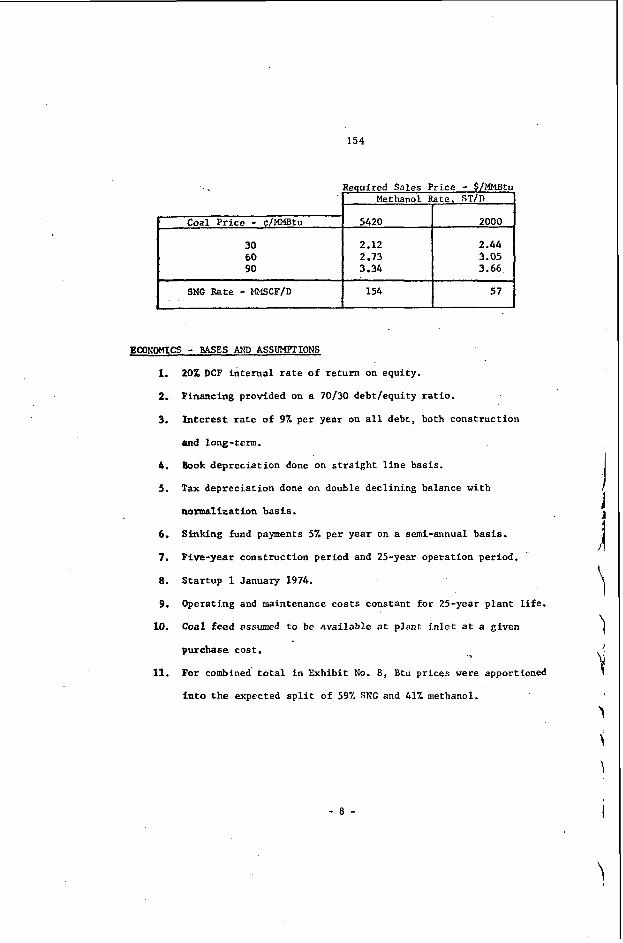
154
Required Sales Price - $/MMBtu Methanol Rate, ST/D
Coal Price - C/MMBtu 5420 2000
30 2.12 2.44 60 2.73 3.05 90 3.34 3.66
SNG Rate - MMSCF/D 154 57
ECONOMICS - BASES ANT ASSUMPTIONS
1.
2.
3.
4.
5.
6.
7.
8.
9.
10.
11.
20% DCF internal rate of return on equity.
Financing provided on a 70130 debtlequity ratio.
Interest rate of 9% per year on all debt, both construction
and long-term.
Book depreciation done on straight line basis.
Tax depreciation done on double declining balance with
normalization basis.
Sinking fund payments 5% per year on a semi-annual basis.
Five-year construction period and 25-year operation period.
Startup 1 January 1974.
Operating and maintenance costs constant for 25-year plant life.
Coal feed assumed to be available at p l a n t inlet at a given
purchase cost.
For combined total in Exhibit No. 8, Btu prices were apportioned
into the expected split of 59% SNG and 41% methanol.
.
- 8 -
155
i!
f
I I
'I
HETHANOL >lARK€T - FUEL
Gasoline s u b s t i t u t e i s t he grea tes t p o t e n t i a l market fo r fue l
grade methanol. It is so grea t t ha t t h e l a r g e s t conceivable p lan t would,
supply less than 3% of t h e market.
this market are almost insurmountable fo r t he near future, except f o r
possibly a capt ive f l e e t (i.e-, New York City t ax i s ) .
However, t h e introductory problems t o
The market that would be served f i r s t appears t o be peaking turbine
fuel. This i s t h e conclusion of government agencies, supported by G. E.
and Westinghouse confirmation t h a t methanol has 7% higher e f f ic iency and
6% more KW than f u e l s being used a t present.
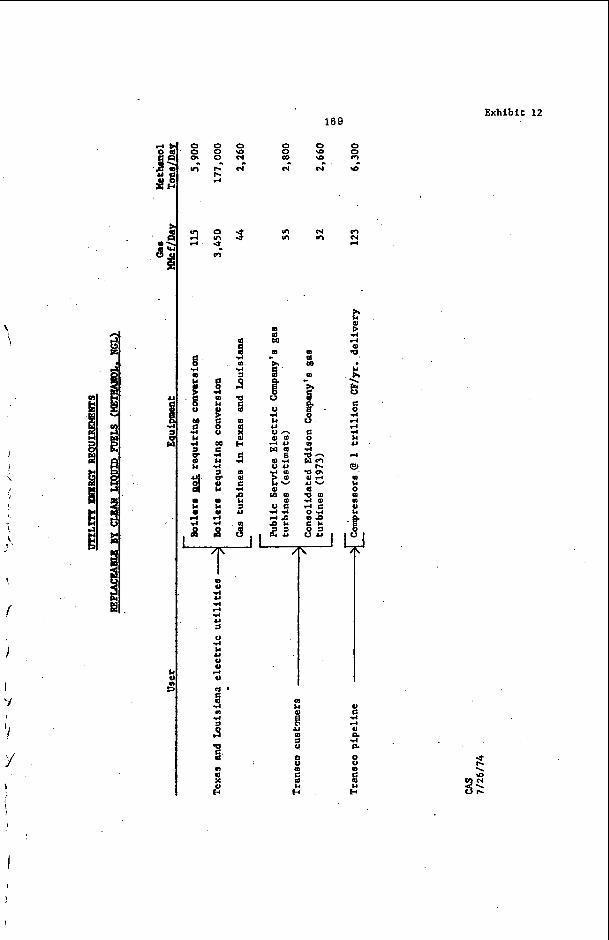
Exhibit NO. 12 shows some s t a t i s t i c s looking a t spec i f ic areas and
markets. E l e c t r i c u t i l i t y b o i l e r s not requir ing conversion (gas burning)
+xi Texas and Louisiana alone would consume 5,900 tons/day of methanol.
Boilers requir ing conversion ( o i l burning) i n the same area would requi re
177,000 tonsfday. And gas turbines would require 2,260 tonslday.
Our two l a r g e customers'would consume a combined t o t a l of about 5,500 I.
tonsfday i n t h e i r gas turbines.
t o t ransport one t r i l l i o n CF/year would require 6,300 tonslday.
In y c t another use, Transco compressors
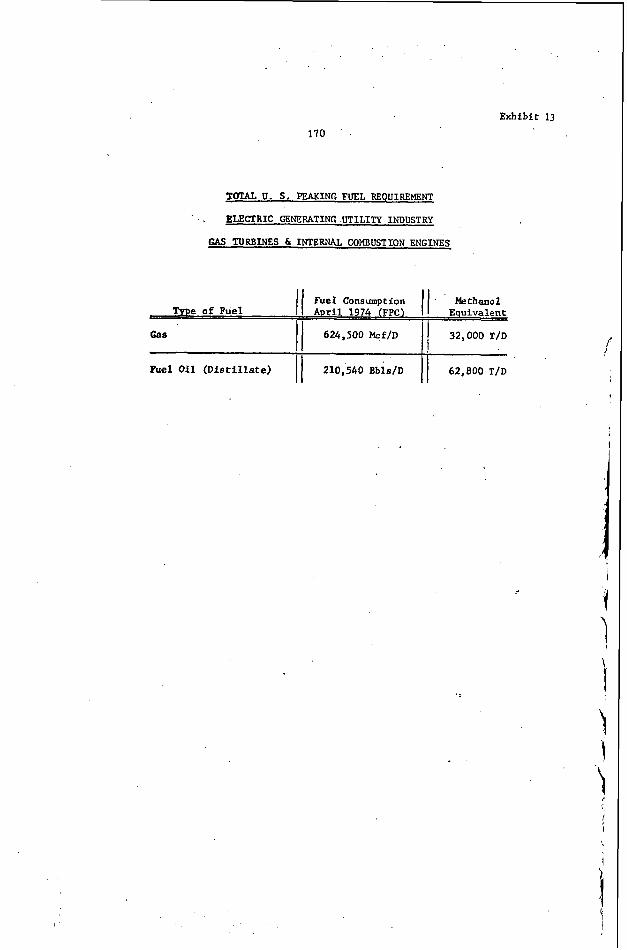
Exhibit No. 13 shows the t o t a l U. S. peaking.fue1 requirement f o r
e l e c t r i c u t i l i t y gas turbines and' in te rna l combustion engines. The d a i l y
requirement of methanol would be 32,000 tons for gas-burning turbines and
62,800 tons fo r oil-burning turbines.
The 1974 e l e c t r i c u t i l i t y consumption of a l l fuels f o r gas turbines
used t o generate e l e c t r i c i t y i s equivalent t o more than 100,000 tons per
day of methanol.
fue l s t ha t are current ly being used (natural gas, LPG's, # l and #2 fuel
o i l and JP).
Methanol has a PI. thermal eff ic iency advantage over the
The increased thermal eff ic iency r e s u l t s from the higher
- 9 -
156
mass flow through the turbine (approximately 2%) and from the use o f
vaporized methanol (approximately 5%).
and can be vaporized with waste heat from exhaust gas tha t is at too low
a temperature f o r any other economic use.
these conventional fue l s fo r t h i s use should pr ice it at a modest premium
versus these fue ls .
Liquid methanol b o i l s at 64.65' C.
Methanol's advantages over
Another type of guarantee tha t w i l l be necessary f o r a coal/methanol/
SNG project w i l l be some form of downside market pr ice guarantee which we
presume can only be furnished by the U. S. government. The jo in t methanol
fuel report prepared by a group of governmental agencies and bureaucracies
has recognized that such guarantees w i l l be necessary for such a project
t o become a r e a l i t y . This government report a l so recognizes the need for
a ' subs tan t ia l decrease in the time required f o r obtaining a l l of t he gov-
ernment-required approvals.
METHANOL MARKET - CHEMICAL
The current United States production of methanol is approximately
12,500 short tons per day.
approximately 10% per year.
t o a shortage in excess of 1,000 tons per day.
construction. Only one plant is being designed (Celanese's Bishop, Texas
plant; estimated addi t ional production capacity: 1,500 tons per day).
Exhibit No. 14 shows a p ro f i l e of the chemical methanol market.
The exis t ing chemical use market is growing at
The current supply-demand imbalance amounts
No new plants are under
Essent ia l ly , all chemical methanol produced i n the U. S. today is made
from natural gas.
mately 500 MMCF per day.
The natural gas consumption by these plants is approxi-
The posted s e l l i n g price for methanol at the end of the t h i r d quarter
of '74 was 32c per gallon ($S/MMBtu) FOB producing plant, but none was
available at t h i s price. The d ras t i c downturn i n the home building and
- 10 -
157
I’
L
d
automotive market (which account for over one-half of a l l methanol consump-
tion) has created a surplus of supply over demand.
recession, additional chemical production w i l l be needed a t near i t s
h i s to r i ca l growth r a t e .
Short of a long term
The future cost of chemical methanol calculated on a Btu value cannot
be l e s s than the cost of 1.8 Btu of purchased natural gas plus $1.00 per
million Btu of methanol produced.
per mill ion Btu, the cost of methanol would be $3.60 fo r natural gas plus
$1.00 for plant cos t fo r a t o t a l of $4.60 per mill ion Btu.
methanol is produced from i n t r a s t a t e gas for which sa l e s have been reported
a8 high as $2.05 per MMBtu i n 1975.
For example, i f natural gas is $2.00
Most U. S.
For these reasons, we believe that methanol sold i n the chemical
marketplace w i l l continue t o c o m d i t s h i s to r i c premium price Over the
cost of clean l iquid fuels. We believe tha t t h i s premium w i l l amount t o
a minimum of $1.00 per MMBtu.
be expected t o at least maintain i ts current price.
current price of clean l iquid fuels is between $2.00 and $2.50 per mill ion
Btu.
On t h i s basis , chemical methanol p r i ce can
We believe t h a t the
Therefore, t o the extent that methanol can be sold in the chemical
market, t h i s w i l l represent the highest pr ice which can be obtained.
Because of the domestic shortage of natural gas, even in the in t r a -
s t a t e market, the chemical producers with whom we have had conversations
believe that chemical methanol w i l l be produced from coal i n the United
States i n the 1980’s.
CONCLUSIONS
on the concept grade evaluation that has been made, w e conclude that
further in-depth e f f o r t should be made:
- 11 -
158
1. To produce f e a s i b i l i t y grade cap i t a l and operating cos t and
product cos t ,
2. To evaluate marketing poten t ia l fo r the products (SNG and
methanol), and
3. To obtain governmental encouragement and support for such a
venture by the pr ivate venture or f ree enterpr ises energy
production in te res t s .
ACKNOWLEDGEMENTS
The writer wishes t o acknowledge and express appreciation t o the following for
the assistance and encouragement provided which made t h i s a r t ic le possible:
Transco Energy Company Fluor Engineers and Constructors, Inc. LURCI I C 1 Americas Davy Powergas, Ltd. Imperial Chemical Industr ies Lawrence Livermore Laboratory
- 12 -
Ekhibit 1
- 1 1
I
!
I
161 Exhibit 3
EFF I C 1 ENCY COHPARISOIIS SNG VS SidG/HeOli FROM COAL
I. PRIME END PRODUCTS ONLY
SNG/14eOH:
SNG - 153.611 M2scfD @ 987 Btu/scf = 151.614 M3BtuD I.teOH - 5420.8 T/D @ 9760 B t u / l b = 105.814 H3BtuD
257.428 M3BtuD SIG ALONE:
SNG - 250 M2scfD I? 987 Btu/scf = 246.750 M3BtuD
COllPARI SON :
Di f ference = 257.428 - 246.750 = 10.678 M3Btu0 B e n e f i t from Co-Product O r = 4.327% increase over SNG alone.
11. PRIME END PRODUCTS VS FUEL IliPUT
SNG/MeOH :
l 1x1.
I
Feed coal o f 23517 T/O @ 7618 B t u / l b = 358.305 M3Btu Fuel; b o i l e r , power, SH. - 9668 T/D @ 7320 B t u / l b = 141.540 I43Btu
499.845 M3Btu
Roduces - 257.428 M3BtuD; E f f i c i e n c y = 51.50%
SNG ALONE:
Feed coal o f 23517 T/D @ 7618 B tu / l b = 358.305 M3BtuD Fuel; b o i l e r , power, SH. - 6562 T/D @ 7320 = 96.068 M38tuD
454.373 M3RtuD
Produces - 246.750 M3BtuD; E f f i c i e n c y = 54.31%
ALL END PRODUCTS VS FUEL INPUT
Sf4G/lleOH:
Feed & Fuel = 499.845 M3BtuD Products: 257.428 + 49.428 = 306.856 M3BtuD
E f f i c i e n c y = 61.39%
SNG ONLY: - Feed & Fuel 454.373 M k u D Products: 246.750 + 49.428 = 296.178 M3BtuD '
E f f i c i e n c y = 65.184%
162
Exhibit 4
CONCEPTUAL CAPITAI. COST SUI'IMARY
(1974 Costs)
SNG ONLY SNG/fleOH 250 1.12scfD 153.61 M2scfD/5421 st /O
Process Units $ 186,631 M $ 211,749 I4
Uti1 i t y Units 115,815 130,841
Offsi tes 57,829 . 60,831
SUBTOTAL $ 360,275 rj $ 403,421 M
Sales Tax @ 1.155% $ 4,161 M $ 4,660 M
I n i t i a l Charge - Catalyst 8 Chemical
Fees, Royaltie's 6 Eng. I Fees; Royalties & Eng.
Railroad Spur . .
2,650
5,200
--- 4,700
. 5,210 . 5,200
1,500
4,700
.Environmental - 1,000 1,000
Spare Parts 1,801 2,017
Water Supply 12,000 13,500
SUBTOTAL $ 391,787 M $ 441,208 M
Morking Capital
. In t e re s t During Construction
10,772
61,979
14,920
63,147
Contingency 39,179 44,121 .
TOTAL $ 503,717 M . $ 563,396 M
DOES NOT INCLUDE: 1. Construction camp 2.
5. Startup Costs 6. Land 7. Nine t support f a c i l i t i c s
Product SNG pipe l i nes (nor $ difference f o r s i z e differences) * 3. Loadout and handling f o r EleOH .
-4 . Escalation
' 163 Exhibit 5
CONCEPTUAL COST EVALUATION (1974 Costs)
SNG FROM COAL VS SNG/t4ETHANOL FROil COAL (BASIS: FLUOR FEASlBlLITY STUDY)
PROCESS UNITS SNG ONLY
Gas Production (Lurg i ) S h i f t Conversion 10,061 Gas Cool i n g 8,739 Rect i sol (Gas P u r i f i c a t i o n ) 66,783
Phenosolvan (Ammonia - Phenol separation)l3,494
$ 65,533 M
Methanation . 22,021
Mettianol LOO; Ethylene Conversion
TOTAL
UTILITY UNITS .-
, ,I - Zcixre:ision Uxygen Plant Sul fur Recovery Steam Gen. & Dis t . P lant & Instrument A i r Dernineral i zed Water Fuel Gas & 112 BFW & condensate Ammonia Disposal F l y Ash Co l l ec t i on & Fuel Gas Trrn. Stacks & Chimney Dust Control
TOTAL
OFFS I TES
S i t e Devel oprnen t Coal & Fly Ash Conveying E l e c t r i c a l System Flares Bu i l d ings F i r e Water Mud Water Fuel O i l Cool ing Water C l a r i f i e d Water P l a n t & Potable Glater Loading & Unloading Hold ing Pond Proc. E f f l u e n t Treat Tankage S u l f u r Storage
TOTAL
--- --- $186,631 M
b 5,370 36,282 4,693
43,009 525
3,188 380
3,189 789
16,485 855
1,050
$115,815 M
$ 8,176 M 5,744
16,506 2,483 4,438 2,147
25 481
2,665 8 34
1,101 529
1,420 8,750 1,796
$ 57,829 M
734- --
SNG/ldeOH
$ 65,533 M 9,000 8,739
65,783 12,100 13,494 37,100
$21 1,749 M
---
$ --- 36,282
4,693 61,000
525 4,391
380 4,391
789 16,485
855 1,050
$130,841 M
3 8,176 M 5,744
16,560 2,483 4,438 2,147
25 481
: 2,665 1,150 1,101
529 1,420 8,750 4,428
7 34
$ 60,831 M
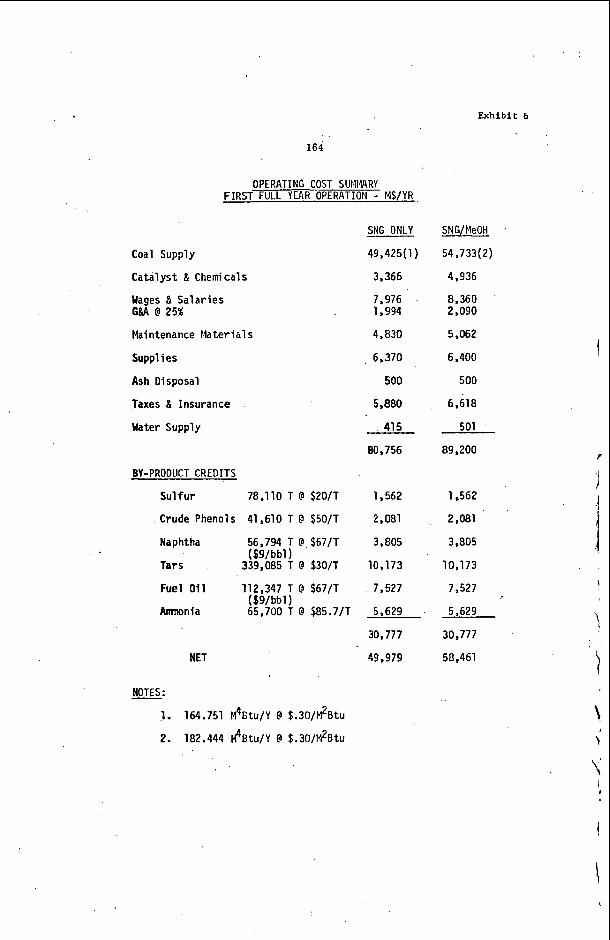
Exhibit 6
164
OPERATING COST SUIQNRY FIRST FULL YEAR OPERATION - M$/YR
Coal Supply
Cata lys t & Chemicals
Wages & Sa lar ies G&A @ 25%
Maintenance M a t e r i a l s
Supplies
Ash Disposal
Taxes & Insurance
Uater Supply
BY-PRODUCT CREDITS
S u l f u r 78,110 T @ $20/T
Crude Phenols 41,610 T @ $50/T
Naphtha 56,794 T @ $67/T ( W b b l )
Tars 339,085 T @ $30/T
Fuel O i l
Amnonia 65,700 T @ $85.7/T
112,347 T @ $67/T ( f 9 I b b l )
NET
NOTES: - 1. 164.751 M46tu/Y @ $.30/M2Btu
2. 182.444 l@Btu/Y @ $.30/M2Btu
SNG ONLY
49,425( 1)
3,366
7,976 . 1,994
4,830
6,370
500
5,880
41 5
80,756
1,562
2,081
3,805
10,173
7,527
5,629
30,777
49,979
SNG/MeOH
54,733( 2)
4,936
8,360 2,090
5,062
6,400
500
6,618
501
89,200
1,562
2,081
3,805
10,173
7,527
5,629
30,777
58,461
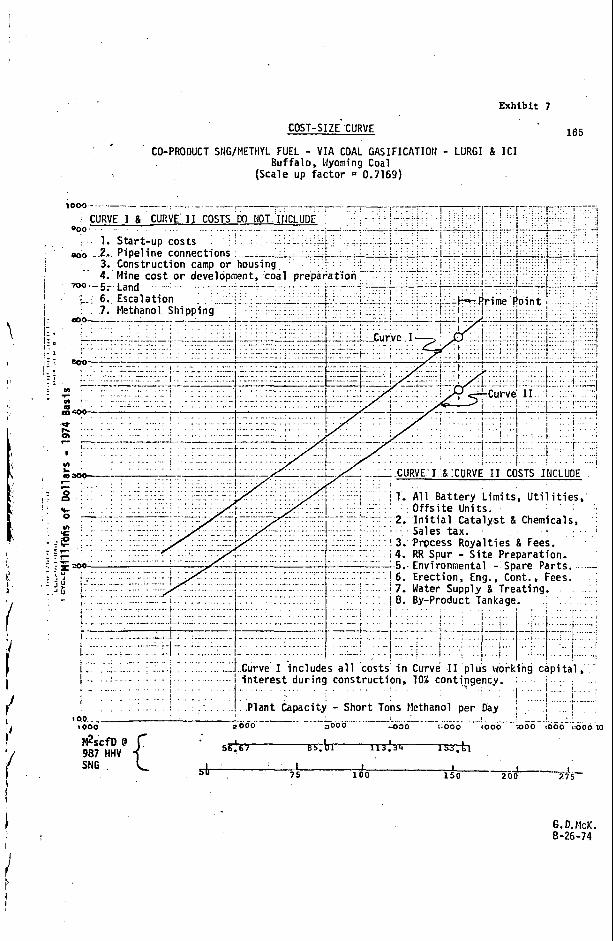
Exhibit 7
COST-SIZE CURVE 165
CO-PRODUCT SIIG/METHYL FUEL - V I A COAL G A S I F I C A T I O H - LURGI & I C 1 Buffalo, I.lyoming Coal
(Scale up factor = 0.7169)
. . , , i
, . . . .
* 000 4330 5000 to00 moo 1000 K l O d l O
G . D. k K . 8-26-74
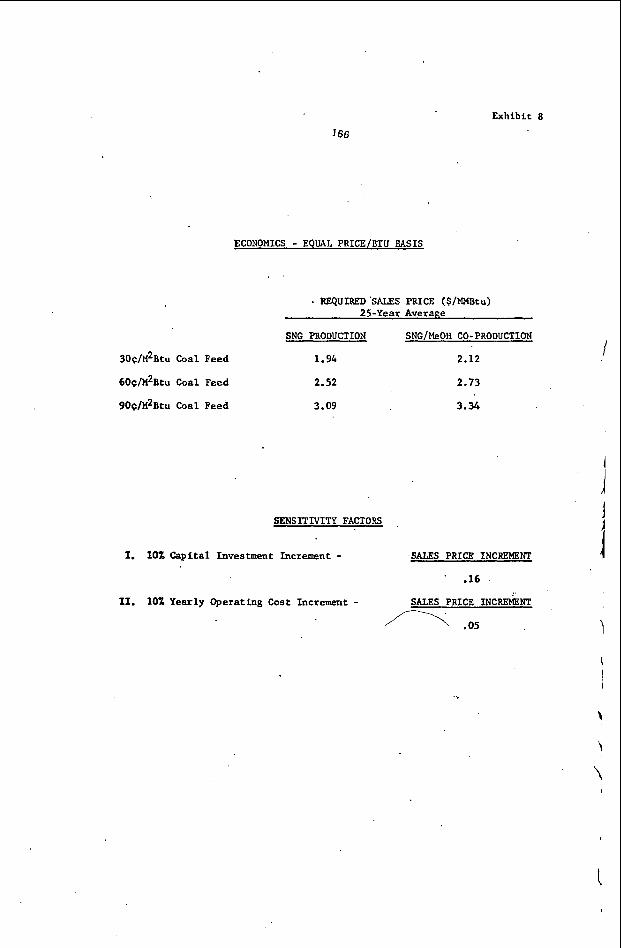
Exhibit 8
ECONOMICS - EQUAL PRICE/BTU BASIS
. REQUIRED 'SALES PRICE ($/-tu) 25-Year AveraRe
SNG PRODUCTION
30C/M2Btu Coal Feed 1.94
60C/M2Btu Coal Feed 2.52
90C/M2Btu Coal Feed 3.09
SENSITIVITY FACTORS
I. 10% Capital Investment hcrement -
XI. 101 Yearly Operating Cost Increment -
SNG/MeOH CO-PRODUCTION
2.12
2.73
1
3.34
1 i !
SALES PRICE INCReMENT
. .16
SALES PRICE I N C ~ N T
.OS \
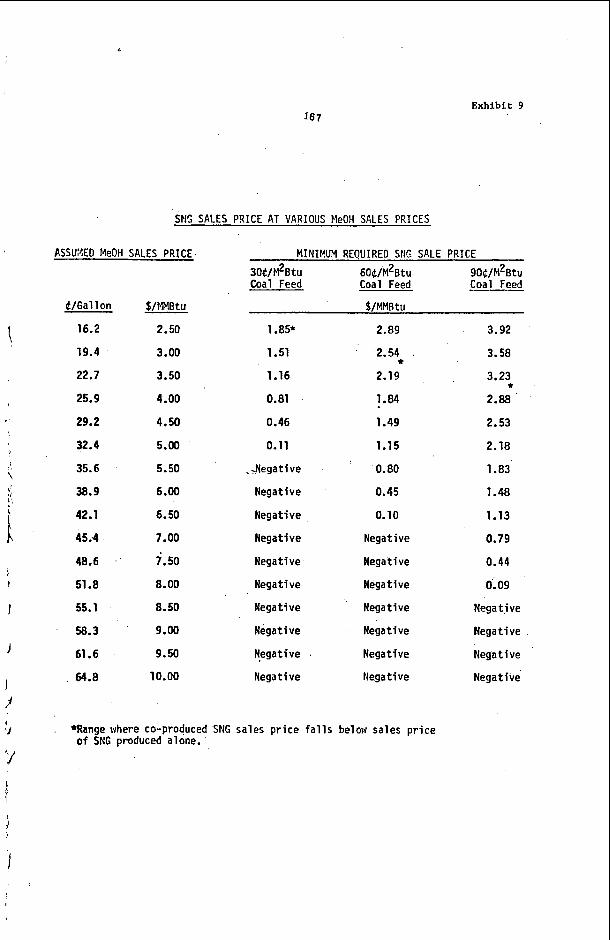
Exhibit 9
SNPJ S A L E S P R I C E A T V A R I O U S MeOH S A L E S P R I C E S
I
I P
ASSU:4ED MeOH S A L E S P R I C E
&/Gal 1 on
16.2
19.4
22.7
25.9
29.2
32.4
35.6
38.9
42.1
45 :4
48.6 .
51.8
55.1
58.3
61.6
64.8
f/NMBtu
2.50
3.00
3.50
4.00
4.50
5.00
5.50
6.00
6.50
7.00
7.50
8.00
8.50
9.00
9.50
10.00
-
MINIYUM REOUIRED SNG S A L E P R I C E
30C/M2Btu 60&/M2Btu 90t/M2Btu Coal Feed Coal Feed Coal Feed
$/MMBtu
1 .a5*
1.51
1.16
0.81
0.46
0.11
,-Negative
Negative
Negative
Negative
Negative
Negative
Negative
Negative
Negative
Negative
2.89
2.54
2.19
1.84
1.49
1.15
0.80
0.45
0.10
Negative
Negative
Negative
Negative
Negative
Negative
Negative
*Range where co-produced SNG sales price fa l l s below sales price o f SNG produced alone.'
3.92
3.58
3.23
2.88
2.53
2.18
*
1 .a3
1.48
1.13
0.79
0.44
0.09
Negative
Negative
Negative
Negative
... . Exhibit 10
-1
-2
-3
. M I N I H U M R E Q U I R E D SNG P R I C E
A T V A R I O U S M e O H P R I C E S -
$/MMBtu
I 8 I I ‘ A I 30 40 50 60
$/Gal.
$/Ton
I # I I I I I 60 8 0 . 100 120 140 160 180
- ,
169 Exhibit 12
\
,
f
I
I ‘J I
’?
2 Z S ” 4
m
h l m I n N r(
I I \
170
TOTAL U. S. PEAKING FUEL REQUIREMENT
% ELECTRIC GENERATING U T I L I T Y INDUSTRY
GAS TURBINES 6r 1 N T E R i . i COMBUSTION ENGINES
Exhibit 13
t !
Fuel Consumption c
624,500 Mcf/D 32,000 T/D
e of Fuel
! 62,800 T/D
Gas
1 1 210,540 Bbls/D 1 Fuel Oil (Distillate)
171
,
L
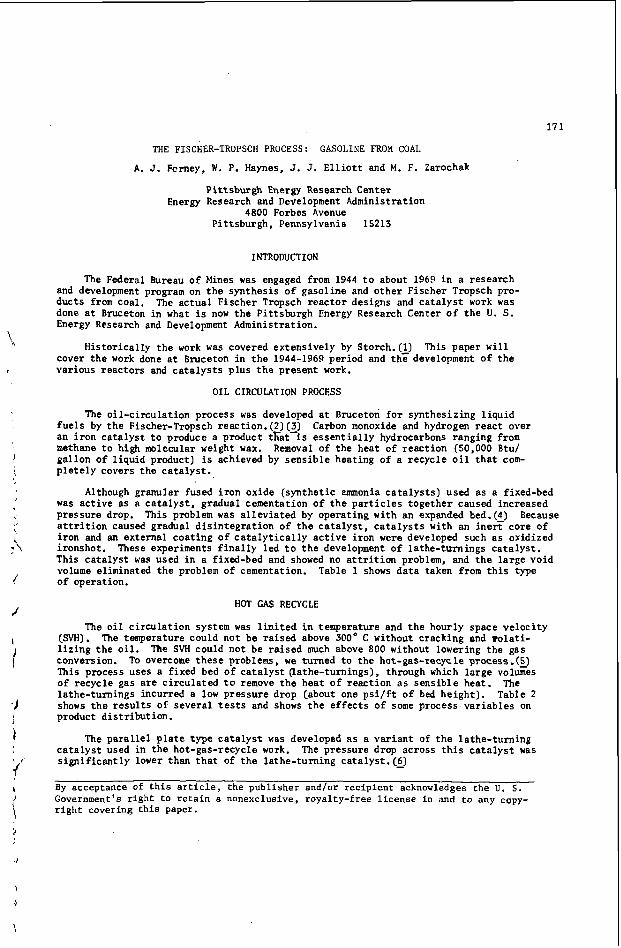
THE FISCHER-TROPSCH PROCESS: GASOLINE FROM COAL
A. J. Fcmey, W. P. Haynes, J. J. E l l i o t t and M. F. Zarochak
Pi t t sburgh Energy Research Center Energy Research and Development Administration
4800 Forbes Avenue Pi t t sburgh , Pennsylvania 15213
INTRODUCTION
The Federal Bureau of Mines was engaged from 1944 t o about 1969 i n a research and development program on t h e synthes is o f gaso l ine and o the r Fischer Tropsch pro- duc ts from coal. The ac tua l F ischer Tropsch r eac to r designs and c a t a l y s t work was done at Bruceton i n what is now t h e P i t t sburgh Energy Research Center of t h e U. S. Energy Research and Development Administration.
cover t h e work done a t Bruceton in t h e 1944-1969 period and t h z development of t h e var ious reac tors and c a t a l y s t s plus t h e present work.
H i s to r i ca l ly t h e work was covered ex tens ive ly by Storch.(l) This paper w i l l
O I L CIRCULATION PROCESS
The o i l - c i r cu la t ion process was developed a t Bruceton f o r synthes iz ing l i q u i d f u e l s by t h e Fischer-Tropsch reaction.(2)(3) an i r o n ca t a lys t t o produce a product tEat-is e s s e n t i a l l y hydrocarbons ranging from methane t o high molecular weight wax. Removal o f t h e hea t of reac t ion (50,000 Btu/ ga l lon o f l i qu id product) i s achieved by sens ib l e heating o f a recyc le o i l t h a t com- p l e t e l y covers t h e ca t a lys t .
was ac t ive as a c a t a l y s t , gradual cementation o f t h e p a r t i c l e s toge ther caused increased pressure drop. a t t r i t i o n caused gradual d i s in t eg ra t ion o f t h e c a t a l y s t , c a t a l y s t s with an i n e z core o f i ron and an external coa t ing o f c a t a l y t i c a l l y a c t i v e i ron were developed such as oxidized ironshot. This c a t a l y s t was used i n a fixed-bed and showed no a t t r i t i o n problem, and t h e l a rge void volume eliminated t h e problem of cementation. of operation.
Carbon monoxide and hydrogen r eac t over
Although granular fused i r o n oxide ( synthe t ic ammonia c a t a l y s t s ) used a s a fixed-bed
This problem was a l l ev ia t ed by opera t ing with an expanded bed.(4)
These experiments f i n a l l y led t o t h e development o f la the- turn ings ca t a lys t .
Because
Table 1 shows da ta taken from t h i s type
HOT GAS RECYCLE
The o i l c i r cu la t ion system w a s l imi ted i n temperature and t h e hourly space ve loc i ty The temperature could no t be r a i sed above 300' C without cracking and r o l a t i -
To overcome these problems, we turned t o the hot-gas-recycle process.(L)
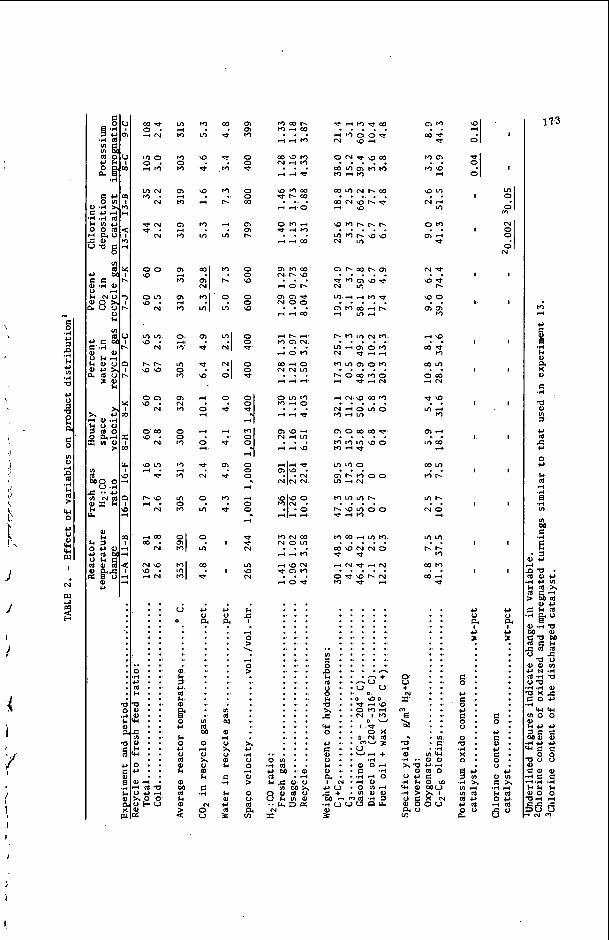
(SVH). l i z i n g t h e o i l . conversion. This process uses a f ixed bed o f c a t a l y s t (lathe-turnings), through which l a rge volumes o f recyc le gas a r e c i r cu la t ed t o remove t h e hea t of reac t ion as sens ib l e heat. lathe-turnings incurred a low pressure drop (about one p s i / f t o f bed he igh t ) . Table 2 shows t h e r e s u l t s of severa l tests and shows t h e e f fec ts of some process va r i ab le s on product d i s t r ibu t ion .
c a t a l y s t used i n t h e hot-gas-recycle work. s i g n i f i c a n t l y lower than t h a t of t h e lathe-turning ca t a lys t . (5)
'Ibe SVH could not be r a i sed much above 800 without lowering the gas
The
The p a r a l l e l p l a t e type c a t a l y s t was developed as a va r i an t of t h e la the- turn ing The pressure drop across t h i s c a t a l y s t was
By acceptance of t h i s a r t i c l e , the publ i sher and/or rec ip ien t acknowledges the U. S. Government's r i gh t t o r e t a i n a nonexclusive, royalty-free l i cense in and t o any copy- r i g h t covering t h i s paper.
I
\
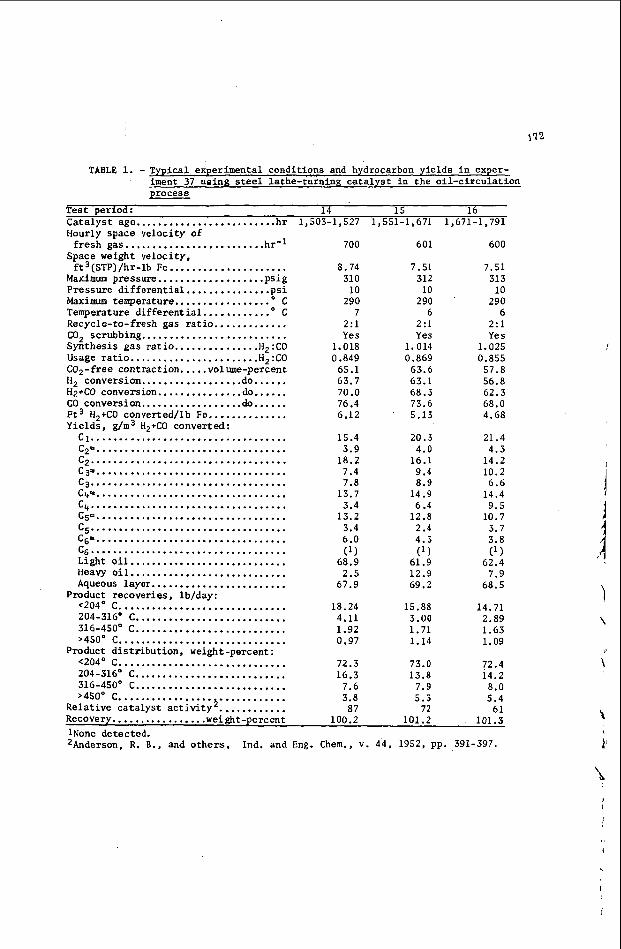
TABLE 1 . . Typical experimental conditions and hydrocarbon y ie lds i n exper- iment 37 using steel lathe-turning c a t a l y s t i n the o i l - c i r cu la t ion process
Tes t period: 14 15 16 Ca ta lys t age ......................... h r 1,503-1.527 1.551.1. 671 1.671.1. 791 Hourly space velocity
f r e s h gas ........... Space weight velocity f t 3 (STP)/hr-lb Fe ...
Maximum pressure ..... Pressure d i f f e r e n t i a l Maximum temperature ..
of ............ .h r.l 700
................. 8.74
.............. p Sl 10 ............... c 290
............. p s i g 31 0
Temperature- d i f f e r e n t i a l ............. C Recycle-to-fresh gas r a t i o ............. Synthes is gas r a t i o ............... H2:C0 Usage r a t i o ....................... H2:C0 Cop-free cont rac t ion ..... volume-percent H, conversion .................. do ...... Hz+CO conversion ............... do ...... CO conversion . .................do...... F t 3 H, +CO converted/lb Fe .............. Yields. g/m3 H2+CO converted:
CO, scrubbing ..........................
c , ................................... ... .................................. .. ................................... C p . . . . . . . . . . ........................ c3 ................................... c4= ................................... c, ................................... c5 ................................... cs= .................................. C$ ...................................
C5 E ..................................
Llght o i l ............................ Heavy o i l ............................ Aqueous layer ........................
Product recoveries. lb/day: . . . <204O C .............................. 204-316' C ........................... 316-450° C ........................... >450° C .............................. <204' C .............................. Product d i s t r ibu t ion . weight-percent:
204-316' C ........................... 316-450° C ........................... >450° C ..............................
7 2 : l Yes
1.018 0.849
65.1 63.7 70.0 76.4 6.12
15.4 3.9
18.2 7.4 7.8
13.7 3.4
13.2 3.4 6.0 ( 1 1
68.9 2.5
67.9
18.24 4.11 1.92 0.97
72.3 16.3
7.6 3.8
Rela t ive catalyst a c t i v i t y , ............ 87
601
7.51 312
10 290
6 2:l Yes
1.014 0.869 63.6 63.1 68.3 73.6 5.13
20.3 4.0
16.1 9.4 8.9
14.9 6.4
12.8 2.4 4.3
61.9 12.9 69.2
15.88 3.00 1.71 1 . 1 4
73.0 13.8
7.9 5.3
72
(1 1
600
7.51 313
10 290
6 2:1 Yes
1.025 0.855
57.8 56.8 62.3 68.0 4.68
21.4 4.3
14.2 10.2 6.6
14.4 9.5
10.7 3.7 3.8
62.4 7.9
68.5
14.71 2.89 1.63 1.09
72.4 14.2 8.0 5.4
61
(11
Recovery ................. weight-percent lOOI2 101.2 101.3 lNone de tec ted . 2Anderson. R . B., and o the r s . Ind . and Eng . Chem., v . 44. 1952. pp . 391.397 .
\
I
/
I
?
i"
v) 4 M
M 0 M
m .-I M
m M 3
m 3 M
E: M
0 M
v) 0 M
4,
m N M
0 0 M
M M 3
v) 0 M
0 %I 21 M
U
0
al 1 c,
h
c, i h c,
3
3 c 2
h 0
M v)
ID
-J
ID
4
M v)
m u
u \D
4
0 4
r(
0 4
s
9
N
v)
0
v)
m *
c,
p:
1 M 0 0 x 0
E
4
.d
0 U
c-4
?
4
*
M
M I.
4
V)
M I.
9 Ln
N
dl
9 u
4
u
01 u
M
*
I
I
c,
3.
v1
M al 4 0
B h K .d
k 0
3
m m M
0 0 b
0 0 a
m m I.
0 0 ID
0 0 ID
0 0 u
0 0 *
?I .-I
ZJ 4
0 0 0
.-I
4
0 0
4
u * N
v) ID N
h -7
> ?
4
> .-I 0
2: c, .d
0 4
> a3
d a cn
0 v ) M M 4 O
4 4 -
m a + N4v)
4 3 -
. . .
. . .
. . . . . . . . . . . . . . . . . . ..... . . . . ..... . . . . . . . . . ..... . . . ..... . . . . . . . . . . . . . . . . . . . . . . . . . . . . . . . . . . . . . .
~ r n , - ~ v ) ~ . m a m N 3 . . . . .
b 9
4 N b 4 N
O 9 I D I . N M b 4
. . . . .
. . . . . . . . . . . . . . . . . . . . . . . . . . . . . . . . . . . . . . . . . . . . .
V I . . 0 . t J . g : g : ? A 6 5 P
0 .
c,u
.d u c
I -u o x II N ld m- 3
U
01r
? ?
'9".
? ?
m u 0
MID 4
N-4 v)
m 4 u
N b
ID* I. . . '99 m m M
.+ID
M
.... m u
? ?
4'9
o m 4 N
m-4 M
m 4 . . v)m
4
m m mt. . .
Y': N O 4
. . . . . . . . . . . . . . ... . . . . . . _ . . . - 8 : :. + . . N * * Z - - m . . . . . . . . . . . . V I a .E: 4 . .r( al m u .-I .. 0 al xac,.-I
a l a 0 O W E
.d > U E % k m o o u a0 cn
d c o u "
0
91 0 I
I
I
I .
I
I
I
I
I
I
I
l
e,
? ? c,
8 : 5 : 8 :
e .
0 .
0 .
0 . a . .d . X . 0 .
Eiz 2; 4 x
d c , e,@ 0 0 a
I
I
m
N
I
I
I
I
I
I
I
I
I
I
c,
? 3. r
8 : 8 : 8 :
c 1 .
r .
0 . w o m
E x .d 4
h l d oc, 4 -
c 0 U
I
. ' 174
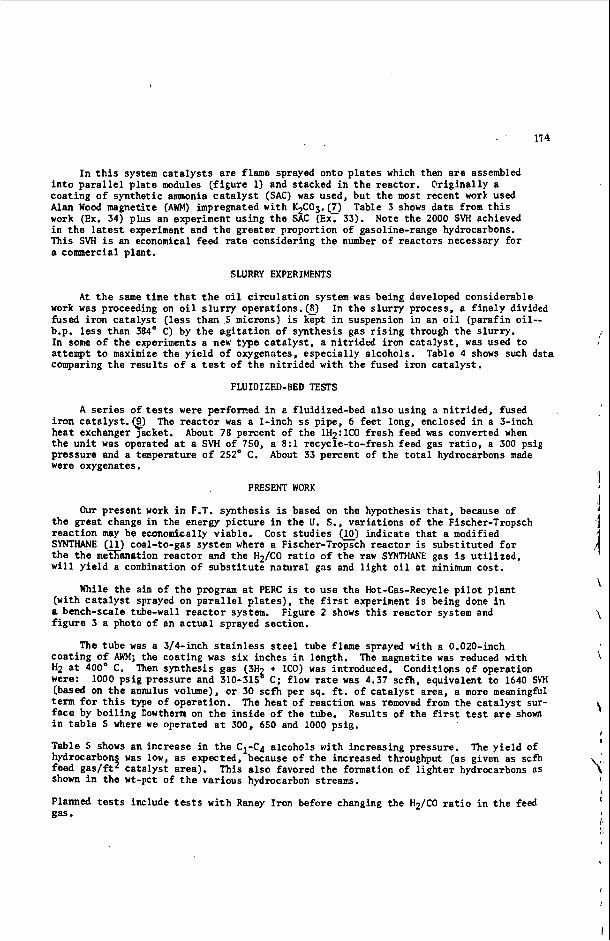
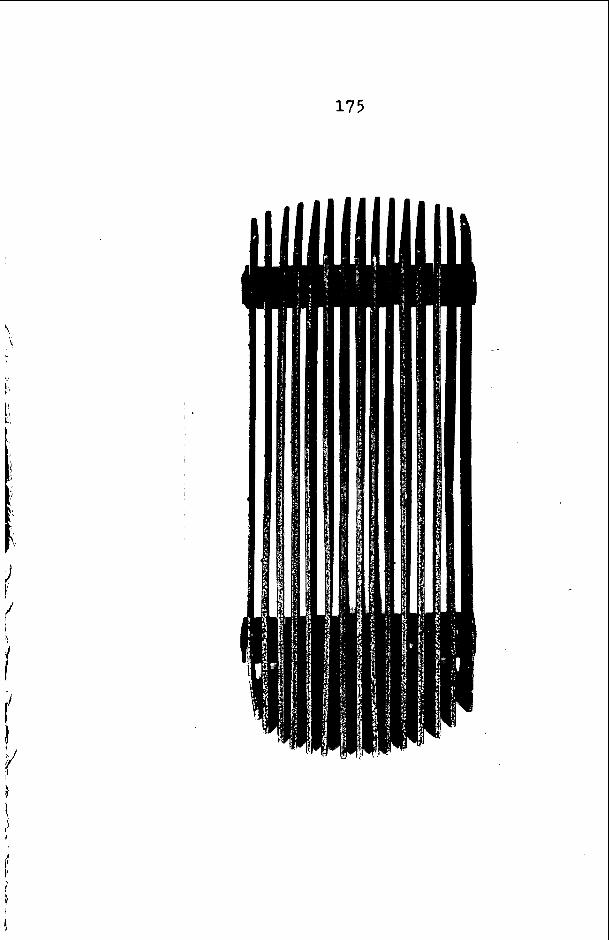
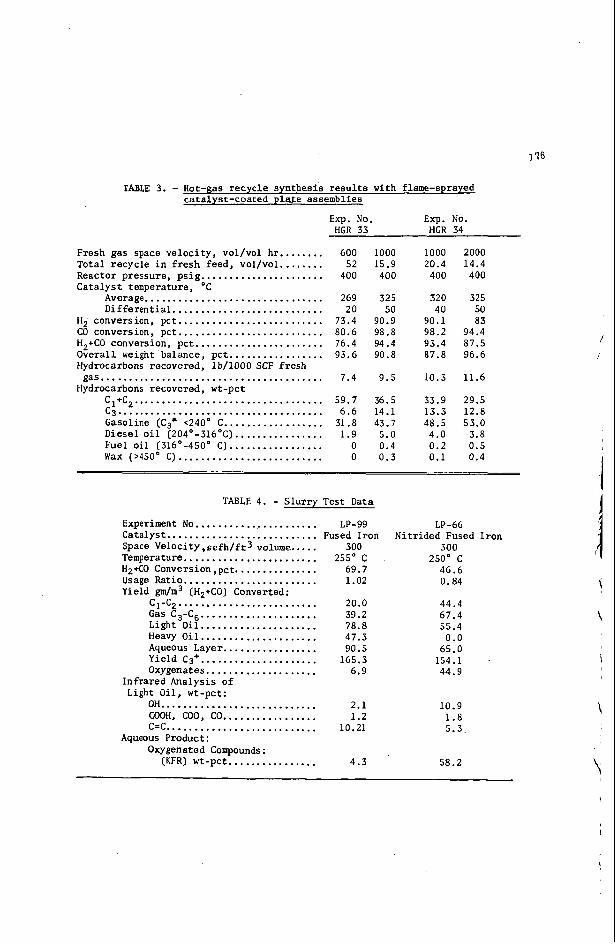
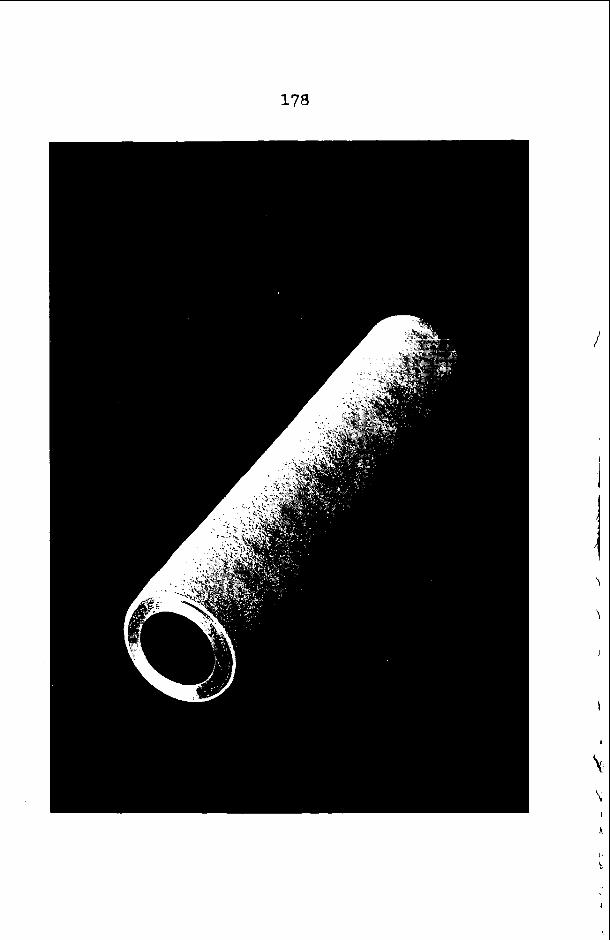
I n t h i s system c a t a l y s t s a r e flame sprayed onto p l a t e s which then are assembled i n t o p a r a l l e l p l a t e modules ( f igure 1) and s tacked i n t h e reac tor . Or ig ina l ly a c o a t i n g o f synthe t ic ammonia c a t a l y s t (SAC) was used, bu t t h e most recent work used Alan Wood magnetite ( A m impregnated with K CO3.(7) work (Ex. 34) plus an experiment us ing t h e S k (Ex, 33). Note t h e 2000 SVH achieved i n t h e latest experiment and t h e g r e a t e r proport ion of gasoline-range hydrocarbons. This SVH is an economical feed r a t e consider ing t h e number o f reac tors necessary f o r a commercial plant.
Table 3 shows d a t a from t h i s
SLURRY EXPERIMENTS
A t t h e same time t h a t t h e o i l c i r c u l a t i o n system was being developed considerable work was proceeding on o i l s l u r r y operations.(E) fused i r o n c a t a l y s t (less than 5 microns) is kzpt i n suspension i n an o i l (paraf in o i l - -
In some o f t h e experiments a new type c a t a l y s t , a n i t r i d e d i ron c a t a l y s t , was used t o attempt t o maximize t h e y i e l d o f oxygenates, espec ia l ly a lcohols . comparing t h e r e s u l t s o f a t e s t of t h e n i t r i d e d with t h e fused i r o n c a t a l y s t .
I n t h e slurry process, a f i n e l y divided
b.p. less than 384' C) by t h e a g i t a t i o n of synthes is gas r i s i n g through t h e s lur ry . /
Table 4 shows such data
FLUIDIZED-BED TESTS
A series of tests were performed i n a f luidized-bed a l s o using a n i t r i d e d , fused The r e a c t o r was a 1-inch ss pipe, 6 f e e t long, enclosed i n a 3-inch
About 78 percent of the 1H2:lCO f r e s h feed was converted when iron cata1yst.Q) hea t exchanger Jacket. t h e u n i t was operated a t a SVH of 750, a 8: l recycle- to-fresh feed gas r a t i o , a 300 psig pressure and a temperature o f 252' C. About 33 percent of t h e t o t a l hydrocarbons made were oxygenates.
PRESENT WORK
Our present work i n F.T. synthes is is based on t h e hypothesis t h a t , because of t h e g r e a t change in t h e energy p i c t u r e i n t h e U. S., var ia t ions of t h e Fischer-Tropsch r e a c t i o n may be economically viable . Cost s t u d i e s (10) ind ica te t h a t a modified SYNTHANE (11) coal-to-gas system where a Fischer-Trozch r e a c t o r i s s u b s t i t u t e d f o r t h e t h e meTanation r e a c t o r and t h e H2/CO r a t i o o f t h e raw SYNTHANE gas is u t i l i z e d , w i l l y i e l d a combination of s u b s t i t u t e n a t u r a l gas and l i g h t o i l at minimum cos t .
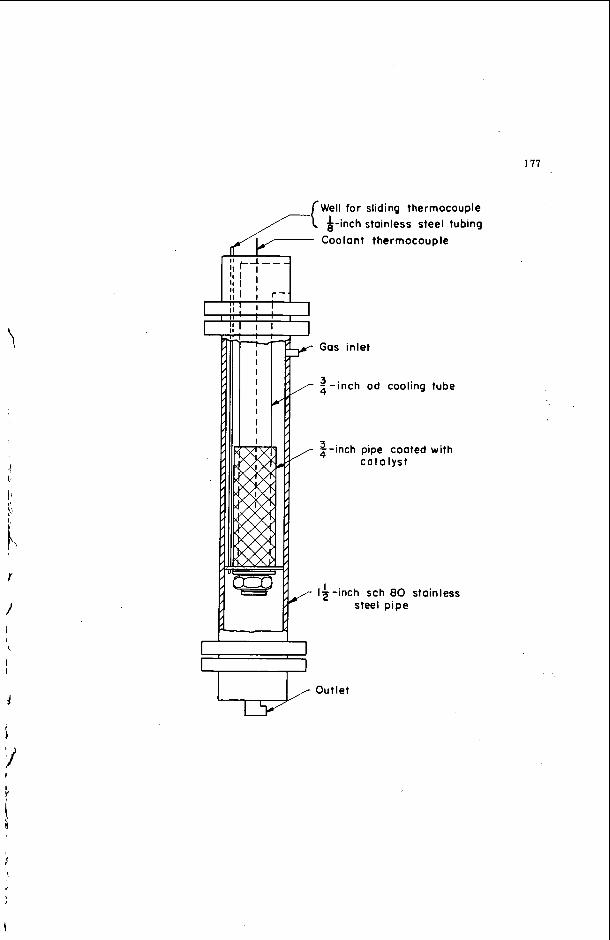
(with c a t a l y s t sprayed on p a r a l l e l p l a t e s ) , the first experiment i s being done i n a bench-scale tube-wall r e a c t o r system. f i g u r e 3 a photo o f an a c t u a l sprayed sec t ion .
c o a t i n g o f AWM; the coat ing was s i x inches i n length. H2 at 400' C. were: 1000 ps ig pressure and 310-315 C; flow rate was 4.37 scfh, equivalent t o 1640 SVH (based on t h e annulus volume), o r 30 scfh per sq. f t . o f c a t a l y s t area, a more meaningful term f o r t h i s type of operat ion. The h e a t o f reac t ion was removed from t h e c a t a l y s t sur- face by b o i l i n g Dowthenn on t h e i n s i d e o f the tube. i n t a b l e S where we operated a t 300, 650 and 1000 psig.
Table 5 shows an increase i n the C1-C4 alcohols with increasing pressure. The y i e l d of hydrocarbons was low, as expected, because o f t h e increased throughput (as given as scfh feed g a s / f t 2 c a t a l y s t area) . This a l s o favored t h e formation of l i g h t e r hydrocarbons as shown i n t h e wt-pct of t h e var ious hydrocarbon streams.
Planned tests include tests wi th Raney Iron before changing t h e H2/CO r a t i o i n t h e feed gas.
While t h e aim o f t h e program a t PERC is t o use t h e Hot-Gas-Recycle p i l o t p l a n t
Figure 2 shows t h i s r e a c t o r system and
The tube was a 3/4-inch s t a i n l e s s s t e e l tube flame sprayed with a 0.020-inch The magnetite was reduced with
Then synthes is gas (3H4 + 1CO) was introduced. Conditions of operat ion
Resul ts of t h e first test are shown
\
P i
I
I
!
j
175
1-76
TABLE 3 . . Hot-gas recyc le synthes is r e s u l t s with flame-sprayed catalyst-coated p l a t e assemblies
Exp . No . E x p . No . HGR 33 HGR 34
Fresh gas space ve loc i ty . vol/vol h r ........ Total recyc le i n f r e s h feed. vol/vol ........ Reactor pressure. psig ...................... Cata lys t temperature. 'c
Average ................................ D i f f e r e n t i a l ...........................
H2 conversion. pc t .......................... CO conversion. p c t .......................... H2+C0 conversion. p c t ....................... Overall weight balance. p c t ................. Hydrocarbons recovered. lb/1000 SCF f r e s h
gas ........................................ Hydrocarbons recovered. wt-pct
cl+c .................................. c3 ..................................... Gasoline (C3= ~ 2 4 0 ' C .................. Diesel o i l (204°-3160C) ................ Fuel o i l (316°-4500 C) ................. Wax (>450° C) ..........................
600 52
400
269 20
73.4 80.6 76.4 93.6
7.4
59.7 6.6
31.8 1.9 0 0
1000 1000 15.9 20.4 400 400
325 320 50 40
90.9 90.1 98.8 98.2 94.4 93.4 90.8 87.8
9.5 10.3
36.5 33.9 14.1 13.3 43.7 48.5
5.0 4.0 0.4 0.2 0.3 0.1
2000 14.4 400
325 50 83
94.4 87.5 96.6
11.6
29.5 12.8 53.0
3.8 0.5 0.4
TABLE 4 . . Slu r ry Test Data
Experiment No ...................... LP-99 Catalyst ........................... Fused Iron Space Velocity. s c f h l f t 3 volume., ... H2+CO Conversion .pc t ............... Yield gm/m3 (H2+CO) Converted:
Temperature ........................ Usage Ratio ........................
c1.c2 ......................... Gas C3-C ..................... Light O i l ..................... Heavy O i l ..................... Aqueous Layer ................. Yield C3+ ..................... Oxygenates ....................
Infrared Analysis o f Light O i l . wt-pct:
OH ............................ COOH. COO. CO ................. c=c ........................... Oxygenated Compounds :
Aqueous Product:
(KFR) wt-pct ................
300 255" C
69.7 1.02
20.0 39.2 78.8 47.3 90.5
165.3 6.9
2.1 1.2
10.21
4.3
1p-66 Ni t r ided Fused Iron
300 250' C
46.6 0.84
44.4 67.4 55.4
0.0 65.0
44.9 154.1 .
10.9 1 .8 5.3
58.2
I
1
1
1 I1
Y
Well for sliding thermocouple A-inch stainless steel tubing
thermocouple
Outlet
Gas inlet
$- inch od cooling tube
$-inch pipe coated with catalyst
I Iq-inch sch 80 stainless steel pipe
178
179
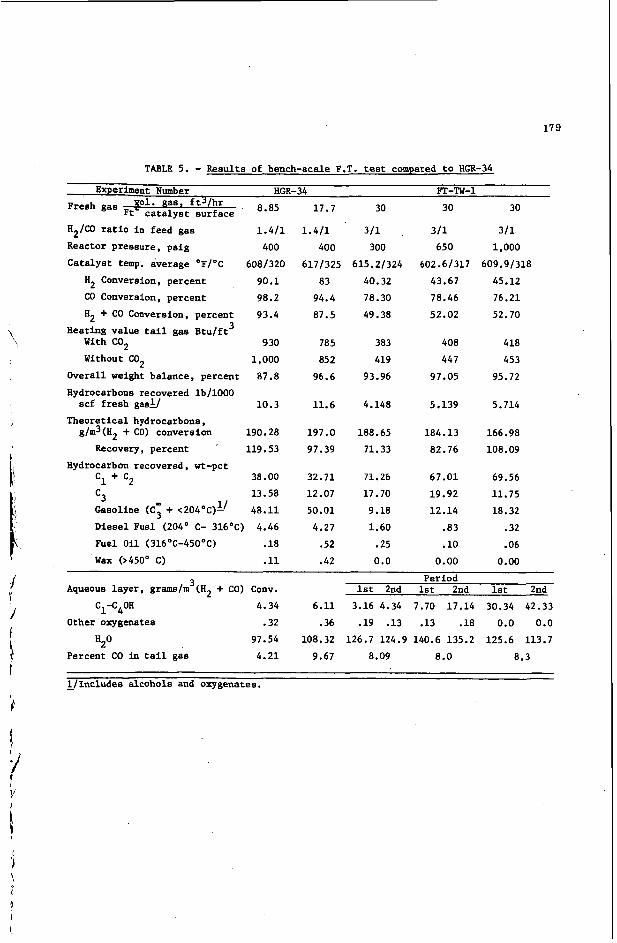
TABLE 5. - Resul ts of bench-scale F.T. test compared to HGR-34
Experiment Number HGR-34 FT-TW-1 Fresh gas ft-'lhr 8.85 17.7 30 30 30
H2/C0 r a t i o i n feed gas 1.411 1.411 311 311 311
Catalyst temp. average OF/'C 6081320 6171325 615.21324 602.61317 609.91318
H2 Conversion, percent 90.1 83 40.32 43.67 45.12
CO Conversion, percent 98.2 94.4 78.30 78.46 76.21
H2 + CO Conversion, percent 93.4 87.5 49.38 52.02 52.70
With GO2 930 785 383 408 418
Ft' c a t a l y s t su r f ace
Reactor pressure, p s ig 400 400 300 650 1,000
3 Heating value t a i l gas B tu / f t
Without C02 1,000 852 419 447 453 Overall weight balance, percent 87.8 96.6 93.96 97.05 95.72 Hydrocarbons recovered lb/1000
scf f r e s h ga& 10.3 11.6 4.148 5.139 5.714 Theoret ical hydrocarbons,
g/m3(H2 + CO) conversion 190.28 197.0 188.65 184.13 166.98 Recoverjr, percent ' 119.53 97.39 71.33 82.76 108.09
38.00 32.71 71.26 67.01 69.56 13.58 12.07 17.70 19.92 11.75
Caeoline (C; + <204°C)L1 48.11 50.01 9.18 12.14 18.32 Diesel Fuel (204O C- 316OC) 4.46 4.27 1.60 .83 .32 Fuel O i l (316°C-4500C) .18 .52 .25 .10 .06
Hydrocarbon recovered, wt-pct c1 + c2
c3
Wax (>450° C) .ll .42 0.0 0.00 0.00
3 Aqueous l aye r , gramslrn (H2 + CO) Conv.
~
Period 1st 2nd 1st 2nd 1st 2nd
C1-C40H 4.34 6.11 3.16 4.34 7.70 17.14 30.34 42.33 Other oxygenates .32 .36 .19 .13 .13 .18 0.0 0.0
97.54 108.32 126.7 124.9 140.6 135.2 125.6 113.7 H2° Percent CO i n t a i l gas 4.21 9.67 8.09 8.0 8.3
- l / Inc ludes alcohols and oxygenates.
180
CONCLUSION
Ne believe more work i n t h e a rea o f t h e Fischer-Tropsch reac t ion is needed. process is very f l ex ib l e ; most any des i red product can be obtained by se l ec t ed reactor type, c a t a l y s t , opera t ing temperature and synthes is gas r a t i o . can be e a s i l y changed t o maximize t h e y i e ld o f product most i n demand a t any given time. Our work w i l l continue t o s t r e s s pr imar i ly the gasoline y i e ld but oxygenates could be a des i red byprodwt.
The
Operating conditions
b
I
REFERENCES
1. Storch, H. H., N. Golumbic. and R. B. h d e r s e n . The Fischer-Tropsch and Re- l a t e d Syntheses: John Welby and Sons Inc., New York, N.Y., 1951. 610 pp.
2. Bienstock, D., A. J. Forney and J. A. Field. Fischer-Tropsch Oil-Circulat ion Process. Experiments With A Massive-Iron Catalyst . R I 6194, 1963, 20 pp.
The 3. Bimstock, D., J. H. Field, A. J. Forney, J. G. Myers and H. E. Benson. Fischer-Tropsch Synthesis In t h e O i l C i rcu la t ion Process: A Nitrided Fused-Iron Catalyst . R I 5603, 1960, 32 pp.
Experiments With
4. Rensen, H. E., J. H. Field, D. Bienstock, R. R. Nagle, L. W. Brunn C. 0. Hawk, J. H. Crowell and H. H. Storch. Recycle Process. m i n e s Bull. 568, 1957, 72 pp.
Development of t h e Fischer-Tropsch O i l
5. Field, J. H., D. Bienstock, A. J. Forney and R. J. Demski. Further Studies of the Fischer-Tropsch Synthesis Using Gas Recycle Cooling (Hot-Gas-Recycle Process). R I 5871, 1961, 32 pp.
6. Forney, A. J., R. J. Demski, D. Bienstock and J. H. Field. Recent Catalyst Developments i n t h e Hot-Gas-Recycle Process. R I 6609, 1965, 32 pp.
7. E l l i o t t , J. J., H. P. Haynes and A. J. Forney. Gasoline Via t h e Fischer-Ropsch , 1 Reactor Using t h e Hot-Gas-Recycle System. F.eprint 163rd National Meeting of
ACS, Boston, Mass., Fuels Division, vol. 16, No. I, Apri l 1972, pp. 44-50. I
! ! t h e Fischer-Tropsch Synthesis. I n d u s t r i a l and Eng. Chemistry, vol. 46,
8. Schlesinger, E!. D., H. E. Bensen, E. M. Murphy and H. H. Storch. Chemicals From
June 1954, pp. 1322-1326.
Catalyst Reactor with a Nitrided Fused-Iron Catalyst . R I 5456, 1959, 16 pp. 9. Demeter, J. J. and M. D. Schlesinger. Fischer-Tropsch Synthesis i n a Fluidized-
10.1 Katell, Sidney, and staff. A Combined SYNTHANE Gasi f ica t ion of Montana Coal at 1000 p s i and Fischer-Tropsch Synthesis to Produce High-Btu Gas and Liquid
11. Forney, A. J. and J. P. McGee. The SYNTHANE Process--Research Resul ts and Proto- Fourth AGA Synthet ic Pipel ine Gas Symposium, Chicago, Ill..
/ Products. Report 74-21, Jan. 1974, 63 pp.
I 1 Oct. 1972, pp. 51-72. 1
type P l a n t Design.
c
L
I
I
P
COAL GASIFICATION A T THE BELLE WORKS
A . McCeorge and R. V . Green
E. I. du Pont d e Nemours E Company Incorporated Indus t r i a l Chemicals Department
Wilmington, Delaware 19898
EARLY YEARS AND PROCESS DEVELOPMENT
site fo r a n ammonia p lan t to b e operated by L'Azote Inc., a subsid iary of E. I. du Pont de Nemours Inc. T h e site was selected because of the avai l - ab i l i t y of bituminous coal from the West V i rg in ia and Pennsylvania f ie lds. Plant operations began in A p r i l 1926 when synthetic ammonia was produced by the Claude process at a thousand atmospheres. Coal was gasif ied w i t h steam producing "Blue Gas" as shown in Equation 1 . The actual "B lue Cas" contained in addi t ion to CO and H2 small amounts of C02, N2, methane and su l fu r com- pounds. The "Blue Cas" was l iquef ied and pur i f ied to y ie ld hydrogen, wh ich was burned w i t h a i r to obtain a m i x e d gas for ammonia synthesis.
In August 1924, Slack's Farm in Belle, West V i r g i n i a was chosen as the
C + H20 CO + H2 1 )
Because of di f f icu l t ies associated w i t h coal cak ing during gasification, the process was modified in 1930 to make coke and then gas i fy the coke. A bat tery of 46 coke ovens was instal led a n d coke was gasif ied w i t h steam and a i r in cyc l i c gas generators producing "Blue Gas and "Blow Run Gas." In addition, coke oven gas was processed to recover coal tar byproducts; methane and carbon monoxide were removed by liquefaction; a n d hydrogen was recovered. The methane, carbon monoxide stream was re tu rned as fuel to the coke ovens. A t about the same time commercial methanol synthes is was begun at Bel le w i t h the "Blue Cas" being used mainly for methanol and carbon monoxide manufacture whi le the "Blow Run Cas," which contained nitrogen, was used for ammonia synthesis. and ' ~ O ' S , production was begun on a number of other products based on carbon monoxide, hydrogen, methanol a n d ammonia. Among these were ny lon inter- mediates, methyl methacrylate, urea and ethylene g lyco l .
Dur ing the 1930's
In 1948, the gasif icat ion of coke w i t h steam and oxygen on a continuous basis was started in three of the cyc l i c generator sets. Elimination of n i t rogen made it possible to produce "Blue Cas" continuously. Meanwhile, information about Gerinan work on par t ia l ox idat ion of coal to produce carbon monoxide and hydrogen for Fischer-Tropsch synthesis helped to stimulate laboratory work on par t ia l oxidation processes leading to a semi-works scale u n i t a t Belle wh ich operated in 1948-49. entrained feed, atmospheric p ressure process wh ich r a n a total of 1200 hours w i t h the two longest r u n s being o f C5 and 66 hours duration. It used 120 tons of several coals and consumed 1 1 1 tons of oxygen during i t s operation.
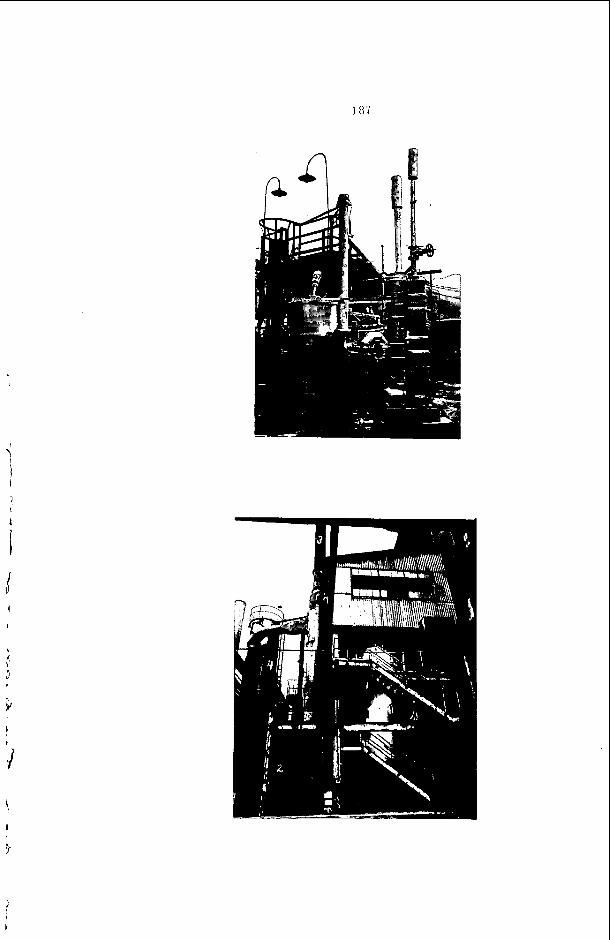
A v iew of th is unit i s shown in F igure I . It was an
Crowing out of the semi-works experience, a p i lo t p lant was designed and started in 1950, see F i g u r e II. Operation of the p i lo t plant was successful in demonstrating the gcncra l feasibi l i ty o f the coal par t ia l combustion process in larger scale equipment. Satisfactory gas production rates and coal, oxygen, and steam consumption rates were achieved indicating substantial economies over coke gasification. Fur ther process improvement was needed in slag removal and increased gas yield b y reduct ion of ungasif icd carbon.
p i lo t u n i t at Ihe Bureau o f Mines' station at Morgantown. dr'?. The Babcock & Wilcox gasif ier also used steam to ent ra in the pu lvc r izcd coal bu t
A s imi lar prograin was followed by Babcock & Wilcox resulted in a
183 was designed for up-f low in the generator. designed generator was instal led and operated in the Bel le p i lo t p lan t . experience gained from the total p i lo t plant operation led to a col laboration between Babcock & Wilcox and Du Pont in the design and instal lat ion of a commercial scale coal par t ia l oxidation unit a t Bel le in 1955.
in October 1951 a Babcock 6 Wilcox The
,
I I
I !
COMMERCIAL SCALE OPERATION
Process Descript ion
The coal part ia l combustion process is based upon the gasif icat ion o f pulver ized coal in suspension w i th oxygen and steam. by several reactions wh ich occur simultaneously. The heats of react ion are g iven at 220OOF. although the reaction zone temperature was approximately 5OO0F h igher ,
Gasif icat idn takes place
c + o2 _j co2 - 170,000 Btu / ib . mole 2) c + 112 02+ co - 49,500 Btu / lb . mole 3)
C + H 2 0 + C 0 + H2 + 58,000 Btu / lb . mole 4) CO + H 2 0 7 C O 2 + H2 - 13,000 B t u l l b . mole 5)
As coal entered the generator mixed w i th steam and oxygen it rap id l y devolat i l ized and reacted to produce C02, CO and H2. combustion and gasif icat ion then reached equ i l ib r ium w i th respect to the shi f t reaction, Equation 5.
These products of
A t the high generator temperature the ash in the coal melted and was deposited in the generator base where i t drained from the reaction zone. small part icles of ash were car r ied along w i th the main gas stream and passed out o f the reaction zone along with the ungasif ied carbon. the bottom of the generator fe l l into a pool of water where it f rac tu red and was removed b y a lock hopper and slag pump.
The residence time o f the gas in the reaction zone was approximately 1 . 4
Some
The molten slag from
seconds. although for the larger part ic les the time would be greater since they would tend to fa l l back to the bottom.
Residence time for f ine coal part ic les was probably about the same,
From the reaction zone the gases passed through a heat removal zone where 465 ps ig steam was produced, the boi ler feed water being preheated in an economizer. o r i f i ce and plate scrubbers. discharged. f ly ash.
o f product gas. sulfide; a typical H2S concentration was 0.2%.
Ash and ungasif ied carbon were removed by water washing using
The sludge was pumped away and used as f i l l along w i t h boi ler This wash water was sent to a c la r i f i e r before being
In the generator there was approximately 1 mole o f water for every 3 moles Sul fur in the coal was converted predominantly to hydrogen
Equipment Descript ion
Coal Feeding
From a silo, crushed coal was weighed and discharged into a hopper. screw conveyor to control the feed rate discharged into a star seal wh ich was blanketed by C02. A second screw conveyor car r ied the coal into a steam jet pu lver izer where i t was pulver ized to 90% through a 325-mesh screen w i t h 145 ps ig steam. spinner classifier. conveyed by stcam from the pu lver izer to the generator.
A
Oversized part icles from the pulver izer were removed by a Pressure at this point was 125 inches of water. Coal was
184
Jus t before the generator, 95% oxygen at 250 inches o f water p ressure was added to the coal-steam stream. Velocities and d is t r ibu t ion of the pu lver ized coal in the steam-oxygen gas m i x t u r e were cr i t ica l to avoid flashback f rom the generator to the point o f oxygen addit ion. feeder and i t s operation.
F igure Ill i l lustrates the coal pu lver izer
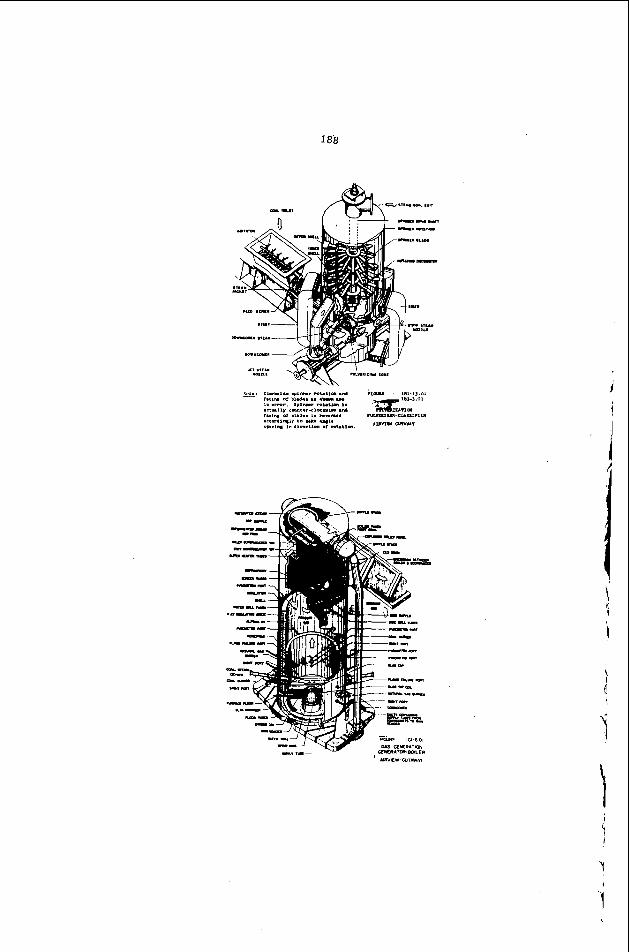
Generator
T h e generator i tse l f was a refractory l ined vessel w i t h the gasif icat ion zone 30 feet high b y 11.4 feet i.d. 15-foot high cast alumina section backed up by two layers of insulat ing br ick , one 9 inches thick and the other 4-1/2 inches th ick. was ins ide a water tube wa l l wh ich was par t of the steam boi ler . containment shel l outside o f th is wall , see F igure IV . the refractories from the bottom and the entire generator was suspended from overhead beams; as i t expanded it elongated downward. downcomers to c i rcu la te water through the tubes to the bo i ler on top. generator floor was made by bending every other water tube inward toward the s lag tap hole which was above the f loor so a 9-inch pool o f slag existed in the generator. 8-1 12-inch opening.
numerous other points. Thermocouples were imbedded in the refractories. There were four water cooled coal burners, so arranged that two could operate at a time, but on ly 180 apart. to assist in keeping the a s h molten. Velocity through the burners was 125 ft . /sec.
The ref ractory lining consisted of a 9-inch th ick
T h i s re f ractory construction
T h e water tubes supported
There were two 16-inch
There was a
T h e
The hole was formed by a p ipe coil in a cone shape to g ive an
Ports were prov ided for temperature measurements near the b u r n e r s and at
These were directed downward toward the slag top opening
Boiler
Gases leaving the reaction zone passed f i r s t through slag screen tubes, and then over the superheater tubes before passing over the boi ler tubes. were positioned in the superheater and boi ler tube sections to remove ash accumulations. in turbines.
Soot blowers
Steam was generated at 465 p s i g and superheated to 78OoF for use
Cas Scrubbers
Fol lowing the bo i l e r tubes, the gas passed through t h e economizer and then th rough a n or i f ice scrubber , a wet cyclone, and a washer cooler before going to the gas holder. wh ich was 10 feet deep and 50 feet in diameter. bottom and clear water was d r a w n of f from the top through a sludge blanket which was formed b y l ighter par t ic les.
Design Basis
T h e wash water from these operations was sent to a la rge c lar i f ier Sludge was removed f rom the
Specifications f o r gas generation were based on the data in Table I.
4 I
G
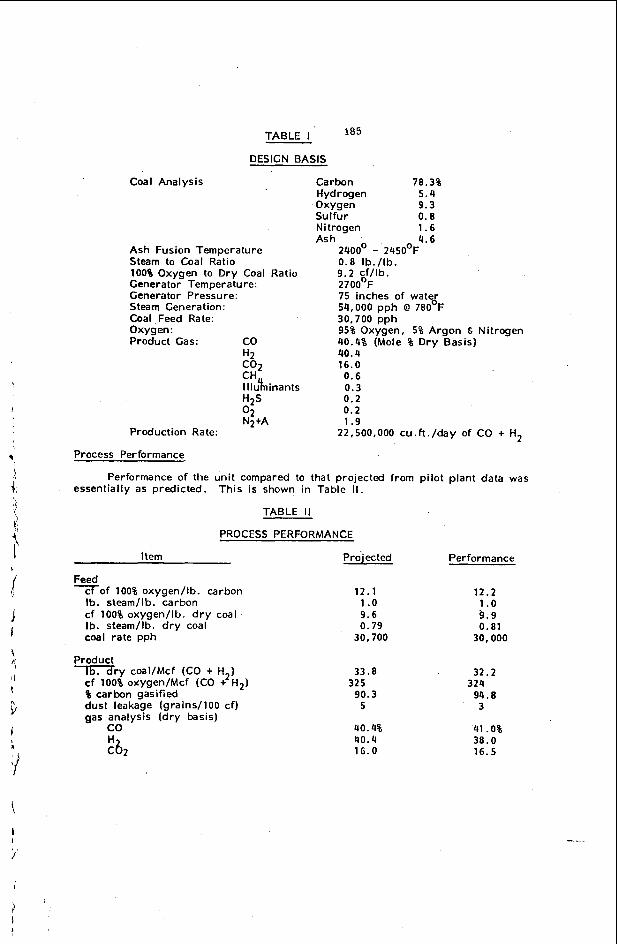
TABLE I ' la5
DESIGN BASIS
I I \
Coa I Analysis
Ash Fusion Temperature Steam to Coal Ratio 100% Oxygen to D r y Coal Ratio Generator Temperature: Generator Pressure: Steam Generation: Coal ,Feed Rate: Oxygen: Product Gas: co
H.,
N;+A Production Rate:
Carbon 78.3% Hydrogen 5.4 Oxygen 9.3 Sul fu r 0.8 Nitrogen 1.6 Ash 4.6
2400' - 245OoF 0.8 Ib./lb. 9.2 c f / lb . 270OoF 75 inches o f water 54,000 pph (? 78OoF 30,700 pph 95% Oxygen, 5% Argon & Nitrogen 40.4% (Mole % D r y Basis) 40.4 16.0 0.6 0.3 0.2 0.2 1.9
22,500,000 cu. f t . /day of CO + H2
Process Performance
Performance of the unit compared to that projected from p i l o t p lan t data was essential ly as predicted. T h i s is shown in Table I I .
TABLE I I
PROCESS PERFORMANCE
Item Projected
Feed -of 100% oxygen/lb. carbon
Ib. steam/lb. carbon c f 100% oxygen/ lb. d r y coal Ib. steam/lb. dry coal coal rate pph
Product T b . r y coal/Mcf (CO + H2)
c f 100% oxygen/Mcf (CO + HZ) 8 carbon gasified dust leakage (grains/100 cf) gas analysis (d ry basis)
co
12.1 1 . o 9.6 0.79 30,700
33.8 325 90.3
5
40.4% 40.4 1t.O
Performance
12.2 1 . o 9.9 0.81 30,000
32.2
94.8 324
' 3
41 .O% 38.0 16.5 I
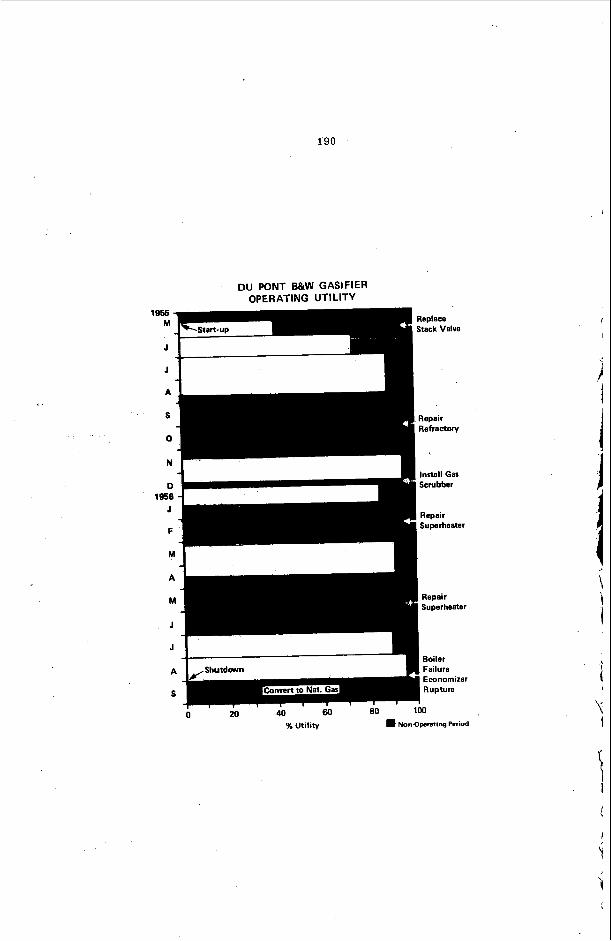
Operating Ut i I i t y 186
Operating u t i l i t y of the unit was hampered by several mechanical diff iculties. Beginning w i th the f low of materials through the unit, operation was interrupted by:
Tramp material in the coal. Pulver ized coal c lassi f ier shaft fa i lure. Flashbacks o f oxygen into burner . Refractory failures. Carbon and ash deposits in boi ler . Superheater and bo i le r tube fai lures. Economizer tube failures. Stack va lve expansion.
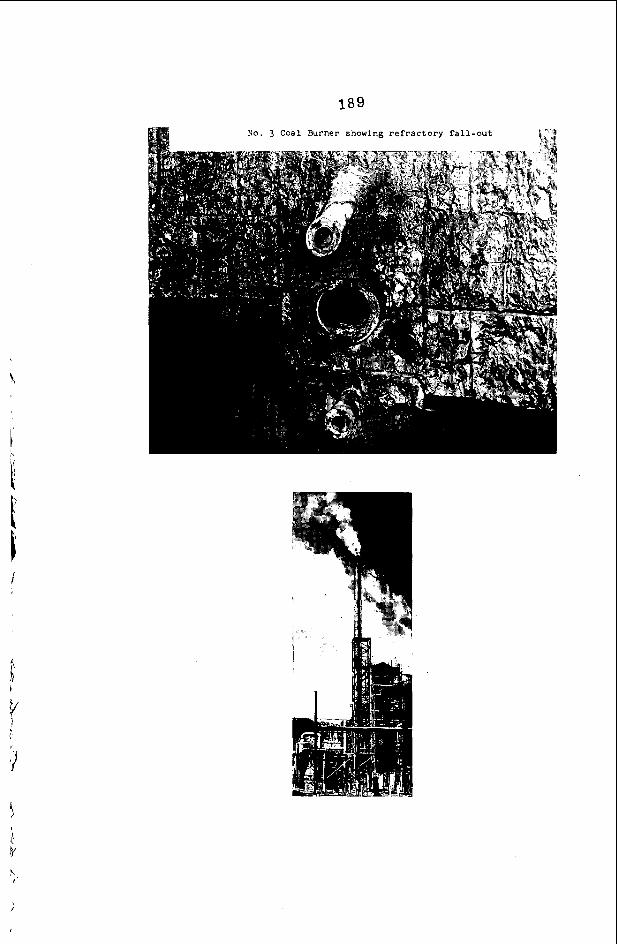
F igure V shows some o f the refractory fa i lure and Figure VI gives the overal l p i c tu re of operating utility from startup in May of 1955 to August of 1956 when the u n i t was shut down and converted to part ia l combustion of natural gas. operation of the commercial u n i t over this per iod totaled about 5,300 hours out of 11,250 hours o r 47% of the time. th is unit.
Actual
Figure VI1 gives an impression of the size of
L i terature Cited
(1) P. R. Crossman and R. W. Curt is, "Pulverized-Coal-Fired Gasif ier for Product ion of Carbon Monoxide and. Hydrogen .I1 Trans. ASMA Paper No. 53-A-49.
2
I
188
189
I
h
D U PONT B&W GASIFIER OPERATING UTILITY
Replace Stack Valve
J
J
Repair Refractory
J
A
S
Install Gas Scrubber
1956 - Repair Superheater
Repair Superheatel
I Boiler ,Shutdown Failure
- , , O B . 40 60 Eo 100 0 20 96 Utility NonOpraIing Period
191
METHANOL FROM COAL
Dennis H. Eastland Davy Powergas Inc.
Houston, Texas
METHANOL FROM COAL
E
INTRODUCTION
Destructive distillation of wood originally provided the source of methanol alcohol. Other developments in the wood industry, namely plywood, for which nearly 40% of the production of methanol finds i ts way with forms of formalde- hyde and associated resins have promoted i t s use and applications.
U.S. annual production in 1973 was close to one billion gallons or the equivalent of a 10,000 tons per day plant. The corresponding world production was 25,000 tons per day. By reason of i ts price and availability in recent years, natural gas was the preferred feedstock.
Some of the properties of methanol a r e given in Table 1.
Table 1 Properties and Other Data on Methanol
Composition Appearance Density Vapor Density Boiling Point Flush Point Ignition Temperature Explosive Limits (a i r )
Calorific Values HHV
Fuel Grade Methanol No. 2 Fuel Oil Western Coal-dry basis
Conversion Factors:
1 Ton $30.28 per ton -
CH30H Clear , colorless .792
1.11 148'F 52'F
800°F Lower 6.0% Upper 36.5% BTU BTU BTU per Ib. per gal. per bbl. 9,760 64,771 2.72 million
19,000 135,000 5.77 million 10,345
301.7 gal. = 19.5MM BTU 10 c/gal. = 1.54 $/MM BTU
Recent developments have brought about a situation that gaseous feed- stocks no longer prevail as a readily available raw material and al ternat ive sources must be considered for the production of synthesis gas, coal being a strong contender.
The extent of the coal reserves has been compared by Linden' with other sources of energy and represents a substantial percentage of t h e recoverable fossil fuel reserves in the U.S.
3
192
Table I1 U . S . Fossil Fuel Reserves
Proven & Currently Estimated Total Recoverable Remaining Recoverable
Natural Gas 0.3 Q 1.5 Q Natural Gas Liquids 0.1 Q Crude Oil 0.2 Q 2.2 Q Shale 0.4 Q 6.0 Q Coal 4.3 Q 28.9 Q
Total 5.2 38.7
Q = 10'' BTU
In i t e m s of heating value, coal represents 75 to 80 percent of these resources. A t t h e current r a t e of consumption, 650 million tons per annum, these coal reserves can last well into the next century.
In comparison, a 5000 ton per day fuel grade methanol plant would con- sume about 4 million tons per annum of coal and give a daily output of about the eq9valent of 90-95 MMSCFD of natural gas.
The applications of fuel grade methanol a s a l ternate fuels have been reported extensively in the literature. R e y n t interest as a feed for gas turbines has been reported by Power & Marine Systems a subsidiary of United Technologies Corporation with tests at the St. Petersburg installation of Florida Power Corporation.
METHANOL FROM COAL
Historical Background
The price and availability of natural gas led to the early introduction in the U.S. of this mater ia l as a feedstock for t h e production of synthetic methanol. The conversion of t h e 30 ton per day plant in Peoria in 1932 to a methanol-from- natural gas unit was the forerunner of the industries transformation leading to plants up to t h e 2,000 tons per day range which have been in successful operation over the last few years.
Prior to the advent of natural gas, solid fuels had been the main sources of the raw mater ia l for t h e production of synthesis gas. In areas such as Europe, Asia and S. Africa where natural gas was not available, coal became established as t h e backbone of the ammonia and methanol industries and where suitable economics prevail these plants continue t o operate. Recently a plant was com- missioned in Modderfontein which manufactured both ammonia and methanol f rom coal. Hence, t h e technology is still available and can be readily updated to
193
i
sui t U.S. conditions. Present designs incorporate t h e improvements which have evolved since the early 1920’s when t h e plants f i rs t came into operations with high pressure synthesis processes.
The last unit to employ coal as a raw mater ia l for methanol synthesis in t h e U.S. was s tar ted up in Belle, W. Virginia using a B & W/DuPont oxygen blown gasifier and operated for about 15 months, gasifying approximately 400 T/D of coal to produce 24 MMSCFD of synthesis gas; about 1/3 of t h e output required for the 285 ton/day high pressure methanol facility t h a t was in operation on t h a t site.
Other installations tha t manufactured methanol from coal were located in Billingham Heysham and Dowlais in t h e United Kingdom (cyclic water-gas gassification with H.P. methanol). Leuna in E. Germany (Winkler gassification with H.P. methanol and Mayengibe Paris, France (Koppers-Totzek.
Methanol Synthesis
The growth of t h e synthetic methanol business from one million gallons per annum in 1927 to 80 m i l l i o ~ g a l l o n s per annum in 1947 has been described by Kastens, Dudley and Troeltzsch .
Recent interest in methanol as an al ternate fuel has resulted in a number of conferences “y‘ papers. A critical analysis of these la tes t developments was given by McGhee at t h e Engineering Foundation Conference in New Hampshire in July 1974. Whilst emphasizing the reduction in energy requirements f rom 4 to 2 BTU per BTU of methanol, his paper contains a useful bibliography on the new low pressure 50/100 a t m process, as compared to t h e high pressure up to 1,000 a t m processes.
The amount of natural gas being flared was mentioned by Harrison’ in a recent symposium on synthetic fuels. This gas could be utilized as par t of a concept of transporting energy in the form of fuel grade methanol as opposed to LNG and it has been demonstrated tha t designs of units of 5,000 tons per day capacity a r e perfectly feasible and incorporate features of plants already in existence. In addition, checks with equipment suppliers indicate t h a t such i tems as the methanol converter can be manufactured in the sizes required for a jumbo methanol unit.
Schemes have been proposed for up to 25,000 tons per day of methanol (corresponding to 480 billion BTU/day of product). These should be compared with the coal to SNG projects based on western coals which have normal capaci- ties of 250 billion BTU/day of pipeline quality gas at 1,000 psi.
Later in this paper we will touch briefly on the economics of these large size units and t h e change in emphasis in capital investment which is about 20% for methanol synthesis in a coal based unit compared with about 40% in a gas based unit.
194
Coal Gasification
Early gasification processes da te back to the last century; for example in 1883 Ludwig Mond designed a producer gas unit employing air as t h e gasifying medium for 200 tons/day of coal. This type of unit became the forerunner for the semi-water gas plant designed to produce synthesis gas at low pressure to feed t h e Haber process for ammonia which went into operation in Germany at Oppau in 1913. Synthetic methanol was f i rs t produced on the industrial scale by BASF in Germany in 1923. Coke from gas ovens often was t h e most popular feedstock for these cyclic plants of which well over 1,000 units were put in operation.
Gasification of inferior fuels such as brown coals and lignite developed with t h e invention of t h e fluidized bed Winkler process in 1926 which also had the advantage of being a continuous process. To date , there have been built 36 units in 16 plants around t h e world.
Some of the disadvantages of gas compression from atmospheric pressure was overcome by t h e development between 1933/36 of t h e Lurgi process. This is somewhat offset by the high methane content of the gas produced as well as the need for ex t ra equipment to deal with naphthas, t a rs and phenols which appear as by-products. To date , about 63 units in 13 plants have been put into operation and there has been considerable interest in t h e pilot plant work carried out on the Lurgi plant in Westfield Scotland to methanate the gas to produce SNG.
Where oxygen and s team a r e used as the gasification medium, the Koppers-Totzek process can handle most types of coal in the entrained fuel gasifher which requires pulverized fuel. The higher temperature of gasification, 2200 F, results in no heavy hydrocarbon being carried forward, and the gas, af ter purification, can b e utilized for production of methanol or ammonia. Fifty-two units of this type have been reported in 20 plants worldwide.
Although there are many other processes in different s tages of develop- ment, it can b e seen t h a t coal gasification is not a new and untried field of operation and indeed as recently as 1955 has been used for the production of synthesis gas in the U.S.
To prepare t h e raw gas from t h e gasification section for methanol syn- thesis requires several additional processing steps, namely:
1. compression 2. shift conversion 3. acid gas removal
all of which have been in commercial operation for many years. Each of these processing s teps can be found in any modern day ammonia or methanol plant, regardless of t h e feedstock being processed.
195
1
k
The exac t combination of process s teps to convert coal to methanol will vary depending upon t h e gasification scheme selected and t h e economics of by- product production. Figures I, 2, 3 and 4 present four possible alternatives.
As a typical example, the following (see Figure 5 ) is a more detailed description of a methanol from coal facility based on the Winkler gasification technology available f rom Davy Powergas:
Winkler Coal Gasification
Coal Preparation. The run-of-mine coal f rom storage pile is conveyed to t h e crushers where the coal is crushed to a particle size of 3/8" x 0. If predrying of the coal is required, fluid bed dryers may be utilized to reduce the moisture level to that required. In t h e dryer, hot air, heated by t h e combustion of coal, is used to fluidize the coal and supply t h e heat necessary for drying. Most of the dried coal is removed directly from the fluid bed. However, a portion is entrained in t h e hot gases leaving the dryer. A cyclone recovers most of the entrained coal, and it is returned to t h e dryer product coal and conveyed to t h e gasification section. The hot gases from cyclone a r e scrubbed with water for particulate mat te r removal before venting to atmosphere.
Coal Gasification. The coal feed is conveyed to the gasifier through lock hoppers and screw conveyors. The gasifier is maintained as a fluidized bed operation under moderate pressure. A mixture of s team and oxygen is injected at several points within t h e bed to gasify t h e coal while s team alone is injected into the bottom most level to fluidize t h e coal and to cool t h e larger ash par- ticles discharging &rom t h e gasifier bottom. The high bed temperatures, typically 1700-2200 F, a r e obtained by t h e partial combustion of t h e coal's carbon and contained hydrocarbons. Due to t h e relatively high temperature of gasification, the tars, gaseous hydrocarbons and carbon present in the coal a r e converted to carbon monoxide, hydrogen, and carbon dioxide. Only a small percentage of methane remains in the raw product.
The primary coal gasification reactions are:
c+o =co c+co = 2 c o C + H 8 = CO+ H C + 2620 = C02 +?H2
c + 050, =Eo (exothermic) (exothermic) (endother mic) (endothermic) (endother mic)
At a constant coal feed ra te to the Winkler generator, the ratio of oxygen and s team to coal is controlled t o maintain t h e desired bed temperature. Optimum bed temperature is a compromise between product gas calorific value, carbon efficiency and overall thermal efficiency, but is limited by t h e ash softening temperature. If the ash softening temperature is exceeded, the ash may fuse and agglomerate, thus upsetting t h e fluidization characteristics of t h e bed and possibly plugging the reactor.
196
As a result of the fluidication, the particles of ash and their contained carbon a r e segregated according to s ize and specific gravity, Le., t h e heavier particles fall down through the fluidized bed and pass into t h e ash discharge unit at t h e bot tom of t h e generator while t h e lighter particles a r e carried up out of the bed by the product gas. Approximately f i f ty to seventy-five percent of the incoming ash will be entrained in t h e hot product gases leaving t h e top of the Winkler generator. The exac t quantity entrained with a given gas velocity, is primarily dependent upon the particle size distribution of t h e feed coal. Since t h e height of t h e fluidized bed is relatively small compared to t h e total height of t h e generator, the upper or major portion of t h e generator is available to perform two other functions; firstly, to further gasify any entrained carbon particles, and secondly, to ef fec t a separation of any heavier solid material. To aid this fur ther gasification, a portion of t h e s team and oxygen is added to the generator near t h e upper limit of the fluid bed.
The unreacted carbon in t h e discharged ash is a function of gasifier tem- perature and coal reactivity. Generally, reactivity varies inversely with geo- logical age, lignites being the most reactive.
Gas Cooling and Part iculate Removal
The hot gases leaving t h e generator pass through the hea t recovery train where heat is removed from t h e gas by generating and super-heating high pressure s team and preheatin& boiler feedwater. The hot Winkler product gas is cooled to approximately 300 F in the heat recovery train. High pressure steam in excess of t h a t required by the process is generated and therefore available to drive the product gas compressors and/or the compressors in the air separation plant.
The heavier char particles leaving t h e bot tom of the gasifier pass out of t h e system and t h e balance of t h e char is carr ied out of t h e gasifier in the overhead product gas. The bulk of this char is removed in t h e hea t recovery train and in cyclones. In combination, the heat recovery train and cyclones are designed to remove approximately 85% of the entrained solids. The char thus removed will be utilized as supplementary fuel in t h e boiler house. The gas from t h e cyclone flows through the venturi scrubber where t h e remaining char is removed to a level of 1 grain/1,000 SCF.
Production of Methanol
The methanol plant contains t h e following sections to process t h e raw gas f rom the coal gasification plant:
1. Raw Gas Compression
A
2. Gas Shift Conversion
3. Acid Gas Removal
197
4. Methanol Synthesis and Purification
5. Sulfur Recovery
6.
7. Offsites
Oxygen Production for Coal Gasification
A description of each section is a s follows:
Raw Gas Compression. The methanol synthesis is conducted at approxi- mately 100 Ats. and i t has been found t h a t it is more economical to compress the gas exiting t h e gasification unit prior to fur ther processing. The cooled and the dust f ree gas from t h e coal gasification section is compressed to 1480 psig in s team turbine driven compressors.
The purpose of the shif t conversion s tep is to adjust t h e rat io of carbon monoxide to hydrogen t o t h a t required for t h e methanol synthesis according to the exothermic shift reaction:
Gas Shif t Conversion.
CO + H20 = C02 + H2
An exi t CO content of 6.4 volume percent in the shifted gas is achieved in a one stage shif t conversion reactor and a par t of t h e compressed gas is by- passed around the shift reactor, cooled and mixed with the cooled shift effluent to yield an average CO content of approximately 20%. The compressed gas to the shift reactor is mixed with the shift reaction s team to give a 1.0 ra t io of steam to the dry gas and preheated by heat exchange with t h e hot eff luent gases from the shift reactor prior to i ts introduction to the reactor which contains a sulfur resistant catalyst. From the interchanger, t h e shif t effluent is cooled in a ser ies of waste heat recovery exchangers.
Acid Gas Removal. The Rectisol process has been selected to remove the acid gases as i t has the advantage of using t h e plant product as the scrubbing medium. This process was developed by Linde and Lurgi in Germany and plants presently in operation have been designed by both companies.
The Rectisol process absorbs CO and H S f rom t h e shifted synthesis gas s t ream using methanol. C02 is rejected?o t h e a?mosphere and a hydrogen sulfide rich gas is available for the sulfur recovery in a Claus Plant. These s t reams a r e obtained by selectively regenerating the methanol from t h e absorber in a two stage regenerator system. Low pressure nitrogen from the air separation section is used to strip carbon dioxide from t h e rich methanol solution in the f i r s t s tage regenerator. Stripped solution from t h e first s tage regenerator is stripped of i t s hydrogen sulfide by a s team heated reboiler in the second s tage regenerator. The H S st ream flows to the Claus unit for sulfur recovery and t h e purified Synthesis g62s is now ready for methanol synthesis. The carbon dioxide content of t h e synthesis gas is controlled by mixing a desulfurized side s t ream of high carbon dioxide content from t h e absorber with the absorber overhead.
!
198
Methanol Synthesis and Purification. The unique fea ture of this process is the synthesis step, utilizing a copper based catalyst specially developed by ICI, which gives good yields of methanol at low temperatures (410°F to 520'F). The high act ivi ty of the catalyst at low temperature permits the reaction to be carried out at pressures as low a s 750 psig and is the key to t h e economy of the process. By-product formation is minimized a s a result of t h e low operating temperature, thus leading to high process material efficiencies.
Final t races of sulfur are removed f rom t h e synthesis gas by a bed of zinc oxide a f t e r preheating to desulfurization temperature. A bed of chloride catch is also provided to prevent chloride poisoning of the synthesis catalyst. After cooling, t h e make-up synthesis gas enters t h e synthesis loop at t h e inlet of the circulator compressor. The mixture of unconverted gas and fresh make-up gas is preheated to reaction temperature in the converter interchanger by the hot gases leaving t h e converter. The methanol synthesis converter is a pressure vessel containing a single bed of catalyst. Temperature control is effected by injecting cold gas a t appropriate levels into the catalyst bed.
The feed gas and the cold shot gas combine and reac t to form methanol as they pass downwards over t h e catalyst. The converter ex i t gas is first cooled in the converter interchanger and subsequently in the crude methanol condenser where t h e c rude methanol product is condensed. Crude product is separated in the high pressure separator.
The non-reactive components of t h e make-up gas, methane and nitrogen are purged from the synthesis loop between the separator and t h e point of make- up gas addition and are subsequently used as boiler fuel.
The crude methanol collected in the separator is l e t down in a single stage to t h e let down vessel and t h e resultant product passes to t h e distillation plant. To provide some independent operation of the synthesis and distillation units, the crude can alternatively be pumped to crude methanol storage.
Flash gas from t h e letdown vessel (mostly dissolved gases) is mixed with the synthesis loop purge s t ream and used as fuel.
The c rude methanol is processed in a single column system to fuel grade methanol, and the overall efficiency of t h e distillation system is expected to be 99% at the end of life conditions.
The upper section of the column removes t h e light ends, principally dimethyl e ther , methyl formate, aldehydes, ketones, and lower paraffin hydro- carbons while t h e sections of t h e column below the feed t ray is designed to remove water. Fusel oil (predominately alcohols such a s isobutanol) is purged from a tray near the base of the column. In order to reduce organic and thermal losses in t h e eff luent water stream, the fusel oil is subsequently blended back into t h e product fuel grade methanol. The fusel oil may be utilized as fuel if chemical grade methanol is the desired product.
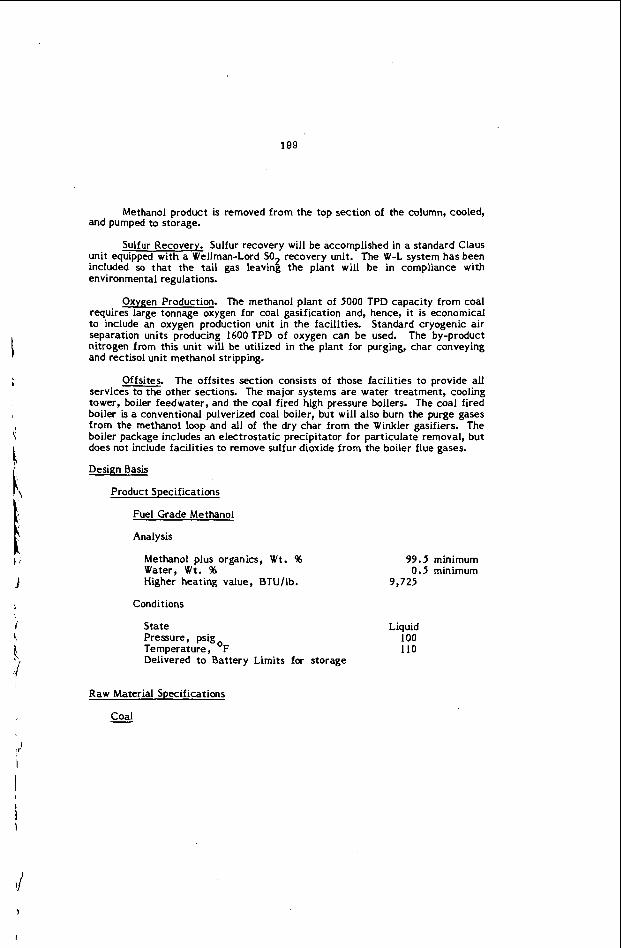
199
I L
Methanol product is removed f rom the top sect ion of the column, cooled, and pumped to storage.
Sulfur Recovery. Sulfur recovery will be accomplished in a standard Claus unit equipped with a Wellman-Lord SO2 recovery unit. The W-L system has been included so t h a t t h e ta i l gas leaving t h e plant will be in compliance with environmental regulations.
Oxygen Production. The methanol plant of 5000 TPD capacity f rom coal requires large tonnage oxygen for coal gasification and, hence, i t is economical to include an oxygen production unit in t h e facilities. Standard cryogenic a i r separation units producing 1600TPD of oxygen can b e used. The by-product nitrogen from this unit will be utilized in t h e plant for purging, char conveying and rectisol unit methanol stripping.
The offsites section consists of those facilities to provide al l services to t h e other sections. The major systems a r e water treatment, cooling tower, boiler feedwater, and the coal fired high pressure boilers. The coal fired boiler is a conventional pulverized coal boiler, but will also bum the purge gases f rom the methanol loop and all of the dry char from t h e Winkler gasifiers. The boiler package includes an electrostatic precipitator for particulate removal, but does not include facilities to remove sulfur dioxide from t h e boiler flue gases.
Offsites.
Design Basis
Product Specifications
Fuel Grade Methanol
Analysis
Methanol plus organics, W t . % Water, W t . % Higher heating value, BTU/lb.
Conditions
S ta te Pressure, psig Temperature, OF Delivered to Battery Limits for s torage
99 .5 minimum 0.5 minimum
9,725
Liquid 100 110
Raw Material Specifications
Coal - ;,I I
I
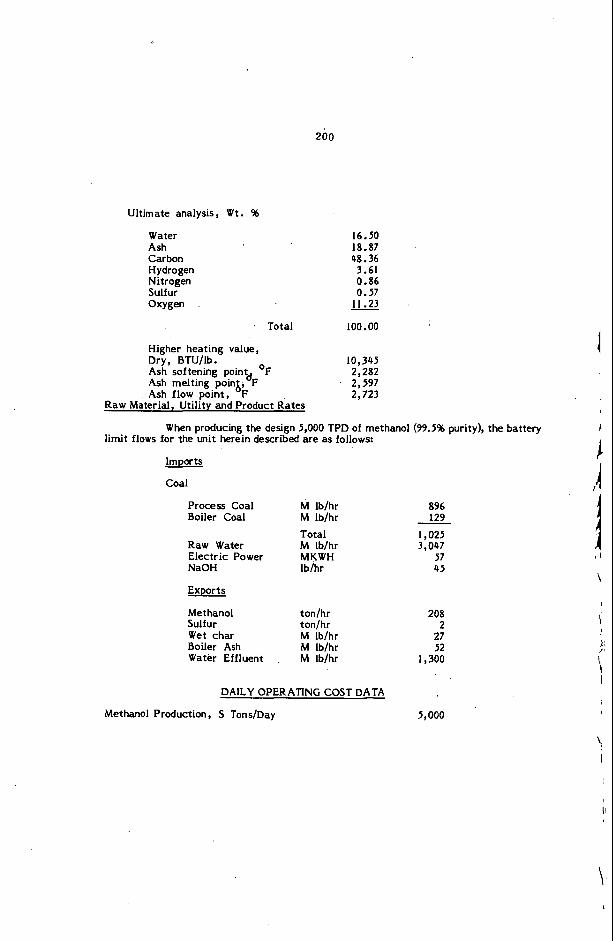
200
Ultimate analysis, W t . %
Water 6.50 Ash 18.87 Carbon 48.36
Nitrogen 0.86
Oxygen 11.23
Hydrogen 3.61
Sulfur 0.57
’ Total 100.00
Higher heat ing value, Dry, BTU/lb. 10,345
Ash melting poin&,dF 2,597 Ash flow point , F 2,723
Ash softening point OF 2,282
Raw Material, Utility and Product Rates
limit flows for the unit herein described a r e as follows: When producing the design 5,000 TPD of methanol (99.5% purity), t h e battery
Imports
Coal
Process Coal M Ib/hr Boiler Coal M Ib/hr
Raw Water M Ib/hr Electr ic Power MKWH NaOH Ib/hr
Exports
Methanol ton/hr Sulfur ton/hr Wet char M Iblhr Boiler Ash M Ib/hr Water Effluent , M Ib/hr
Total
DAILY OPERATING COST DATA
Methanol Production, S Tons/Day
896 129
I, 025 3,047
57 45
208 2 27 52
1,300
5,000
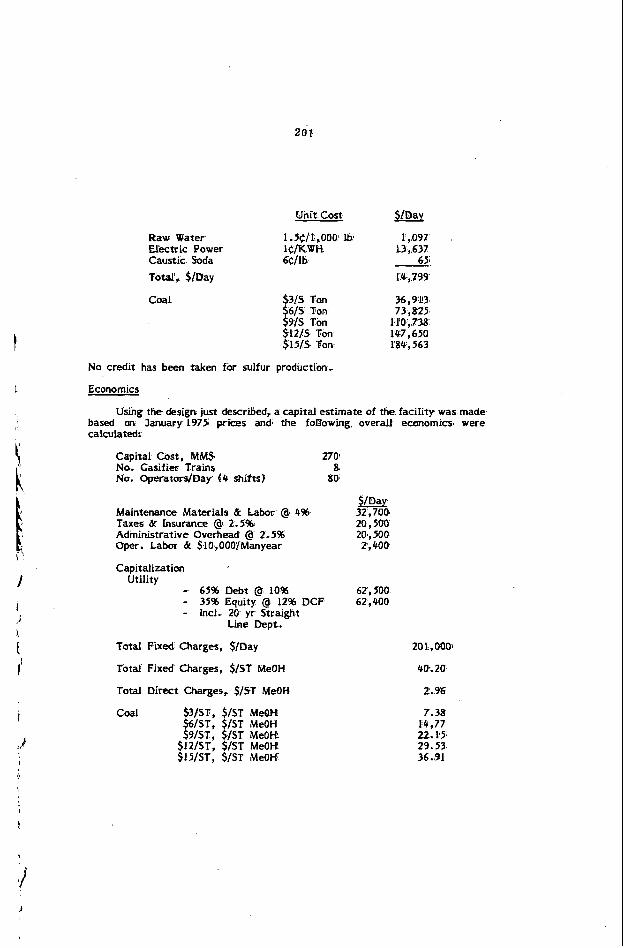
20 1
/
I' I
Unit. Cost
Raw Water 1.5CII ,000~ b 1,097 Electric Power ic/tcwn U ,637 Caustic Soda 6C/lb 651 Total', $/Day 14,799
Coal $31s T m 36,983 $6/S Ton 73,825 $9/S Ton into, na $12/S. Ton 147,650 $ W S Ton1 184,563
NO credit has been taken for sulfur production,
Economics
Using t h e design just described, a capital est imate of the facility was made based an January 1975. prices and, the foHowM. overaU economics were calculated:
Capital Cost, UM$ 2701 No. Gasifier Trains a! No. O g e r a t d D a y (4 shins7 IF0
$&y Maintenance Materiafs & Labor @ 4% 32,700 Taxes & hsutance @I 2.5% 20,500 Administrative Overhead @ 2.5% 20*, 500 Oper. Labor & $10,00O/Manyear 2,400
Capitalization Utility - 65% Debt @ 10% 62,500 - 35% Equity @ 12% DCF 62,400 - Incl. 20 yr Straight
Line Dept.
Total Fixed Charges, $/Day
Total Fixed Charges, $/ST MefJH
Total Direct Charges, $/ST MeOH
Coal $31ST, $/ST MeQH $6/ST, $/ST MeOH S9IST. $/ST MeOH
$12/ST; $/ST MeOH $I5/ST, $/ST MeOH
201,000~
4@-20
Z. 9 6
7-38 14,77 22. P5 29.53 36.91
\
202
PRESSURIZATION OF THE WINKLER PROCESS
The Winkler process for the gasification of coal has provided gas for fuel or power, for synthesis of methanol and ammonia, for Bergius-Hydrogenation, and for t h e production of hydrogen in Europe and Asia when coal was the only raw material available. All of those commercial installations were designed and operated so that, a f t e r cooling and particulate removal, the product gas would be delivered at nominally atmospheric pressure. The reason for t h e low pressure operation was that , at t h a t time, German regulations favored atmospheric pressure plants, i.e., operating pressures above 1.5 ata (7 psig) c rea ted problems in t h e areas of mater ia ls and government supervision.
In mid 1972, Davy Powergas undertook a study to determine whether or not a Winkler gasifier operating under these proven conditions would be com- pet i t ive with other available technology. Within the accuracy of the est imates made, none of the commercial processes appeared decisively bet ter than any of t h e others and hence, review was begun of the Winkler process to determine what constituted i t s limitations for current U.S. conditions. I t became rather obvious t h a t the biggest deficit w a s t h e low pressure of operation since t h e detrimental effects of low pressure operation a r e threefold:
1. Large s ize equipment to handle t h e large volume of gas. 2. High capital cost attributable to t h e product compression station. 3. High daily operating cost of power for product compression
Process economic studies were conducted to find t h e optimum pressure ranges and to assess the magnitude of savings attributable to pressure operations. Three separate studies were completed a s defined below:
Case I - Effect of gasification pressure on the production cost of low/medium BTU fuel gas using air/oxygen a s t h e gasifying medium. The final fuel g a s is delivered at 210 psig, with a maximum of 100 ppm of sulfur.
Effect of gasification pressure on the production cost of 5,000 STPD of methanol.
Effect of gasification pressure on t h e production cost of 1200 STPD of ammonia.
C a s e 11 -
C a s e 111 -
The general conclusions were encouraging as outlined below.
1. General Conclusions
203
\ I
.I
I t may be concluded that an increase in gasifier operating pressure results i n a decrease in the overall cost of product. I t becomes apparent that the greatest savings may be at t r ibuted to a decrease in the number of gasification trains required for a given output. Although there a re significant savings in the compression require- ments for the higher pressure case, the number of gasifiers remains constant. Despite the f a c t t h a t the size of each gasifier has de- creased, the increase in cost of the higher pressure design outweighs the net savings in compression, resulting in a slight increase in overall production cost.
The greatest decrease in the number of gasifiers occurs between 20 psia and 43 psia, for example, the plant for t h e production of 5,000 ST/D of methanol would require 12 gasifiers at 20 psia a s compared with 8 a t 43 psia.
From examination of graphs, i t was deduced t h a t the optimum op- erating pressure for the gasifier, depending upon the final product, lies between 120 and 180 psia. The one case which does not neces- sarily follow these conclusions is the integration 0 1 a Winkler system with a combined cycle power plant. In this case the air compression is provided by the gas turbine--compressor system, and as a result, the optimum gasification pressure is the highest permitted by the air delivery pressure.
2. Methanol Systems
Figures 6 and 7 present the cost of producing 5,000 ST/D of methanol from western sub-bituminous coal. Since methanol may be considered either a bulk chemical, o r a liquid chemical fuel, the production costs ref lect both typical utility financing (Figure 6 ) and typical industrial financing (Figure 7). Although there a r e but small savings in production cost over the range of gasifier pressures of 43-213 psia, the minimum production cost occurs at approximately 150 psia generator pressure.
The improvement in capital and operating costs resulting from pressuriza- tion is shown clearly in Figure 8 which also compares a l ternat ive processes such as steam reforming and partial oxidation for the production of synthesis gas.
ACKNOWLEDGEMENTS
The author would like to acknowledge permission from Davy Powergas Inc. to publish this paper and thanks a re especially due to his colleagues for their assistance in i t s preparation.
4 I
204
REFERENCES CITED
1. H. R. Linden - Southern Gas Association Meeting Houston, April 23, 1974.
Press Release April 17, 1975, Power & Marine Systems, Farmington, Connecticut.
M. 1. Kastens, J. F. Dudley & J. Troeltzsch Ind. Eng. Chem 40 2230 1984.
R. M. McGee - Engineering Foundation Conference New Hampshire, July 1974
G. E. Harrison, "Fuels of the 1980's & 1990's", London Chemical Engineering Congress, May 14, 1975.
2.
3.
4.
5 .
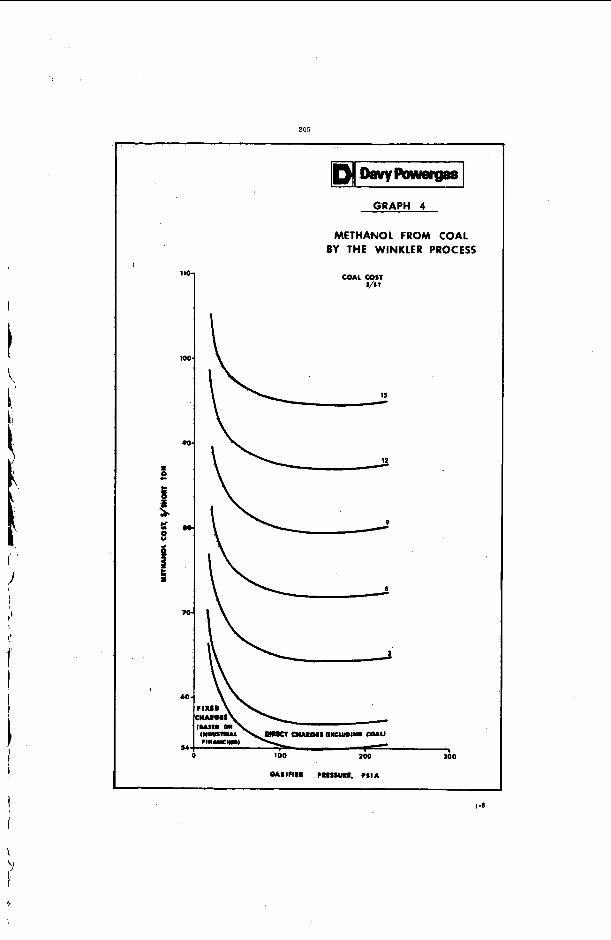
205
11
m
a
7
GRAPH 4
METHANOL FROM COAL BY THE WINKLER PROCESS
COAL COST ,/I 1
* 100 zoo 300
? I
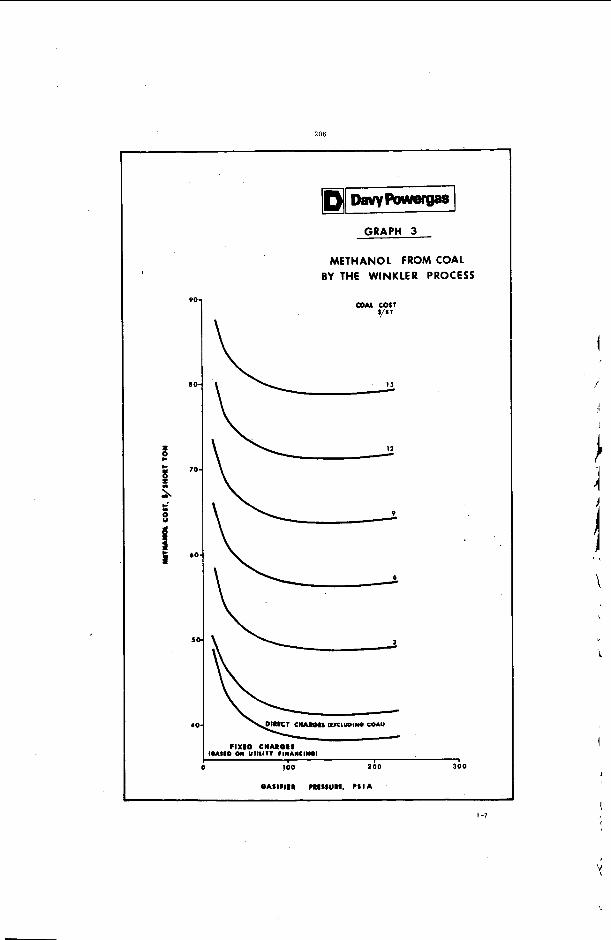
206
GRAPH 3
METHANOL FROM COAL BY THE WINKLER PROCESS
OASlClIR PRlSSURI. P S I A
' I
i
1-7
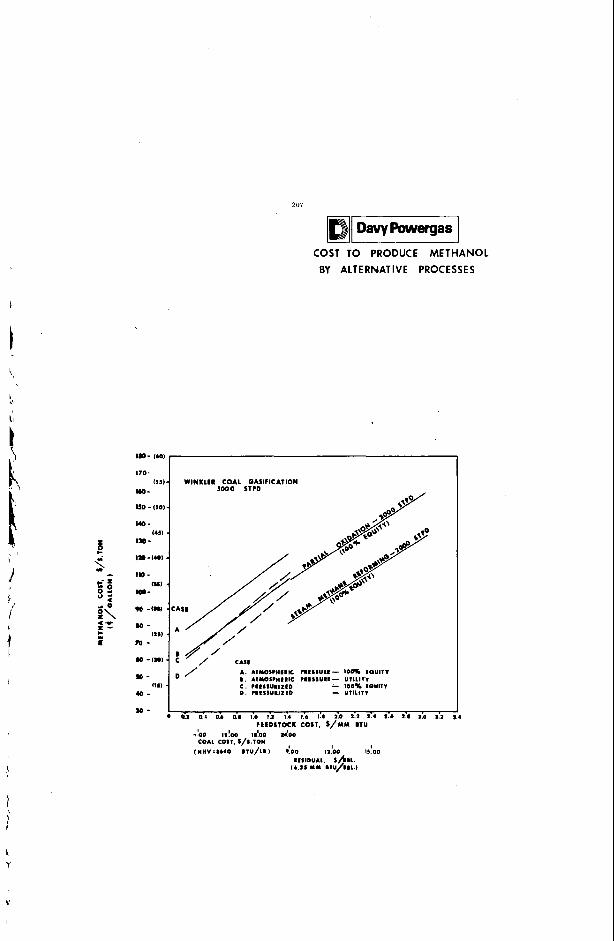
207
COST TO PRODUCE METHANOL BY ALTERNATIVE PROCESSES
!
!\ \I
t [
I I. I
1w- im
170-
yo-
110 - 110
uo- 110 -
I33
14s)
in -iw
110 - IOQ-
90 -lR
w -
m -
Nl
12s)
LO -in)
P -
40-
30-
ile)
WINKLER COAL OASIFICATION 5 0 0 0 ST ID
A. AIMOS?HIIIC r I I l S U I I - 100% IOU111 I, ATMOSPMIRIC P I I S S U I I - U I l L l l T c . P I I e S U I I z I D D . P I I S I U R I I I O - u11111'1
- l o o x ioulvv
dz 0'4 o i a i 1.0 1.2 1.4 1 . i ih 2.0 2.1 2.4 2.6 2.1 1.0 1.1 FEEDSTOCK COST. $//urn @TU
?'DO I2lW Id00 HllO COAL COST. l / S . l O M
l M H V * i b 4 O I I U / L I l i o 0 l l ! O O S r O O RIllDUAL l / h .
1b.21 MY ' IlU/IIL.)
Y
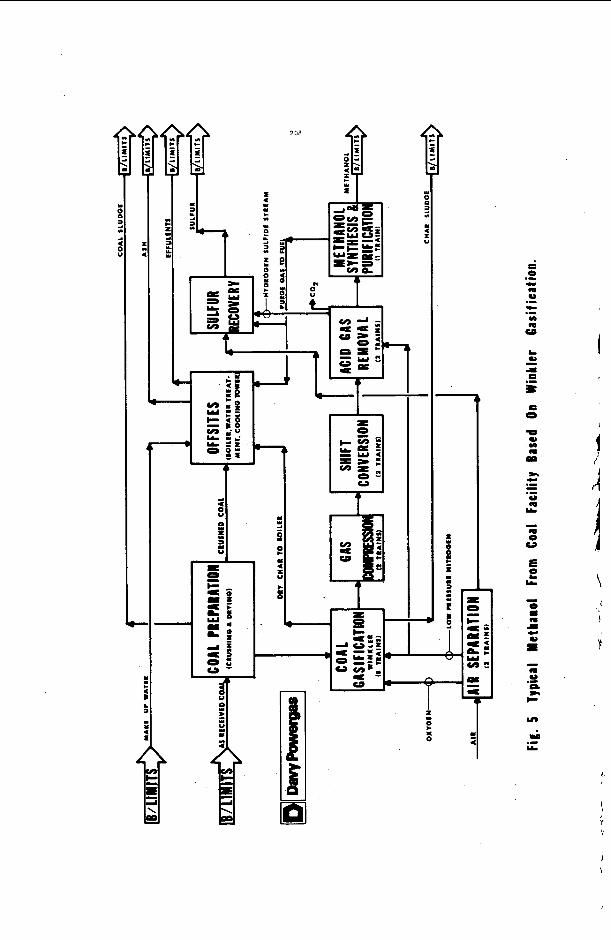
'1 208
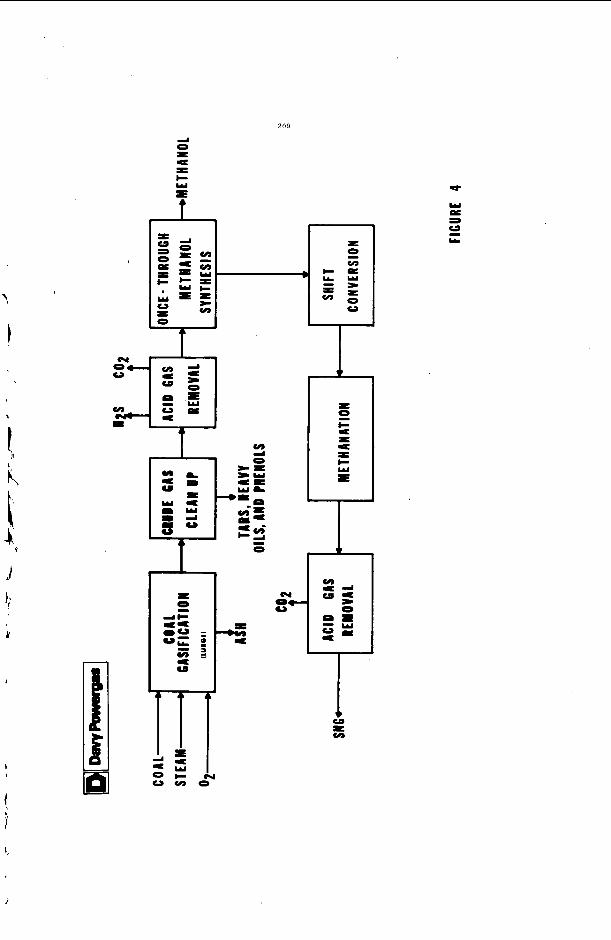
309
4 0 L U = c w E t
I b
Y
1
1
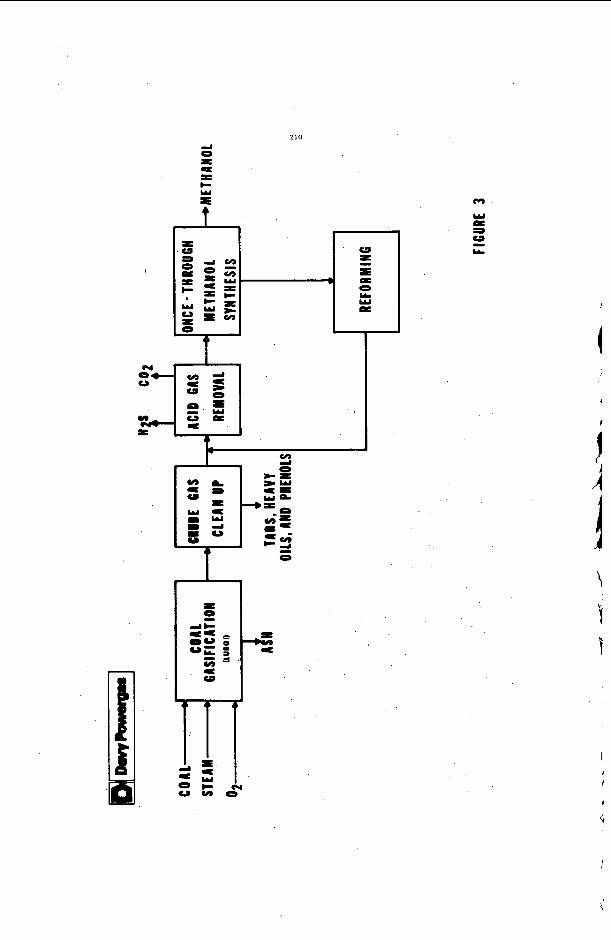
210
f
m
I
1 A
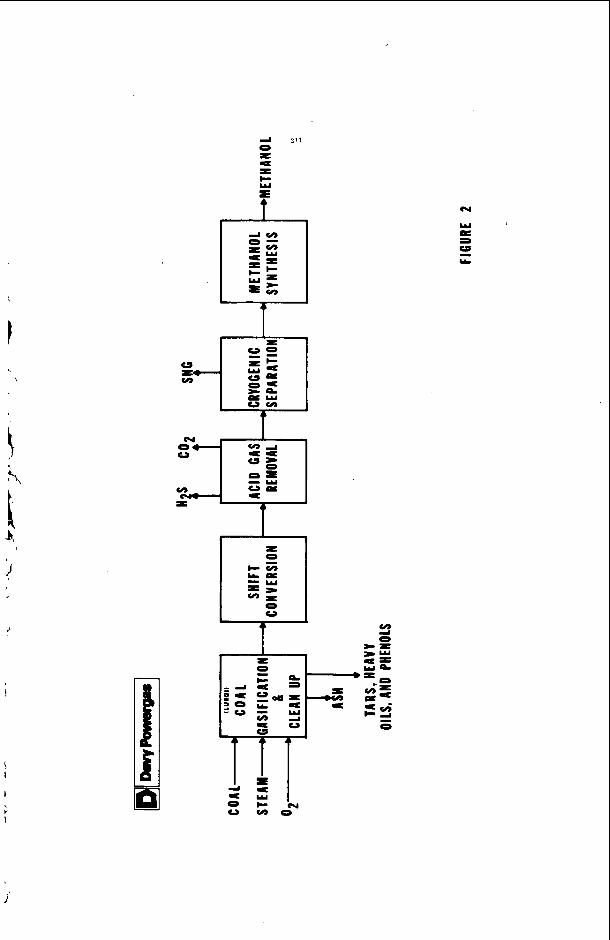
!
I \
!
Y m
u, Y
V
I
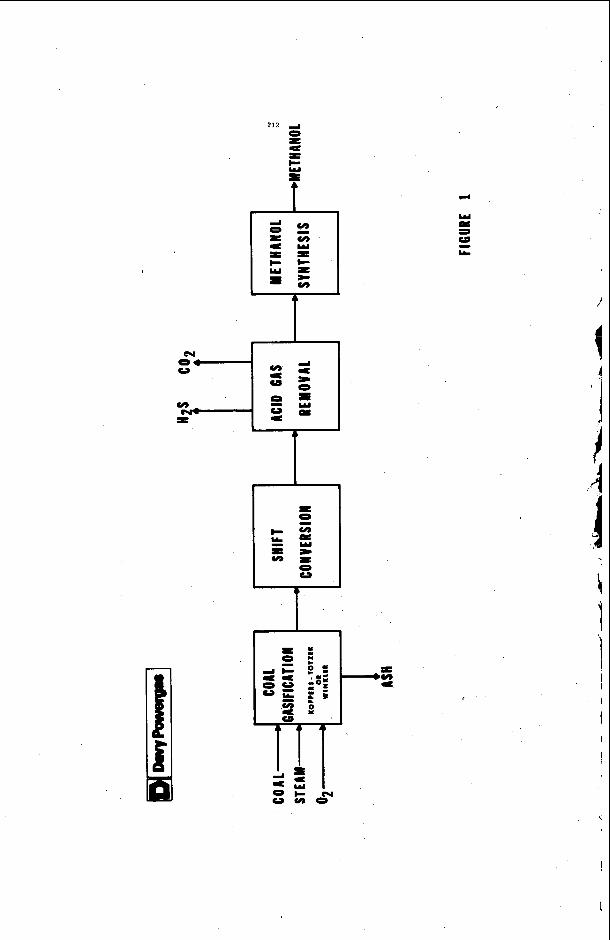
c