Embed Size (px)
Citation preview
EPA-821-R-01-007January 2001
Method 1688
Total Kjeldahl Nitrogen in Water and Biosolids by AutomatedColorimetry with Preliminary Semi-automatic Digestion
DRAFTJanuary 2001
U.S. Environmental Protection AgencyOffice of Water
Office of Science and TechnologyEngineering and Analysis Division (4303)
1200 Pennsylvania Ave., NWWashington, D.C. 20460
Method 1688
Draft, January 2001ii
Acknowledgments
This method was prepared under the direction of William A. Telliard of the U.S. Environmental ProtectionAgency's (EPA's) Office of Water (OW), Engineering and Analysis Division (EAD). The method wasprepared under EPA Contract 68-C-98-139 by DynCorp Information and Enterprise Technology.
Disclaimer
This draft method has been reviewed and approved for publication by the Analytical Methods Staff withinthe Engineering and Analysis Division of EPA. Mention of trade names or commercial products does notconstitute endorsement or recommendation for use. EPA plans further validation of this draft method. Themethod may be revised following validation to reflect results of the study. This method version containsminor editorial changes to the November 1999 version.
EPA welcomes suggestions for improvement of this method. Suggestions and questions concerning thismethod or its application should be addressed to:
Maria Gomez-TaylorEngineering and Analysis Division (4303)U.S. Environmental Protection Agency1200 Pennsylvania Ave., NWWashington, DC 20460Phone: (202) 260-7134Fax: (202) 260-7185
Method 1688
Draft, January 2001 iii
Note: This method is performance based. The laboratory is permitted to omit any step or modify anyprocedure provided that all performance requirements in this method are met. The laboratory maynot omit any quality control analyses. The terms "shall," "must," and “may not” define proceduresrequired for producing reliable results. The terms "should" and "may" indicate optional steps thatmay be modified or omitted if the laboratory can demonstrate that the modified method producesresults equivalent or superior to results produced by this method.
Draft, January 2001 1
Method 1688
Total Kjeldahl Nitrogen in Water and Biosolids by AutomatedColorimetry with Preliminary Semi-Automatic Digestion
1.0 Scope and Application
1.1 This method describes procedures for the determination of total kjeldahl nitrogen (TKN) and/ororganic nitrogen in drinking, ground, and surface water; domestic and industrial waste; and biosolids(municipal sewage sludge). Automatic digestion of the sample is followed by analysis usingautomated colorimetry. This method is based on U.S. Environmental Protection Agency (EPA)Method 351.2: Nitrogen, Kjeldahl (Colorimetric; Semi-Automated Digester, AAII) (Reference16.1). This method is associated with Method 1691: Municipal Biosolids Sampling Guidance(Reference 16.2).
1.2 This method is to be used in EPA’s data gathering and monitoring programs under the Clean WaterAct, the Resource Conservation and Recovery Act, the Comprehensive Environmental Response,Compensation, and Liability Act, the Solid Waste Disposal Act, and the Safe Drinking Water Act.
1.3 Method detection limits and minimum levels for TKN have not been formally established for thisdraft method. These values will be determined during the validation of the method.
1.4 This method is performance based. The laboratory is permitted to omit any step or modify anyprocedure, provided that all performance requirements in this method are met. Requirements forestablishing method equivalency are given in Section 9.1.2.
1.5 Each laboratory that uses this method must demonstrate the ability to generate acceptable resultsusing the procedures in Section 9.2.
2.0 Summary of Method
2.1 The kjeldahl nitrogen in the sample is first converted to ammonia by metal-catalyzed acid digestionusing a block heater/digester unit. The resulting ammonia is then separated from the sample bydistillation. A procedure is given for removal of the ammonia present in the sample prior todigestion. A sample so treated then gives a result of organic nitrogen after digestion/distillation.
2.2 The ammonia concentration of the digestate is determined by automated colorimetric measurement ofindophenol blue, which is formed when ammonia reacts with alkaline phenol and hypochlorite.
2.3 Cupric sulfate has been substituted for the historically-used mercuric sulfate due to toxicity andwaste disposal problems associated with mercury.
2.4 Quality is assured through calibration and testing of the analytical instruments and testing of thesample preparation.
3.0 Definitions
Definitions for terms used in this method are given in Section 18.
Method 1688
Draft, January 20012
4.0 Interferences
4.1 Nitrate in large quantities (>10 mg/L) will oxidize ammonia produced by the digestion and cause anegative bias. No known method exists to prevent this interference, but its effect can be predicted onthe basis of preliminary nitrate determination of the sample.
4.2 Inorganic salts or solids will increase the temperature at which the digestion takes place, anddigestion temperatures in excess of 400EC will cause pyrolitic loss of nitrogen. If high salt/solidcontent is suspected, addition of extra volumes of sulfuric acid will stabilize the temperature. Approximately 1 mL H2SO4 per g of salt/solid will preserve the proper ratio.
4.3 Large amounts of organic matter can consume the acid in the digestion reagent, causing thetemperature of the digestion to rise above 400EC. Addition of 10 mL H2SO4 per 3000 mg COD willprevent this interference. Monitor digestion temperature and pH if this correction is used.
4.4 Residual chlorine, if present, must be removed by pretreatment of the sample with sodium thiosulfatebefore digestion/distillation. Typically, this will be necessary if the sample contains free water or isaqueous.
4.5 Nitrogen occurring in certain organic compounds will not be measured by this method. Thesecompounds include those having nitrogen in the following forms: azide, azine, azo, hydrazone,nitrate, nitrite, nitrile, nitro, nitroso, oxime, and semicarbazone.
5.0 Safety
5.1 The toxicity or carcinogenicity of reagents used in this method has not been fully established. Eachchemical and environmental sample should be regarded as a potential health hazard and exposureshould be minimized. Each laboratory is responsible for maintaining a current awareness file ofOSHA regulations regarding the safe handling of the chemicals specified in this method. A referencefile of material safety data sheets (MSDS) should be available to all personnel involved in thechemical analysis. Additional information on laboratory safety can be found in Reference 16.3.
5.2 If samples originate from a highly contaminated area, appropriate sample handling procedures mustbe followed to minimize worker exposure.
5.3 All personnel handling environmental samples known to contain or to have been in contact withhuman waste should be immunized against known disease causative agents.
6.0 Apparatus and Equipment
NOTE: Brand names, suppliers, and part numbers are for illustration only, and no endorsementis implied. Equivalent performance may be achieved using apparatus and materials other thanthose specified here. Meeting the performance requirements of this method is the responsibility ofthe sampling team and laboratory.
6.1 Digestion
6.1.1 Digester tubes, 50 mL.
Method 1688
Draft, January 2001 3
6.1.2 Automatic block type heating unit, with low and high range settings and timers.
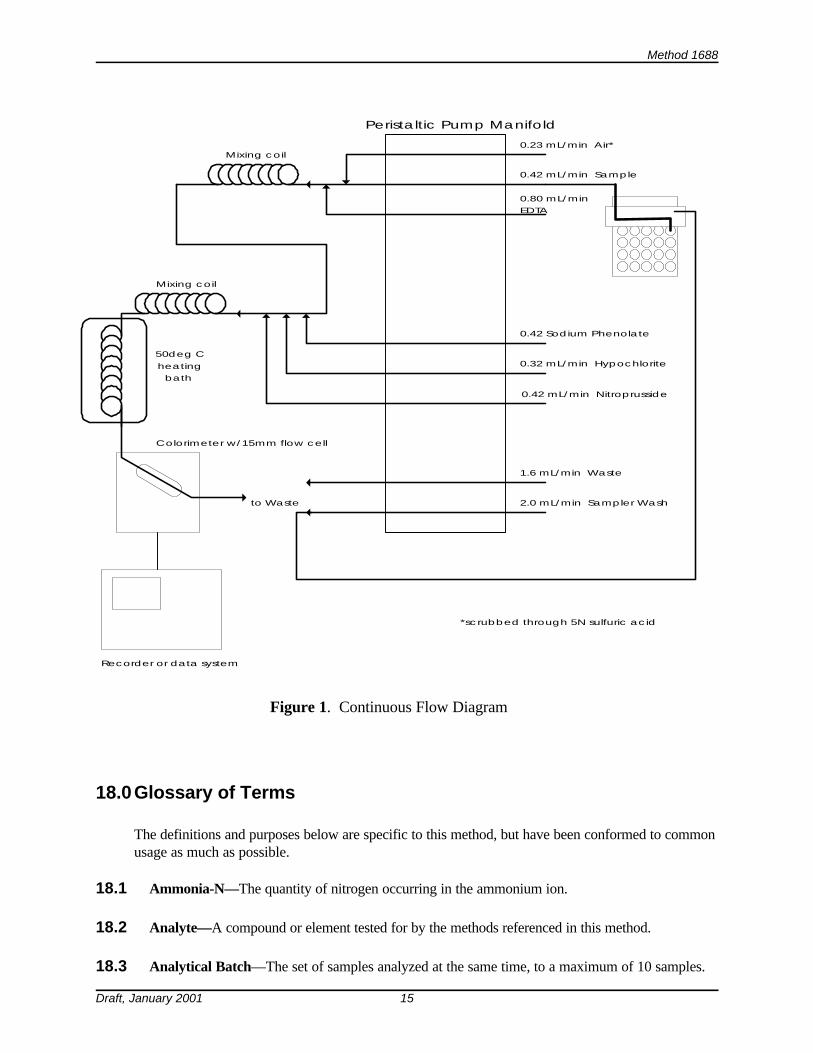
6.2 Colorimetric analysis—Automated analytical equipment with the capability of delivering thereagents specified in Figure 1 at the specified rates, and with a colorimeter capable of measuring at630-660 nm.
6.3 General equipment
6.3.1 Analytical balance, capable of weighing to 0.001 g (1 mg).
6.3.2 Hot plate or other heating apparatus.
6.3.3 Boiling chips or glass beads
6.3.4 Clean dish or watchglass
7.0 Reagents and Consumable Materials
7.1 All water and reagents used in this method must be free of ammonia.
7.1.1 Ammonia-free reagent water—Ammonia-free water can be prepared by passing reagent waterthrough an ion-exchange column containing a mixture of both strongly acidic cation andstrongly basic anion exchange resins. When necessary, regenerate the column according tothe manufacturer’s instructions.
7.1.2 All reagents should be ACS Reagent Grade or better.
7.2 Sulfuric acid
7.2.1 5N Sulfuric acid (H2SO4)—Carefully add 139 mL of concentrated H2SO4 to approximately500 mL reagent water. Cool to room temperature and dilute to 1 L.
7.2.2 0.04N Sulfuric acid—Carefully add 4 mL of 5N H2SO4 (Section 7.2.1) to approximately 300mL reagent water. Cool to room temperature and dilute to 500 mL.
7.3 Sodium hydroxide solutions
CAUTION: Considerable heat is generated upon dissolution of sodium hydroxide inwater. It may be advisable to cool the container in an ice bath when preparing sodiumhydroxide solutions.
7.3.1 0.1N Sodium hydroxide (NaOH)—Dissolve 4.0 g NaOH in reagent water, cool, and dilute to1 L.
7.3.2 6N Sodium hydroxide—Dissolve 240 g NaOH in reagent water, cool, and dilute to 1 L.
Method 1688
Draft, January 20014
7.3.3 1N Sodium hydroxide—Dissolve 40 g NaOH in reagent water, cool, and dilute to 1 L.
7.4 Borate buffer
7.4.1 0.025M Sodium tetraborate—Dissolve 5 g anhydrous sodium tetraborate (Na2B4O7) or 9.5 gsodium tetraborate decahydrate (Na2B4O7C10H2O) in reagent water and dilute to 1 L.
7.4.2 Add 88 mL of 0.1N NaOH solution (Section 7.3.1) to 500 mL 0.025M Na2B4O7 (Section7.4.1) and dilute to 1 L with reagent water.
7.5 Sodium phenate—Using a 1-L Erlenmeyer flask, dissolve 83 g phenol in 500 mL reagent water. Add 32 g NaOH cautiously and in small increments while agitating the flask. Periodically cool theflask under running water. When cool, dilute to 1 L.
7.6 Sodium hypochlorite solution—Dilute 250 mL of a bleach solution containing 5.25% NaOCl (suchas “Clorox”) to 500 mL. Available chlorine level should approximate 2-3%. Since “Clorox” is aproprietary product, its formulation is subject to change. The analyst must remain alert to detectingany variation in this product significant to its use in this procedure. Due to the instability of bleach,storage over an extended period should be avoided.
7.7 5% Disodium ethylenediamine-tetraacetate (EDTA)—Dissolve 50 g EDTA (disodium salt) andapproximately six pellets NaOH in 1 L of reagent water.
7.8 0.05% Sodium nitroprusside—Dissolve 0.5 g of sodium nitroprusside (Na2Fe(CN)5NOC2H2O) in 1L reagent water.
7.9 Blank sand—Bake 500 g diatomaceous earth or clean sand at 400EC for eight hours. Cool and storein a glass container with a sealing lid.
7.10 Ammonia standards
7.10.1 Ammonia stock solution (1000 mg/L NH3-N)—Dissolve 0.382 g of anhydrousammonium chloride (NH4Cl) in reagent water and dilute to 100 mL in a volumetricflask. NH4Cl should be dried at 105EC prior to use.
7.10.2 Ammonia working standard (10 mg/L NH3-N)—In a volumetric flask, dilute 10 mL ofammonia stock solution (Section 7.10.1) to 1 L.
7.11 Digestion reagent—Dissolve 134 g potassium sulfate (K2SO4) and 7.3 g cupric sulfate (CuSO4) in800 mL reagent water. Slowly add 134 mL conc. sulfuric acid. Cool and dilute solution to 1 L. Mix well. Store the solution at room temperature.
7.12 Sodium hydroxide-sodium thiosulfate solution—Dissolve 500 g NaOH and 25 g Na2S2O3C5H2O inreagent water and dilute to 1 L.
7.13 Nicotinic acid standard 100 mg/L organic N—Dissolve 21.637 g nicotinic acid (C6H5NO2) inapproximately 150 mL reagent water. Dilute to 200 mL.
Method 1688
Draft, January 2001 5
7.14 Dechlorinating reagent—Dissolve 0.35 g sodium thiosulfate (Na2S2O3C5H2O) in reagent water anddilute to 100 mL. One mL of this reagent will neutralize 1 mg/L of residual chlorine in a 500 mLsample aliquot.
7.15 Quality control sample (QCS)—A prepared quality control sample from a standards vendor (ERAcatalog # 545, or equivalent).
8.0 Sample Collection, Preservation and Storage
8.1 Ammonia is a pervasive contaminant. Minimize exposure of samples to air as much as possible.
8.2 A sufficient volume of sample for analysis must be collected using the procedures found inReference 16.2 for biosolids samples and Reference 16.4 for water and wastewater samples.
8.3 Ammonia can be formed or lost during storage due to biological activity or lost by volatilization oroxidation. The following preservation procedures will help prevent significant changes in the analyteconcentration.
8.3.1 Samples should be collected in wide mouth jars with a minimum of air space above them.
8.3.2 Aqueous samples or samples that contain free water
8.3.2.1 Samples should be checked for residual chlorine and treated with sodiumthiosulfate, if necessary, during collection.
8.3.2.2 Samples should be preserved with 2 mL concentrated H2SO4 and cooled to 4ECas soon as possible after collection. The holding time for samples should notexceed 28 days from sampling.
8.3.3 If the sample contains no free water or is solid, the sample should be cooled to 4EC as soon aspossible after collection. The holding time for samples should not exceed 28 days fromsampling.
8.4 Collect a separate sample for total solids determination (Appendix A). The holding time for totalsolids determination is seven days.
9.0 Quality Control
9.1 Each laboratory using this method is required to operate a formal quality control (QC) program. The minimum requirements of this program consist of an initial demonstration of laboratorycapability and the ongoing analysis of laboratory reagent blanks, precision and recovery standards,and matrix-spiked samples as a continuing check on performance. The laboratory is required tomaintain performance records that define the quality of data thus generated. Laboratoryperformance is compared to established performance criteria to determine if the results of analysesmeet the performance characteristics of the method.
9.1.1 The analyst shall make an initial demonstration of the ability to generate acceptable accuracyand precision with this method. This ability is established as described in Section 9.2.
Method 1688
Draft, January 20016
9.1.2 In recognition of advances that are occurring in analytical technology, the analyst is permittedcertain options to improve separations or lower the costs of measurements, provided that allperformance specifications are met. Changes that degrade method performance are notallowed. If an analytical technique other than the technique specified in this method is used,that technique must have a specificity equal to or better than the specificity of the techniquesin this method for TKN in the sample of interest. Specificity is defined as producing resultsequivalent to the results produced by this method for analytical standards (Section 9.4) and,where applicable, environmental samples (Section 9.5), and as meeting all of the QC criteriastated in this method.
9.1.2.1 Each time a modification is made to this method, the analyst is required to repeatthe IPR test in Section 9.2.2 to demonstrate that the modification producesresults equivalent to or better than results produced by this method. If thedetection limit of the method will be affected by the modification, the analystmust demonstrate that the MDL (40 CFR part 136, appendix B) is less than orequal to the MDL in this method or one-third the regulatory compliance level,whichever is higher. The tests required for this equivalency demonstration aregiven in Section 9.1.2.2.4.
9.1.2.2 The laboratory is required to maintain records of modifications made to thismethod. These records include the following, at a minimum:
9.1.2.2.1 The names, titles, addresses, and telephone numbers of theanalyst(s) who performed the analyses and modification, and of thequality control officer who witnessed and will verify the analysesand modification.
9.1.2.2.2 A listing of pollutant(s) measured (TKN).
9.1.2.2.3 A narrative stating reason(s) for the modification.
9.1.2.2.4 Results from all quality control (QC) tests comparing the modifiedmethod to this method, including:
(a) Calibration (Section 10).(b) Calibration verification (Section 9.6).(c) Initial precision and recovery (Section 9.2.2).(d) Analysis of blanks (Section 9.3).(e) Accuracy assessment (Sections 9.5 and 9.7).(f) Ongoing precision and recovery (Section 9.4).(g) Method detection limit (Section 9.2.1)
9.1.2.2.5 Data that will allow an independent reviewer to validate eachdetermination by tracing the instrument output (weight, absorbance,or other signal) to the final result. These data are to include:
(a) Sample numbers and other identifiers.(b) Sample preparation dates.(c) Analysis dates and times.(d) Analysis sequence/run chronology.
Method 1688
Draft, January 2001 7
(e) Sample weight or volume.(f) Dry weight ratio (solid and semi-solid samples only;
Appendix A). (g) Distillate solution volume.(h) Make and model of analytical balance and weights
traceable to NIST.(i) Copies of logbooks, printer tapes, and other
recordings of raw data.(j) Data system outputs, and other data to link the raw
data to the results reported.
9.1.3 Analyses of laboratory blanks are required to demonstrate freedom from contamination. Theprocedures and criteria for blank analyses are described in Section 9.3
9.1.4 Analyses of ongoing precision and recovery samples are required to demonstrate that thesample preparation and analysis are within the specified limitations. The procedure andcriteria for OPR sample analysis are described in Section 9.4.
9.1.5 Analyses of matrix spike and matrix spike duplicate samples are required to demonstratemethod accuracy and precision, and to monitor interferences caused by the sample matrix. The procedure and criteria for spiking are described in Section 9.5.
9.1.6 Analyses of calibration verification standards are required to demonstrate accuracy andstability of the initial calibration. The procedure and criteria for calibration verificationanalyses are described in Section 9.6.
9.1.7 Analyses of quality control samples (QCS) are required to demonstrate the accuracy of thecalibration standards and the analytical system. The procedure and criteria for the QCSsample analyses are described in Section 9.7.
9.2 Initial demonstration of laboratory capability—The initial demonstration of laboratory capability isused to characterize laboratory performance and method detection limits. The MDL and IPR forsolid samples should be determined using blank sand as a reference matrix. The MDL and IPR foraqueous samples should be determined using reagent water as a reference matrix.
9.2.1 Method detection limit (MDL)—The MDL should be established for TKN according to theprocedures at 40 CFR part 136, appendix B (Reference 16.5). First, spike a reference matrixwith nicotinic acid (Section 7.13) at a concentration one to five times the estimated detectionlimit. To determine the MDL, take seven replicate aliquots of the spiked reference matrix andprocess each aliquot through each step of the analytical method. Perform all calculations andreport the concentration values in the appropriate units. Aqueous and/or solid methoddetection limits should be determined every year or whenever a modification to the method oranalytical system is made that will affect the MDL.
9.2.2 Initial precision and recovery (IPR)—To establish the ability to generate acceptable precisionand accuracy, the analyst shall perform the following operations:
9.2.2.1 Prepare four spiked samples as detailed in Section 9.4. Using the procedures inSection 11, prepare and analyze these spiked samples for TKN.
Method 1688
Draft, January 20018
9.2.2.2 Using the results of the set of four analyses, compute the average percentrecovery (X) and the standard deviation (s) of the percent recovery for TKN.
9.2.2.3 Compare s and X with the corresponding limits for initial precision and recoveryin Table 1. If s and X meet the acceptance criteria, system performance isacceptable and analysis of samples may begin. If, however, s exceeds theprecision limit or X falls outside the range for recovery, system performance isunacceptable. In this event, correct the problem, and repeat the test.
9.3 Laboratory blanks—Laboratory blanks are analyzed to demonstrate freedom from contamination. Aqueous samples should be run with an aqueous blank, and solid samples should be run with a solidblank.
9.3.1 Prepare and analyze a laboratory blank initially (i.e., with the tests in Section 9.2) and witheach analytical batch. The blank must be subjected to the same procedural steps as a sample,and will consist of 250 mL of ammonia-free reagent water (aqueous blank) or 5 g aliquot ofblank sand in 250 mL of ammonia-free reagent water (solid blank).
9.3.2 If material is detected in the aqueous or solid blank at a concentration greater than theaqueous or solid MDL (Section 1.3), analysis of samples is halted until the source ofcontamination is eliminated and a blank shows no evidence of contamination. All samplesmust be associated with an uncontaminated laboratory blank before the results may bereported for regulatory compliance purposes.
9.4 Ongoing precision and recovery (OPR)—The laboratory must analyze at least one ongoing precisionand recovery sample with each analytical batch. A solid OPR should be run with solid samples, andan aqueous OPR should be run with aqueous samples. An aqueous OPR is prepared by spikingreagent water with nicotinic acid standard (Section 7.13) at a concentration so that the concentrationof TKN in the OPR is one to five times the ML. A solid OPR is prepared by mixing 5 g of blanksand with 250 mL reagent water and spiking with nicotinic acid standard so that the concentration ofTKN in the OPR is one to five times the ML. The spiked aliquot is carried through the entireanalytical process (Section 11). Calculate accuracy as percent recovery. If the recovery of theanalyte falls outside the control limits in Table 1, the system performance is unacceptable, and thesource of the problem should be identified and resolved before continuing analyses.
9.5 Matrix spike and matrix spike duplicates (MS/MSD)—To assess the performance of the method ona given sample matrix, the laboratory must spike, in duplicate, a minimum of 10% (one sample in10) of the samples from a given sampling site or, if for compliance monitoring, from a givendischarge. Blanks may not be used for MS/MSD analysis.
9.5.1 The concentration of the MS and MSD shall be determined as follows:
9.5.1.1 If, as in compliance monitoring, the concentration of analytes in the sample isbeing checked against a regulatory concentration limit, the spiking level shall beat that limit or at 1-5 times the background concentration of the sample,whichever is greater.
Method 1688
Draft, January 2001 9
9.5.1.2 If the concentration of TKN in a sample is not being checked against aregulatory concentration limit, the spike shall be at 1-5 times the backgroundconcentration.
9.5.1.3 For solid and sludge samples, the concentration added should be expressed asmg/kg and is calculated for a one gram aliquot by multiplying the added analyteconcentration (mg/L) in solution by the conversion factor 100 (mg/L x0.1L/0.001kg = 100).
9.5.2 Assessing spike recovery
9.5.2.1 To determine the background concentration, analyze one sample aliquot fromeach set of 10 samples from each site or discharge according to the procedure inSection 11. If the expected background concentration is known from previousexperience or other knowledge, the spiking level may be established a priori.
9.5.2.2 Prepare the MS/MSD samples by adding the appropriate concentration ofnicotinic acid standard (Section 7.13) to two sample aliquots. Analyze theMS/MSD aliquots as described in Section 11 to determine the concentration ofTKN in the samples after spiking.
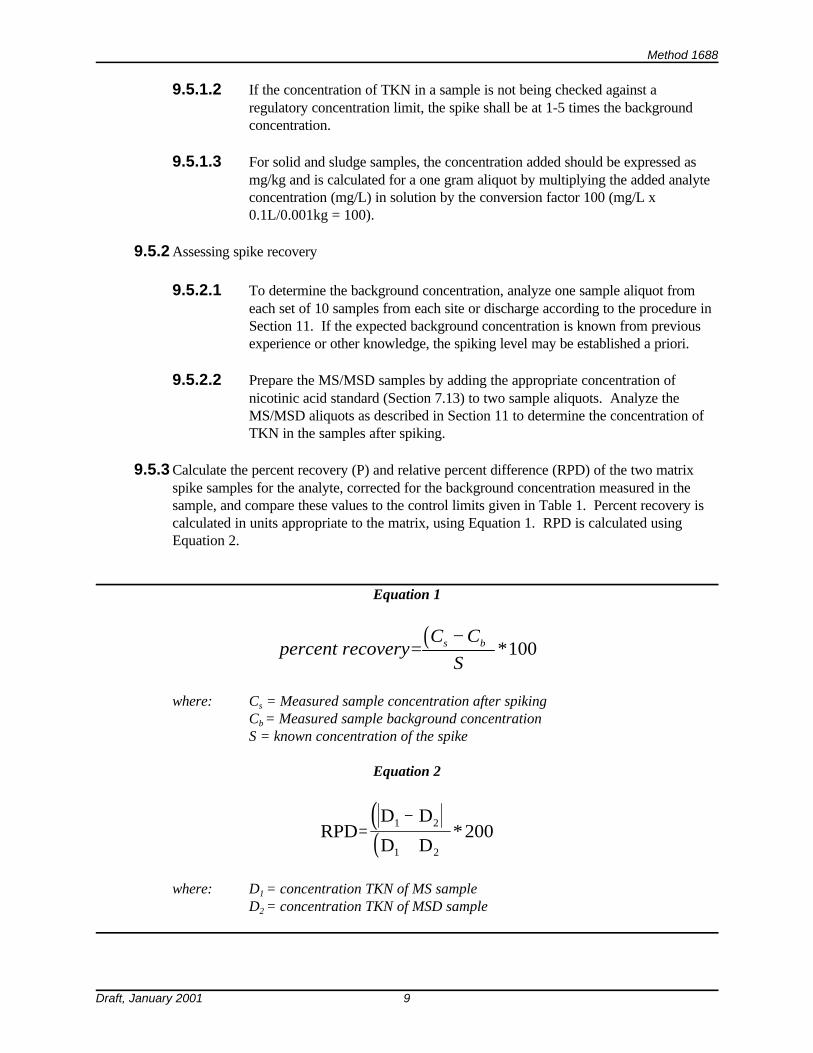
9.5.3 Calculate the percent recovery (P) and relative percent difference (RPD) of the two matrixspike samples for the analyte, corrected for the background concentration measured in thesample, and compare these values to the control limits given in Table 1. Percent recovery iscalculated in units appropriate to the matrix, using Equation 1. RPD is calculated usingEquation 2.
Equation 1
( )percent recovery=
−C C
Ss b *100
where: Cs = Measured sample concentration after spikingCb = Measured sample background concentrationS = known concentration of the spike
Equation 2
( )( )RPDD D
D D=
−
+1 2
1 2
200*
where: D1 = concentration TKN of MS sampleD2 = concentration TKN of MSD sample
Method 1688
Draft, January 200110
9.5.4 If the percent recovery or the RPD of the analyte in the MS/MSD samples falls outside thedesignated range, and the laboratory performance on the OPR for the analyte is within thespecified limits (Table 1), the recovery problem encountered with the MS/MSD sample isjudged to be matrix-related instead of method-related.
9.5.5 Recovery for samples should be assessed and records maintained.
9.5.5.1 After the analysis of five samples of a given matrix type (river water, lake water,etc.) for which the results pass the tests in Section 9.5.3, compute the averagepercent recovery (R) and the standard deviation of the percent recovery (SR) forthe analyte(s). Express the accuracy assessment as a percent recovery intervalfrom R-2SR to R+2SR for each matrix. For example, if R=90% and SR=10%for five analyses of river water, the accuracy interval is expressed as 70-110%.
9.5.5.2 Update the accuracy assessment for each matrix regularly (e.g., after each five toten new measurements).
9.6 Calibration verification (CV)—The laboratory must analyze a calibration verification standardbefore running any samples and once per ten analyses thereafter. The CV should be prepared at aconcentration that is at or near the midpoint of the calibration curve. The source of the CV standardshould be different from the source used to prepare the calibration standards. If a differentcompound is used for the CV stock, the amount weighed will have to be adjusted according to theratio of ammonia-nitrogen compound atomic weight to the molecular weight. Results of the CVanalysis should be evaluated according to the specifications in Table 1. If the CV does not meetacceptance criteria, the problem must be identified and corrected, including possible recalibration ofthe instrument.
9.7 Quality control sample (QCS)—It is suggested that the laboratory analyze a QCS with each day’sdistillations, or every twelve hours, whichever is more frequent. The results of the QCS analysisshould be evaluated according to the manufacturer’s specifications.
10.0 Calibration and Standardization
10.1 Calibrate the colorimeter with a minimum of ten standards that cover the expected range of thesamples and a blank. If the autoanalyzer is linked to a data system, follow the manufacturer’sinstructions for calibration. Alternatively, prepare a calibration graph relating absorbance to theconcentration of TKN, or develop a weighted linear regression formula from the calibration datausing concentration versus absorbance. If the correlation coefficient falls below 0.995, check thesystem for faults, correct them if found, and reanalyze the calibration standards.
10.2 Preparation of calibration curve—Prepare the standards (Table 2) and analyze them according to theprocedure in Section 11.2, beginning with the lowest standard. It is not necessary to digest thecalibration standards
10.3 An OPR run after the calibration must be within the specified limits (Table 1). Unacceptable OPRresults require corrective action before analysis of samples may continue; they may indicateproblems with the digestion procedure.
Method 1688
Draft, January 2001 11
10.4 Balance calibration—Calibrate the analytical balance at 2 mg and 1000 mg using class “S” weights. The calibration shall be within ± 10% at 2 mg and ± 0.5% at 1000 mg. If values are not withinthese limits, recalibrate the balance.
11.0Procedure
11.1 Digestion
11.1.1 Sample preparation
11.1.1.1 Solid samples—Thoroughly homogenize the sample. Weigh 5 g ofsample in a clean dish or watchglass, transfer to the 50 mL digestor tubewith reagent water, and add a few boiling chips or glass beads. Bring thevolume up to 20 mL with reagent water.
11.1.1.2 Aqueous samples—Mix the sample thoroughly. Transfer 20 mL ofsample to the 50 mL tube and add a few boiling chips or glass beads.
11.1.2 Carefully add 5 mL digestion reagent (7.11) to each tube. Set the block digester tomanual mode and set low and high temperature to 160EC. Preheat the unit for 30minutes. Cover the top of each tube with a small square of aluminum foil, and placethem in the digester. Set the low temperature timer for one hour. Set the hightemperature at 380EC, and set the high temperature timer for 2½ hours.
11.1.3 Allow the tubes to cool, then dilute to 25 mL with reagent water.
11.2 Colorimetric analysis
11.2.1 Since the intensity of the color used to quantify the concentration is pH dependent, theacid concentration of the wash water and the standard ammonia solutions shouldapproximate that of the samples.
11.2.2 Set up the autoanalyzer and reagents according to the manufacturer’s instructions,using the information in Figure 1 as a guide.
11.2.3 Allow both colorimeter and recorder (if applicable) to warm up for 30 minutes. Obtaina stable baseline with all reagents, feeding reagent water through the sample line.
11.2.4 Switch the sample line from reagent water to the first sample and begin analysis.
11.3 The solid sample dry weight/wet weight ratio must be determined separately (Appendix A).
12.0Calculations
12.1 Aqueous samples—Compare the absorbance reading for each sample to the calibration curve anddetermine the sample concentration. Report all values in mg/L to three significant figures.
Method 1688
Draft, January 200112
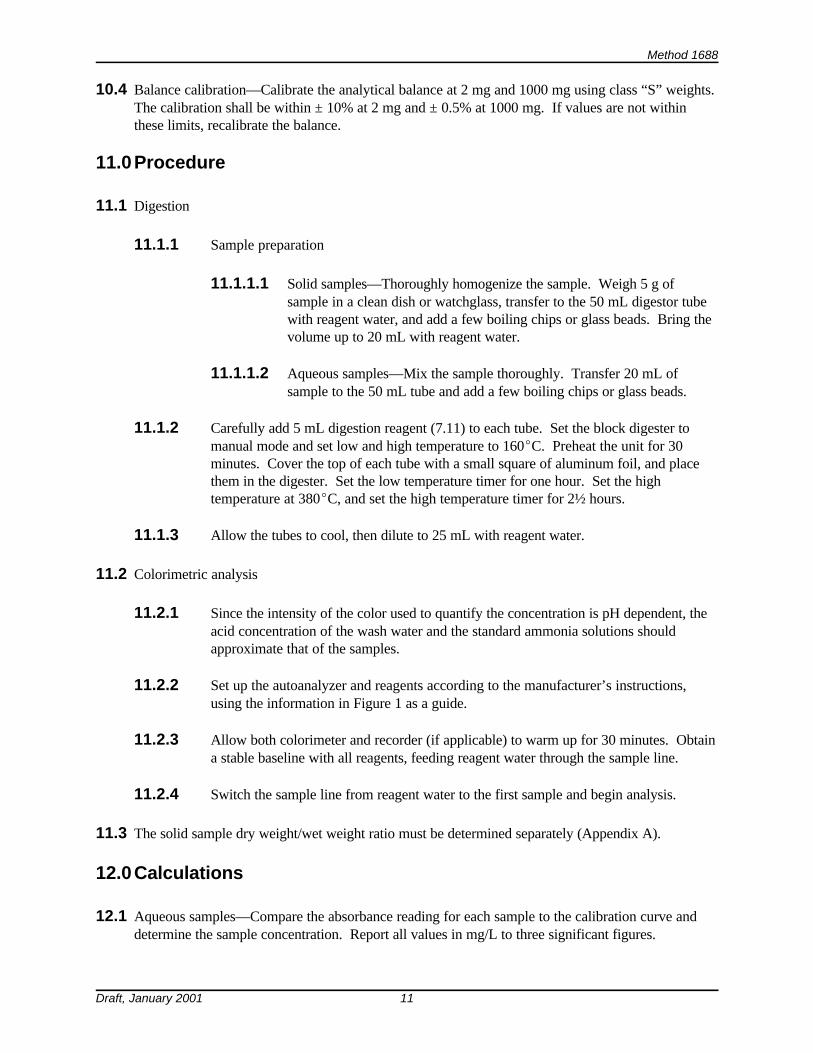
12.2 Solid samples—Compare the absorbance reading for each sample to the calibration curve anddetermine the sample concentration using Equations 3 and 4. Report all values in mg/kg to threesignificant figures.
Equation 3
TKN mg kgC V F g kg
W mL Ld d
s
( / )( )( )( ) /
( ) /=
1000
1000
where: Cd = Concentration of NH3-N in digestate (mg/L)Vd = Volume of digestate collectedF = Dilution factor (1 if no dilution)Ws = Weight of sample distilled (g)
Equation 4
TKN mg kgC
Ws( / ) =
where: Cs = Amount of TKN in sample (mg/kg, Equation 3)W = Dry weight ratio (Appendix A)
12.3 Report all results below the ML as “less than the ML.”
12.4 The QC data obtained during the analysis provides an indication of the quality of the sample dataand should be provided with the sample results.
13.0Method Performance
This is a draft method, and is currently undergoing validation. Method performance criteria will beset following the validation of the method.
14.0Pollution Prevention
14.1 Pollution prevention encompasses any technique that reduces or eliminates the quantity or toxicity ofwaste at the point of generation. Many opportunities for pollution prevention exist in laboratoryoperation. The EPA has established a preferred hierarchy of environmental management techniquesthat places pollution prevention as the management option of first choice. Whenever feasible,laboratory personnel should use pollution prevention techniques to address their waste generation. When wastes cannot be feasiblely reduced at the source, EPA recommends recycling as the next bestoption. The acids used in this method should be reused as practicable by purifying byelectrochemical techniques. The only other chemicals used in this method are the neat materials usedin preparing standards. These standards are used in extremely small amounts and pose little threatto the environment when managed properly. Standards should be prepared in volumes consistentwith laboratory use to minimize the volume of expired standards to be disposed.
Method 1688
Draft, January 2001 13
14.2 For information about pollution prevention that may be applicable to laboratories and researchinstitutions, consult “Less is Better: Laboratory Chemical Management for Waste Reduction,”available from the American Chemical Society's Department of Government Relations and SciencePolicy, 1155 16th Street NW, Washington, D.C. 20036, 202/872–4477.
15.0Waste Management
15.1 The laboratory is responsible for complying with all Federal, State, and local regulations governingwaste management, particularly hazardous waste identification rules and land disposal restrictions,and for protecting the air, water, and land by minimizing and controlling all releases from fumehoods and bench operations. Compliance with all sewage discharge permits and regulations is alsorequired. An overview of requirements can be found in Environmental Management Guide forSmall Laboratories (EPA 233-B-98-001).
15.2 Samples containing strong acids or bases are hazardous and must be either neutralized before beingdisposed or handled as hazardous waste.
16.0 References
16.1 U.S. Environmental Protection Agency, 1979. Methods for Chemical Analysis of Water and Wastes.Publ. 600/4-79-020, rev. March 1983. Environmental Monitoring and Support Lab., U.S.Environmental Protection Agency, Cincinnati, Ohio.
16.2 U.S. Environmental Protection Agency, 1998. Method 1691: Municipal Biosolids SamplingGuidance. Draft, September 1998. Office of Water, Washington, DC.
16.3 Sax, N.I. and Lewis, Sr., R.I., Dangerous Properties of Industrial Materials, 5th. ed., Van NostrandReinhold, New York, 1989.
16.4 U.S. Environmental Protection Agency, 1982. Handbook for Sampling and Sample Preservation ofWater and Wastewater. Publ. 600/4-82-029, Environmental Monitoring and Support Lab., U.S.Environmental Protection Agency, Cincinnati, Ohio.
16.5 Code of Federal Regulations 40, Ch. 1, Part 136, Appendix B.
17.0Tables, Diagrams, and Validation Data
Table 1. Quality Control—Sample Acceptance Criteria (To be determined during the method validationstudy)
Analyte Blanklimit
IPR recovery(x) limit
IPR precision(s) limit
OPRrecovery limit
CV recoverylimit
QCS recoverylimit
TKN
Method 1688
Draft, January 200114
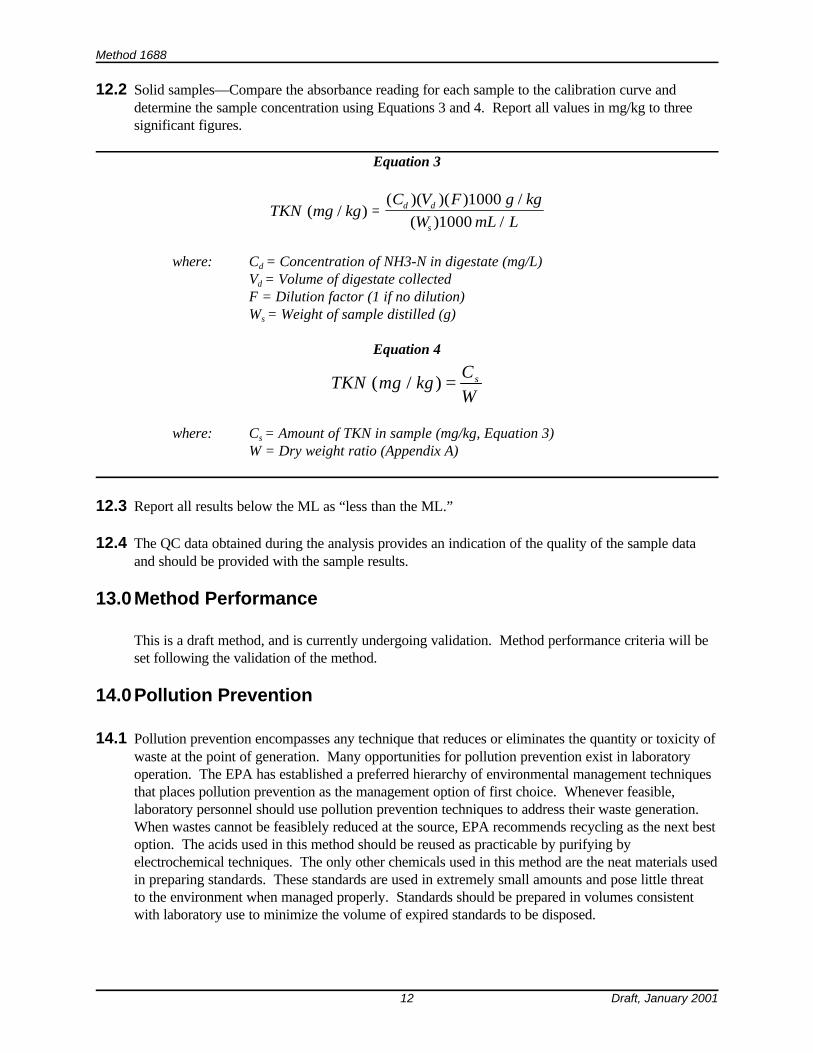
Table 2. The volume of working standard necessary to make the calibration standards in 100 mL volumetric flasks
Volume of standard(Section 7.10.2)
added (mL)
Concentration ofcalibration
standard (mg/L)
0.1 0.01
0.2 0.02
0.5 0.05
1.0 0.10
2.0 0.20
5.0 0.50
8.0 0.80
10.0 1.00
15.0 1.50
20.0 2.00
Method 1688
Draft, January 2001 15
0.23 mL/min Air*
0.80 mL/minEDTA
0.42 mL/min Sample
0.32 mL/min Hypochlorite
0.42 Sodium Phenolate
Colorimeter w/15mm flow cell
1.6 mL/min Waste
2.0 mL/min Sampler Wash
Recorder or data system
Mixing coil
Mixing coil
to Waste
Peristaltic Pump Manifold
50deg Cheating
bath
0.42 mL/min Nitroprusside
*scrubbed through 5N sulfuric acid
Figure 1. Continuous Flow Diagram
18.0Glossary of Terms
The definitions and purposes below are specific to this method, but have been conformed to commonusage as much as possible.
18.1 Ammonia-N—The quantity of nitrogen occurring in the ammonium ion.
18.2 Analyte—A compound or element tested for by the methods referenced in this method.
18.3 Analytical Batch—The set of samples analyzed at the same time, to a maximum of 10 samples.
Method 1688
Draft, January 200116
18.4 Apparatus—The sample container and other containers, filters, filter holders, labware, tubing,pipettes, and other materials and devices used for sample collection or sample preparation, andthat will contact samples, blanks, or analytical standards.
18.5 Biosolids—The treated residuals from wastewater treatment that can be used beneficially.
18.6 Calibration Standard—A solution prepared from a dilute mixed standard and/or stock solutionand used to calibrate the response of the instrument with respect to analyte concentration
18.7 Calibration Verification Standard (CV)—A solution prepared from a different source than thecalibration standards that is used to confirm the accuracy of the instrument’s calibration.
18.8 Initial Precision and Recovery (IPR)—Four aliquots of the OPR standard analyzed to establishthe ability to generate acceptable precision and accuracy. IPR is performed before a method isused for the first time and any time the method or instrumentation is modified.
18.9 Kjeldahl Nitrogen (TKN)—the sum of ammonia-nitrogen and organic nitrogen.
18.10 Laboratory Blank—An aliquot of reagent water that is treated exactly as a sample includingexposure to all glassware, equipment, solvents, reagents, internal standards, and surrogates thatare used with samples. The laboratory blank is used to determine if method analytes orinterferences are present in the laboratory environment, the reagents, or the apparatus (Section9.3).
18.11 Matrix Spike (MS) and Matrix Spike Duplicate (MSD)—Aliquots of an environmental sampleto which known quantities of the method analytes are added in the laboratory. The MS and MSDare analyzed exactly like a sample. Their purpose is to quantify the bias and precision caused bythe sample matrix. The background concentrations of the analytes in the sample matrix must bedetermined in a separate aliquot and the measured values in the MS and MSD corrected forbackground concentrations (Section 9.5).
18.12 May—This action, activity, or procedural step is optional.
18.13 May Not—This action, activity, or procedural step is prohibited.
18.14 Method Detection Limit (MDL)—The minimum concentration of an analyte that can beidentified, measured, and reported with 99% confidence that the analyte concentration is greaterthan zero (Section 9.2.1).
18.15 Minimum Level (ML)—The lowest level at which the entire analytical system gives arecognizable signal and acceptable calibration point.
18.16 Must—This action, activity, or procedural step is required.
18.17 Ongoing Precision and Recovery (OPR) Standard—A laboratory blank spiked with knownquantities of the method analytes. The OPR is analyzed exactly like a sample. Its purpose is todetermine whether the methodology is in control and to assure that the results produced by thelaboratory remain within the method-specified limits for precision and accuracy (Section 9.4).
Method 1688
Draft, January 2001 17
18.18 Organic Nitrogen—nitrogen present in organic molecules in the trinegative oxidation state.
18.19 Reagent Water—Water demonstrated to be free from the method analytes and potentiallyinterfering substances at the MDL for the method.
18.20 Sewage Sludge—Sewage sludge is solid, semi-solid, or liquid residue generated during thetreatment process of domestic sewage in a treatment works. Sewage sludge includes but is notlimited to, domestic septage; scum or solids removed in primary, secondary, or advancedwastewater treatment processes; and a material derived from sewage sludge. Sewage sludge doesnot include ash generated during the firing of sewage sludge in a sewage sludge incinerator or gritand screenings generated during preliminary treatment of domestic sewage in a treatment works.
18.21 Shall—This action, activity, or procedural step is required.
18.22 Should—This action, activity, or procedural step is suggested but not required.
18.23 Stock Standard Solution—A solution containing one or more method analytes that is preparedusing a reference material traceable to EPA, the National Institute of Science and Technology(NIST), or a source that will attest to the purity and authenticity of the reference material.
Method 1688
Draft, January 200118
Appendix A: Total Solids in Solids and Biosolids
1.0 Scope and Application
1.1 This procedure is applicable to the determination of total solids in such solid and semisolid samplesas soils, sediments, biosolids (municipal sewage sludge) separated from water and wastewatertreatment processes, and sludge cakes from vacuum filtration, centrifugation, or other sludgedewatering processes.
1.2 This procedure is taken from EPA Method 1684: Total, Fixed, and Volatile Solids in Water, Solidsand Biosolids.
1.3 Method detection limits (MDLs) and minimum levels (MLs) have not been formally established forthis draft procedure. These values will be determined during the validation of Method 1684.
1.4 This procedure is performance based. The laboratory is permitted to omit any step or modify anyprocedure (e.g. to overcome interferences, to lower the cost of measurement), provided that allperformance requirements in this procedure are met. Requirements for establishing equivalency aregiven in Section 9.1.2 of Method 1688.
1.5 Each laboratory that uses this procedure must demonstrate the ability to generate acceptable resultsusing the procedure in Section 9.2 of this appendix.
2.0 Summary of Method
2.1 Sample aliquots of 25-50 g are dried at 103EC to 105EC to drive off water in the sample.
2.2 The mass of total solids in the sample is determined by comparing the mass of the sample before andafter each drying step.
3.0 Definitions
3.1 Analytical batch—The set of samples analyzed at the same time, to a maximum of 10 samples. Each analytical batch of 10 or fewer samples must be accompanied by a laboratory blank, anongoing precision and recovery sample, and a set of duplicate samples, resulting in a minimum offive analyses (1 sample, 1 blank, 1 OPR, and 2 duplicates) and a maximum of 14 samples.
3.2 Total Solids—The residue left in the vessel after evaporation of liquid from a sample and subsequentdrying in an oven at 103EC to 105EC.
3.3 Additional definitions are given in Sections 3.0 and 18.0 of Method 1688.
4.0 Interferences
4.1 Sampling, subsampling, and pipeting multi-phase samples may introduce serious errors (Reference16.1). Make and keep such samples homogeneous during transfer. Use special handling to ensure
Method 1688
Draft, January 2001 19
sample integrity when subsampling. Mix small samples with a magnetic stirrer. If visible suspendedsolids are present, pipet with wide-bore pipets. If part of a sample adheres to the sample container,intensive homogenization is required to ensure accurate results. When dried, some samples form acrust that prevents evaporation; special handling such as extended drying times are required to dealwith this. Avoid using a magnetic stirrer with samples containing magnetic particles.
4.2 The temperature and time of residue drying has an important bearing on results (Reference 16.1). Problems such as weight losses due to volatilization of organic matter, and evolution of gases fromheat-induced chemical decomposition, weight gains due to oxidation, and confounding factors likemechanical occlusion of water and water of crystallization depend on temperature and time ofheating. It is therefore essential that samples be dried at a uniform temperature, and for no longerthan specified. Each sample requires close attention to desiccation after drying. Minimize the timethe desiccator is open because moist air may enter and be absorbed by the samples. Some samplesmay be stronger desiccants than those used in the desiccator and may take on water. If uptake ofwater by a sample is suspected, the operator should weigh the sample to see if it gains weight whilein the desiccator. If the sample is indeed taking on water, then a vacuum desiccator should be used.
4.3 Residues dried at 103EC to 105EC may retain some bound water as water of crystallization or aswater occluded in the interstices of crystals. They lose CO2 in the conversion of bicarbonate tocarbonate. The residues usually lose only slight amounts of organic matter by volatilization at thistemperature. Because removal of occluded water is marginal at this temperature, attainment ofconstant weight may be very slow.
4.4 Results for residues high in oil or grease may be questionable because of the difficulty of drying toconstant weight in a reasonable time.
4.5 The determination of total solids is subject to negative error due to loss of ammonium carbonate andvolatile organic matter during the drying step at 103EC to 105EC. Carefully observe specifiedignition time and temperature to control losses of volatile inorganic salts if these are a problem.
5.0 Safety
5.1 Refer to Section 5.0 of Method 1688 for safety precautions
6.0 Equipment and Supplies
NOTE: Brand names, suppliers, and part numbers are cited for illustrative purposes only. No endorsementis implied. Equivalent performance may be achieved using equipment and materials other than those specifiedhere, but demonstration of equivalent performance that meets the requirements of this method is the responsibilityof the laboratory.
6.1 Evaporating Dishes—Dishes of 100-mL capacity. The dishes may be made of porcelain (90-mmdiameter), platinum, or high-silica glass.
6.2 Watch glass—Capable of covering the evaporating dishes (Section 6.1).
Method 1688
Draft, January 200120
6.3 Steam bath for evaporation of liquid samples.
6.4 Desiccator—Moisture concentration in the desiccator should be monitored by an instrumentalindicator or with a color-indicator desiccant.
6.5 Drying oven—Thermostatically-controlled, capable of maintaining a uniform temperature of 103ECto 105EC throughout the drying chamber.
6.6 Analytical balance—Capable of weighing to 0.1 mg for samples having a mass up to 200 g.
6.7 Reference weights—2 mg, 1000 mg, and 50 g class “S” weights.
6.8 Container handling apparatus—Gloves, tongs, or a suitable holder for moving and handling hotcontainers after drying.
6.9 Sample handling apparatus—Spatulas, spoonulas, funnels, or other equipment for transfer andmanipulation of samples.
6.10 Bottles—Glass or plastic bottles of a suitable size for sample collection.
6.11 Rubber gloves (Optional).
6.12 No. 7 Cork borer (Optional).
6.13 Dessicant (Optional).
7.0 Reagents and Standards
7.1 Reagent water—Deionized, distilled, or otherwise purified water.
7.2 Quality control spiking solution—If a commercially available standard can be purchased thatcontains standard total solids, the laboratory may use that standard. The laboratory may alsoprepare a spiking solution. One possible recipe is given below for a NaCl-KHP solution.
7.2.1 Dissolve 0.10 g sodium chloride (NaCl) in 500 mL reagent water. Mix to dissolve.
7.2.2 Add 0.10 g potassium hydrogen phthalate (KHP) to the NaCl solution (Section 7.2.1) andmix. If the KHP does not dissolve readily, warm the solution while mixing. Dilute to 1 Lwith reagent water. Store at 4EC. Assuming 100% volatility of the acid phthalate ion, thissolution contains 200 mg/L total solids, 81.0 mg/L volatile solids, and 119 mg/L fixed solids.
8.0 Sample Collection, Preservation, and Storage
8.1 Use resistant-glass or plastic bottles to collect sample for solids analysis, provided that the materialin suspension does not adhere to container walls. Sampling should be done in accordance withReference 16.2. Begin analysis as soon as possible after collection because of the impracticality ofpreserving the sample. Refrigerate the sample at 4EC up to the time of analysis to minimize
Method 1688
Draft, January 2001 21
microbiological decomposition of solids. Preferably do not hold samples more than 24 hours. Underno circumstances should the sample be held more than seven days. Bring samples to roomtemperature before analysis.
9.0 Quality Control
9.1 Quality control requirements and requirements for performance-based methods are given in Section9.1 of Method 1688.
9.2 Initial demonstration of laboratory capability—The initial demonstration of laboratory capability isused to characterize laboratory performance and method detection limits.
9.2.1 Method detection limit (MDL)—The method detection limit should be established for totalsolids using the QC spiking solution (Section 7.2). To determine MDL values, take sevenreplicate aliquots of the diluted QC spiking solution and process each aliquot through eachstep of the analytical method. Perform all calculations and report the concentration values inthe appropriate units. MDLs should be determined every year or whenever a modification tothe method or analytical system is made that will affect the method detection limit.
9.2.2 Initial precision and recovery (IPR)—To establish the ability to generate acceptable precisionand accuracy, the analyst shall perform the following operations:
9.2.2.1 Prepare four samples by diluting the QC spiking solution (Section 7.2) to 1-5times the MDL. Using the procedures in Section 11, analyze these samples fortotal solids.
9.2.2.2 Using the results of the four analyses, compute the average percent recovery (x)and the standard deviation (s, Equation 1) of the percent recovery for total solids.
Equation 1
sx
x
nn
=−
−
∑∑ 22
1
( )
Where:n = number of samplesx = % recovery in each samples = standard deviation
9.2.2.3 Compare s and x with the corresponding limits for initial precision and recoveryin Table 2 (to be determined in validation study). If s and x meet the acceptancecriteria, system performance is acceptable and analysis of samples may begin. If, however, s exceeds the precision limit or x falls outside the range forrecovery, system performance is unacceptable. In this event, correct theproblem, and repeat the test.
Method 1688
Draft, January 200122
9.3 Laboratory blanks
9.3.1 Prepare and analyze a laboratory blank initially (i.e. with the tests in Section 9.2) and witheach analytical batch. The blank must be subjected to the same procedural steps as a sample,and will consist of approximately 25 g of reagent water.
9.3.2 If material is detected in the blank at a concentration greater than the MDL (Section 1.3),analysis of samples must be halted until the source of contamination is eliminated and a newblank shows no evidence of contamination. All samples must be associated with anuncontaminated laboratory blank before the results may be reported for regulatory compliancepurposes.
9.4 Ongoing precision and recovery
9.4.1 Prepare an ongoing precision and recovery (OPR) solution identical to the IPR solutiondescribed in Section 9.2.2.1.
9.4.2 An aliquot of the OPR solution must be analyzed with each sample batch (samples startedthrough the sample preparation process (Section 11) on the same 12-hour shift, to a maximumof 20 samples).
9.4.3 Compute the percent recovery of total solids in the OPR sample.
9.4.4 Compare the results to the limits for ongoing recovery in Table 2 (to be determined invalidation study). If the results meet the acceptance criteria, system performance isacceptable and analysis of blanks and samples may proceed. If, however, the recovery oftotal solids falls outside of the range given, the analytical processes are not being performedproperly. Correct the problem, reprepare the sample batch, and repeat the OPR test. Allsamples must be associated with an OPR analysis that passes acceptance criteria before thesample results can be reported for regulatory compliance purposes.
9.4.5 Add results that pass the specifications in Section 9.4.4 to IPR and previous OPR data. Update QC charts to form a graphic representation of continued laboratory performance. Develop a statement of laboratory accuracy for each analyte by calculating the averagepercent recovery (R) and the standard deviation of percent recovery (SR). Express theaccuracy as a recovery interval from R-2SR to R+2SR. For example, if R=05% and SR=5%,the accuracy is 85-115%.
9.5 Duplicate analyses
9.5.1 Ten percent of samples must be analyzed in duplicate. The duplicate analyses must beperformed within the same sample batch (samples whose analysis is started within the same12-hour period).
9.5.2 The total solids of the duplicate samples must be within 10% of the solids determination.
Method 1688
Draft, January 2001 23
10.0Calibration and Standardization
10.1 Calibrate the analytical balance at 2 mg and 1000 mg using class "S" weights.
10.2 Calibration shall be within ± 10% (i.e. ±0.2 mg) at 2 mg and ± 0.5% (i.e. ±5 mg) at 1000 mg. Ifvalues are not within these limits, recalibrate the balance.
10.3 Place a 50 g weight and a 2 mg weight on the balance. Verify that the balance reads 50.002 ±10%(i.e. ±0.2 mg)
11.0Procedure
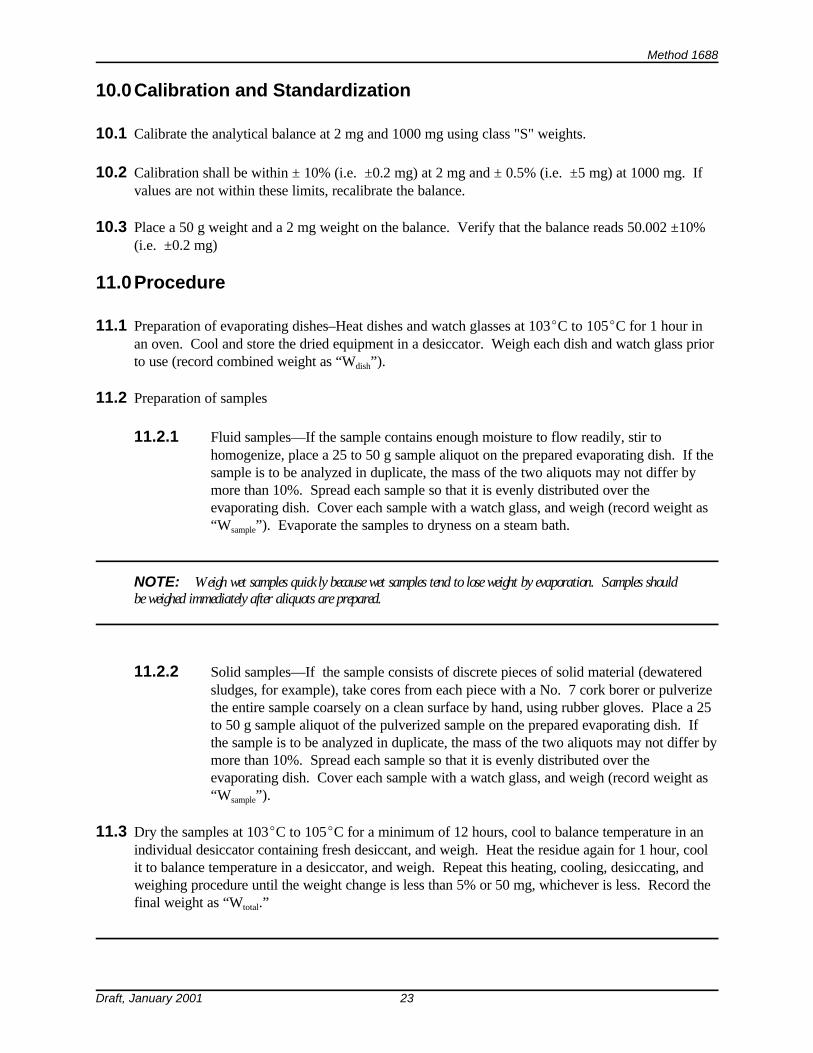
11.1 Preparation of evaporating dishes–Heat dishes and watch glasses at 103EC to 105EC for 1 hour inan oven. Cool and store the dried equipment in a desiccator. Weigh each dish and watch glass priorto use (record combined weight as “Wdish”).
11.2 Preparation of samples
11.2.1 Fluid samples—If the sample contains enough moisture to flow readily, stir tohomogenize, place a 25 to 50 g sample aliquot on the prepared evaporating dish. If thesample is to be analyzed in duplicate, the mass of the two aliquots may not differ bymore than 10%. Spread each sample so that it is evenly distributed over theevaporating dish. Cover each sample with a watch glass, and weigh (record weight as“Wsample”). Evaporate the samples to dryness on a steam bath.
NOTE: Weigh wet samples quickly because wet samples tend to lose weight by evaporation. Samples shouldbe weighed immediately after aliquots are prepared.
11.2.2 Solid samples—If the sample consists of discrete pieces of solid material (dewateredsludges, for example), take cores from each piece with a No. 7 cork borer or pulverizethe entire sample coarsely on a clean surface by hand, using rubber gloves. Place a 25to 50 g sample aliquot of the pulverized sample on the prepared evaporating dish. Ifthe sample is to be analyzed in duplicate, the mass of the two aliquots may not differ bymore than 10%. Spread each sample so that it is evenly distributed over theevaporating dish. Cover each sample with a watch glass, and weigh (record weight as“Wsample”).
11.3 Dry the samples at 103EC to 105EC for a minimum of 12 hours, cool to balance temperature in anindividual desiccator containing fresh desiccant, and weigh. Heat the residue again for 1 hour, coolit to balance temperature in a desiccator, and weigh. Repeat this heating, cooling, desiccating, andweighing procedure until the weight change is less than 5% or 50 mg, whichever is less. Record thefinal weight as “Wtotal.”
Method 1688
Draft, January 200124
NOTE: It is imperative that dried samples be weighed quickly since residues often are very hygroscopic andrapidly absorb moisture from the air. Samples must remain in the dessicator until the analyst is ready to weighthem.
12.0Data Analysis and Calculations
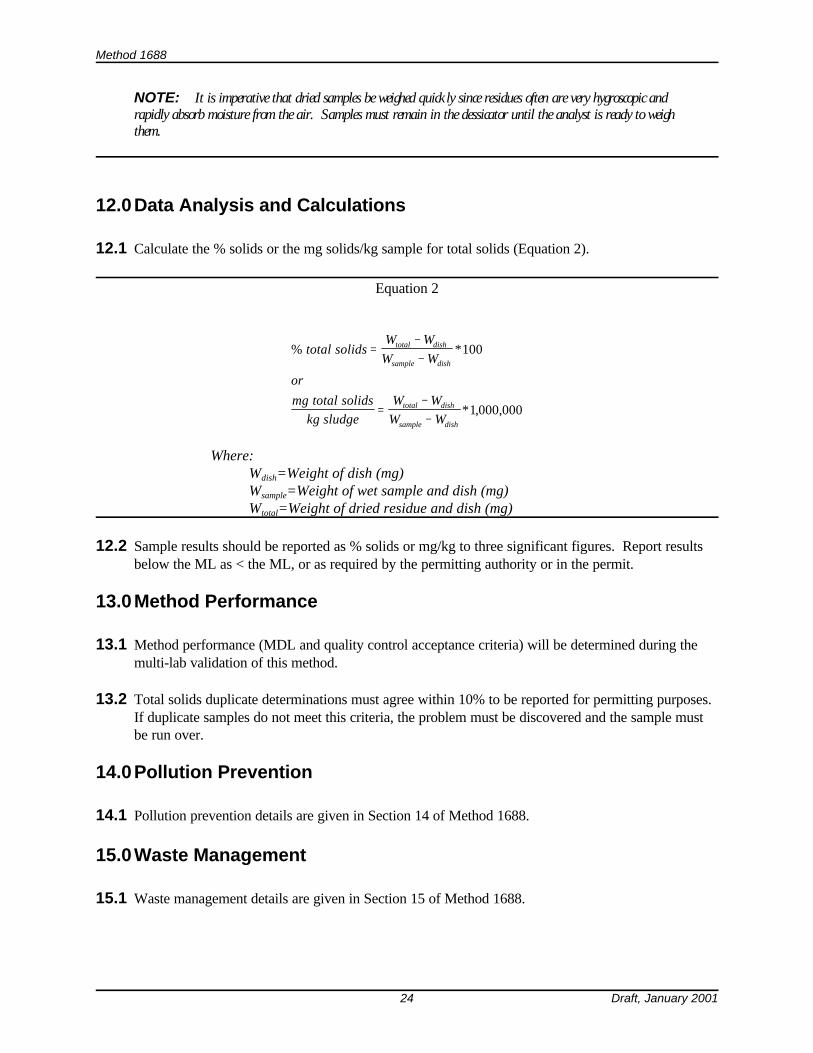
12.1 Calculate the % solids or the mg solids/kg sample for total solids (Equation 2).
Equation 2
% *
* , ,
total solidsW W
W W
or
mg total solids
kg sludge
W W
W W
total dish
sample dish
total dish
sample dish
=−−
=−−
100
1 000 000
Where:Wdish=Weight of dish (mg)Wsample=Weight of wet sample and dish (mg)Wtotal=Weight of dried residue and dish (mg)
12.2 Sample results should be reported as % solids or mg/kg to three significant figures. Report resultsbelow the ML as < the ML, or as required by the permitting authority or in the permit.
13.0Method Performance
13.1 Method performance (MDL and quality control acceptance criteria) will be determined during themulti-lab validation of this method.
13.2 Total solids duplicate determinations must agree within 10% to be reported for permitting purposes. If duplicate samples do not meet this criteria, the problem must be discovered and the sample mustbe run over.
14.0Pollution Prevention
14.1 Pollution prevention details are given in Section 14 of Method 1688.
15.0Waste Management
15.1 Waste management details are given in Section 15 of Method 1688.
Method 1688
Draft, January 2001 25
16.0References
16.1 "Standard Methods for the Examination of Water and Wastewater," 18th ed. and later revisions,American Public Health Association, 1015 15th Street NW, Washington, DC 20005. 2-59: Section2540 G (Total, Fixed, and Volatile Solids in Solid and Semisolid Matrices), 1992.
16.2 U.S. Environmental Protection Agency, 1992. Control of Pathogens and Vector Attraction inSewage Sludges. Publ 625/R-92/013. Office of Research and Development, Washington, DC.
17.0Tables, Diagrams, Flowcharts, and Validation Data
17.1 Tables containing method requirements for QA/QC will be added after the validation study has beenperformed.


![Simultaneous Measurement of Total Nitrogen and Phosphorus ... · digestion procedures found in U.S. EPA 351.2 (Total Kjeldahl Nitrogen [TKN]) and 365.4 (Total Kjeldahl Phosphorus](https://img.pdfslide.net/doc/110x75/60608f94db713f558836050e/simultaneous-measurement-of-total-nitrogen-and-phosphorus-digestion-procedures.jpg)


![PowerPoint Presentation ANALYSIS. Nitrogen Testing. Total Nitrogen (TN) Total Kjeldahl Nitrogen (TKN) [Organic Nitrogen + Ammonia (inorganic )] Nitrate (NO. 3-) Nitrite (NO. 2-) Inorganic](https://img.pdfslide.net/doc/110x75/5e97650d317cbf0e395cb525/powerpoint-presentation-analysis-nitrogen-testing-total-nitrogen-tn-total-kjeldahl.jpg)