Embed Size (px)
Citation preview
METHOD
Chapter 3
I. Design and Sample
II. Sample Characteristics
III. Tools used in the Study
a) Tools used for the screening & selection of the Sample
b) Tools used for the Main Study
IV. Procedure
Chapter 3
METHOD
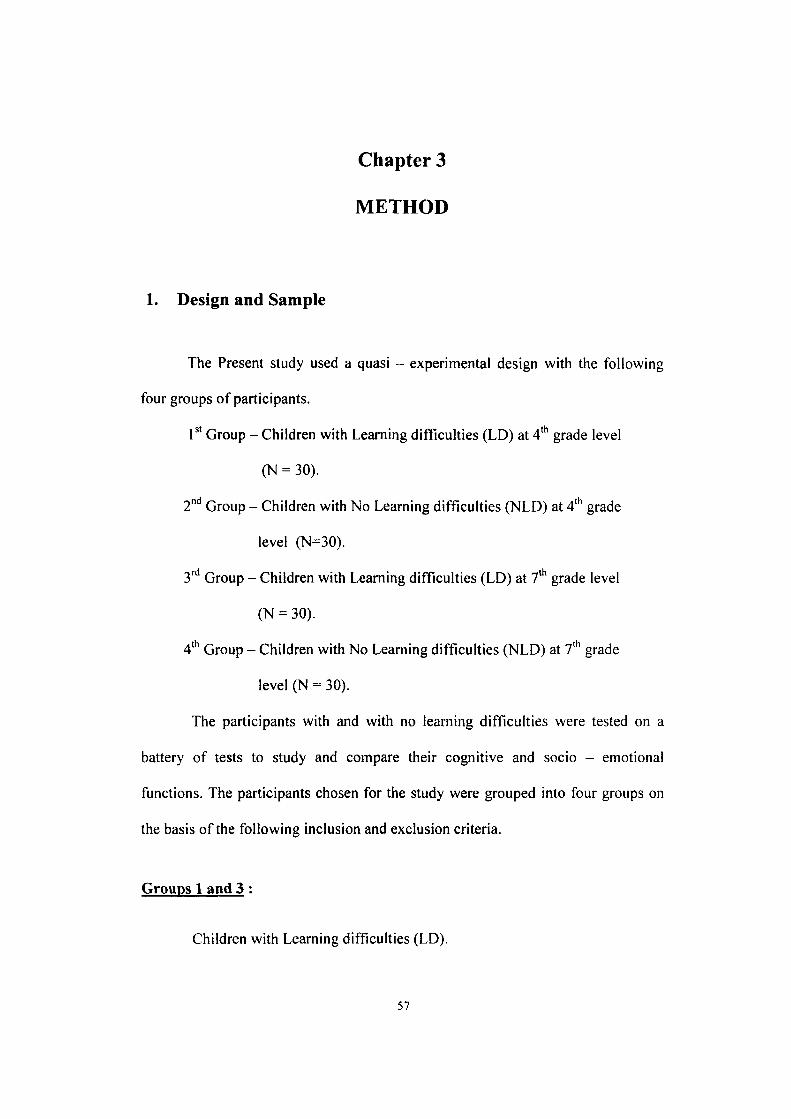
1. Design and Sample
The Present study used a quasi - experimental design with the following
four groups of participants.
P' Group - Children with Learning difficulties (LD) at 4"̂ grade level
(N = 30).
2"'' Group - Children with No Learning difficulties (NLD) at 4''' grade
level (N=30).
3'^ Group - Children with Learning difficulties (LD) at 7"̂ grade level
(N = 30).
4* Group - Children with No Learning difficulties (NLD) at 7"" grade
level (N = 30).
The participants with and with no learning difficulties were tested on a
battery of tests to study and compare their cognitive and socio - emotional
functions. The participants chosen for the study were grouped into four groups on
the basis of the following inclusion and exclusion criteria.
Groups 1 and 3 :
Children with Learning difficulties (LD).
57
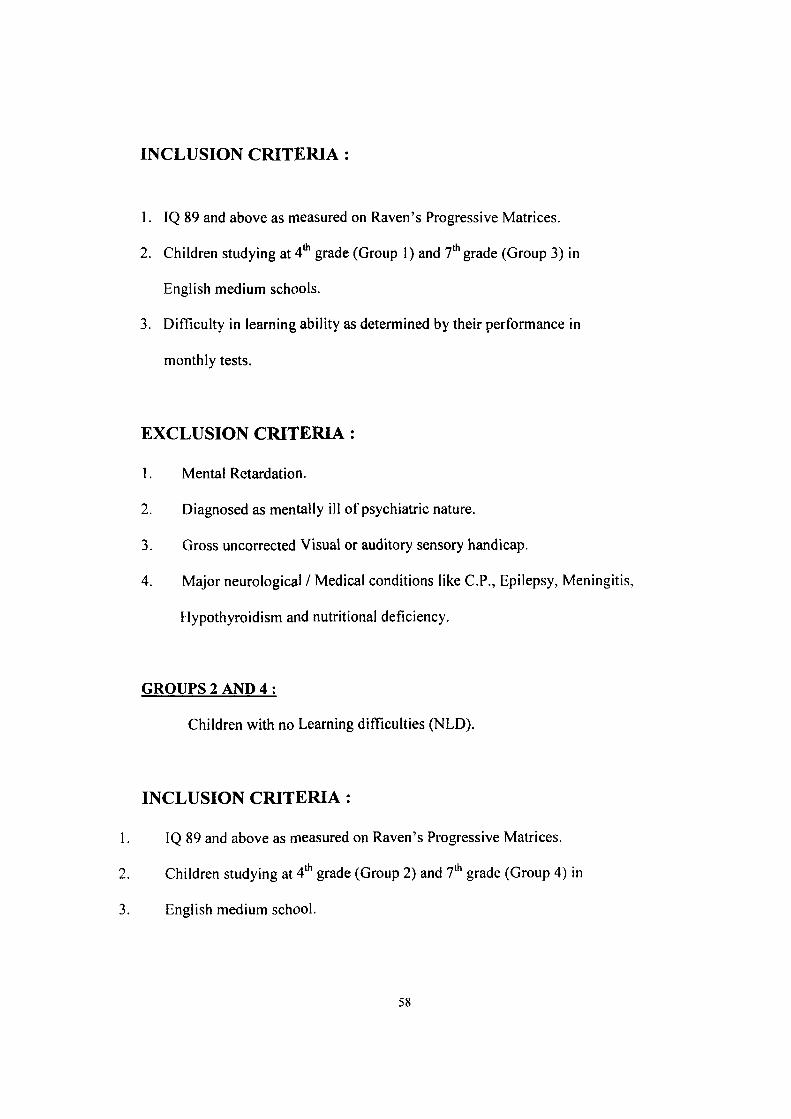
INCLUSION CRITERIA :
1. IQ 89 and above as measured on Raven's Progressive Matrices.
2. Cliildren studying at 4* grade (Group 1) and 7* grade (Group 3) in
English medium schools.
3. Difficulty in learning ability as determined by their performance in
monthly tests.
EXCLUSION CRITERIA :
1. Mental Retardation.
2. Diagnosed as mentally ill of psychiatric nature.
3. Gross uncorrected Visual or auditory sensory handicap.
4. Major neurological / Medical conditions like C.P., Epilepsy, Meningitis,
Hypothyroidism and nutritional deficiency.
GROUPS 2 AND 4 :
Children with no Learning difficulties (NLD).
INCLUSION CRITERIA :
1. IQ 89 and above as nieasured on Raven's Progressive Matrices.
2. Children studying at 4* grade (Group 2) and 7 '̂ grade (Group 4) in
3. English medium school.
58
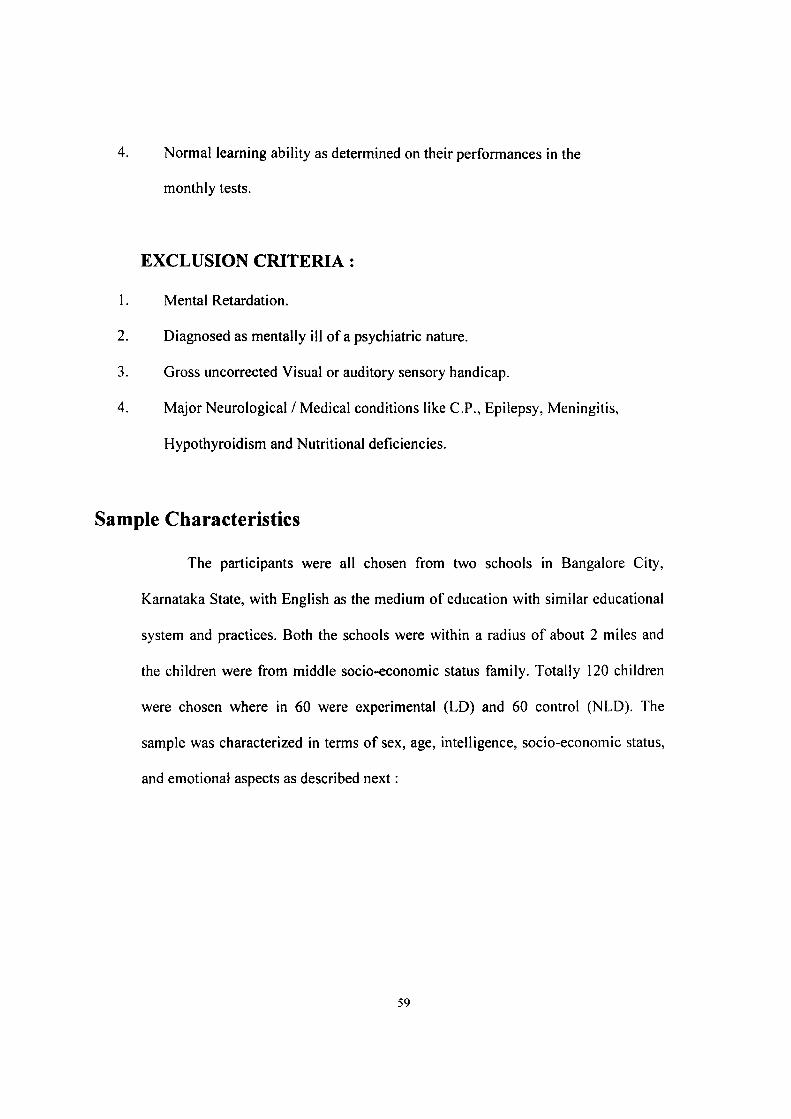
4. Normal learning ability as determined on their performances in the
monthly tests.
EXCLUSION CRITERIA :
1. Mental Retardation.
2. Diagnosed as mentally ill of a psychiatric nature.
3. Gross uncorrected Visual or auditory sensory handicap.
4. Major Neurological / Medical conditions like C.P., Epilepsy, Meningitis,
Hypothyroidism and Nutritional deficiencies.
Sample Characteristics
The participants were all chosen from two schools in Bangalore City,
Karnataka State, with English as the medium of education with similar educational
system and practices. Both the schools were within a radius of about 2 miles and
the children were from middle socio-economic status family. Totally 120 children
were chosen where in 60 were experimental (LD) and 60 control (NLD). The
sample was characterized in terms of sex, age, intelligence, socio-economic status,
and emotional aspects as described next:
59
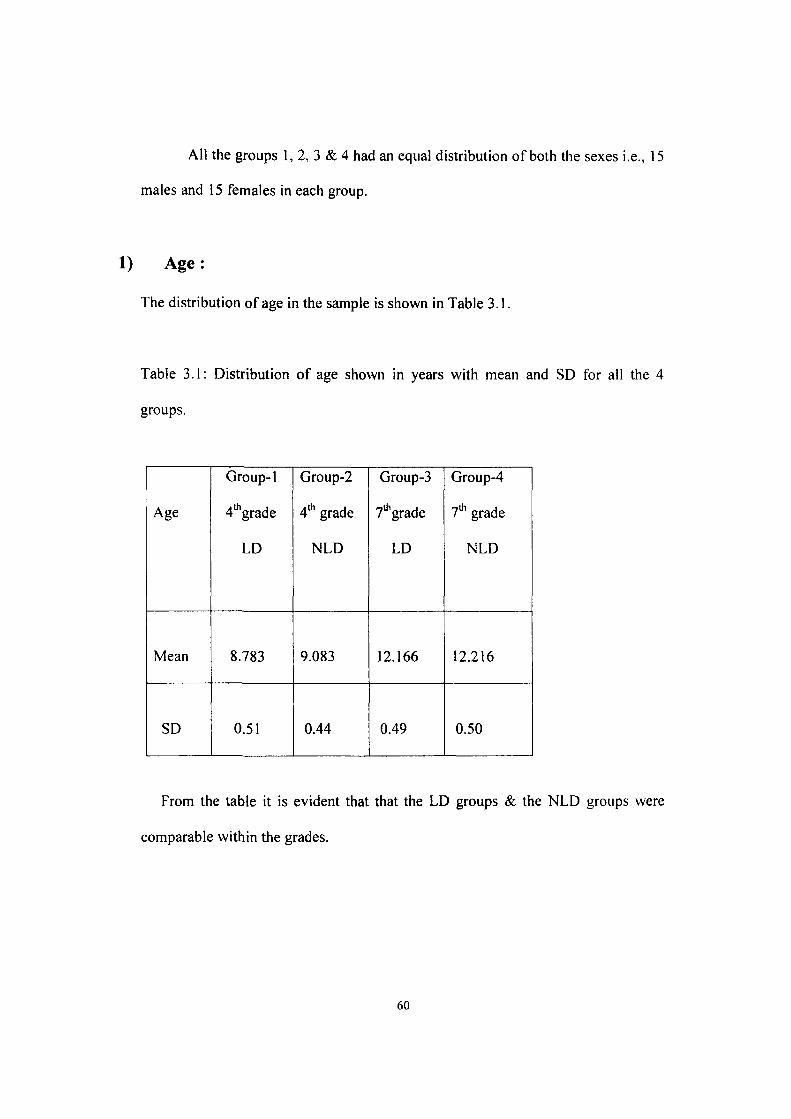
All the groups 1, 2, 3 & 4 had an equal distribution of both the sexes i.e., 15
males and 15 females in each group.
1) A g e :
The distribution of age in the sample is shown in Table 3.1.
Table 3.1: Distribution of age shown in years with mean and SD for all the 4
groups.
Age
Mean
SD
Group-1
4''̂ grade
LD
8.783
0.51
Group-2
4"̂ grade
NLD
9.083
0.44
Group-3
7'̂ grade
LD
12.166
0.49
Group-4
7* grade
NLD
12.216
0.50
From the table it is evident that that the LD groups & the NLD groups were
comparable within the grades.
60
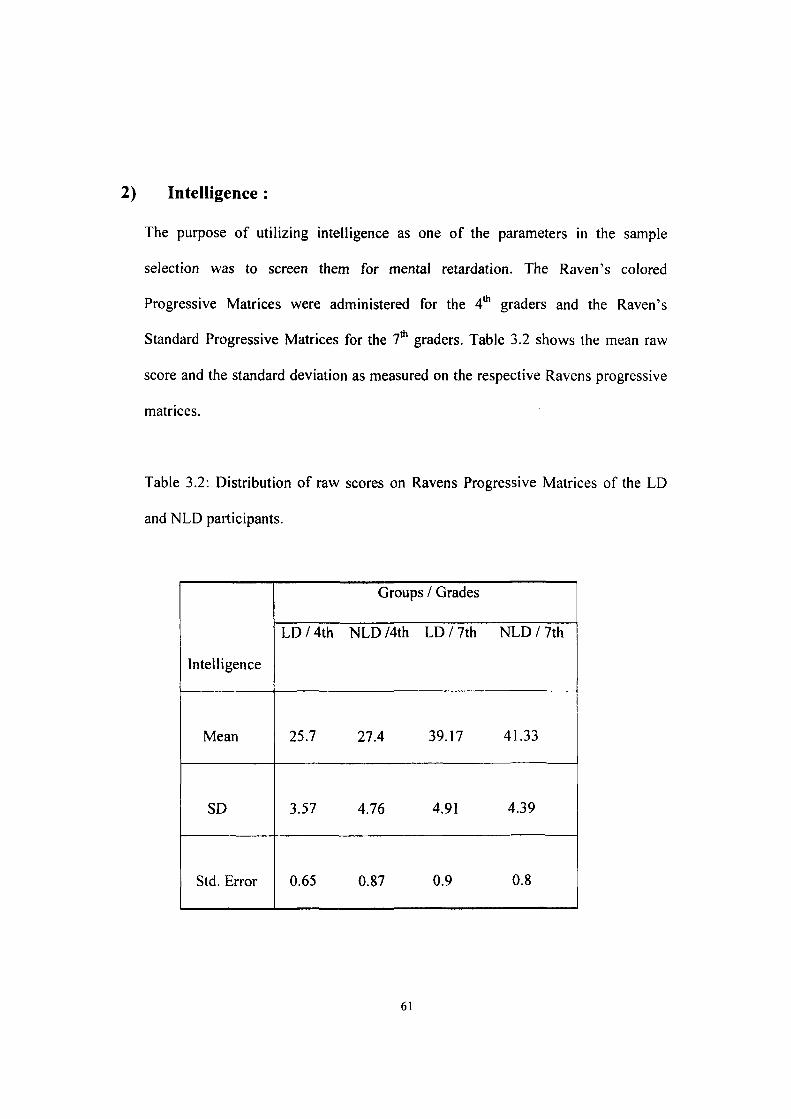
2) Intelligence :
The purpose of utilizing intelligence as one of the parameters in the sample
selection was to screen them for mental retardation. The Raven's colored
Progressive Matrices were administered for the 4* graders and the Raven's
Standard Progressive Matrices for the 1^ graders. Table 3.2 shows the mean raw
score and the standard deviation as measured on the respective Ravens progressive
matrices.
Table 3.2: Distribution of raw scores on Ravens Progressive Matrices of the LD
and NLD participants.
Intelligence
Mean
SD
Std. Error
LD / 4th
25.7
3.57
0.65
Groups / Grades
NLD /4th LD / 7th
27.4 39.17
4.76 4.91
0.87 0.9
NLD / 7th
41.33
4.39
0.8
61
As can be seen from the above table the differences between the LD and the NLD
groups were not very much so that comparison between the groups in the respective
grade level was possible. The difference between LD and NLD among 4"" graders
was not significant, t (df-58) = 1.564; p < .05. The difference at the 1^ grade level
between LD and NLD was also not significant, t (df- 58) = 1.803; p < .05.
3) Emotional Disturbances :
Learning difficulties can also stem from emotional disturbances. Hence,
in order to rule out such children with emotional disturbances, Rutters Proforma A
& B (Rutter, 1967) was used. Proforma A identifies learning difficuUies and
Proforma B identifies emotional disturbances. Based on the Proforma B scores, the
participants were screened for emotional disturbances. The participants in whom
emotional disturbances were ruled out were chosen. Also care was taken that the
children chosen were not demonstrating gross hyperactive, attention and behavior
problems on observation.
4) Socio-Economic Status :
Another factor that can influence learning is the socio economic status of
family from which the individual comes. Hence, an attempt was made to control
the influence of this factor. A socio economic status scale (Shah, 1986) was
administered to all the participants. In order to control this factor, all the
62
participants who fell under the category of middle socio economic status only were
chosen for both LD & NLD groups.
5) Monthly test mark sheets :
Scholastic achievements are generally a good indicator of the presence or
absence of learning difficulties. Hence, to obtain this information, the academic
records having the marks obtained by the participants in their monthly, half yearly
and annual exam were collected. Academic performance records from previous
year and current year were examined for individuals selected by their respective
class teachers. Participants who had more than three consecutive failures in more
than three subjects for the past 6 months were chosen for the LD group. The
participants chosen for the NLD group had successfully passed in all the subjects'
previous year and in the current year.
Tools used in the study:
The tools used can be divided into two groups: A) Tests / tools for the
purpose of screening or selection of the participants. B) Tests for the main study.
The rationale, description and the scoring of the various tests are given below.
63
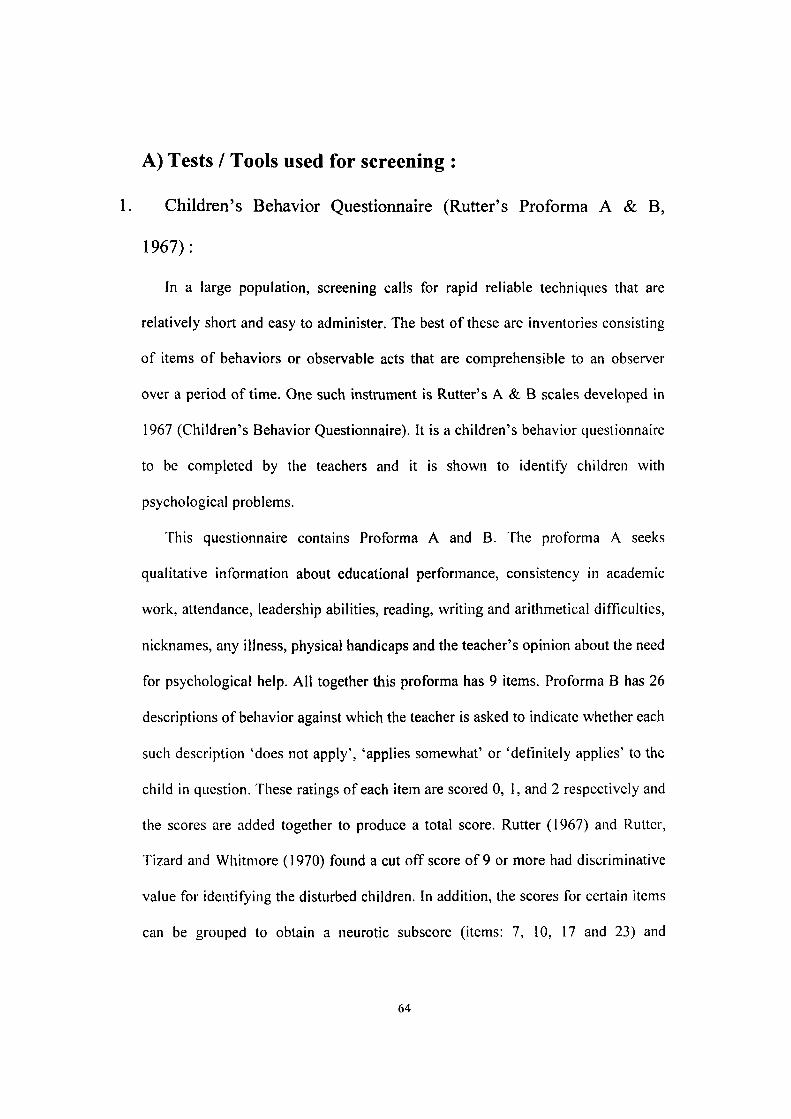
A) Tests / Tools used for screening :
1. Children's Behavior Questionnaire (Rutter's Proforma A & B,
1967):
In a large population, screening calls for rapid reliable techniques that are
relatively short and easy to administer. The best of these are inventories consisting
of items of behaviors or observable acts that are comprehensible to an observer
over a period of time. One such instrument is Rutter's A & B scales developed in
1967 (Children's Behavior Questionnaire). It is a children's behavior questionnaire
to be completed by the teachers and it is shown to identify children with
psychological problems.
This questionnaire contains Proforma A and B. The proforma A seeks
qualitative information about educational performance, consistency in academic
work, attendance, leadership abilities, reading, writing and arithmetical difficulties,
nicknames, any illness, physical handicaps and the teacher's opinion about the need
for psychological help. All together this proforma has 9 items. Proforma B has 26
descriptions of behavior against which the teacher is asked to indicate whether each
such description 'does not apply', 'applies somewhat' or 'definitely applies' to the
child in question. These ratings of each item are scored 0, 1, and 2 respectively and
the scores are added together to produce a total score. Rutter (1967) and Rultcr,
Tizard and Whitmore (1970) found a cut off score of 9 or more had discriminative
value for identifying the disturbed children. In addition, the scores for certain items
can be grouped to obtain a neurotic subscore (items: 7, 10, 17 and 23) and
64
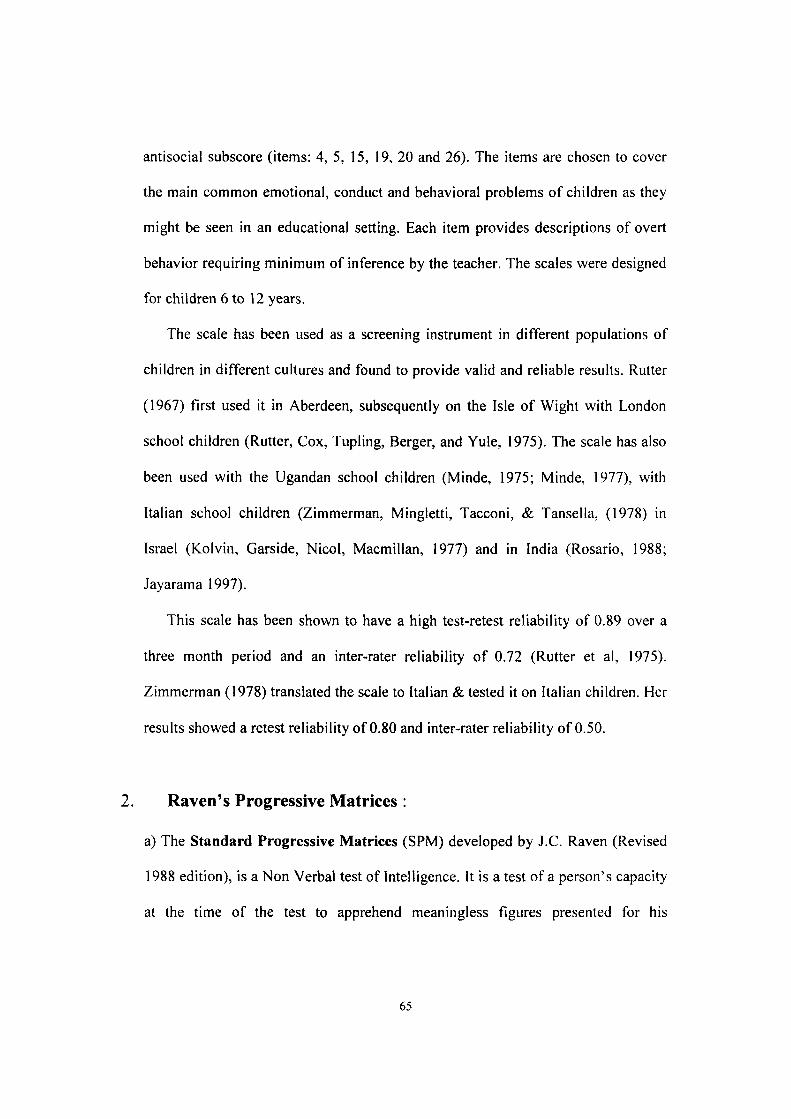
antisocial subscore (items: 4, 5, 15, 19, 20 and 26). The items are chosen to cover
the main common emotional, conduct and behavioral problems of children as they
might be seen in an educational setting. Each item provides descriptions of overt
behavior requiring minimum of inference by the teacher. The scales were designed
for children 6 to 12 years.
The scale has been used as a screening instrument in different populations of
children in different cultures and found to provide valid and reliable results. Rutter
(1967) first used it in Aberdeen, subsequently on the Isle of Wight with London
school children (Rutter, Cox, Tupling, Berger, and Yule, 1975). The scale has also
been used with the Ugandan school children (Minde, 1975; Minde, 1977), with
Italian school children (Zimmerman, Mingletti, Tacconi, & Tansella, (1978) in
Israel (Kolvin, Garside, Nicol, Macmillan, 1977) and in India (Rosario, 1988;
Jayarama 1997).
This scale has been shown to have a high test-retest reliability of 0.89 over a
three month period and an inter-rater reliability of 0.72 (Rutter et al, 1975).
Zimmerman (1978) translated the scale to Italian & tested it on Italian children. Her
results showed a retest reliability of 0.80 and inter-rater reliability of 0.50.
2. Raven's Progressive Matrices :
a) The Standard Progressive Matrices (SPM) developed by J.C. Raven (Revised
1988 edition), is a Non Verbal test of Intelligence. It is a test of a person's capacity
at the time of the test to apprehend meaningless figures presented for his
65
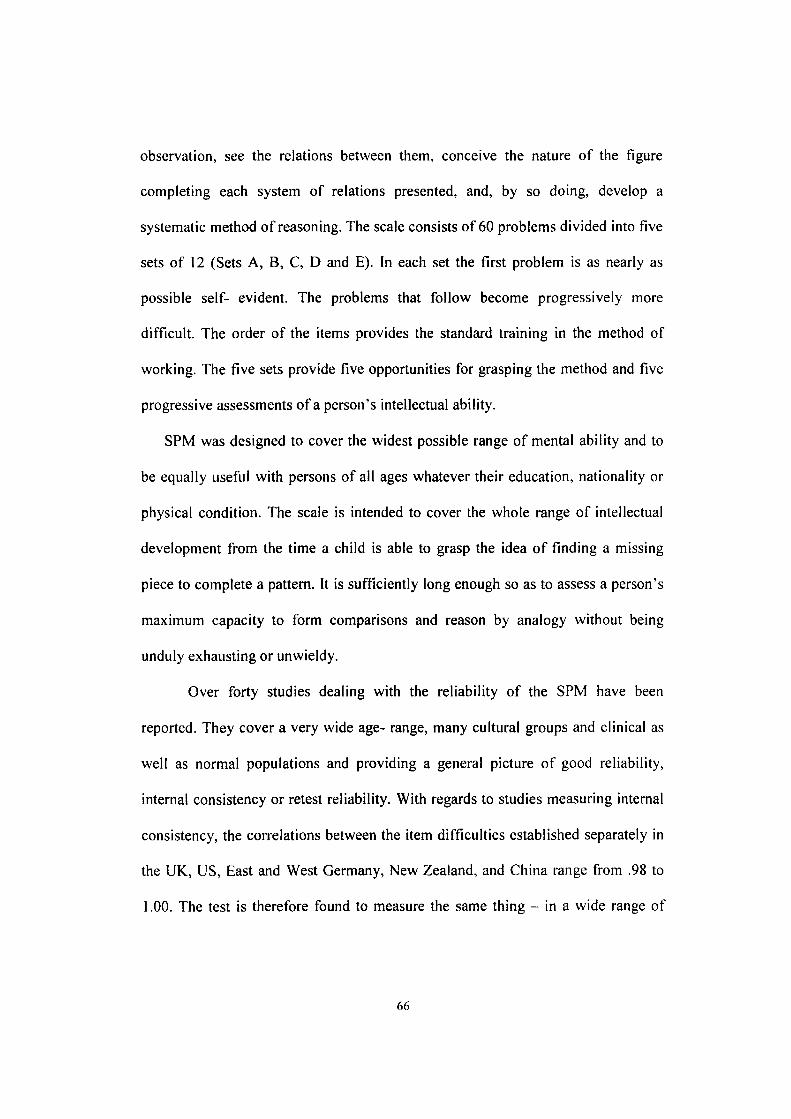
observation, see the relations between them, conceive the nature of the figure
completing each system of relations presented, and, by so doing, develop a
systematic method of reasoning. The scale consists of 60 problems divided into five
sets of 12 (Sets A, B, C, D and E). In each set the first problem is as nearly as
possible self- evident. The problems that follow become progressively more
difficult. The order of the items provides the standard training in the method of
working. The five sets provide five opportunities for grasping the method and five
progressive assessments of a person's intellectual ability.
SPM was designed to cover the widest possible range of mental ability and to
be equally useful with persons of all ages whatever their education, nationality or
physical condition. The scale is intended to cover the whole range of intellectual
development from the time a child is able to grasp the idea of finding a missing
piece to complete a pattern. It is sufficiently long enough so as to assess a person's
maximum capacity to form comparisons and reason by analogy without being
unduly exhausting or unwieldy.
Over forty studies dealing with the reliability of the SPM have been
reported. They cover a very wide age- range, many cultural groups and clinical as
well as normal populations and providing a general picture of good reliability,
internal consistency or retest reliability. With regards to studies measuring internal
consistency, the correlations between the item difficulties established separately in
the UK, US, East and West Germany, New Zealand, and China range from .98 to
1.00. The test is therefore found to measure the same thing - in a wide range of
66
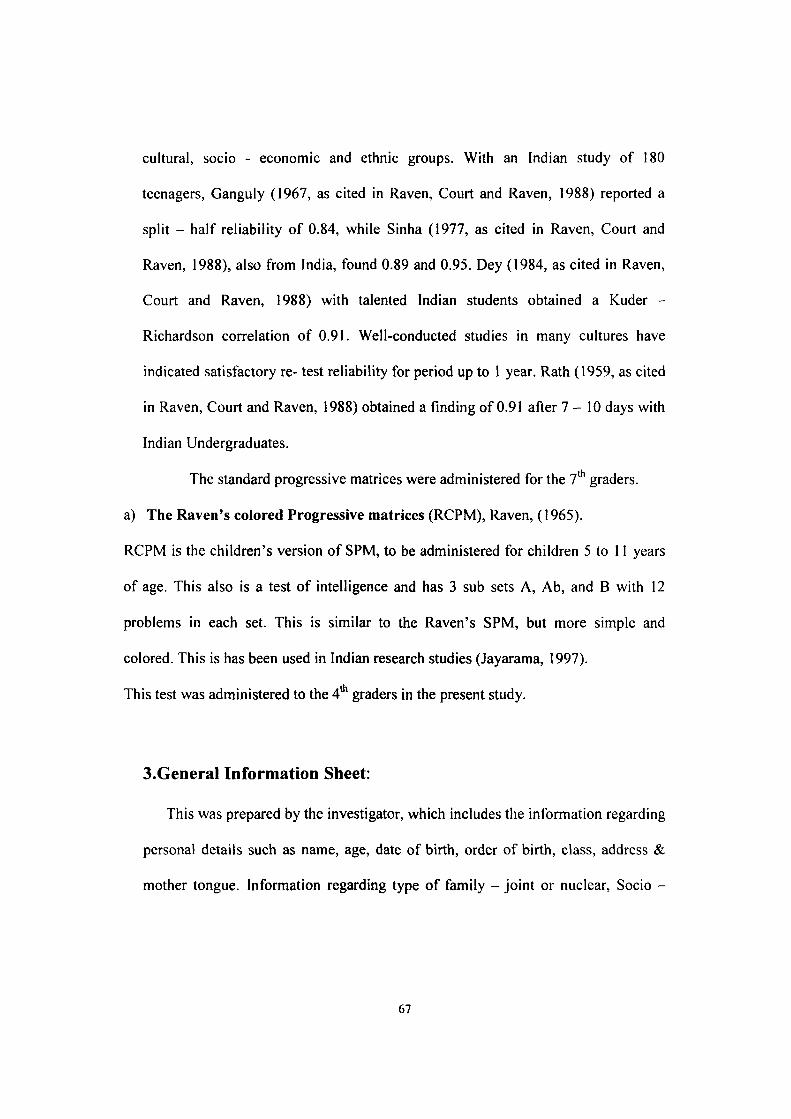
cultural, socio - economic and ethnic groups. With an Indian study of 180
teenagers, Ganguly (1967, as cited in Raven, Court and Raven, 1988) reported a
split - half reliability of 0.84, while Sinha (1977, as cited in Raven, Court and
Raven, 1988), also from India, found 0.89 and 0.95. Dey (1984, as cited in Raven,
Court and Raven, 1988) with talented Indian students obtained a Kuder -
Richardson correlation of 0.91. Well-conducted studies in many cultures have
indicated satisfactory re- test reliability for period up to 1 year. Rath (1959, as cited
in Raven, Court and Raven, 1988) obtained a finding of 0.91 after 7 - 1 0 days with
Indian Undergraduates.
The standard progressive matrices were administered for the 7* graders,
a) The Raven's colored Progressive matrices (RCPM), Raven, (1965).
RCPM is the children's version of SPM, to be administered for children 5 to 11 years
of age. This also is a test of intelligence and has 3 sub sets A, Ab, and B with 12
problems in each set. This is similar to the Raven's SPM, but more simple and
colored. This is has been used in Indian research studies (Jayarama, 1997).
This test was administered to the 4**̂ graders in the present study.
3.General Information Sheet:
This was prepared by the investigator, which includes the information regarding
personal details such as name, age, date of birth, order of birth, class, address &
mother tongue. Information regarding type of family - joint or nuclear. Socio -
67
ecconomic status & religion were also included. The purpose of this sheet was to
organize and record the relevant information and the data individually.
4. Socio-Economic Status Scale (Shah, 1986).
This Socio-economic status measure is an improved scientific scale among the
existing Socio-economic Status Scales, because of following reasons :
(1) Identifies correct categories of social economic status.
(2) More accurate measurement of social economic status is achieved with
the help of 6 variables namely (a) caste (b) occupation (c) education (d) income (e)
Possession (f) social participation.
(3) Occupational status is measured as the average score of two basic
indicators of family occupation (occupation of parents and main occupation of the
family).
(4) Educational status of family is considered by taking the average score of
educational level of father, mother & sibling.
(5) Economic status is measured by total income of family divided by family
size. For this score, income tax and property tax payment is also considered.
(6) Score to the different articles possessed by the family is assigned according to
the cost and quality of material.
Test-retest reliability was 0.92 for 20 days and 0.89 for 30 days time interval.
Validity for 6 component variable with composite socio - economic scores were as
68
follows - Caste - 0.72; occupation - 0.82; education - 0.86; income - 0.83;
possession - 0.78; social participation - 0.69.
Scoring : The total score from all the categories were converted into Staninie scale.
The social economic status were classified into five categories - lower status (LS),
Lower middle status (LMS), middle status (MS), upper middle status (UMS), and
upper status (US) depending on the distribution of the scores.
3. Monthly test marks sheet:
The academic records indicating the monthly marks for all monthly tests / exams
conducted in the school of the students selected by their respective class teachers as
LD and NLD were collected by the investigator from the school. This gave the
investigator an opportunity to examine the performance of the participants in the
monthly tests and hence was able to choose the participants for the study to group
the participants according to LD / NLD.
B) TOOLS FOR MAIN STUDY :
1. Test for Attention & Concentration : Double digit cancellation
test.
This test consists of numbers from 1 to 5 randomly arranged in a matrix of 25 rows
& 25 columns on a sheet of paper. All the 5 numbers occur in a random manner
equal number of times. The task of the participant is to cancel or mark on 2 digits,
as instructed by the investigator wherever it has occurred on the sheet. The
69
investigator notes down, the time taken by tiie individual to complete the task and
the errors committed are counted. This test has been successfully used by many
researchers and is still being used in institutes such as NIMHANS, Bangalore. The
task taps the individual's attention and concentration.
2. Test for Visuo Motor skills : Minnesota perceptuo diagnostic test.
(MPD) (Fuller & Laird, 1963).
This test consists of six gestalt designs, which the participant needs to copy.
The reproduced designs are scored for degrees of rotation. The test is a culture free
test. The MPD test provides a rapid and objective method of identifying children
with reading disability who suffer from perceptual impairment.
The test- retest reliability reported in the literature ranged from 0.89 to 0.71.
With regard to validity, the authors reported that 85% of the Reading disability and
92% of normal children were identified with the help of this test.
The participant was provided with 8 V^ x 11-inch white paper, pencil and
erasers. After placing the sheet in front of the participant, he was told "I am going
to show you six cards, one at a time. Each card contains a figure. Copy the figure
on this paper. Number each figure as you draw it".
Scoring for the degree of rotation was done with the help of a protractor and
a ruler as described in the manual. Maximum score = 150.
70
3. Language test : Gates Reading Diagnostic Test (Gates. McKillop &
Horowitz, 1980) (sub tests - Oral Reading, Words Flash, Words Untimed &
Spelling).
This is a Reading diagnostic testing tool used to assess reading and writing
skills of children. It is an individually administered test. The test was primarily
constructed as a means to help the teacher / learning specialist to examine the
performance of the child and to assess the strengths & weakness of the child.
Only sub tests Oral Reading, Words : Flash, Words : untimed and Spelling
were administered in the present study. These tests were used so as to keep the test
materials constant for both the grade levels,
a) Oral Reading :
The Oral Reading test was designed to assess the child's use of both
context or meaning clues and word form clues in word recognition. The oral
paragraphs contain both phonetically regular and irregular words. The test has
seven paragraphs starting from easy three letter words and four-line paragraph to
more difficult 10-letter words & 8 or 9-line paragraphs. The participant reads the
paragraphs aloud while the examiner records.
The page containing the material to be read is only exposed to the
participant. The investigator instructs to the child, "I'd like you to read these
paragraphs out loud for me. Begin with the first paragraph. If you find some hard
words, say them as well as you can and go on reading". The test was continued
until all the passages were read. The total time taken to read as well as the number
71
of errors made was recorded. The type of errors that were recorded was omissions,
additions, repetitions & mispronunciation (whole or part). Self-corrections were not
counted as errors. Based on the errors the raw scores were calculated. Since the
test has not been standardized for Indian children, raw scores were not converted to
grade scores.
b) Words : Flash & Words : Untimed
These two tests are designed to evaluate the child's ability to read isolated words
without the aid of context clues. On Words : Flash, the brief exposure of each word
prevents an opportunity for detailed study of the word. Hence the child's
performance here measures the ability to recognize a word instantly or by sight.
Conversely, on Words: Untimed, the child is allowed time to study a word before
pronouncing it. Performance on this test thus is a measure of word analysis or word
attack skills. These two tests were chosen so that, a Comparison between them
would provide useful information.
In Words: Flash test, only one word is exposed for not more than one - half
second, by using a tachistoscope. The examiner instructs the child as follows - "I
have a word covered up by this card. When I move the card down, the word will
show through the opening. I will give you a quick look at the word then cover up
again. Watch carefully to see the word and tell me what it is. So that you will be
ready, I will say 'ready' just before 1 show the word." Totally there are 40 words
ranging from two letter words to twelve letter words. No second chance is given &
number of correct responses is the raw score.
72
In Words : Untimed, the child is asiced to read from the test material which
consists four columns of words with the range of difficulty increasing from the P'
column to the next. The child is given all the time he needs &. if he does not know
the word right away, he is instructed to figure it out. The 1*' column with the easiest
words is asked to be read first and then to proceed to the 2"'' column. Totally there
are 60 words. Scoring is by assigning I point to each word pronounced correctly on
the r ' trial & '/z point to the words pronounced correctly on the 2"'' trial. The raw
score is the total number of points earned.
c) Spelling:
The spelling list consists of 40 words ranging from very easy two letter words to
harder twelve letter words. The child is asked to write spelling words as they are
dictated. As the meanings of the words can became difficult, sentences were used
as per the example as follows -
is The cat is in the room. is
The sentences used were consistent for all participants. The number of correct
words is the raw score.
d. Writing: The participants were asked to copy the first four paragraphs of the
oral reading test from the Gates Oral Reading lest material. The errors were
73
subjected to a qualitative analysis according to a list of errors prepared by the
investigator similar to the list suggested in the Gates reading diagnostic test
manual.
4. Arithmetic : Sub test from NIMHANS index of specific Learning
Disabilities (Kapur,John, Rozario,and Oomen, 1992,)
The Arithmetic portion of the NIMHANS battery consists of Simple arithmetic,
Graded arithmetic and Fractions. The range of difficulty is from very Easy (Simple)
to slightly higher level (Graded) to higher level (Fraction). Due to this nature of the
test i.e., gradually increasing in difficulty, the test was chosen, as it can be
administered to participants in the present study for both 4"̂ grade and 7* grade
levels.
Simple arithmetic has problems in simple addition, simple subtraction, simple
multiplication and simple division. There are 5 problems in each.
Graded arithmetic has graded addition, graded subtraction, graded
multiplication & graded division where in digit has to be carried over for
further solution of the problems.
Fraction has problems in fractional addition, subtraction,
multiplication and division.
The total number of problems solved correctly is the score.
74
5. Visual Memory test : Memory for Designs test (MFD), (Graham &
Kendall, 1960).
As the title suggests, this is a test of visual memory. MFD involves the
presentation of simple geometric designs & the reproduction of these designs from
memory. Test materials consists of five inch cardboard square with a design printed
in black. There are totally fifteen designs and all the designs are composed of
straight lines since it seemed more likely that errors in reproducing curved lines
would be more difficult to score objectively. The designs are exposed one at a time
for 5 seconds. After the 5 seconds exposure, the design is withdrawn & the subject
is asked to draw one like it. It generally takes 5 -10 minutes to complete the test.
Scoring : Each design is scored on a 4 - point scale with values from 0 - 3 based on
number & the kind of errors. The total score is the sum of the scores on the 15
individual designs; the higher the score, the poorer the performance.
6. Auditory Memory Tests :
1) Paired Associate Learning - Sub test from 'NIMHANS Index of Specific
Learning Disabilities (Kapur, et al, 1992)'.
This is a sub test in NIMHANS Index of Specific Learning Disabilities,
to test the auditory memory. It involves the presentation of pairs of words to the
child, and then the child has to repeat the word that was said in association with the
prompting word being asked by the investigator. There are two types of paired
association words used in the test -
75
a) Familiar or Similar words. Ex: Dog / Cat. b) Unfamiliar or Dissimilar words.
Ex: Cow / Spoon. There are six pairs of words in each. All the six pairs of
familiar words are presented to the child and tested for memory by the prompt of
one of the pair. A maximum of five trials only is given. Following the familiar, the
unfamiliar paired word set is presented & the child is tested after each trial as
above. The number trials needed for the participant to get all the answers correct
are the score for that set of words. If no learning takes place it is scored as 5. So the
higher the score the poorer the performance.
2) Serial Recall test : (Investigator made)
This test was translated from Oriya (Das, 1982). This test consisted of
twelve set of words which began with a four word series and progressed to six
word series. There were four sets for each the four, five and six word series.
The child is instructed "I am going to read a few words, listen carefully. After 1
finish reading, you have to repeat the words in the same order". There is no time
limit. The purpose of using this test was to test the child's short- term memory
(verbal) through auditory mode, after being presented only once.
Scoring : The number of words reproduced in the correct order is scored. Each
correct word carries one score. Maximum = 60.
76
Tests for Social - Emotional Functioning :
6. Pre - adolescent Adjustment Scale (PAAS), (Pareek, Rao,
Ramalingaswamy and Sharma, 1976.)
The Pre-adolescent Adjustment Scale (PAAS) measures the adjustment of the
individual towards home, peers, school, teachers and general matters. The scale is
an inventory of questions answered by the participants and it consists of 40 items :
home (9), school (8), teachers (8), peers (8), and general (7). For each area of
adjustment a separate score is obtained. The total of the 5 scores gives the score for
total adjustment. High positive scores indicate high adjustment in the area, while
high negative scores indicate maladjustment.
PAAS has validated with the ratings of the teachers from four schools. The
teachers were asked to name five most adjusted and five most maladjusted, after
they were given the meaning of adjustment and maladjustment. Mann- Whitney U
values were calculated for each area of adjustment, for each of the four schools.
The U values were significant at .05 level or above in one or more areas and at an
acceptable level of validity in all the other areas.
For Reliability of the scale, retest data were obtained from five schools with an
interval of three months between test and retest. Product movement correlations
showed an acceptable level of reliability. To find out the interrelationship between
adjustment scores on the 5 areas of adjustment, Pearson's correlations were
77
calculated between scores on the 5 areas. All the coefficients of correlation were
significant at .01 level.
8. Culture - Free Self Esteem Inventory for children (SEI) - James Battle,
(Form - A) 1981.
This scale was developed by Battle (1981). The 60 item form is classifiable into 5
subscales.
a) General self- esteem.
b) Social / peer related self- esteem.
c) Academic / school related self - esteem.
d) Parents / home related self - esteem.
e) Lie scale, indicating defensiveness.
These sub - scales were derived through factor analysis. The inventory may
be administered individually or in groups. The scores for SEI are derived by
totaling the number of items checked which indicates high self esteem, excluding
the lie scale items. The highest possible score on Form A is 50 and on the lie scale
is 10. Separate sub - scale scores can be calculated.
One hundred and ninety eight boys and girls, enrolled in grades three through six ,
in three schools participated in the initial test-retest reliability study for Form A.
test retest correlations for the total sample ranged from 0.81 to 0.89. Similar results
were obtained (Battle 1978) in a study which employed boys and girls enrolled in
grades one through eight in 32 schools. Sex was not found to be a significant
78
variable affecting self esteem scores on all scales of Form A. Indian norms were
calculated on a sample of 184 boys and 184 girls of IX grade from English medium
schools (Vinutha, Rajini and Nagalashmi, 1989).
9. Self-Perception of Learning Disability Scale (SPLD) - Heyman, 1988.
This is a 25 item scale, measuring the extent to which children with
Learning disability perceive their disability as, (a) delimited rather than global; (b)
modifiable rather than permanently limiting and (c) not stigmatizing.
Each item is a statement with which students agree or disagree by circling
True or False. There is a balance of positively keyed responses with a point
assigned for each item answered in the neutral or positive direction. Thus low
SPLD scores represent a negative perception of the learning disability and high
scores, a more neutral perception.
An initial pool of 28 items was revised for clarity, face validity and piloted on a
sample of 12 learning disabled children between ages 8 - 1 1 years. Based on their
feedback, some items were modified, eliminated or added by the author of the
scale. The 33 item scale was then piloted on the 147 Crombach's alpha 0.75
indicating high internal consistency. 15 items with total correlations below 0.20
were dropped.
For the final 25 item scale, 7 items were added. Coefficient alpha was 0.70 in a
sample of 67 learning disabled children aged 9 through 11 years, 11 months. The
79
item total correlations of new items ranged from 0.21 - 0.43. Final SPLD scores
ranged from 3 to 23 with an average score of 16.8 and standard deviation of 3.74.
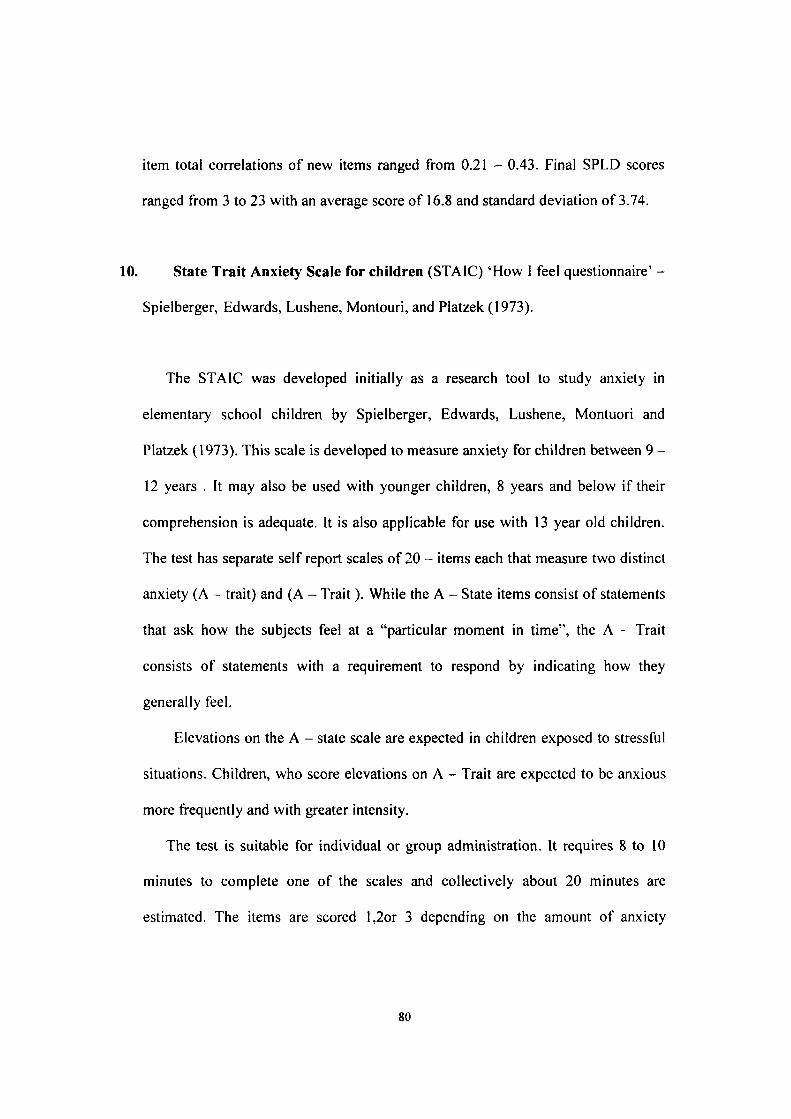
10. State Trait Anxiety Scale for children (STAIC) 'How I feel questionnaire' -
Spielberger, Edwards, Lushene, Montouri, and Platzek(1973).
The STAIC was developed initially as a research tool to study anxiety in
elementary school children by Spielberger, Edwards, Lushene, Montuori and
Platzek (1973). This scale is developed to measure anxiety for children between 9 -
12 years . It may also be used with younger children, 8 years and below if their
comprehension is adequate. It is also applicable for use with 13 year old children.
The test has separate self report scales of 20 - items each that measure two distinct
anxiety (A - trait) and (A - Trait). While the A - State items consist of statements
that ask how the subjects feel at a "particular moment in time", the A - Trait
consists of statements with a requirement to respond by indicating how they
generally feel.
Elevations on the A - state scale are expected in children exposed to stressful
situations. Children, who score elevations on A - Trait are expected to be anxious
more frequently and with greater intensity.
The test is suitable for individual or group administration. It requires 8 to 10
minutes to complete one of the scales and collectively about 20 minutes are
estimated. The items are scored l,2or 3 depending on the amount of anxiety
80
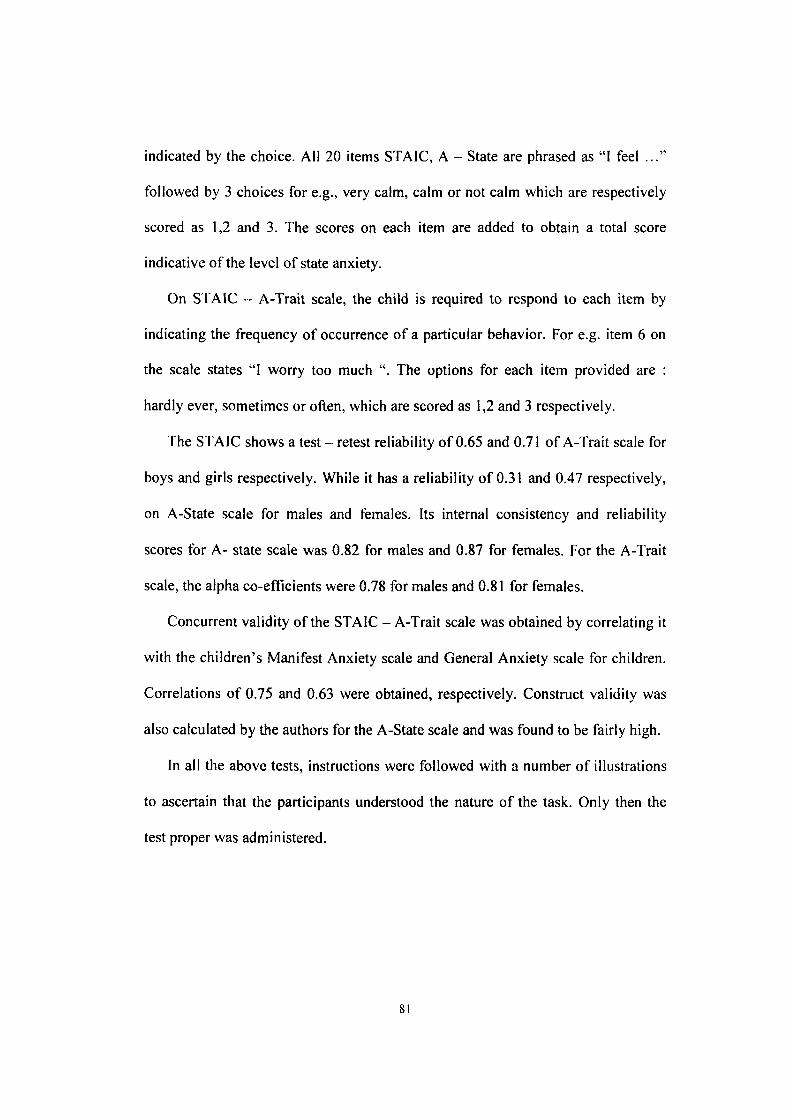
indicated by the choice. All 20 items STAIC, A - State are phrased as "I feel ..."
followed by 3 choices for e.g., very calm, calm or not calm which are respectively
scored as 1,2 and 3. The scores on each item are added to obtain a total score
indicative of the level of state anxiety.
On STAIC - A-Trait scale, the child is required to respond to each item by
indicating the frequency of occurrence of a particular behavior. For e.g. item 6 on
the scale states "I worry too much ". The options for each item provided are :
hardly ever, sometimes or often, which are scored as 1,2 and 3 respectively.
The STAIC shows a test - retest reliability of 0.65 and 0.71 of A-Trait scale for
boys and girls respectively. While it has a reliability of 0.31 and 0.47 respectively,
on A-State scale for males and females. Its internal consistency and reliability
scores for A- state scale was 0.82 for males and 0.87 for females. For the A-Trait
scale, the alpha co-efficients were 0.78 for males and 0.81 for females.
Concurrent validity of the STAIC - A-Trait scale was obtained by correlating it
with the children's Manifest Anxiety scale and General Anxiety scale for children.
Correlations of 0.75 and 0.63 were obtained, respectively. Construct validity was
also calculated by the authors for the A-State scale and was found to be fairly high.
In all the above tests, instructions were followed with a number of illustrations
to ascertain that the participants understood the nature of the task. Only then the
test proper was administered.
81
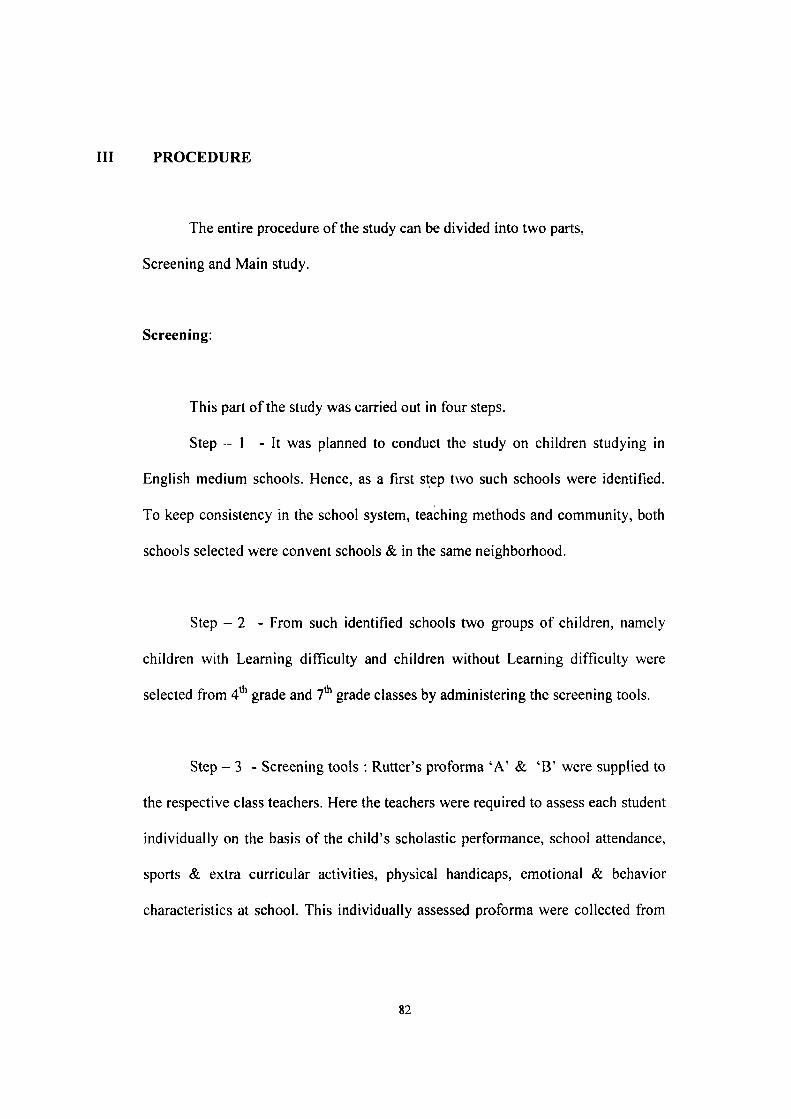
Ill PROCEDURE
The entire procedure of the study can be divided into two parts,
Screening and Main study.
Screening:
This part of the study was carried out in four steps.
Step - 1 - It was planned to conduct the study on children studying in
English medium schools. Hence, as a first step two such schools were identified.
To keep consistency in the school system, teaching methods and community, both
schools selected were convent schools & in the same neighborhood.
Step - 2 - From such identified schools two groups of children, namely
children with Learning difficulty and children without Learning difficulty were
selected from 4**̂ grade and 7"̂ grade classes by administering the screening tools.
Step - 3 - Screening tools : Rutter's proforma 'A' & 'B' were supplied to
the respective class teachers. Here the teachers were required to assess each student
individually on the basis of the child's scholastic performance, school attendance,
sports & extra curricular activities, physical handicaps, emotional & behavior
characteristics at school. This individually assessed proforma were collected from
82
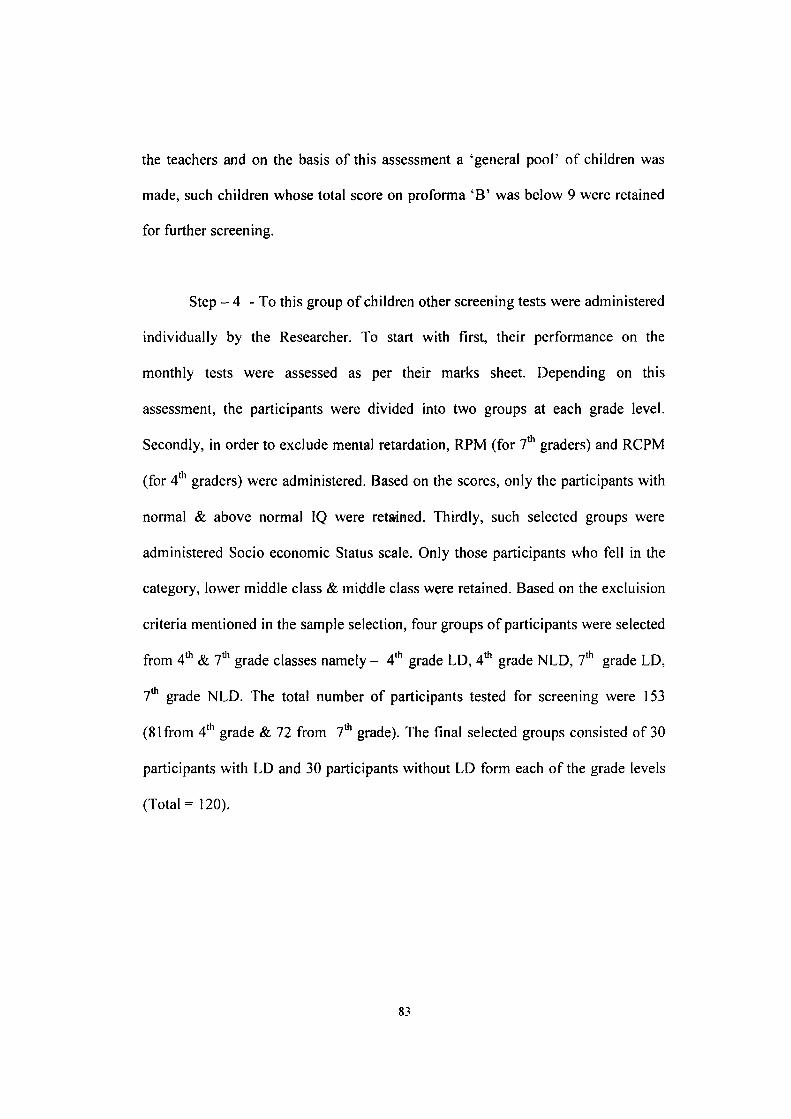
the teachers and on the basis of this assessment a 'general pool' of children was
made, such children whose total score on proforma 'B' was below 9 were retained
for further screening.
Step - 4 - To this group of children other screening tests were administered
individually by the Researcher. To start with first, their performance on the
monthly tests were assessed as per their marks sheet. Depending on this
assessment, the participants were divided into two groups at each grade level.
Secondly, in order to exclude mental retardation, RPM (for 7* graders) and RCPM
(for 4"̂ graders) were administered. Based on the scores, only the participants with
normal & above normal IQ were retained. Thirdly, such selected groups were
administered Socio economic Status scale. Only those participants who fell in the
category, lower middle class & middle class were retained. Based on the excluision
criteria mentioned in the sample selection, four groups of participants were selected
from 4"' & 7"' grade classes namely - 4"̂ grade LD, 4*̂ grade NLD, 7"̂ grade LD,
7"̂ grade NLD. The total number of participants tested for screening were 153
(81 from 4"̂ grade & 72 from 7**̂ grade). The final selected groups consisted of 30
participants with LD and 30 participants without LD form each of the grade levels
(Total =120).
83
The Main Study
Every test was administered individually. Proper care was taicen to develop
rapport with each participant & their interest, cooperation and motivation were
attempted to be maintained through out the assessment session. Whenever required
sufficient interval of rest between one test to another was provided. The procedure
of testing & scoring has already been described in the previous section. The testing
was carried out within one academic year during the months from September and
February.
84