Embed Size (px)
Citation preview
Research article
Received: 25 October 2013, Revised: 24 April 2014, Accepted: 5 May 2014 Published online in Wiley Online Library
(wileyonlinelibrary.com) DOI 10.1002/bmc.3265
Method development and validation study forquantitative determination of nifedipine andrelated substances by ultra-high-performanceliquid chromatographyCristobal Galan-Rodrigueza, Jaime González-Álvarezb
and Màrius Valls-Remolía*
ABSTRACT: A novel stability-indicating reversed phase ultra-high performance liquid chromatography (UPLC) coupledphotodiode array gradient method was developed for determination of the nifedipine and related compounds. Furthermore,based on the chromatographic conditions and forced degradation studies performed through the development of the relatedsubstances method a UPLC isocratic method was validated for the determination of the assay of this active substance. AnAcquity Shield RP18 (50× 3.0mm 1.7μm) column was used for separation of nifedipine and its five potential impurities within11min, which is 5-fold less than the official method. A mobile phase consisting of 10mM ammonium formate (pH 4.5) andmethanol, delivered at a flow rate 0.5mL/min, was employed to achieve a minimum resolution of 2.0 for all consecutive pairsof compounds. The precision value expressed as percentage relative standard deviation for method repeatability andreproducibility was <5.0%. The recoveries for all the related compounds were in the range of 99–105.0%. Linearity wasfound to be acceptable over the concentration range of 0.25–1.5 μg/mL for nifedipine and its impurities. The limit ofquantification for nifedipine was 0.05μg/mL, which is much less than the European Pharmacopoeia method. Copyright ©2014 John Wiley & Sons, Ltd.
Additional supporting information may be found in the online version of this article at the publisher’s web site.
Keywords: nifedipine; UPLC; validation
* Correspondence to: M. Valls-Remolí, Research and DevelopmentDepartment, Moehs Ibérica, Barcelona, Spain. Email: [email protected]
a Moehs Ibérica, Research and Development Department, Polígono IndustrialCova-Solera C.P. 08191, Rubí, Barcelona
b Moehs Cántabra, Quality Control Department, Polígono IndustrialRequejada S/N, C.P. 39312, Polanco, Santander
Abbreviations used: API, active pharmaceutical ingredient; PDA, photodi-ode array; PQL, practical quantification limit.
IntroductionNifedipine, 1,4-dihydro-2,6-dimethyl-4-(2-nitrophenyl)-3,5-pyridinedicarboxylic acid dimethyl ester, one of the most potent calcium-channel blockers, belongs to the group of 1,4-dihydropyridines(Stone et al., 1980). Like other calcium-channel blockers, theaction of nifedipine consists of blocking the flow of calcium intothe muscle cells surrounding the arteries that supply blood tothe heart (coronary arteries, as well as other arteries of thebody). Nifedipine is widely used to treat angina, high bloodpressure and abnormal heart rhythms (Wenzel et al., 1997;Frohlich et al., 1991).Nifedipine is absorbed almost completely by the gastrointestinal
tract, but its bioavailability is in the range 56–77% owing to thepresystemic metabolism (Raemsch and Sommer, 1983). Moreover,it is highly sensitive to light and chemical oxidation (Raemsch andSommer, 1983; Pietta et al., 1981; Kondo et al., 1980).For the detection of nifedipine several analytical methods,
mainly liquid chromatography techniques (LC), coupled with dif-ferent detection systems like UV (Niopas and Daftsios, 2003),electrochemical (Tolokan et al., 1997) or mass detection (Funget al., 2003; Dankers et al., 1998), have been used. Among them,only LC coupled with UV detection achieved quantification limits<2 ng/mL (Nakamura et al., 1999).Determination of nifedipine by high-performance liquid chro-
matography (HPLC) is a time-consuming method that constitutesthe main disadvantage of using these techniques. Ultra-high
Biomed. Chromatogr. 2014 Copyright © 2014 John
performance liquid chromatography (UPLC) is a recentlydeveloped technology that utilizes high linear velocities; it ischaracterized by using columns resulting from the packing ofsmall particles (1.7–1.8 μm porous particles), and operatesunder high-pressure conditions (up to 15,000psi). This approachaffords improvements such as higher peak capacities, improvedresolution, increased sensitivities and shorter speeds of analysis(de Villiers et al.. 2006). With this technique, system volumes areminimized so as to maintain speed, resolution and sensitivity ofanalysis (Kazachevich and McNair, 1996; MacNair et al., 1999; Wuet al., 2001). Moreover, the reduction of particle diameter reducesthe height equivalent of theoretical plate, which results in greaterefficiency (Van Deemter et al., 1956).
Peak capacity (the maximum number of resolved peaks thatreflects the overall performance of the column) is a function of
Wiley & Sons, Ltd.

C. Galan-Rodriguez et al.
column efficiency, gradient time, flow rate and analyte charac-teristics. In other words, it is the runtime measured in peak widthunits. It is assumed that peaks occur over the gradient chromato-gram. Therefore, peak capacity can be calculated from the peakwidths w in the chromatogram as follows:
1þ tg
1=nð ÞXn
1w
where n is the number of peaks at the segment of the gradientselected for the calculation, tg. Thus peak capacity can be simplythe gradient run time divided by the average peak width. Thesharper the peaks are, the higher the peak capacity is, so thesystem should be able to resolve more peaks at the selectedrun time as well as detect lower concentrations. Figure 1 showsthe peak capacity comparison between HPLC and UPLC fornifedipine and related substances.Several studies have been carried out to examine the peak
capacity from both experimental and theoretical viewpoints(Dolan et al.. 1999; McCalley, 2004; Neue and Mazzeo, 2001;Wren, 2005). The first applications of UPLC were applied to thestudy of drugs, metabolomics and genomic applications (Plumb,2004; Wilson, 2005; Castro-Pérez, 2005). The application of UPLC/MS resulted in superior separation and improved spectral qualitycompared with HPLC.Over the last few years, some reports about the detection of
nifedipine by UPLC have been published, all of them based onthe nifedipine determination in human plasma (Patel et al.,2012; Wang et al., 2011). The stability studies carried out in theseworks refer to the stability of nifedipine in human plasma; thestability of nifedipine as an active pharmaceutical ingredient(API) has not been studied in these cases. On the other hand,an up-to-date analytical method to determine the relatedsubstances in nifedipine as an API has not yet been developed.
Figure 1. Peak capacity comparison between HPLC and UPLC for Nifedwere: 1) Waters Spherisorb S5 ODS2 C18 150 × 4.6mm×5μm, mobile pharate 1mL min�1, and detection wavelenght 235 nm at 30°C for HPLC anametanol and buffer 10mM ammonium formate pH 4.5 (see table 1 for g235 nm at 40°C for UPLC analysis.
Copyright © 2014 Johnwileyonlinelibrary.com/journal/bmc
This paper reports, for the first time, the development andvalidation of a simple, selective and specific UPLC–photodiodearray (PDA) method for the analysis of nifedipine and its relatedsubstances following the International Conference on Harmoni-zation (1996) guidelines.The stabilities of nifedipine samples have also been studied. A
relevant advantage of this method, in comparison to the onedescribed in the European Pharmacopoeia, is that it allows theseparation of the pyrimidine impurity from the nifedipine,obtaining resolutions >3 for all cases.
Experimental
Reagents
Reference standards of nifedipine and methyl 2-(2-nitrobenzylidene)-3-oxobutanoate (Impurity C) were synthesized by Moehs Iberica(Barcelona, Spain). Methanol of HPLC grade was obtained from Panreac(Barcelona, Spain) and formic acid and ammonium formate were pur-chased from Fluka (Darmstand, Germany). Purified water was collectedthroughMilli-Q Plus water purification system (Millipore, Milford, MA, USA).
Dimethyl 2,6-dimethyl-4-(2-nitrophenyl)pyridine-3,5-dicarboxylate(impurity A) and dimethyl 2,6-dimethyl-4-(2-nitrosophenyl)pyridine-3,5-dicarboxylate (impurity B), were obtained from European Directoratefor the Quality of Medicines & Health Care (Strasbourg, France). Methyl-6-methyl-2,4-bis(2-nitrophenyl)-1,2,3,4-tetrahydropirimidine-5-carbolxylate(impurity pirimidine) and methyl 5-carbamoyl-2,6-dimethyl-4-(2-nitrophenyl)-1,4-dihydropyridine-3-carboxylate (impurity amide), were synthesized byMoehs Iberica (Barcelona, Spain)
Apparatus and conditions
The chromatographic separations were performed on an Acquitytm UPLCsystem (Waters Corp., Milford, MA, USA) with cooling autosampler andcolumn oven. An Acquity UPLC BEH Shield RP18 column (50 × 3mm,1.7μm; Waters Corp., Milford, MA, USA) was used for the separation.
ipine and related substances. The chromatographic conditions usedse water, methanol and acetonitrile (55/36/9 isocratic program), flowlysis, 2) Waters BEH Shield RP18 (50 × 3.0mm× 1.7μm), mobile phaseradient program), flow rate 0.5mL min�1 and detection wavelenght
Biomed. Chromatogr. 2014Wiley & Sons, Ltd.
Determination of nifedipine by UPLC
The mobile phase was composed of: (A) ammonium formate 10mM
with pH adjusted to pH4.5 with formic acid; and (B) methanol. Theautosampler was conditioned at 15 ºC and 2.0μL of sample solutionwas injected.
The UPLC system operated in gradient (Table 1) at a flow rate of0.5mL/min at 40 ºC and the detector was set at 235 nm. Under theseconditions, the run time analysis was 11min. The assay conditions aregiven in the Supplementary Material.
Standard solutions
The development and validation method was carried out using ambervolumetric material and the solutions had to be protected from light toprevent nifedipine photodecomposition (Grundy et al., 1994). Standardstock solution was prepared by dissolving nifedipine, impurity A, impurityB and impurity C (10mg of each one) in 20mL of Milli-Q water–methanol(30:70 v/v). A 1mL aliquot of this solution was further diluted to 100mLwith a Milli-Q water–methanol mixture (30:70 v/v) (solution 1). Finally, thedesired concentration of the standard solution was prepared by diluting1mL of solution 1 to 10mL with Milli-Q water–methanol (30:70 v/v). A25mg aliquot of nifedipine were dissolved in 50.0mL of Milli-Qwater–methanol (30:70 v/v) mixture, to afford a 0.5mg/mL sample solution.
Method validation
The method was validated for selectivity, linearity, precision, accuracy,extraction recovery, matrix effect and stability in accordance with inter-national guidelines (US Department of Health and Human Serviceset al., 1994, 2001, 2012).
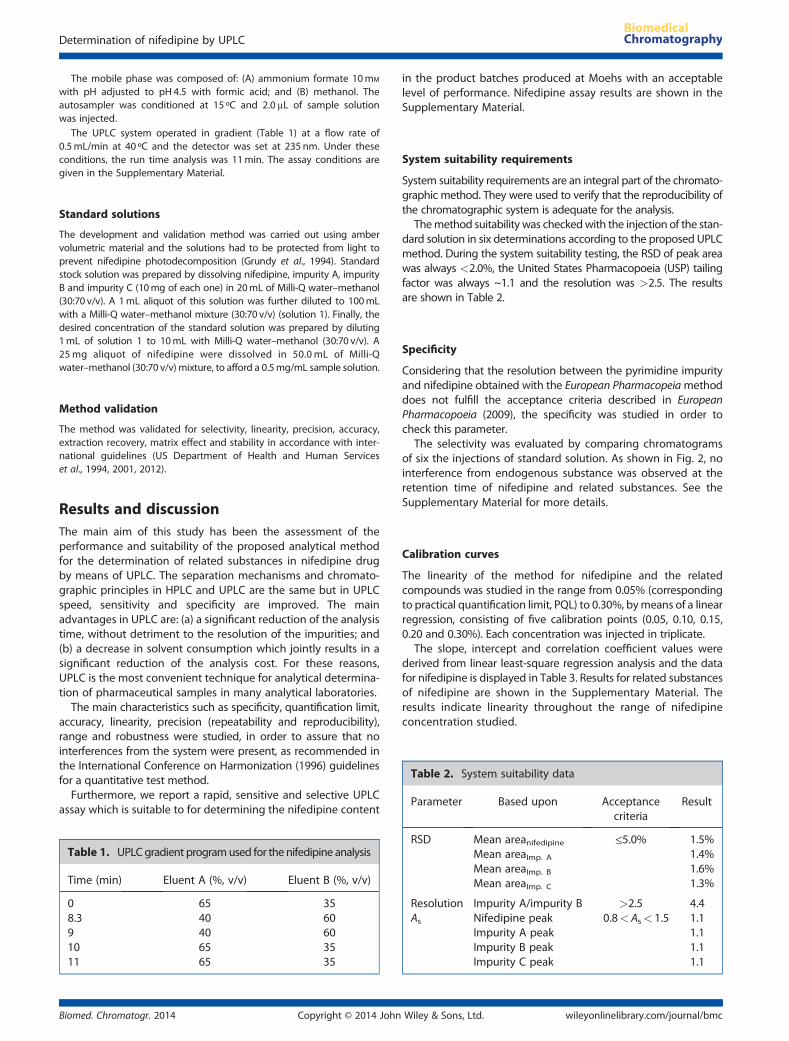
Table 2. System suitability data
Parameter Based upon Acceptancecriteria
Result
Results and discussionThe main aim of this study has been the assessment of theperformance and suitability of the proposed analytical methodfor the determination of related substances in nifedipine drugby means of UPLC. The separation mechanisms and chromato-graphic principles in HPLC and UPLC are the same but in UPLCspeed, sensitivity and specificity are improved. The mainadvantages in UPLC are: (a) a significant reduction of the analysistime, without detriment to the resolution of the impurities; and(b) a decrease in solvent consumption which jointly results in asignificant reduction of the analysis cost. For these reasons,UPLC is the most convenient technique for analytical determina-tion of pharmaceutical samples in many analytical laboratories.The main characteristics such as specificity, quantification limit,
accuracy, linearity, precision (repeatability and reproducibility),range and robustness were studied, in order to assure that nointerferences from the system were present, as recommended inthe International Conference on Harmonization (1996) guidelinesfor a quantitative test method.Furthermore, we report a rapid, sensitive and selective UPLC
assay which is suitable to for determining the nifedipine content
Table 1. UPLCgradient programused for the nifedipine analysis
Time (min) Eluent A (%, v/v) Eluent B (%, v/v)
0 65 358.3 40 609 40 6010 65 3511 65 35
Biomed. Chromatogr. 2014 Copyright © 2014 John
in the product batches produced at Moehs with an acceptablelevel of performance. Nifedipine assay results are shown in theSupplementary Material.
System suitability requirements
System suitability requirements are an integral part of the chromato-graphic method. They were used to verify that the reproducibility ofthe chromatographic system is adequate for the analysis.
Themethod suitability was checkedwith the injection of the stan-dard solution in six determinations according to the proposed UPLCmethod. During the system suitability testing, the RSD of peak areawas always <2.0%, the United States Pharmacopoeia (USP) tailingfactor was always ~1.1 and the resolution was >2.5. The resultsare shown in Table 2.
Specificity
Considering that the resolution between the pyrimidine impurityand nifedipine obtained with the European Pharmacopeiamethoddoes not fulfill the acceptance criteria described in EuropeanPharmacopoeia (2009), the specificity was studied in order tocheck this parameter.
The selectivity was evaluated by comparing chromatogramsof six the injections of standard solution. As shown in Fig. 2, nointerference from endogenous substance was observed at theretention time of nifedipine and related substances. See theSupplementary Material for more details.
Calibration curves
The linearity of the method for nifedipine and the relatedcompounds was studied in the range from 0.05% (correspondingto practical quantification limit, PQL) to 0.30%, bymeans of a linearregression, consisting of five calibration points (0.05, 0.10, 0.15,0.20 and 0.30%). Each concentration was injected in triplicate.
The slope, intercept and correlation coefficient values werederived from linear least-square regression analysis and the datafor nifedipine is displayed in Table 3. Results for related substancesof nifedipine are shown in the Supplementary Material. Theresults indicate linearity throughout the range of nifedipineconcentration studied.
RSD Mean areanifedipine ≤5.0% 1.5%Mean areaImp. A 1.4%Mean areaImp. B 1.6%Mean areaImp. C 1.3%
Resolution Impurity A/impurity B >2.5 4.4As Nifedipine peak 0.8<As< 1.5 1.1
Impurity A peak 1.1Impurity B peak 1.1Impurity C peak 1.1
Wiley & Sons, Ltd. wileyonlinelibrary.com/journal/bmc
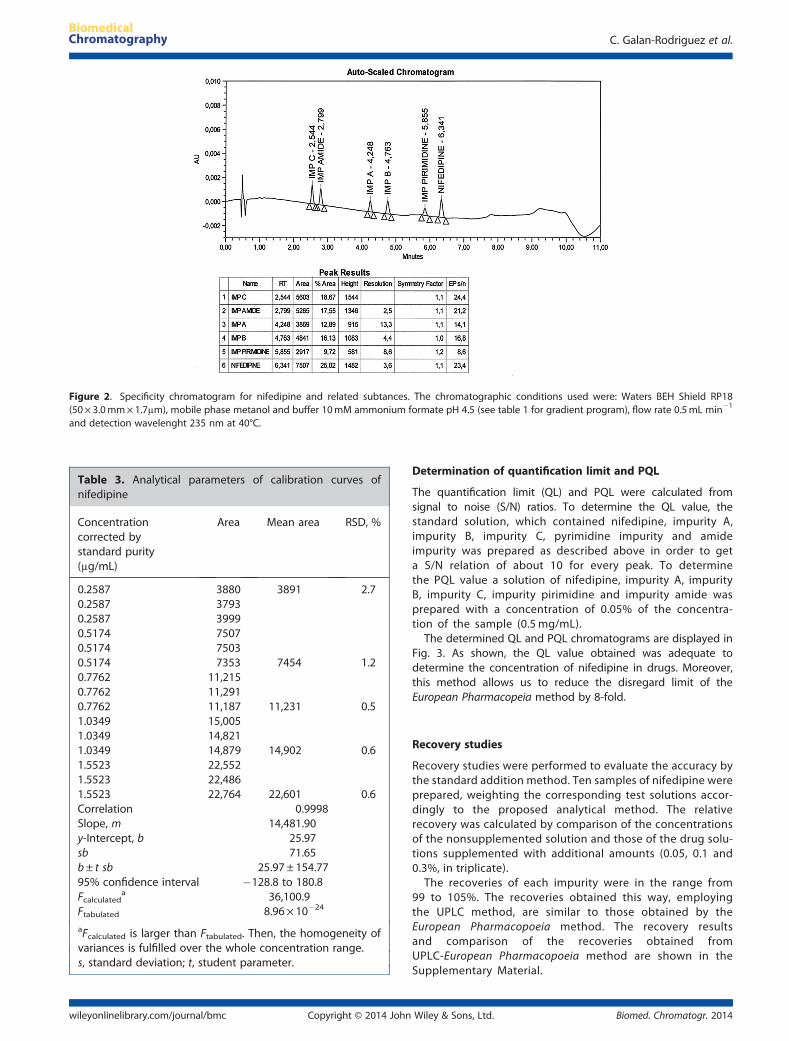
Figure 2. Specificity chromatogram for nifedipine and related subtances. The chromatographic conditions used were: Waters BEH Shield RP18(50× 3.0mm×1.7μm), mobile phase metanol and buffer 10mM ammonium formate pH 4.5 (see table 1 for gradient program), flow rate 0.5mL min�1
and detection wavelenght 235 nm at 40°C.
Table 3. Analytical parameters of calibration curves ofnifedipine
Concentrationcorrected bystandard purity(μg/mL)
Area Mean area RSD, %
0.2587 3880 3891 2.70.2587 37930.2587 39990.5174 75070.5174 75030.5174 7353 7454 1.20.7762 11,2150.7762 11,2910.7762 11,187 11,231 0.51.0349 15,0051.0349 14,8211.0349 14,879 14,902 0.61.5523 22,5521.5523 22,4861.5523 22,764 22,601 0.6Correlation 0.9998Slope, m 14,481.90y-Intercept, b 25.97sb 71.65b± t sb 25.97 ± 154.7795% confidence interval �128.8 to 180.8Fcalculated
a 36,100.9Ftabulated 8.96 × 10�24
aFcalculated is larger than Ftabulated. Then, the homogeneity ofvariances is fulfilled over the whole concentration range.s, standard deviation; t, student parameter.
C. Galan-Rodriguez et al.
Copyright © 2014 Johnwileyonlinelibrary.com/journal/bmc
Determination of quantification limit and PQL
The quantification limit (QL) and PQL were calculated fromsignal to noise (S/N) ratios. To determine the QL value, thestandard solution, which contained nifedipine, impurity A,impurity B, impurity C, pyrimidine impurity and amideimpurity was prepared as described above in order to geta S/N relation of about 10 for every peak. To determinethe PQL value a solution of nifedipine, impurity A, impurityB, impurity C, impurity pirimidine and impurity amide wasprepared with a concentration of 0.05% of the concentra-tion of the sample (0.5 mg/mL).The determined QL and PQL chromatograms are displayed in
Fig. 3. As shown, the QL value obtained was adequate todetermine the concentration of nifedipine in drugs. Moreover,this method allows us to reduce the disregard limit of theEuropean Pharmacopeia method by 8-fold.
Recovery studies
Recovery studies were performed to evaluate the accuracy bythe standard addition method. Ten samples of nifedipine wereprepared, weighting the corresponding test solutions accor-dingly to the proposed analytical method. The relativerecovery was calculated by comparison of the concentrationsof the nonsupplemented solution and those of the drug solu-tions supplemented with additional amounts (0.05, 0.1 and0.3%, in triplicate).The recoveries of each impurity were in the range from
99 to 105%. The recoveries obtained this way, employingthe UPLC method, are similar to those obtained by theEuropean Pharmacopoeia method. The recovery resultsand comparison of the recoveries obtained fromUPLC-European Pharmacopoeia method are shown in theSupplementary Material.
Biomed. Chromatogr. 2014Wiley & Sons, Ltd.
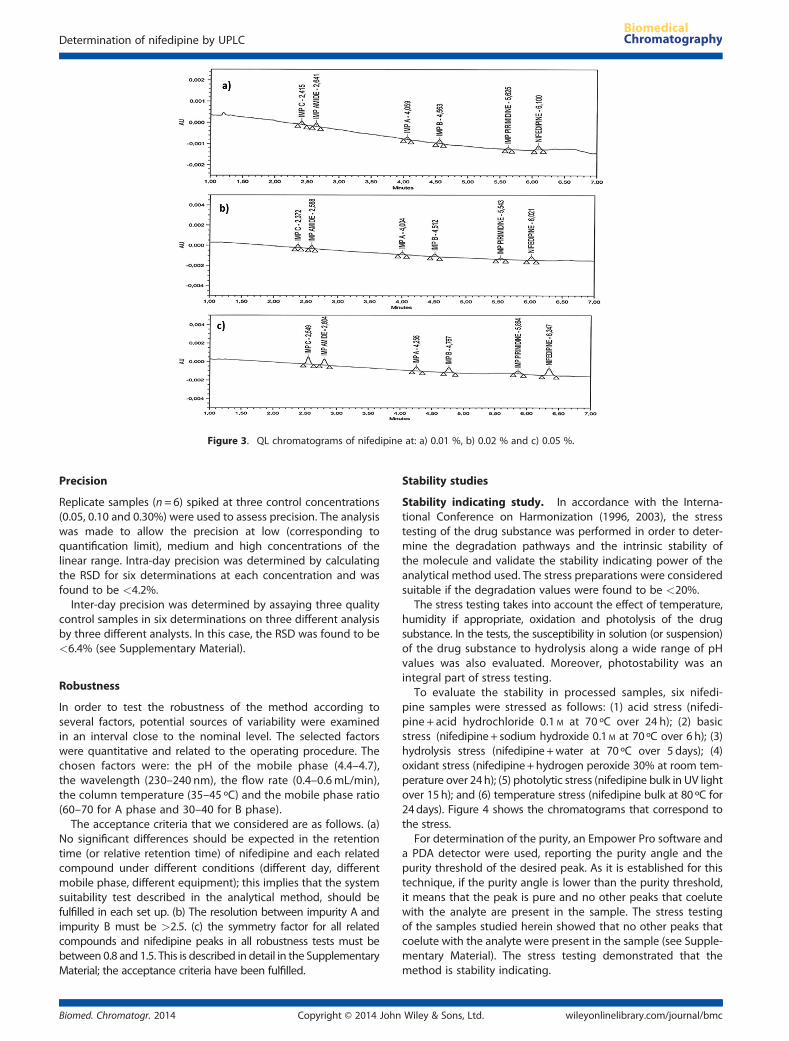
Figure 3. QL chromatograms of nifedipine at: a) 0.01 %, b) 0.02 % and c) 0.05 %.
Determination of nifedipine by UPLC
Precision
Replicate samples (n=6) spiked at three control concentrations(0.05, 0.10 and 0.30%) were used to assess precision. The analysiswas made to allow the precision at low (corresponding toquantification limit), medium and high concentrations of thelinear range. Intra-day precision was determined by calculatingthe RSD for six determinations at each concentration and wasfound to be <4.2%.Inter-day precision was determined by assaying three quality
control samples in six determinations on three different analysisby three different analysts. In this case, the RSD was found to be<6.4% (see Supplementary Material).
Robustness
In order to test the robustness of the method according toseveral factors, potential sources of variability were examinedin an interval close to the nominal level. The selected factorswere quantitative and related to the operating procedure. Thechosen factors were: the pH of the mobile phase (4.4–4.7),the wavelength (230–240 nm), the flow rate (0.4–0.6mL/min),the column temperature (35–45 ºC) and the mobile phase ratio(60–70 for A phase and 30–40 for B phase).The acceptance criteria that we considered are as follows. (a)
No significant differences should be expected in the retentiontime (or relative retention time) of nifedipine and each relatedcompound under different conditions (different day, differentmobile phase, different equipment); this implies that the systemsuitability test described in the analytical method, should befulfilled in each set up. (b) The resolution between impurity A andimpurity B must be >2.5. (c) the symmetry factor for all relatedcompounds and nifedipine peaks in all robustness tests must bebetween 0.8 and 1.5. This is described in detail in the SupplementaryMaterial; the acceptance criteria have been fulfilled.
Biomed. Chromatogr. 2014 Copyright © 2014 John
Stability studies
Stability indicating study. In accordance with the Interna-tional Conference on Harmonization (1996, 2003), the stresstesting of the drug substance was performed in order to deter-mine the degradation pathways and the intrinsic stability ofthe molecule and validate the stability indicating power of theanalytical method used. The stress preparations were consideredsuitable if the degradation values were found to be <20%.
The stress testing takes into account the effect of temperature,humidity if appropriate, oxidation and photolysis of the drugsubstance. In the tests, the susceptibility in solution (or suspension)of the drug substance to hydrolysis along a wide range of pHvalues was also evaluated. Moreover, photostability was anintegral part of stress testing.
To evaluate the stability in processed samples, six nifedi-pine samples were stressed as follows: (1) acid stress (nifedi-pine + acid hydrochloride 0.1 M at 70 ºC over 24 h); (2) basicstress (nifedipine+ sodium hydroxide 0.1 M at 70 ºC over 6 h); (3)hydrolysis stress (nifedipine+water at 70 ºC over 5 days); (4)oxidant stress (nifedipine+hydrogen peroxide 30% at room tem-perature over 24h); (5) photolytic stress (nifedipine bulk in UV lightover 15 h); and (6) temperature stress (nifedipine bulk at 80 ºC for24days). Figure 4 shows the chromatograms that correspond tothe stress.
For determination of the purity, an Empower Pro software anda PDA detector were used, reporting the purity angle and thepurity threshold of the desired peak. As it is established for thistechnique, if the purity angle is lower than the purity threshold,it means that the peak is pure and no other peaks that coelutewith the analyte are present in the sample. The stress testingof the samples studied herein showed that no other peaks thatcoelute with the analyte were present in the sample (see Supple-mentary Material). The stress testing demonstrated that themethod is stability indicating.
Wiley & Sons, Ltd. wileyonlinelibrary.com/journal/bmc
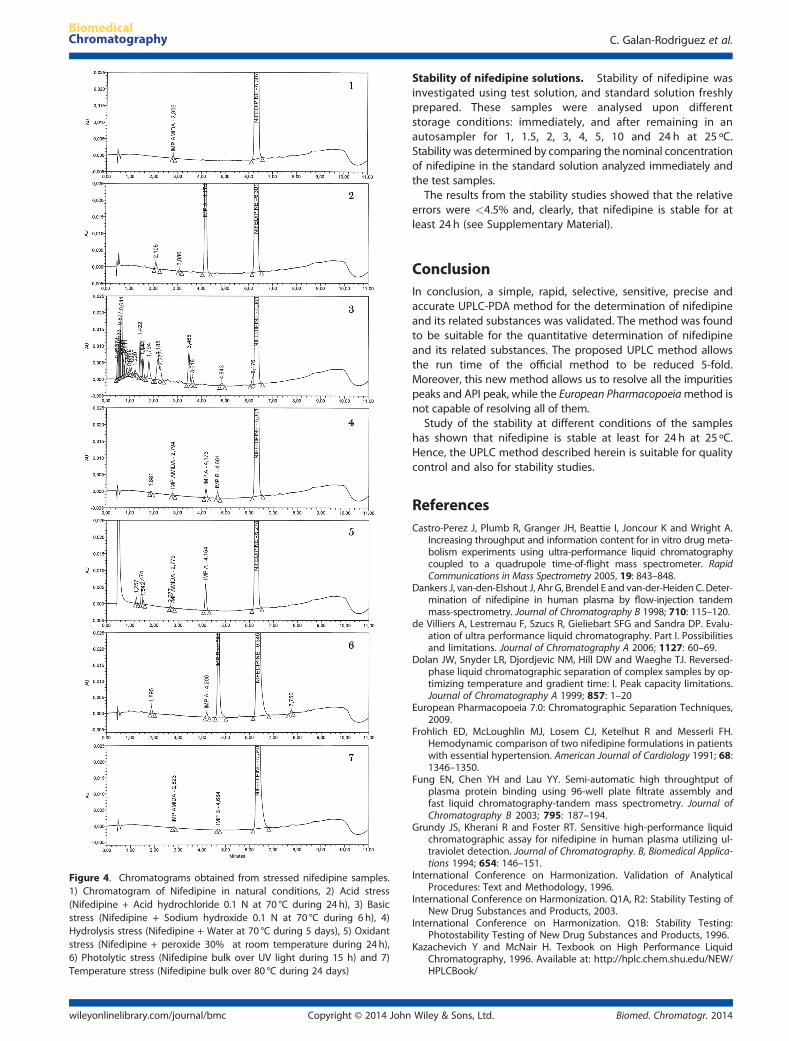
Figure 4. Chromatograms obtained from stressed nifedipine samples.1) Chromatogram of Nifedipine in natural conditions, 2) Acid stress(Nifedipine + Acid hydrochloride 0.1 N at 70 °C during 24 h), 3) Basicstress (Nifedipine + Sodium hydroxide 0.1 N at 70 °C during 6 h), 4)Hydrolysis stress (Nifedipine + Water at 70 °C during 5 days), 5) Oxidantstress (Nifedipine + peroxide 30% at room temperature during 24 h),6) Photolytic stress (Nifedipine bulk over UV light during 15 h) and 7)Temperature stress (Nifedipine bulk over 80 °C during 24 days)
C. Galan-Rodriguez et al.
Copyright © 2014 Johnwileyonlinelibrary.com/journal/bmc
Stability of nifedipine solutions. Stability of nifedipine wasinvestigated using test solution, and standard solution freshlyprepared. These samples were analysed upon differentstorage conditions: immediately, and after remaining in anautosampler for 1, 1.5, 2, 3, 4, 5, 10 and 24 h at 25 ºC.Stability was determined by comparing the nominal concentrationof nifedipine in the standard solution analyzed immediately andthe test samples.The results from the stability studies showed that the relative
errors were <4.5% and, clearly, that nifedipine is stable for atleast 24 h (see Supplementary Material).
ConclusionIn conclusion, a simple, rapid, selective, sensitive, precise andaccurate UPLC-PDA method for the determination of nifedipineand its related substances was validated. The method was foundto be suitable for the quantitative determination of nifedipineand its related substances. The proposed UPLC method allowsthe run time of the official method to be reduced 5-fold.Moreover, this new method allows us to resolve all the impuritiespeaks and API peak, while the European Pharmacopoeiamethod isnot capable of resolving all of them.Study of the stability at different conditions of the samples
has shown that nifedipine is stable at least for 24 h at 25 ºC.Hence, the UPLC method described herein is suitable for qualitycontrol and also for stability studies.
ReferencesCastro-Perez J, Plumb R, Granger JH, Beattie I, Joncour K and Wright A.
Increasing throughput and information content for in vitro drug meta-bolism experiments using ultra-performance liquid chromatographycoupled to a quadrupole time-of-flight mass spectrometer. RapidCommunications in Mass Spectrometry 2005, 19: 843–848.
Dankers J, van-den-Elshout J, Ahr G, Brendel E and van-der-Heiden C. Deter-mination of nifedipine in human plasma by flow-injection tandemmass-spectrometry. Journal of Chromatography B 1998; 710: 115–120.
de Villiers A, Lestremau F, Szucs R, Gieliebart SFG and Sandra DP. Evalu-ation of ultra performance liquid chromatography. Part I. Possibilitiesand limitations. Journal of Chromatography A 2006; 1127: 60–69.
Dolan JW, Snyder LR, Djordjevic NM, Hill DW and Waeghe TJ. Reversed-phase liquid chromatographic separation of complex samples by op-timizing temperature and gradient time: I. Peak capacity limitations.Journal of Chromatography A 1999; 857: 1–20
European Pharmacopoeia 7.0: Chromatographic Separation Techniques,2009.
Frohlich ED, McLoughlin MJ, Losem CJ, Ketelhut R and Messerli FH.Hemodynamic comparison of two nifedipine formulations in patientswith essential hypertension. American Journal of Cardiology 1991; 68:1346–1350.
Fung EN, Chen YH and Lau YY. Semi-automatic high throughtput ofplasma protein binding using 96-well plate filtrate assembly andfast liquid chromatography-tandem mass spectrometry. Journal ofChromatography B 2003; 795: 187–194.
Grundy JS, Kherani R and Foster RT. Sensitive high-performance liquidchromatographic assay for nifedipine in human plasma utilizing ul-traviolet detection. Journal of Chromatography. B, Biomedical Applica-tions 1994; 654: 146–151.
International Conference on Harmonization. Validation of AnalyticalProcedures: Text and Methodology, 1996.
International Conference on Harmonization. Q1A, R2: Stability Testing ofNew Drug Substances and Products, 2003.
International Conference on Harmonization. Q1B: Stability Testing:Photostability Testing of New Drug Substances and Products, 1996.
Kazachevich Y and McNair H. Texbook on High Performance LiquidChromatography, 1996. Available at: http://hplc.chem.shu.edu/NEW/HPLCBook/
Biomed. Chromatogr. 2014Wiley & Sons, Ltd.
Determination of nifedipine by UPLC
Kondo S, Kuchiki A, Yamamoto K, Akimoto K, Takahashi K, Awata N andSugimoto I. Identification of nifedipine metabolites and their deter-mination by gas chromatography. Chemical Pharmaceutical Bulletin1980; 28: 1–7.
MacNair JE, Patel KD and Jogenson JW. Ultrahigh-pressure reversed-phase capillary liquid chromatography: isocratic and gradient elutionusing columns packed with 1.0-micron particles. Analytical Chemistry1999; 71: 700–708.
McCalley DV. Effect of buffer on peak shape of peptides in reversed-phase high performance liquid chromatography. Journal of Chroma-tography A 2004; 1038: 77–84.
Nakamura I, Takahashi M and Izumi H. Sensitive high-performance liquidchromatographic determination of nifedipine in cat plasma followingimproved sample treatment. Journal of Chromatography. B,Biomedical Applications 1999; 729: 265–270.
Neue UD and Mazzeo JR. A theoretical study of the optimization ofgradients at elevated temperature. Journal of Separation Science2001; 24: 921–929.
Niopas I and Daftsios A. Determination of nifedipine in human plasmaby solid-phase extraction and high-performance liquid chromatog-raphy: validation and adaptation to pharmacokinetic studies.Pharmaceutical and Biomedial Analysis 2003; 32: 1213–1218.
Patel DP, Sharma P, Sanyal M, Singhal P and Shrivastav PS. Highly sensi-tive and rapid ultra-performance liquid chromatography-tandemmass spectrometry method for the determination of nifedipine inhuman plasma and its application to a bioequivalence study. Bio-medical Chromatography 2012; 26: 1509–1518.
Pietta P, Rava A and Biondi P. High-performance liquid chromatography ofnifedipine, its metabolites and photochemical degradation products.Journal of Chromatography 1981; 210: 516–521.
PlumbR, Castro-Pérez J andGranger J. Ultra-performance liquid chromatographycoupled to quadrupole-orthogonal time-of-flight mass spectrometry.Rapid Communication in Mass Spectrometry 2004, 18: 2331–2337.
Raemsch KD and Sommer JC. Pharmacokinetics and metabolism ofnifedipine. Hypertension 1983; 5(suppl. 11): 11–18.
Stone P, Antam E, Muller J and Braunwald E. Calcium Channel BlockingAgents in the Treatment of Cardiovascular Disorders. Part II: Hemody-namic Effects and Clinical Applications. Annals of Internal Medicine1980; 93: 886–904.
Tolokan A, Godorhazy L, Horvath V, Hrabeczy-Pall A, Niegreisz Z, Kocsi E,Horvai G, Klebovich I and Balogh-Nemes K. Economic approach to
Biomed. Chromatogr. 2014 Copyright © 2014 John
robotic sample pretreatment in high-performance liquid chromatog-raphy. Journal of Chromatography A 1997; 771: 35–43.
US Department of Health and Human Services, Food and Drug Adminis-tration, Center for Drug Evaluation and Research. GuidanceCompilance: Regulatory Information, 2001.
US Department of Health and Human Services, Food and Drug Administration,Center for Drug Evaluation and Research. Reviewer Guidance: Validation ofChromatographic Methods, 1994.
US Department of Health and Human Services, Food and Drug Adminis-tration, Center for Drug Evaluation and Research. Validation ofCompendial Procedures, 2012.
Van Deemter JJ, Zuiderweg FJ and Klingengerg A. Longitudinal diffu-sion and resistance to mass transfer as causes of nonideality inchromatography. Journal of Chemical Engineering Science 1956;5: 272–289.
Wang D, Jiang K, Yang S, Qin F, Lu X and Li F. Determination of nifedipinein human plasma by ultra performance liquid chromatography-tan-dem mass spectrometry and its application in a pharmacokineticstudy. Journal of Chromatography B 2011; 879: 1827–1832.
Wenzel RR, Allegranza G, Binggeli C, Shaw S, Weidmann P, Luscher TFand Noll G. Differential Activation of Cardiac and Peripheral Sympa-thetic Nervous System by Nifedipine: Role of Pharmacokinetics.Journal of American College of Cardiology 1997; 29: 1607–1614.
Wilson ID, Nicholson JK and Castro-Pérez J. High resolution “ultraperformance” liquid chromatography coupled to oa-TOF massspectrometry as a tool for differential metabolic pathway profilingin functional genomic studies. Journal of Proteome Research 2005,4: 591–598.
Wren SAC. Peak capacity in gradient ultra performance liquid chro-matography (UPLC). Journal of Pharmaceutical and BiomedicalAnalysis 2005; 38: 337–343.
Wu N, Lippert JA and Lee ML. Practical aspects of ultra high pressurecapillary liquid chromatography. Journal of Chromatography A 2001;911: 1–12.
Supporting informationAdditional supporting information may be found in the onlineversion at the publisher’s web site.
Wiley & Sons, Ltd. wileyonlinelibrary.com/journal/bmc