Embed Size (px)
Citation preview
METHOD FOR ESTIMATINGMETHANE EMISSIONS FROM COAL MINING
October 1999
Prepared by:ICF Consulting
Prepared for:Greenhouse Gas CommitteeEmission Inventory Improvement Program
VOLUME VIII: CHAPTER 4
DISCLAIMER
This document was prepared for the Emission Inventory Improvement Program and the U.S.Environmental Protection Agency by ICF Incorporated, Washington, D.C. This report isintended to be a working draft document and has not been reviewed or approved for publication.The opinions, findings, and conclusions are those of the authors and not necessarily those of theEmission Inventory Improvement Program or the U.S. Environmental Protection Agency.Mention of company or product names is not to be considered an endorsement by the EmissionInventory Improvement Program or the U.S. Environmental Protection Agency.
Volume VIII, Chapter 4, Coal Mining
EIIP Volume VIII iii
ACKNOWLEDGMENTS
The text for this document was originally written by staff of the ICF Consulting Group inWashington, DC, drawing on a variety of sources. It has since been updated by Brian Pollard,Randy Freed, William Driscoll, and other staff of ICF, for the Greenhouse Gas Committee of theEmission Inventory Improvement Program and for Ethan McMahon and Wiley Barbour of theOffice of Policy at the U.S. Environmental Protection Agency. Bill Irving, of U.S. EPA’s Officeof Air and Radiation, also contributed to this report. Members of the Greenhouse GasCommittee contributing to the preparation of this document were:
Brenda Griffin, Program Analyst, Illinois Department of Natural ResourcesWilliam Herz, Assistant Research Engineer, Department of Chemical Engineering, University of
AlabamaPartricia Kimes, Program Analyst, Utah Department of Environmental QualityDon LaTourette, Program Analyst, New Hampshire Department of Environmental ServicesJohn Noller, Program Analyst, Missouri Department of Natural ResourcesSam Sadler, Energy Analyst, Oregon Department of EnergyJack Sipple, Program Analyst, Delaware Department of Natural Resources and Environmental
Control
iv EIIP Volume VII
CONTENTSSection Page
1 Introduction .........................................................................................................................4.1-1
2 Source Category Description...............................................................................................4.2-12.1 Emission Sources .................................................................................................4.2-1
2.2 Factors Influencing Emissions .............................................................................4.2-6
3 Overview of Available Methods .........................................................................................4.3-1
4 Preferred Method for Estimating Emissions .......................................................................4.4-1
5 Alternate Methods for Estimating Emissions......................................................................4.5-1
6 Quality Assurance/Quality Control .....................................................................................4.6-16.1 Data Attribute Ranking System (DARS) Scores..................................................4.6-2
7 References ...........................................................................................................................4.7-1
EIIP Volume VIII v
EXHIBITSPage
4.2-1 Stages in Coalification ..................................................................................................4.2-1
4.2-2 U.S. Coal Basins and Coalbed Methane Resources ......................................................4.2-3
4.2-3 Approaches for Methane Control at Underground Mines.............................................4.2-5
4.3-1 Components of Methane Emissions from Coal Mining................................................4.3-2
4.4-1 Methane Emission Coefficients for Coal Produced from Surface Mines .....................4.4-4
4.4-2 Post-Mining Methane Emissions Coefficients for Underground- andSurface-Mined Coal ......................................................................................................4.4-5
4.6-1 DARS Scores: CH4 Emissions from Coal Produced from Underground Mining.........4.6-3
4.6-2 DARS Scores: CH4 Emissions from Coal Produced from Surface Mining.................4.6-4
4.6-3 DARS Scores: Post-Mining CH4 Emissions from Surface andUnderground Mining.....................................................................................................4.6-5

EIIP Volume VIII 4.1-1
1
INTRODUCTIONThe purposes of the preferred methods guidelines are to describe emissions estimation techniquesfor greenhouse gas sources in a clear and unambiguous manner and to provide concise examplecalculations to aid in the preparation of emission inventories. This chapter describes theprocedures and recommended approaches for estimating methane emissions from coal mining.
Section 2 of this chapter provides a source category description. Section 3 gives an overview ofthe methodology for estimating methane emissions from coal mines. Section 4 describes thepreferred estimation methodology while Section 5 is a placeholder section for alternativeemission estimation techniques that may be added in the future. Quality assurance and qualitycontrol procedures are described in Section 6. References used in developing this chapter arelisted in Section 7.

EIIP Volume VIII 4.2-1
2
SOURCE CATEGORY DESCRIPTION2.1 EMISSION SOURCES
There are three sources of methane emissions from coal mining: emissions from undergroundmining, emissions from surface mining, and emissions from post-mining activities. Emissionsfrom post-mining activities may be further subdivided into emissions from underground minedcoal and emissions from surface mined coal. Each of these emission sources is described inmore detail below.
Because methane is a safety hazard in underground mines, substantial research has beenundertaken to determine how to predict and control methane emissions in mine working areas.This research makes possible fairly accurate estimates of the quantity of methane emitted fromunderground mines. Similar research has not yet been undertaken for surface mines, which emitsmaller quantities of methane and do not have similar safety issues associated with them.
Overview of Coalbed Methane Production1
How Coalbed Methane Is Produced,Stored and Released
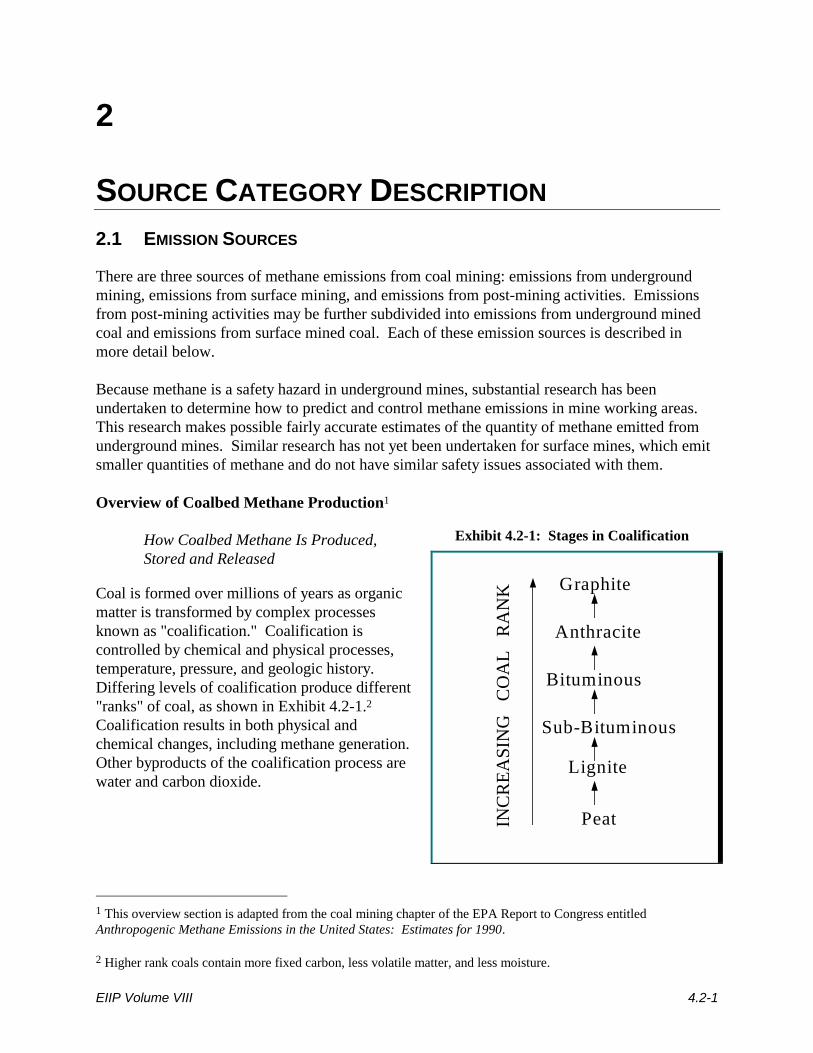
Coal is formed over millions of years as organicmatter is transformed by complex processesknown as "coalification." Coalification iscontrolled by chemical and physical processes,temperature, pressure, and geologic history.Differing levels of coalification produce different"ranks" of coal, as shown in Exhibit 4.2-1.2Coalification results in both physical andchemical changes, including methane generation.Other byproducts of the coalification process arewater and carbon dioxide.
1 This overview section is adapted from the coal mining chapter of the EPA Report to Congress entitledAnthropogenic Methane Emissions in the United States: Estimates for 1990.
2 Higher rank coals contain more fixed carbon, less volatile matter, and less moisture.
Exhibit 4.2-1: Stages in Coalification
Peat
Lignite
Sub-Bituminous
Bituminous
Anthracite
Graphite
INC
REA
SIN
G
CO
AL
RA
NK
CHAPTER 4 – COAL MINING 10/20/99
4.2-2 EIIP Volume VIII
The amount of methane produced increases throughout the coalification process. Thus, higherranked coals tend to contain more methane than lower ranked coals.
How Methane is Stored in Coal
Methane is stored in the coal itself and can also be contained in the surrounding strata. Largeamounts of methane can be stored within the microstructure of coal. Methane storage incoalbeds, mainly by adsorption onto internal coal surfaces, is a function of rank and pressure.3 Ingeneral, coals of increasing rank have higher methane storage capacities. In addition, storagecapacity increases almost linearly with increasing pressure, which in turn is a function of depth ofthe coal seam. Therefore, among coal seams of the same rank, deeper seams store more methane.
Even high rank coals cannot store all of the methane generated during coalification, however.The highest gas contents measured for anthracite coal in the United States, for example, are only10 to 12 percent of the total amount of methane that was generated during coalification. The restof the methane migrated out of the coal over time. Some of this gas remains stored in thesurrounding strata, and some has likely been emitted to the atmosphere as a result of naturalprocesses.
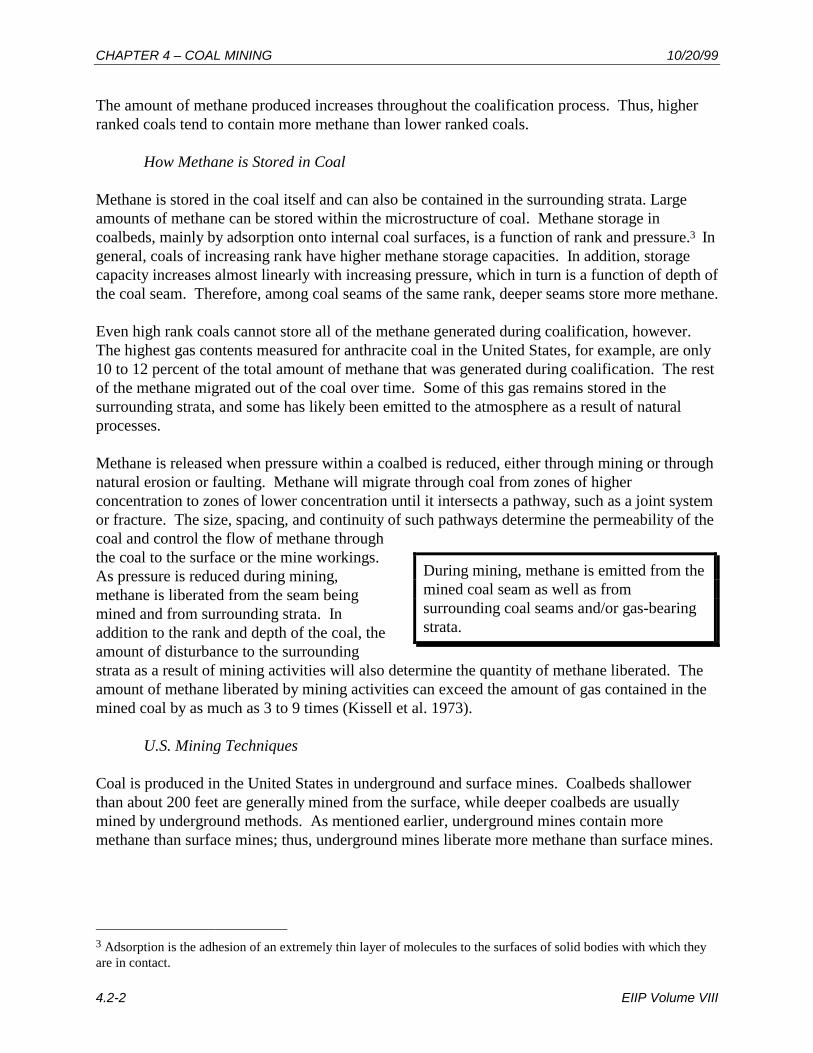
Methane is released when pressure within a coalbed is reduced, either through mining or throughnatural erosion or faulting. Methane will migrate through coal from zones of higherconcentration to zones of lower concentration until it intersects a pathway, such as a joint systemor fracture. The size, spacing, and continuity of such pathways determine the permeability of thecoal and control the flow of methane throughthe coal to the surface or the mine workings.As pressure is reduced during mining,methane is liberated from the seam beingmined and from surrounding strata. Inaddition to the rank and depth of the coal, theamount of disturbance to the surroundingstrata as a result of mining activities will also determine the quantity of methane liberated. Theamount of methane liberated by mining activities can exceed the amount of gas contained in themined coal by as much as 3 to 9 times (Kissell et al. 1973).
U.S. Mining Techniques
Coal is produced in the United States in underground and surface mines. Coalbeds shallowerthan about 200 feet are generally mined from the surface, while deeper coalbeds are usuallymined by underground methods. As mentioned earlier, underground mines contain moremethane than surface mines; thus, underground mines liberate more methane than surface mines.
3 Adsorption is the adhesion of an extremely thin layer of molecules to the surfaces of solid bodies with which theyare in contact.
During mining, methane is emitted from themined coal seam as well as fromsurrounding coal seams and/or gas-bearingstrata.
10/20/99 CHAPTER 4 – COAL MINING
EIIP Volume VIII 4.2-3
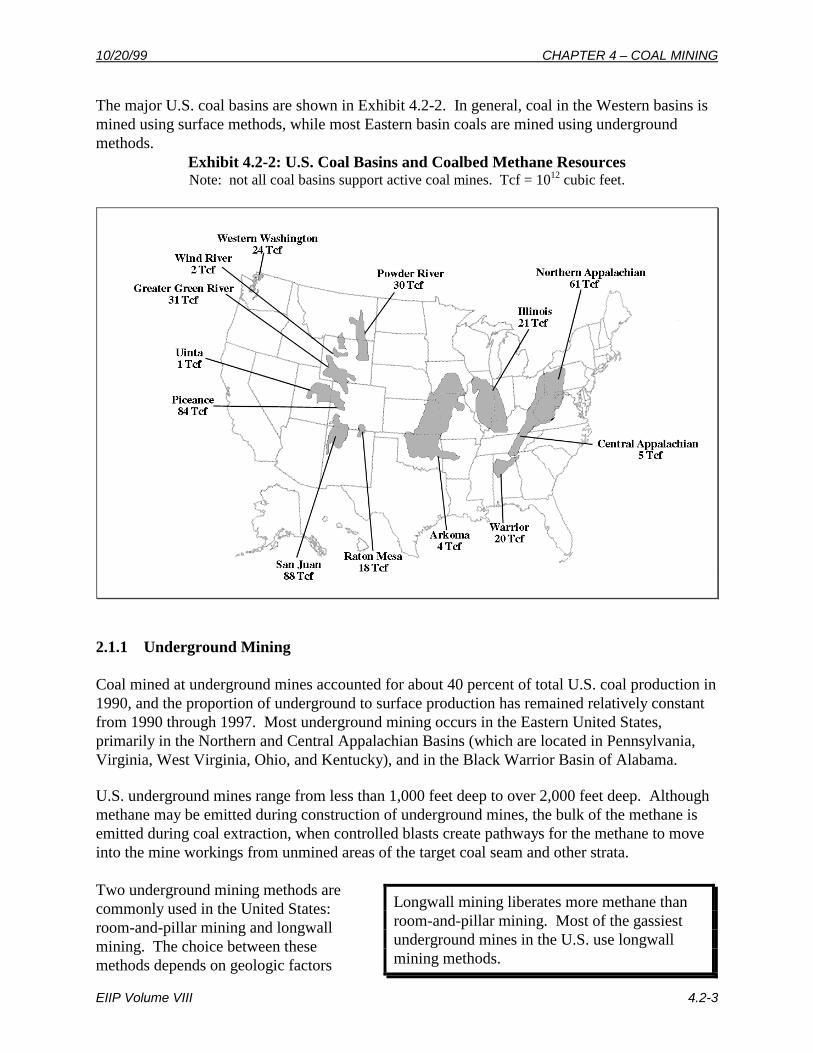
The major U.S. coal basins are shown in Exhibit 4.2-2. In general, coal in the Western basins ismined using surface methods, while most Eastern basin coals are mined using undergroundmethods.
Exhibit 4.2-2: U.S. Coal Basins and Coalbed Methane ResourcesNote: not all coal basins support active coal mines. Tcf = 1012 cubic feet.
2.1.1 Underground Mining
Coal mined at underground mines accounted for about 40 percent of total U.S. coal production in1990, and the proportion of underground to surface production has remained relatively constantfrom 1990 through 1997. Most underground mining occurs in the Eastern United States,primarily in the Northern and Central Appalachian Basins (which are located in Pennsylvania,Virginia, West Virginia, Ohio, and Kentucky), and in the Black Warrior Basin of Alabama.
U.S. underground mines range from less than 1,000 feet deep to over 2,000 feet deep. Althoughmethane may be emitted during construction of underground mines, the bulk of the methane isemitted during coal extraction, when controlled blasts create pathways for the methane to moveinto the mine workings from unmined areas of the target coal seam and other strata.
Two underground mining methods arecommonly used in the United States:room-and-pillar mining and longwallmining. The choice between thesemethods depends on geologic factors
Longwall mining liberates more methane thanroom-and-pillar mining. Most of the gassiestunderground mines in the U.S. use longwallmining methods.
CHAPTER 4 – COAL MINING 10/20/99
4.2-4 EIIP Volume VIII
(such as depth, terrain, and width of coalbed) and economic factors, such as equipment cost.Room-and-pillar mining is the most common underground mining technique in the United States,although the number of longwall mines is growing. Mechanized longwall mining was introducedin the U.S. during the 1960s, and today there are almost 70 longwall mines in operation (Reid,1997). Longwall mines are typically bigger and deeper than room-and-pillar mines. They arealso more expensive to equip and operate, but generally have higher coal production rates. Thehigher production, coupled with the more extensive caving typically associated with longwallmines, tends to result in higher methane emissions.
Methane Management Systems for Underground Mining
Methane is a serious safety threat in underground coal mines because it is highly explosive inatmospheric concentrations of 5 to 15 percent. The U.S. Mine Safety and Health Administration(MSHA), an agency of the U.S. Department of Labor, requires close monitoring of methanelevels to ensure that methane concentrations in underground mines are kept below explosivelevels. In mine entries used by personnel, methane levels cannot exceed 1 percent, and in certaindesignated areas of the mine not frequented by mine personnel, methane levels cannot exceed 2percent. If these concentrations are exceeded, MSHA requires that coal production cease untilmethane concentrations are reduced to acceptable levels.
There are two methods for controllingmethane in underground mines: use ofventilation systems and use ofdegasification systems. Ventilationsystems are employed at all undergroundmines.4 The decision to use adegasification system is based primarilyon safety factors, but may also be greatlyinfluenced by the opportunity to sell oruse the recovered gas. In especially gassy mines, the use of a ventilation system alone may beinadequate to degasify a mine so that it meets federal regulations with regard to maximummethane concentrations. In such cases, a degasification system may be installed to help degasifythe mine either prior to, during, or after mining. The methane recovered from these systems isusually of sufficient quality that the methane can be sold to a pipeline or used for any number ofapplications, including electricity generation. In 1996, there were only 21 underground mineswith degasification systems, out of more than 900 underground mines in the U.S. In addition tothe potential economic benefits associated with the sale of this gas, such projects have the addedadvantage of reducing atmospheric methane emissions.
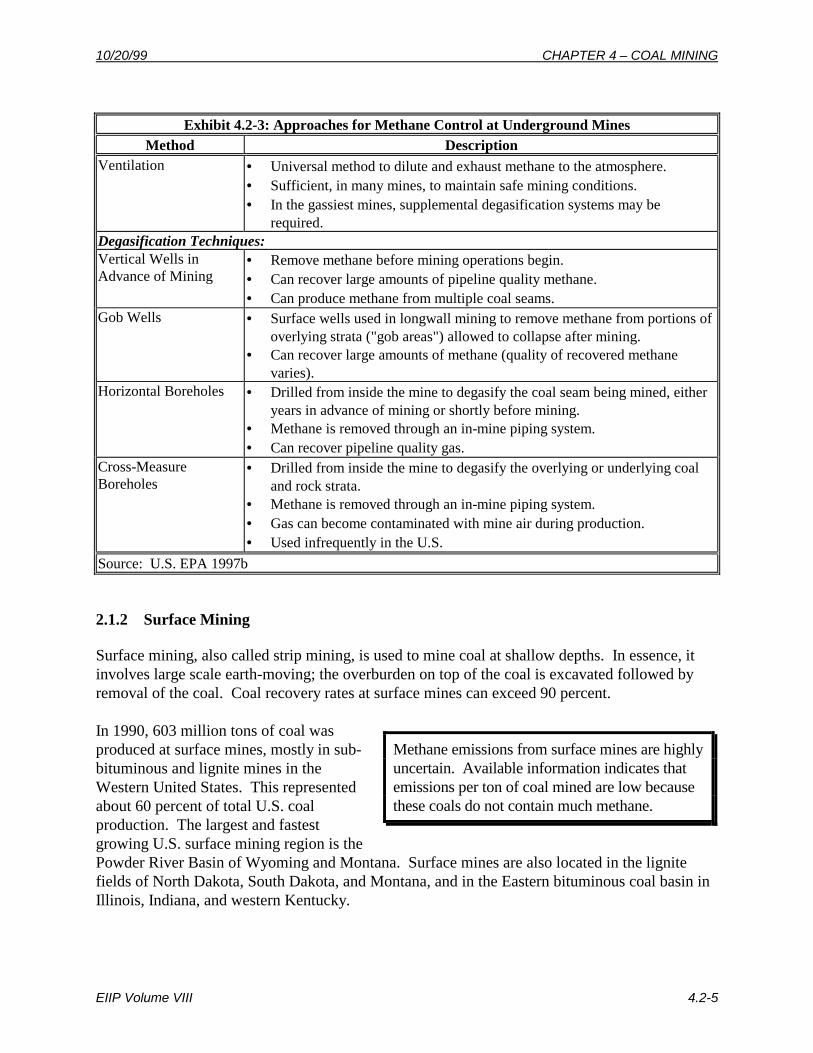
The various methods of controlling methane in underground mines are summarized in Exhibit4.2-3.
4 Only those underground mines with detectable methane emissions are surveyed by the Mine Safety and HealthAdministration (MSHA). Detectable emissions are defined by MSHA as methane concentrations at the mineentrance greater than 50 parts per million methane. Readings below this threshold are considered non-detectable.
Approximately 21 gassy U.S. underground minesuse degasification systems in addition to ventila-tion to ensure safe mining conditions. Thesesystems produce high quality methane that can besold to a pipeline, used to generate electricity, orused in a number of other applications.
10/20/99 CHAPTER 4 – COAL MINING
EIIP Volume VIII 4.2-5
Exhibit 4.2-3: Approaches for Methane Control at Underground MinesMethod Description
Ventilation • Universal method to dilute and exhaust methane to the atmosphere.• Sufficient, in many mines, to maintain safe mining conditions.• In the gassiest mines, supplemental degasification systems may be
required.Degasification Techniques:Vertical Wells inAdvance of Mining
• Remove methane before mining operations begin.• Can recover large amounts of pipeline quality methane.• Can produce methane from multiple coal seams.
Gob Wells • Surface wells used in longwall mining to remove methane from portions ofoverlying strata ("gob areas") allowed to collapse after mining.
• Can recover large amounts of methane (quality of recovered methanevaries).
Horizontal Boreholes • Drilled from inside the mine to degasify the coal seam being mined, eitheryears in advance of mining or shortly before mining.
• Methane is removed through an in-mine piping system.• Can recover pipeline quality gas.
Cross-MeasureBoreholes
• Drilled from inside the mine to degasify the overlying or underlying coaland rock strata.
• Methane is removed through an in-mine piping system.• Gas can become contaminated with mine air during production.• Used infrequently in the U.S.
Source: U.S. EPA 1997b
2.1.2 Surface Mining
Surface mining, also called strip mining, is used to mine coal at shallow depths. In essence, itinvolves large scale earth-moving; the overburden on top of the coal is excavated followed byremoval of the coal. Coal recovery rates at surface mines can exceed 90 percent.
In 1990, 603 million tons of coal wasproduced at surface mines, mostly in sub-bituminous and lignite mines in theWestern United States. This representedabout 60 percent of total U.S. coalproduction. The largest and fastestgrowing U.S. surface mining region is thePowder River Basin of Wyoming and Montana. Surface mines are also located in the lignitefields of North Dakota, South Dakota, and Montana, and in the Eastern bituminous coal basin inIllinois, Indiana, and western Kentucky.
Methane emissions from surface mines are highlyuncertain. Available information indicates thatemissions per ton of coal mined are low becausethese coals do not contain much methane.
CHAPTER 4 – COAL MINING 10/20/99
4.2-6 EIIP Volume VIII
2.1.3 Post-Mining
Not all of the methane contained in coal is released during mining. Some methane remains in thecoal after it is removed from the mine and can be emitted as the coal is transported, processed,and stored. Depending on the characteristics of the coal and the way it is handled after leavingthe mine, the amount of methane released during post-mining activities can be significant andcan continue for weeks or months. The greatest releases occur when coal is crushed, sized, anddried in preparation for industrial or utility uses (U.S. EPA, 1990).
2.2 FACTORS INFLUENCING EMISSIONS
Of the emission sources described above, emissions from underground mining are by far thelargest contributor to methane emissions from coal mining. In the U.S., underground miningemissions account for about 70 percent of the total methane emitted from coal mines in any givenyear. Emissions from surface mines and post-mining activities account for the remainder. Thus,the factors that have the greatest impact on emissions are factors related to underground mining.
As discussed earlier, the amount of methane generated during coal mining depends on the type ofmine, gas content of the coal seam, mining methods, and other factors such as moisture. Emissionsare also affected by the amount of coal mined; the greater the quantity of coal mined the greater theamount of methane released. High ranks of coal contain more methane than low ranks. Betweentwo coal seams with the same rank, the deeper seam will contain more methane, because it isunder more pressure. The amount of methane emitted depends not only on the amount generated,but also on whether a degasification system with methane recovery is used. Surface seams havethe lowest methane content and do not support the use of degasification systems.
EIIP Volume VIII 4.3-1
3
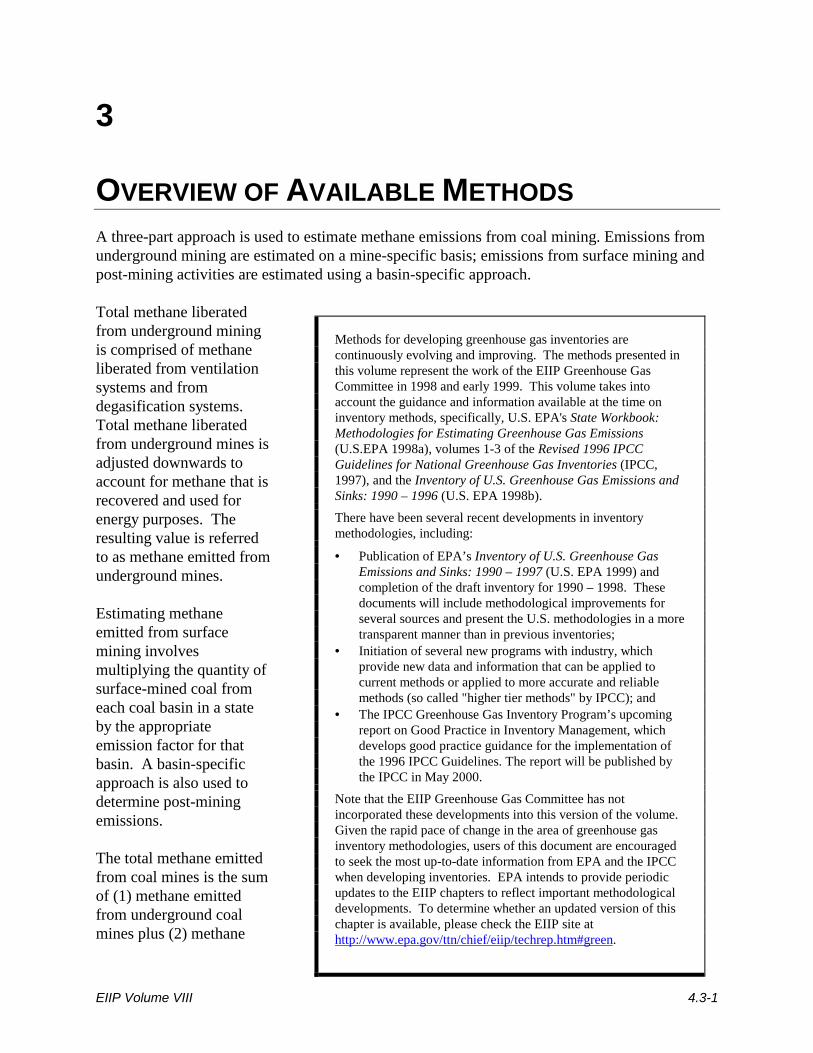
OVERVIEW OF AVAILABLE METHODSA three-part approach is used to estimate methane emissions from coal mining. Emissions fromunderground mining are estimated on a mine-specific basis; emissions from surface mining andpost-mining activities are estimated using a basin-specific approach.
Total methane liberatedfrom underground miningis comprised of methaneliberated from ventilationsystems and fromdegasification systems.Total methane liberatedfrom underground mines isadjusted downwards toaccount for methane that isrecovered and used forenergy purposes. Theresulting value is referredto as methane emitted fromunderground mines.
Estimating methaneemitted from surfacemining involvesmultiplying the quantity ofsurface-mined coal fromeach coal basin in a stateby the appropriateemission factor for thatbasin. A basin-specificapproach is also used todetermine post-miningemissions.
The total methane emittedfrom coal mines is the sumof (1) methane emittedfrom underground coalmines plus (2) methane
Methods for developing greenhouse gas inventories arecontinuously evolving and improving. The methods presented inthis volume represent the work of the EIIP Greenhouse GasCommittee in 1998 and early 1999. This volume takes intoaccount the guidance and information available at the time oninventory methods, specifically, U.S. EPA's State Workbook:Methodologies for Estimating Greenhouse Gas Emissions(U.S.EPA 1998a), volumes 1-3 of the Revised 1996 IPCCGuidelines for National Greenhouse Gas Inventories (IPCC,1997), and the Inventory of U.S. Greenhouse Gas Emissions andSinks: 1990 – 1996 (U.S. EPA 1998b).
There have been several recent developments in inventorymethodologies, including:
• Publication of EPA’s Inventory of U.S. Greenhouse GasEmissions and Sinks: 1990 – 1997 (U.S. EPA 1999) andcompletion of the draft inventory for 1990 – 1998. Thesedocuments will include methodological improvements forseveral sources and present the U.S. methodologies in a moretransparent manner than in previous inventories;
• Initiation of several new programs with industry, whichprovide new data and information that can be applied tocurrent methods or applied to more accurate and reliablemethods (so called "higher tier methods" by IPCC); and
• The IPCC Greenhouse Gas Inventory Program’s upcomingreport on Good Practice in Inventory Management, whichdevelops good practice guidance for the implementation ofthe 1996 IPCC Guidelines. The report will be published bythe IPCC in May 2000.
Note that the EIIP Greenhouse Gas Committee has notincorporated these developments into this version of the volume.Given the rapid pace of change in the area of greenhouse gasinventory methodologies, users of this document are encouragedto seek the most up-to-date information from EPA and the IPCCwhen developing inventories. EPA intends to provide periodicupdates to the EIIP chapters to reflect important methodologicaldevelopments. To determine whether an updated version of thischapter is available, please check the EIIP site athttp://www.epa.gov/ttn/chief/eiip/techrep.htm#green.
CHAPTER 4 – COAL MINING 10/20/99
4.3-2 EIIP Volume VIII
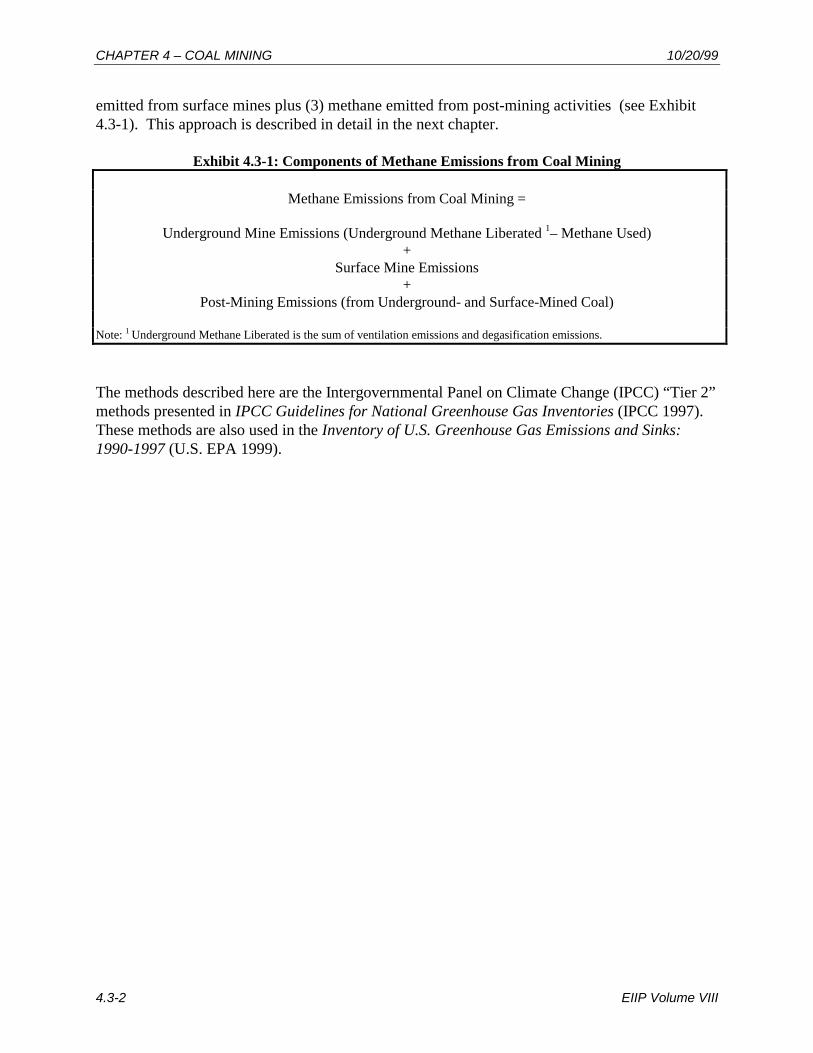
emitted from surface mines plus (3) methane emitted from post-mining activities (see Exhibit4.3-1). This approach is described in detail in the next chapter.
Exhibit 4.3-1: Components of Methane Emissions from Coal Mining
Methane Emissions from Coal Mining =
Underground Mine Emissions (Underground Methane Liberated 1– Methane Used)+
Surface Mine Emissions+
Post-Mining Emissions (from Underground- and Surface-Mined Coal)
Note: 1 Underground Methane Liberated is the sum of ventilation emissions and degasification emissions.
The methods described here are the Intergovernmental Panel on Climate Change (IPCC) “Tier 2”methods presented in IPCC Guidelines for National Greenhouse Gas Inventories (IPCC 1997).These methods are also used in the Inventory of U.S. Greenhouse Gas Emissions and Sinks:1990-1997 (U.S. EPA 1999).
EIIP Volume VIII 4.4-1
4
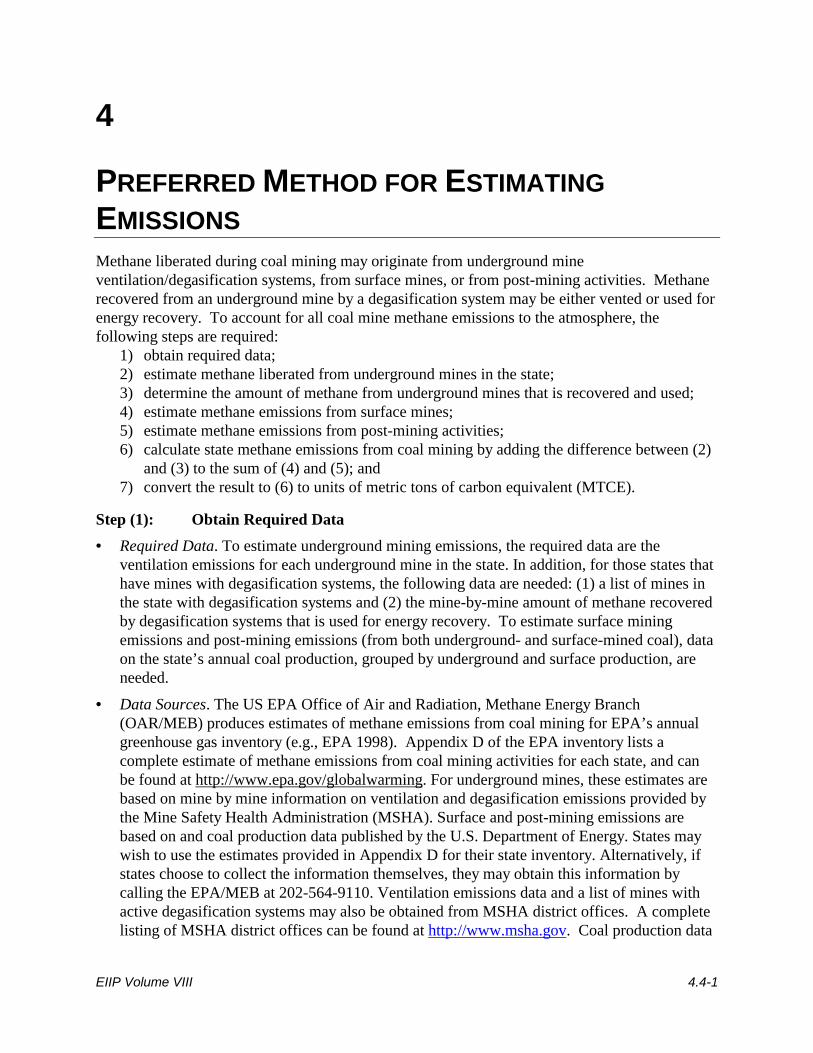
PREFERRED METHOD FOR ESTIMATINGEMISSIONSMethane liberated during coal mining may originate from underground mineventilation/degasification systems, from surface mines, or from post-mining activities. Methanerecovered from an underground mine by a degasification system may be either vented or used forenergy recovery. To account for all coal mine methane emissions to the atmosphere, thefollowing steps are required:
1) obtain required data;2) estimate methane liberated from underground mines in the state;3) determine the amount of methane from underground mines that is recovered and used;4) estimate methane emissions from surface mines;5) estimate methane emissions from post-mining activities;6) calculate state methane emissions from coal mining by adding the difference between (2)
and (3) to the sum of (4) and (5); and7) convert the result to (6) to units of metric tons of carbon equivalent (MTCE).
Step (1): Obtain Required Data• Required Data. To estimate underground mining emissions, the required data are the
ventilation emissions for each underground mine in the state. In addition, for those states thathave mines with degasification systems, the following data are needed: (1) a list of mines inthe state with degasification systems and (2) the mine-by-mine amount of methane recoveredby degasification systems that is used for energy recovery. To estimate surface miningemissions and post-mining emissions (from both underground- and surface-mined coal), dataon the state’s annual coal production, grouped by underground and surface production, areneeded.
• Data Sources. The US EPA Office of Air and Radiation, Methane Energy Branch(OAR/MEB) produces estimates of methane emissions from coal mining for EPA’s annualgreenhouse gas inventory (e.g., EPA 1998). Appendix D of the EPA inventory lists acomplete estimate of methane emissions from coal mining activities for each state, and canbe found at http://www.epa.gov/globalwarming. For underground mines, these estimates arebased on mine by mine information on ventilation and degasification emissions provided bythe Mine Safety Health Administration (MSHA). Surface and post-mining emissions arebased on and coal production data published by the U.S. Department of Energy. States maywish to use the estimates provided in Appendix D for their state inventory. Alternatively, ifstates choose to collect the information themselves, they may obtain this information bycalling the EPA/MEB at 202-564-9110. Ventilation emissions data and a list of mines withactive degasification systems may also be obtained from MSHA district offices. A completelisting of MSHA district offices can be found at http://www.msha.gov. Coal production data
CHAPTER 4 – COAL MINING 10/20/99
4.4-2 EIIP Volume VIII
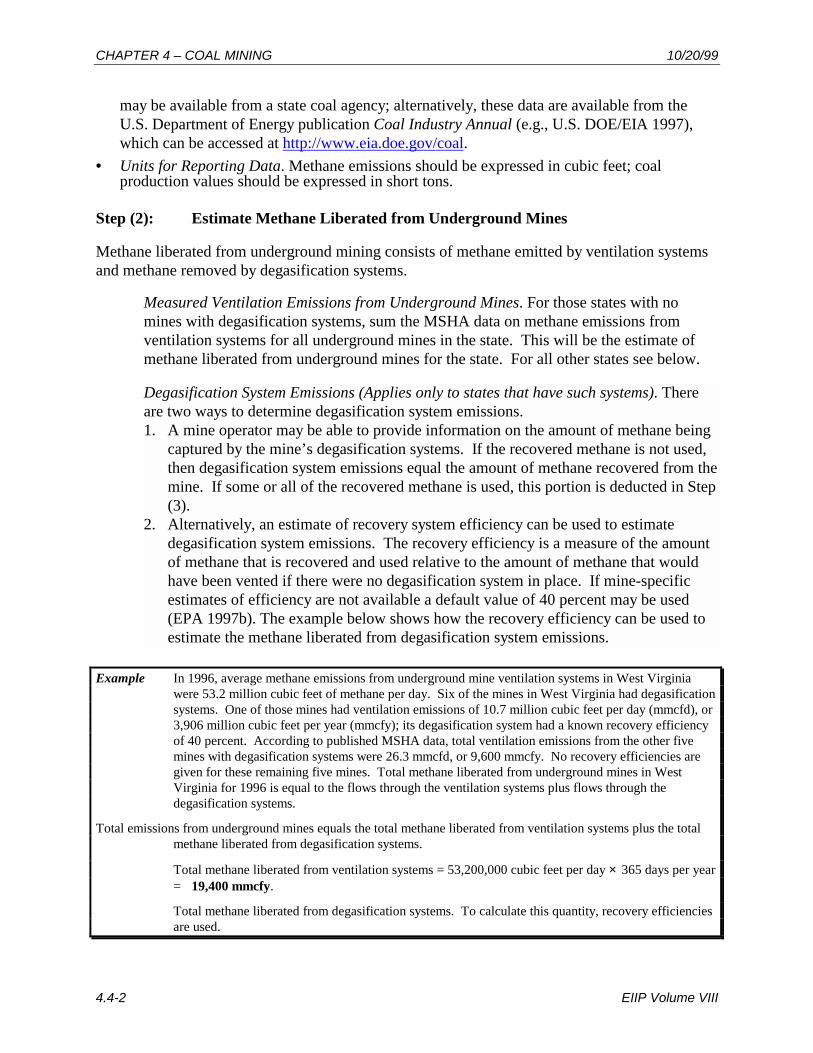
may be available from a state coal agency; alternatively, these data are available from theU.S. Department of Energy publication Coal Industry Annual (e.g., U.S. DOE/EIA 1997),which can be accessed at http://www.eia.doe.gov/coal.
• Units for Reporting Data. Methane emissions should be expressed in cubic feet; coalproduction values should be expressed in short tons.
Step (2): Estimate Methane Liberated from Underground Mines
Methane liberated from underground mining consists of methane emitted by ventilation systemsand methane removed by degasification systems.
Measured Ventilation Emissions from Underground Mines. For those states with nomines with degasification systems, sum the MSHA data on methane emissions fromventilation systems for all underground mines in the state. This will be the estimate ofmethane liberated from underground mines for the state. For all other states see below.
Degasification System Emissions (Applies only to states that have such systems). Thereare two ways to determine degasification system emissions.1. A mine operator may be able to provide information on the amount of methane being
captured by the mine’s degasification systems. If the recovered methane is not used,then degasification system emissions equal the amount of methane recovered from themine. If some or all of the recovered methane is used, this portion is deducted in Step(3).
2. Alternatively, an estimate of recovery system efficiency can be used to estimatedegasification system emissions. The recovery efficiency is a measure of the amountof methane that is recovered and used relative to the amount of methane that wouldhave been vented if there were no degasification system in place. If mine-specificestimates of efficiency are not available a default value of 40 percent may be used(EPA 1997b). The example below shows how the recovery efficiency can be used toestimate the methane liberated from degasification system emissions.
Example In 1996, average methane emissions from underground mine ventilation systems in West Virginiawere 53.2 million cubic feet of methane per day. Six of the mines in West Virginia had degasificationsystems. One of those mines had ventilation emissions of 10.7 million cubic feet per day (mmcfd), or3,906 million cubic feet per year (mmcfy); its degasification system had a known recovery efficiencyof 40 percent. According to published MSHA data, total ventilation emissions from the other fivemines with degasification systems were 26.3 mmcfd, or 9,600 mmcfy. No recovery efficiencies aregiven for these remaining five mines. Total methane liberated from underground mines in WestVirginia for 1996 is equal to the flows through the ventilation systems plus flows through thedegasification systems.
Total emissions from underground mines equals the total methane liberated from ventilation systems plus the totalmethane liberated from degasification systems.
Total methane liberated from ventilation systems = 53,200,000 cubic feet per day × 365 days per year= 19,400 mmcfy.
Total methane liberated from degasification systems. To calculate this quantity, recovery efficienciesare used.
10/20/99 CHAPTER 4 – COAL MINING
EIIP Volume VIII 4.4-3
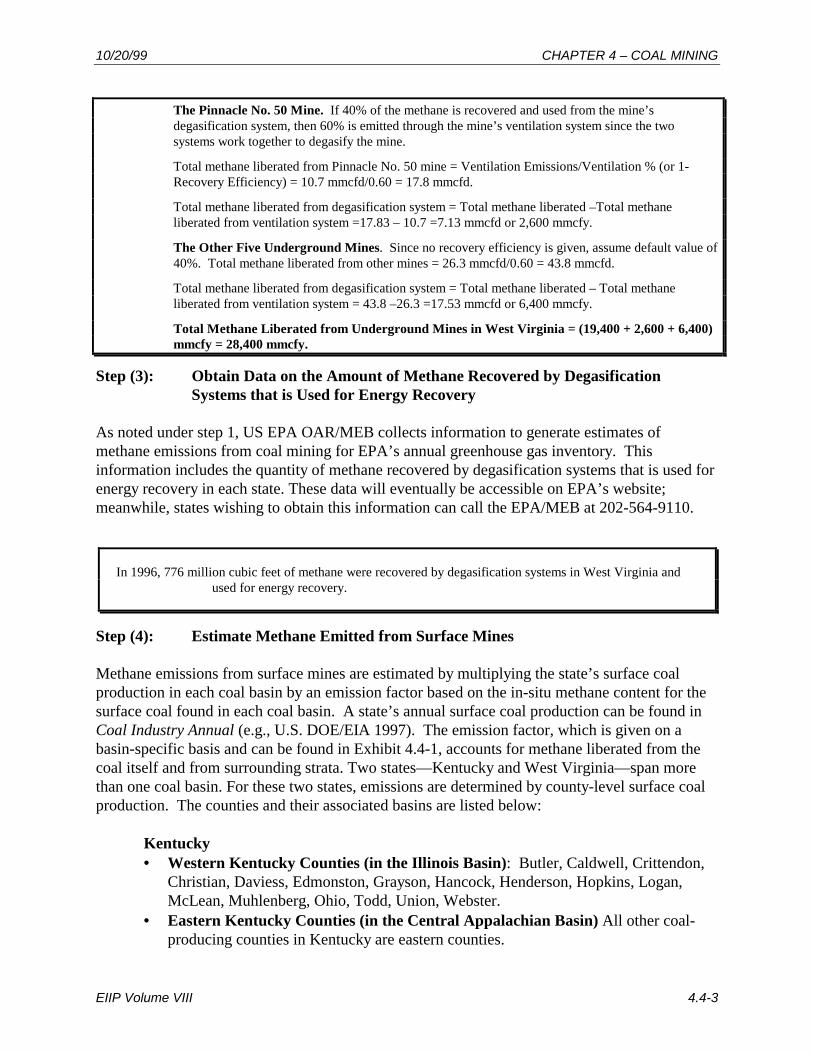
The Pinnacle No. 50 Mine. If 40% of the methane is recovered and used from the mine’sdegasification system, then 60% is emitted through the mine’s ventilation system since the twosystems work together to degasify the mine.
Total methane liberated from Pinnacle No. 50 mine = Ventilation Emissions/Ventilation % (or 1-Recovery Efficiency) = 10.7 mmcfd/0.60 = 17.8 mmcfd.
Total methane liberated from degasification system = Total methane liberated –Total methaneliberated from ventilation system =17.83 – 10.7 =7.13 mmcfd or 2,600 mmcfy.
The Other Five Underground Mines. Since no recovery efficiency is given, assume default value of40%. Total methane liberated from other mines = 26.3 mmcfd/0.60 = 43.8 mmcfd.
Total methane liberated from degasification system = Total methane liberated – Total methaneliberated from ventilation system = 43.8 –26.3 =17.53 mmcfd or 6,400 mmcfy.
Total Methane Liberated from Underground Mines in West Virginia = (19,400 + 2,600 + 6,400)mmcfy = 28,400 mmcfy.
Step (3): Obtain Data on the Amount of Methane Recovered by DegasificationSystems that is Used for Energy Recovery
As noted under step 1, US EPA OAR/MEB collects information to generate estimates ofmethane emissions from coal mining for EPA’s annual greenhouse gas inventory. Thisinformation includes the quantity of methane recovered by degasification systems that is used forenergy recovery in each state. These data will eventually be accessible on EPA’s website;meanwhile, states wishing to obtain this information can call the EPA/MEB at 202-564-9110.
Step (4): Estimate Methane Emitted from Surface Mines
Methane emissions from surface mines are estimated by multiplying the state’s surface coalproduction in each coal basin by an emission factor based on the in-situ methane content for thesurface coal found in each coal basin. A state’s annual surface coal production can be found inCoal Industry Annual (e.g., U.S. DOE/EIA 1997). The emission factor, which is given on abasin-specific basis and can be found in Exhibit 4.4-1, accounts for methane liberated from thecoal itself and from surrounding strata. Two states—Kentucky and West Virginia—span morethan one coal basin. For these two states, emissions are determined by county-level surface coalproduction. The counties and their associated basins are listed below:
Kentucky• Western Kentucky Counties (in the Illinois Basin): Butler, Caldwell, Crittendon,
Christian, Daviess, Edmonston, Grayson, Hancock, Henderson, Hopkins, Logan,McLean, Muhlenberg, Ohio, Todd, Union, Webster.
• Eastern Kentucky Counties (in the Central Appalachian Basin) All other coal-producing counties in Kentucky are eastern counties.
In 1996, 776 million cubic feet of methane were recovered by degasification systems in West Virginia andused for energy recovery.
CHAPTER 4 – COAL MINING 10/20/99
4.4-4 EIIP Volume VIII
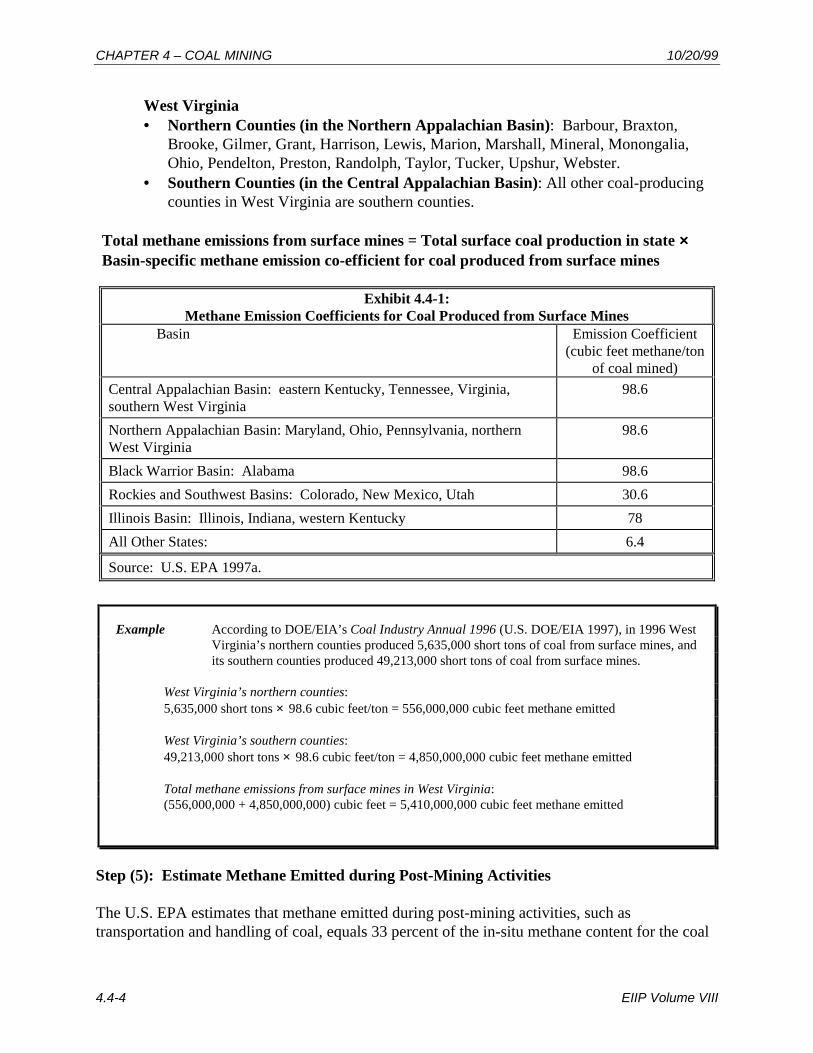
West Virginia• Northern Counties (in the Northern Appalachian Basin): Barbour, Braxton,
Brooke, Gilmer, Grant, Harrison, Lewis, Marion, Marshall, Mineral, Monongalia,Ohio, Pendelton, Preston, Randolph, Taylor, Tucker, Upshur, Webster.
• Southern Counties (in the Central Appalachian Basin): All other coal-producingcounties in West Virginia are southern counties.
Total methane emissions from surface mines = Total surface coal production in state ××××Basin-specific methane emission co-efficient for coal produced from surface mines
Exhibit 4.4-1:
Methane Emission Coefficients for Coal Produced from Surface Mines Basin Emission Coefficient
(cubic feet methane/tonof coal mined)
Central Appalachian Basin: eastern Kentucky, Tennessee, Virginia,southern West Virginia
98.6
Northern Appalachian Basin: Maryland, Ohio, Pennsylvania, northernWest Virginia
98.6
Black Warrior Basin: Alabama 98.6 Rockies and Southwest Basins: Colorado, New Mexico, Utah 30.6 Illinois Basin: Illinois, Indiana, western Kentucky 78 All Other States: 6.4
Source: U.S. EPA 1997a.
Step (5): Estimate Methane Emitted during Post-Mining Activities
The U.S. EPA estimates that methane emitted during post-mining activities, such astransportation and handling of coal, equals 33 percent of the in-situ methane content for the coal
Example According to DOE/EIA’s Coal Industry Annual 1996 (U.S. DOE/EIA 1997), in 1996 WestVirginia’s northern counties produced 5,635,000 short tons of coal from surface mines, andits southern counties produced 49,213,000 short tons of coal from surface mines.
West Virginia’s northern counties:5,635,000 short tons × 98.6 cubic feet/ton = 556,000,000 cubic feet methane emitted
West Virginia’s southern counties:49,213,000 short tons × 98.6 cubic feet/ton = 4,850,000,000 cubic feet methane emitted
Total methane emissions from surface mines in West Virginia:(556,000,000 + 4,850,000,000) cubic feet = 5,410,000,000 cubic feet methane emitted
10/20/99 CHAPTER 4 – COAL MINING
EIIP Volume VIII 4.4-5
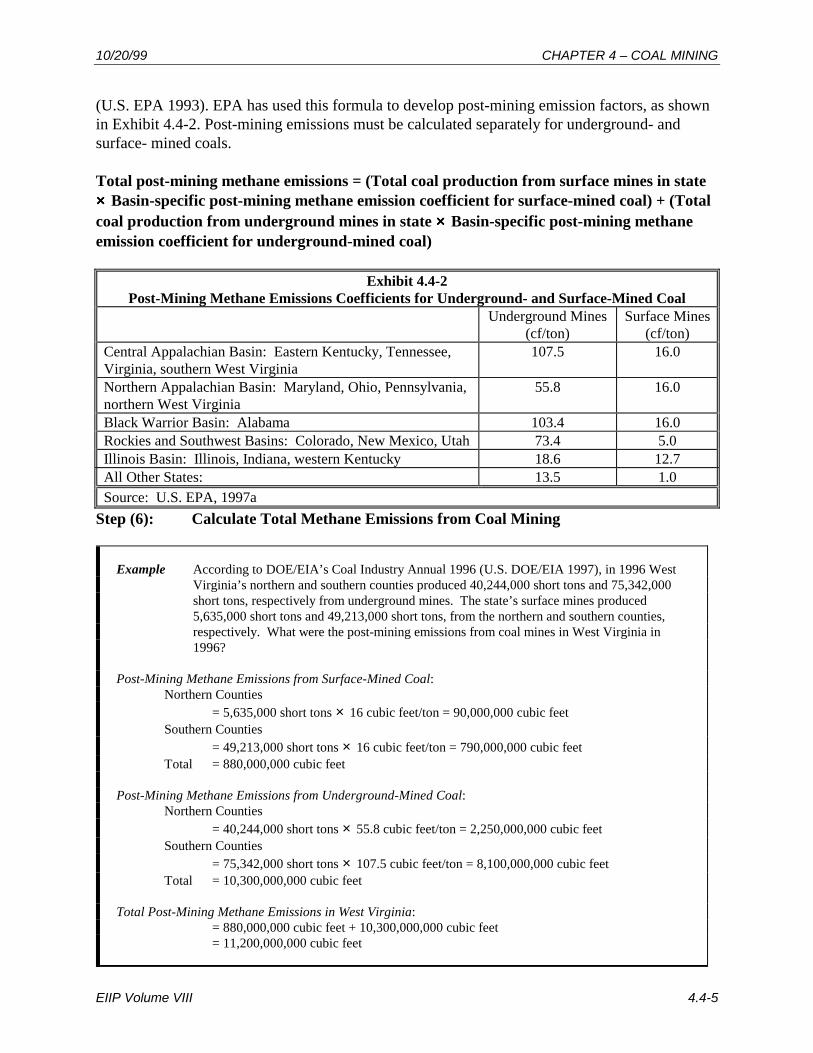
(U.S. EPA 1993). EPA has used this formula to develop post-mining emission factors, as shownin Exhibit 4.4-2. Post-mining emissions must be calculated separately for underground- andsurface- mined coals.
Total post-mining methane emissions = (Total coal production from surface mines in state×××× Basin-specific post-mining methane emission coefficient for surface-mined coal) + (Totalcoal production from underground mines in state ×××× Basin-specific post-mining methaneemission coefficient for underground-mined coal)
Exhibit 4.4-2 Post-Mining Methane Emissions Coefficients for Underground- and Surface-Mined Coal
Underground Mines (cf/ton)
Surface Mines (cf/ton)
Central Appalachian Basin: Eastern Kentucky, Tennessee,Virginia, southern West Virginia
107.5 16.0
Northern Appalachian Basin: Maryland, Ohio, Pennsylvania,northern West Virginia
55.8 16.0
Black Warrior Basin: Alabama 103.4 16.0 Rockies and Southwest Basins: Colorado, New Mexico, Utah 73.4 5.0 Illinois Basin: Illinois, Indiana, western Kentucky 18.6 12.7 All Other States: 13.5 1.0 Source: U.S. EPA, 1997a
Step (6): Calculate Total Methane Emissions from Coal Mining
Example According to DOE/EIA’s Coal Industry Annual 1996 (U.S. DOE/EIA 1997), in 1996 WestVirginia’s northern and southern counties produced 40,244,000 short tons and 75,342,000short tons, respectively from underground mines. The state’s surface mines produced5,635,000 short tons and 49,213,000 short tons, from the northern and southern counties,respectively. What were the post-mining emissions from coal mines in West Virginia in1996?
Post-Mining Methane Emissions from Surface-Mined Coal:Northern Counties
= 5,635,000 short tons × 16 cubic feet/ton = 90,000,000 cubic feetSouthern Counties
= 49,213,000 short tons × 16 cubic feet/ton = 790,000,000 cubic feet Total = 880,000,000 cubic feet Post-Mining Methane Emissions from Underground-Mined Coal:
Northern Counties = 40,244,000 short tons × 55.8 cubic feet/ton = 2,250,000,000 cubic feet
Southern Counties = 75,342,000 short tons × 107.5 cubic feet/ton = 8,100,000,000 cubic feet Total = 10,300,000,000 cubic feet Total Post-Mining Methane Emissions in West Virginia: = 880,000,000 cubic feet + 10,300,000,000 cubic feet
= 11,200,000,000 cubic feet
CHAPTER 4 – COAL MINING 10/20/99
4.4-6 EIIP Volume VIII
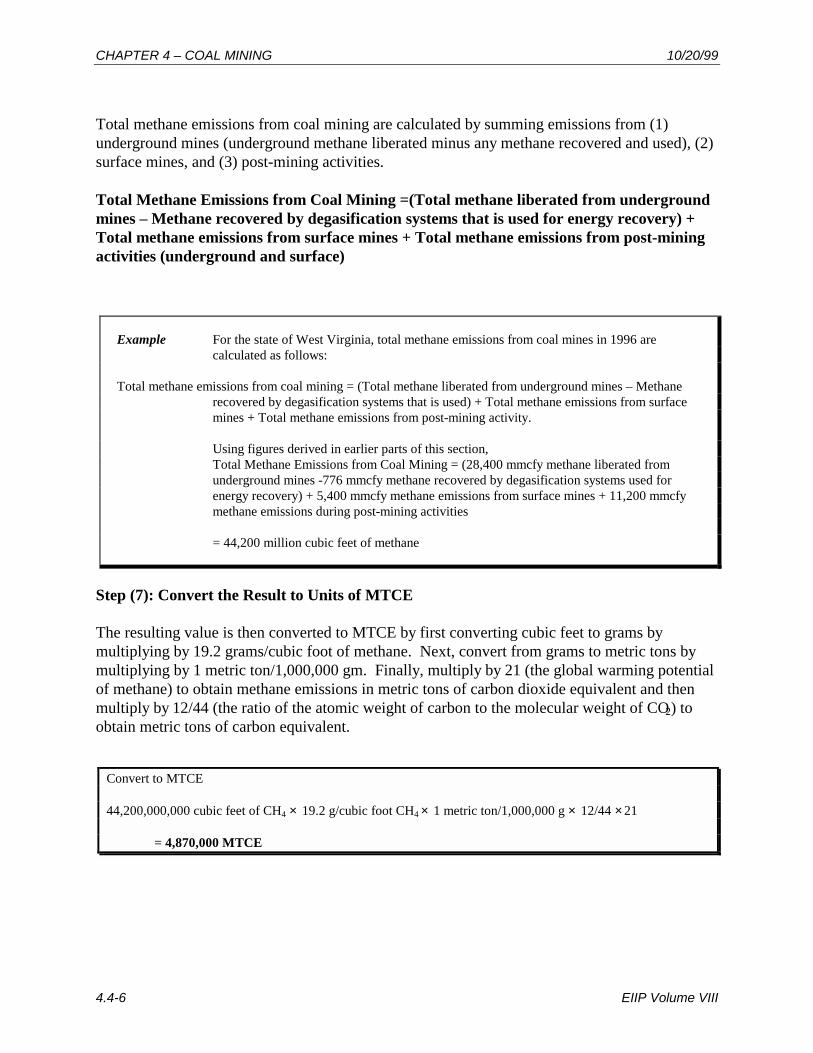
Total methane emissions from coal mining are calculated by summing emissions from (1)underground mines (underground methane liberated minus any methane recovered and used), (2)surface mines, and (3) post-mining activities. Total Methane Emissions from Coal Mining =(Total methane liberated from undergroundmines – Methane recovered by degasification systems that is used for energy recovery) +Total methane emissions from surface mines + Total methane emissions from post-miningactivities (underground and surface)
Step (7): Convert the Result to Units of MTCE The resulting value is then converted to MTCE by first converting cubic feet to grams bymultiplying by 19.2 grams/cubic foot of methane. Next, convert from grams to metric tons bymultiplying by 1 metric ton/1,000,000 gm. Finally, multiply by 21 (the global warming potentialof methane) to obtain methane emissions in metric tons of carbon dioxide equivalent and thenmultiply by 12/44 (the ratio of the atomic weight of carbon to the molecular weight of CO2) toobtain metric tons of carbon equivalent.
Example For the state of West Virginia, total methane emissions from coal mines in 1996 arecalculated as follows:
Total methane emissions from coal mining = (Total methane liberated from underground mines – Methanerecovered by degasification systems that is used) + Total methane emissions from surfacemines + Total methane emissions from post-mining activity.
Using figures derived in earlier parts of this section,Total Methane Emissions from Coal Mining = (28,400 mmcfy methane liberated fromunderground mines -776 mmcfy methane recovered by degasification systems used forenergy recovery) + 5,400 mmcfy methane emissions from surface mines + 11,200 mmcfymethane emissions during post-mining activities
= 44,200 million cubic feet of methane
Convert to MTCE
44,200,000,000 cubic feet of CH4 × 19.2 g/cubic foot CH4 × 1 metric ton/1,000,000 g × 12/44 ×21
= 4,870,000 MTCE
EIIP Volume VIII 4.5-1
5
ALTERNATE METHODS FOR ESTIMATINGEMISSIONSNo alternate methods have yet been approved by the Greenhouse Gas Committee of the EmissionInventory Improvement Program.

EIIP Volume VIII 4.6-1
6
QUALITY ASSURANCE/QUALITY CONTROLQuality assurance (QA) and quality control (QC) are essential elements in producing high qualityemission estimates and should be included in all methods to estimate emissions. QA/QC ofemissions estimates are accomplished through a set of procedures that ensure the quality andreliability of data collection and processing. These procedures include the use of appropriateemission estimation methods, reasonable assumptions, data reliability checks, and accuracy/logicchecks of calculations. Volume VI of this series, Quality Assurance Procedures, describesmethods and tools for performing these procedures.
There is uncertainty associated with each of the emission subsources. This section describes theorigin of the uncertainty and provides uncertainty estimates, based on an analysis of uncertaintyperformed by US EPA’s Methane Energy Branch. That analysis was based on the use of expertjudgment on the quality of the data, used as inputs to a Monte Carlo analysis.
Underground ventilation systems. Methane emissions from ventilation systems are based onquarterly measurements taken by MSHA at individual mines. Because the emission estimates arebased on actual measurements, the uncertainty associated with the estimate is assumed to be low.The main uncertainty associated with the ventilation estimates is that they are based on quarterlymeasurements. Accordingly, to the extent that the average of the four quarterly measurementsare not representative of the true annual average at a given mine, average emissions at aparticular mine may be over- or under-estimated. In addition to possible uncertainties associatedwith using quarterly measurements, there are some limited uncertainties associated with thepotential for measurement and reporting errors. Uncertainty in this sub-source is estimated at ±8percent.
Underground degasification systems. MSHA reports which mines employ degasificationsystems and the type of degasification system used. MSHA, however, does not report methaneliberated from degasification systems and coal mines are not required to report this data. Somecoal mines have provided EPA with data on methane liberated. For other mines, EPA hasestimated methane liberated based on the type of degasification system employed. Thus, forthose mines that have provided data, the uncertainty would be low, whereas for those mineswhere EPA estimated methane liberated, the uncertainty would be higher. Uncertainty in thissub-source is estimated at –20 percent to +10 percent.
Methane used at underground mines. As mentioned previously, all coal mines must report gassales to state agencies responsible for monitoring gas production. While there is little uncertaintyassociated with the reported gas sales, there is uncertainty associated with the timing ofrecognizing the emission reduction. For coal mines that recover methane in advance of mining,the emission reduction is recognized in the year in which the coal seam is mined-through. Thus,
CHAPTER 4 – COAL MINING 10/20/99
4.6-2 EIIP Volume VIII
without knowing exactly what is happening at a particular coal mine, there would be uncertaintyassociated with estimating methane used. Uncertainty in this sub-source is estimated at ±15percent.
Surface mines. Previous studies have indicated that methane emissions from surface mines arelikely to be from one to three times greater than the in-situ methane content of the coal. Themethodology assumes a value of two times the in-situ content of the coal. An additionaluncertainty, however, relates to the estimated average in-situ content for each basin. Uncertaintyin this sub-source is estimated at ±50 percent.
Post-mining emissions. The uncertainties relating to post-mining emissions are similar to thosefor surface mining emissions, as a similar methodology is used. Uncertainty in this sub-source isestimated at ±50 percent.
6.1 DATA ATTRIBUTE RANKING SYSTEM (DARS) SCORES
DARS is a system for evaluating the quality of data used in an emission inventory. To develop aDARS score, one must evaluate the reliability of eight components of the emissions estimate.Four of the components are related to the activity level (e.g., the amount of coal mined). Theother four components are related to the emission factor (e.g., the amount of methane emitted perunit of coal mined). For both the activity level and the emission factor, the four attributesevaluated are the measurement method, source specificity, spatial congruity, and temporalcongruity. Each component is scored on a scale of zero to one, where one represents a high levelof reliability. To derive the DARS score for a given estimation method, the activity level score ismultiplied by the emission factor score for each of the four attributes, and the resulting productsare averaged. The highest possible DARS composite score is one. A complete discussion ofDARS may be found in Chapter 4 of Volume VI, Quality Assurance Procedures.
The DARS scores provided here are based on the use of the emission factors provided in thischapter, and activity data from the US government sources referenced in the various steps of themethodology. If a state uses state data sources for activity data, the state may wish to develop aDARS score based on the use of state data.
10/20/99 CHAPTER 4 – COAL MINING
EIIP Volume VIII 4.6-3
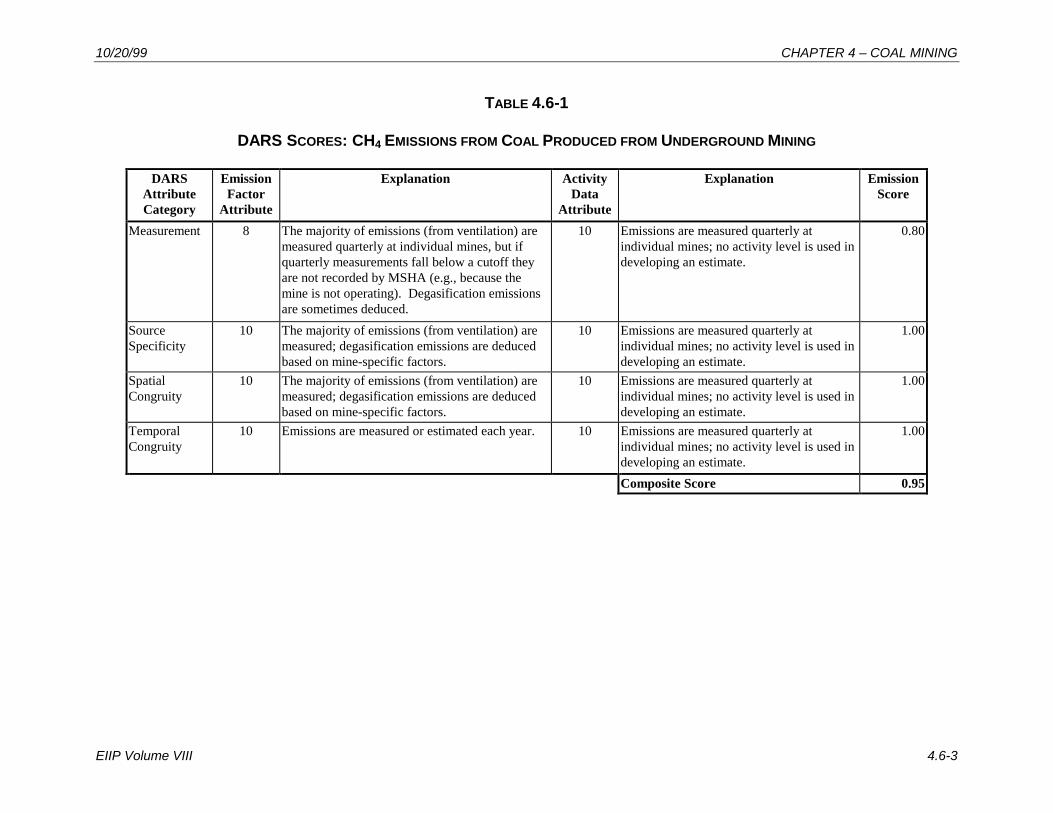
TABLE 4.6-1
DARS SCORES: CH4 EMISSIONS FROM COAL PRODUCED FROM UNDERGROUND MINING
DARSAttributeCategory
EmissionFactor
Attribute
Explanation ActivityData
Attribute
Explanation EmissionScore
Measurement 8 The majority of emissions (from ventilation) aremeasured quarterly at individual mines, but ifquarterly measurements fall below a cutoff theyare not recorded by MSHA (e.g., because themine is not operating). Degasification emissionsare sometimes deduced.
10 Emissions are measured quarterly atindividual mines; no activity level is used indeveloping an estimate.
0.80
SourceSpecificity
10 The majority of emissions (from ventilation) aremeasured; degasification emissions are deducedbased on mine-specific factors.
10 Emissions are measured quarterly atindividual mines; no activity level is used indeveloping an estimate.
1.00
SpatialCongruity
10 The majority of emissions (from ventilation) aremeasured; degasification emissions are deducedbased on mine-specific factors.
10 Emissions are measured quarterly atindividual mines; no activity level is used indeveloping an estimate.
1.00
TemporalCongruity
10 Emissions are measured or estimated each year. 10 Emissions are measured quarterly atindividual mines; no activity level is used indeveloping an estimate.
1.00
Composite Score 0.95
CHAPTER 4 – COAL MINING 10/20/99
4.6-4 EIIP Volume VIII
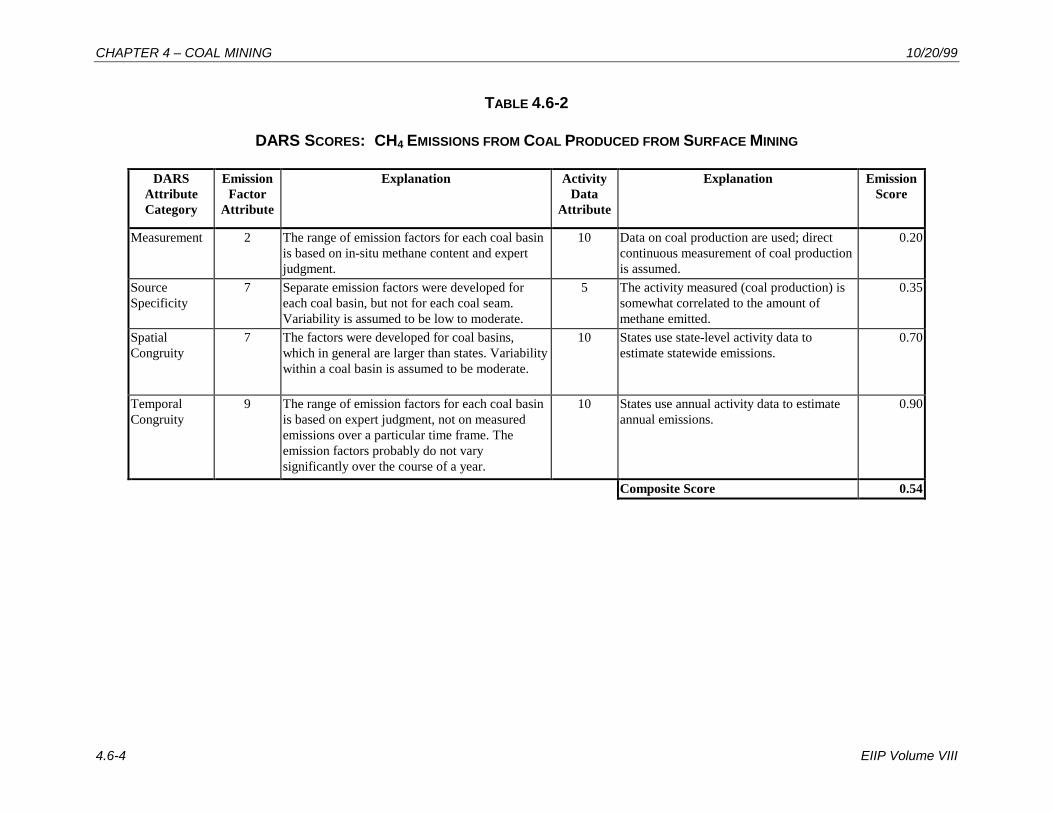
TABLE 4.6-2
DARS SCORES: CH4 EMISSIONS FROM COAL PRODUCED FROM SURFACE MINING
DARSAttributeCategory
EmissionFactor
Attribute
Explanation ActivityData
Attribute
Explanation EmissionScore
Measurement 2 The range of emission factors for each coal basinis based on in-situ methane content and expertjudgment.
10 Data on coal production are used; directcontinuous measurement of coal productionis assumed.
0.20
SourceSpecificity
7 Separate emission factors were developed foreach coal basin, but not for each coal seam.Variability is assumed to be low to moderate.
5 The activity measured (coal production) issomewhat correlated to the amount ofmethane emitted.
0.35
SpatialCongruity
7 The factors were developed for coal basins,which in general are larger than states. Variabilitywithin a coal basin is assumed to be moderate.
10 States use state-level activity data toestimate statewide emissions.
0.70
TemporalCongruity
9 The range of emission factors for each coal basinis based on expert judgment, not on measuredemissions over a particular time frame. Theemission factors probably do not varysignificantly over the course of a year.
10 States use annual activity data to estimateannual emissions.
0.90
Composite Score 0.54
10/20/99 CHAPTER 4 – COAL MINING
EIIP Volume VIII 4.6-5
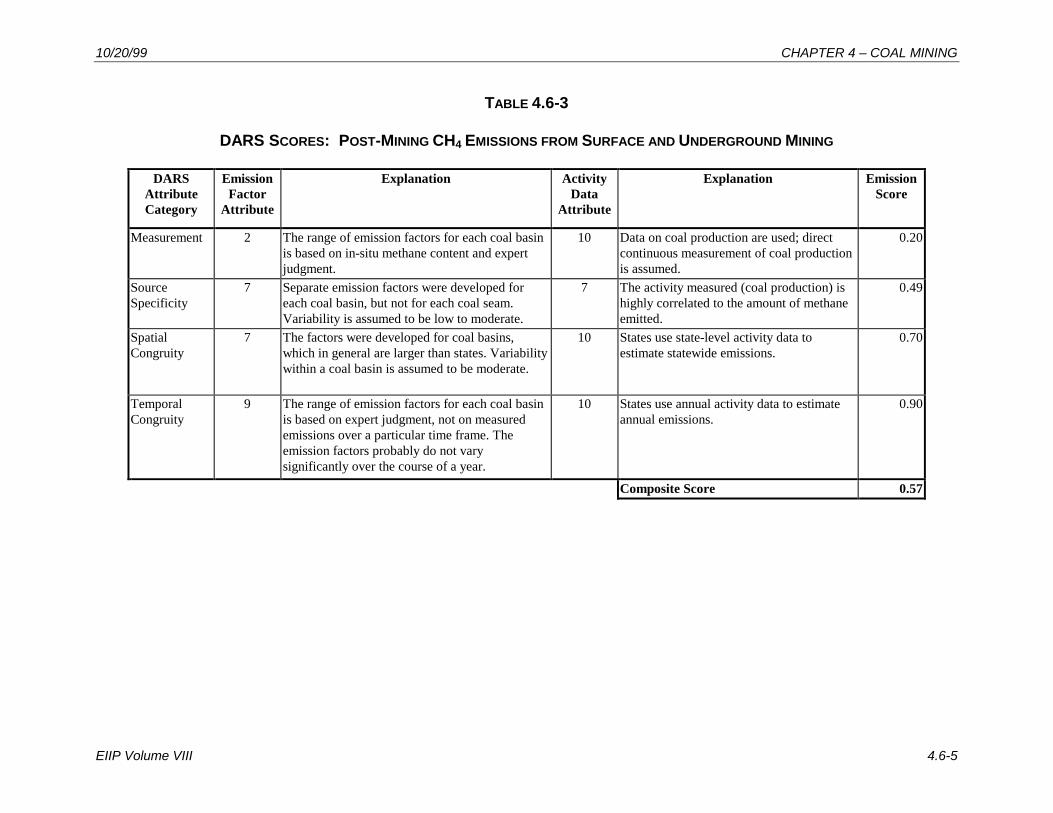
TABLE 4.6-3
DARS SCORES: POST-MINING CH4 EMISSIONS FROM SURFACE AND UNDERGROUND MINING
DARSAttributeCategory
EmissionFactor
Attribute
Explanation ActivityData
Attribute
Explanation EmissionScore
Measurement 2 The range of emission factors for each coal basinis based on in-situ methane content and expertjudgment.
10 Data on coal production are used; directcontinuous measurement of coal productionis assumed.
0.20
SourceSpecificity
7 Separate emission factors were developed foreach coal basin, but not for each coal seam.Variability is assumed to be low to moderate.
7 The activity measured (coal production) ishighly correlated to the amount of methaneemitted.
0.49
SpatialCongruity
7 The factors were developed for coal basins,which in general are larger than states. Variabilitywithin a coal basin is assumed to be moderate.
10 States use state-level activity data toestimate statewide emissions.
0.70
TemporalCongruity
9 The range of emission factors for each coal basinis based on expert judgment, not on measuredemissions over a particular time frame. Theemission factors probably do not varysignificantly over the course of a year.
10 States use annual activity data to estimateannual emissions.
0.90
Composite Score 0.57

EIIP Volume VIII 4.7-1
7
REFERENCESIntergovernmental Panel on Climate Change (IPCC) 1997. Revised 1996 IPCC Guidelines for
National Greenhouse Gas Inventories. Bracknell, England: IPCC.
Kissell, F.N., C.M. McCulloch, and C.H. Elder. 1973. The Direct Method for DeterminingMethane Content of Coalbeds for Ventilation Design. U.S. Bureau of Mines InformationCircular 7767, U.S. Department of the Interior, Washington, D.C.
Reid, Bill. 1997. “International Longwall Census, Part 1,” Coal Age, September 1997.
U.S. Department of Energy, Energy Information Administration (U.S. DOE/EIA) 1997. CoalIndustry Annual, 1996 (Washington, DC: U.S. Department of Energy). Internet address:http://www.eia.doe.gov/fuelcoal.html
U.S. EPA (U.S. Environmental Protection Agency). 1999. Inventory of U.S. Greenhouse GasEmissions and Sinks: 1990 - 1997. EPA 236-R-99-003. Internet address:http://www.epa.gov/globalwarming/inventory/1999-inv.html.
U.S. EPA (U.S. Environmental Protection Agency). 1998. Inventory of U.S. Greenhouse GasEmissions and Sinks: 1990 - 1996. EPA 236-R-98-006. Internet address:http://www.epa.gov/globalwarming/inventory/1998-inv.html.
U.S. EPA 1997a. Coalbed Methane Emissions Estimates Database, 1997. Prepared by ICF,Inc., for U.S. EPA, OAR, APPD.
U.S. EPA 1997b. Identifying Opportunities for Methane Recovery at U.S. Coal Mines: DraftProfiles of Selected Gassy Underground Coal Mines. Prepared by ICF, Inc. and RavenRidge Resources, Inc., for U.S. EPA, OAR, APPD, September 1997.
U.S. EPA. 1993. Anthropogenic Methane Emissions in the United States: Estimates for 1990.Report to Congress. Office of Air and Radiation (6202J). EPA 430-R-93-003. April1993.
U.S. EPA 1990. Methane Emissions from Coal Mining: Issues and Opportunities for Reduction.Prepared by ICF Resources Incorporated for Office of Air and Radiation, USEPA,Washington, DC.