Embed Size (px)
Citation preview
1716IEICE TRANS. ELECTRON., VOL.E95–C, NO.11 NOVEMBER 2012
INVITED PAPER Special Section on Electronic Displays
Method for Evaluating Performance of Wipers Based on Visibility
Takashi KITAYAMA†a), Student Member, Mikiko KAWASUMI†, Nonmember, Hatsuo YAMASAKI†,Tomoaki NAKANO†, Shin YAMAMOTO†, Muneo YAMADA†, Members, and Yuta DOI††, Nonmember
SUMMARY There is no clear criterion yet for evaluating wipers basedon performances of wiping raindrops and visibility in forward view. Inthe visibility evaluation in rainy driving, it is important to examine spatialfrequency and contrast of objects in forward view. Spatial frequency andcontrast of image which were affected by raindrops are calculated based onthem of background board which were printed stripe patterns. Variationswith time of power of analysed frequency and decreased contrast are syn-chronized with motion of the wiper for the all experimental cases. More-over, we executed questionnaire, and evaluated the view of the backgroundboard. These results show that the proposed methods have been validatedin evaluation with wiping performance.key words: wiper, visibility, wiping performance, frequency analysis, con-trast
1. Introduction
It is essential to ensure visibility in forward view while driv-ing a vehicle safely, especially in a bad weather such as rain,snow and fog. Automobile wipers (also called windshieldwipers) and washer with various improvements have beenwidely used in the past 100 years as a way to get clear for-ward view [1], [2]. There have been improvements not onlyin performance of wiping raindrops but also in decrease ofchatter vibrations [3], [4], noise reduction [5], prevention ofwiper blade reversal [6], and better wiper blade designs [7].CAE was also introduced to improve wiper and washer per-formances [8]. These research results are utilized in manyautomobiles today for their front and rear windows, evenfor wiping headlamps. When we consider ensuring clearforward view, however, there is no established criterion yetto evaluate visibility. It follows that there has been no eval-uation of wiper performance based on visibility. The onlytesting method at present is a visual check of the physicallywiped area of the front window glass, which is a qualitativeevaluation with human eyes. No method can be found toevaluate visibility in rain.
This is a study on evaluation of performance of auto-mobile wipers in terms of visibility in rain, among severalbad weather conditions for driving.
This method aims at quantitative evaluation of wiping
Manuscript received February 24, 2012.Manuscript revised June 8, 2012.†The authors are with Meijo Univ., Nagoya-shi, 468-8502
Japan.††The author is with ASMO Co., Ltd., Kosai-shi, 431-0493
Japan.a) E-mail: [email protected]
DOI: 10.1587/transele.E95.C.1716
performance with consideration to the driver’s visual func-tion to improve forward visibility. By adding this methodto the traditional qualitative evaluation, wipers can be im-proved to be more suitable to the driver’s visual functionwith better visibility and a new wiping system can be de-veloped. Section 2 will discuss the current status and is-sues on visibility in rain. Section 3 will explain the eval-uation method of wiper performance in this study. Sec-tion 4 will discuss the experiments to examine the validity ofthis method. Moreover, in Sect. 4, the effectiveness of thismethod will be shown by comparison between verificationexperiment and questionnaire of visibility.
2. Current Status and Issues of Visibility in Rain
When driving a car, it is essential to ensure clear forwardview and check driving environment for safety. Visibil-ity factors can be divided into “driving environment” and“driver’s visual functions” as shown in Fig. 1. Generally, inany driving environment, basic functions such as the driver’seyesight and focusing among others greatly affect accurateunderstanding of objects in sight. When driving at night,night vision (inferior to static vision, significantly deterio-rated in the elderly) instead of static vision in normal day-time should be considered. In backlit driving environment,sensitivity to “brightness (called glare)” should be takeninto account along with eyesight. It is also necessary toconsider age variation of drivers because visual functionschange with aging. The target driving environment of thisstudy is visibility in rain. Raindrops (amount of rainfall) andwipers (wiping speed) need to be considered in evaluating
Fig. 1 Main factor of visibility in driving.
Copyright c© 2012 The Institute of Electronics, Information and Communication Engineers
KITAYAMA et al.: METHOD FOR EVALUATING PERFORMANCE OF WIPERS BASED ON VISIBILITY1717
visibility under such environment. These two could becomedisturbing factors in vision because they exist between thedriver’s eyes and the objects to be recognized.
There has been only one type of testing on wiper per-formance, as described below, to evaluate visibility in rain.There has been no quantitative evaluation with considerationto the driver’s visual functions as well as raindrops (amountof rainfall) and wipers (wiping speed). Wiping all water onthe glass surface does not bring a clear view. While sweep-ing drops of water, wiper blades form a thin and smoothwater sheet on the glass surface and ensure vision. If wiperblades form an uneven water sheet failing to sweep waterdrops, refraction of light hinders clear view.
The representative testing of wiper performance is de-scribed in JIS R 3212 “Testing method of safe windshieldfor automobiles” [9]. In this method, two forward view ar-eas, area A and area B, are set to evaluate forward view vis-ibility. In each area, wiping area ratio to satisfy the perfor-mance test is determined. Wipers are operated on a dirtywindshield at their slowest speed and the wiped area is mea-sured by visual observation. In order to pass this test, over98% of area A and over 80% of area B must be cleared. Inhigh-speed driving, a similar test is done and over 98% ofarea A is required. It is obvious, therefore, that traditionalwiping performance tests are done by visual observation andthey are not quantitative. In addition, in such a test, only aphysically wiped area can be confirmed and it is hardly anevaluation of visibility concerning rainfall amount and wip-ing motion. Establishing a quantitative evaluation methodof visibility in rain will lead to improvement of wipers anddevelopment of a new wiper system. Moreover, because el-derly drivers are increasing in number today, it will bringabout a wiper system that gives good visibility to both youngand old people. It is beneficial to include the driver’s visualfunctions in visibility evaluation.
3. Proposed Method for Evaluation of Wiper
3.1 Basic Concept
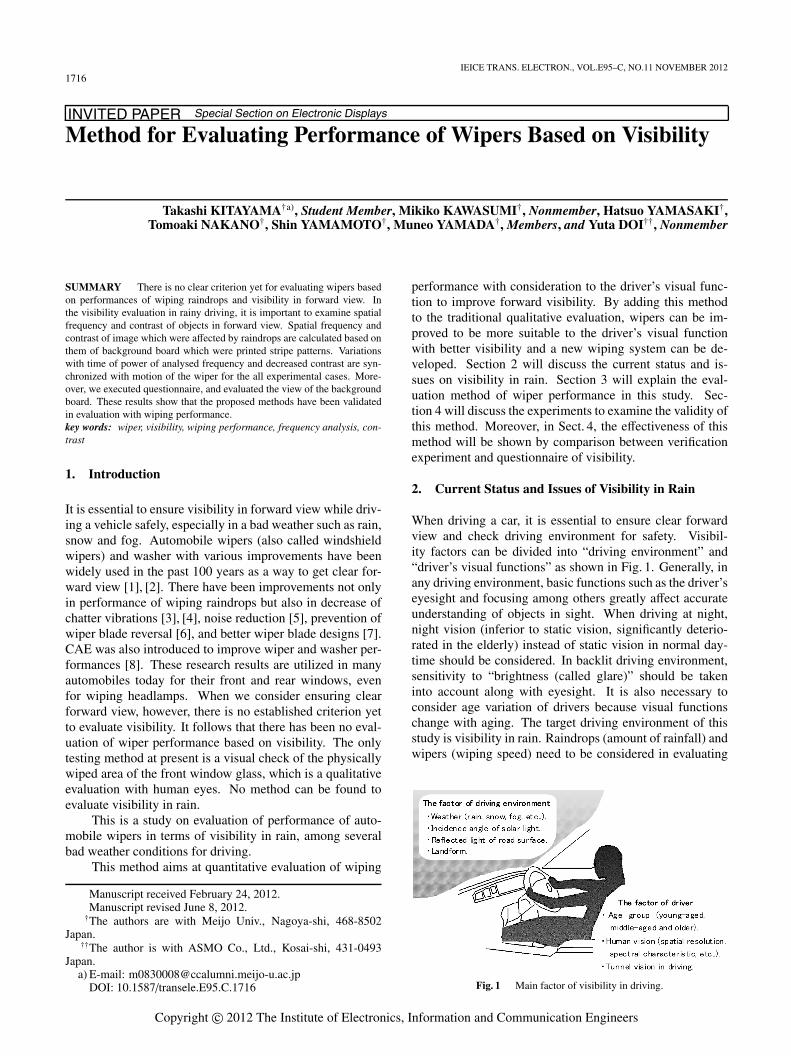
In a laboratory equipped with a raining simulation system, asingle-frequency rectangular-wave background board is setin front of the test vehicle and wipers are operated in fallingrain. A camera set at the driver’s eyesight position takesmovies of the forward view. The movie is analyzed withimage processing and a system to evaluate wiping perfor-mance will be proposed. This system can evaluate visibilityconsidering the amount of rainfall and wiping motion as ex-plained in earlier section.
Note that driver’s visual functions in this study do notinclude difference in how objects appear depending on age.Figure 2 shows outline of the system.
Of the basic visual functions of the driver in examin-ing visibility, the function related to “eyesight” is the mostimportant. That is because it is the base of safe driving torecognize traffic lights and signs from a distance and under-stand their content while driving. The easiness of recog-
Fig. 2 Outline of system for evaluating wiping performance.
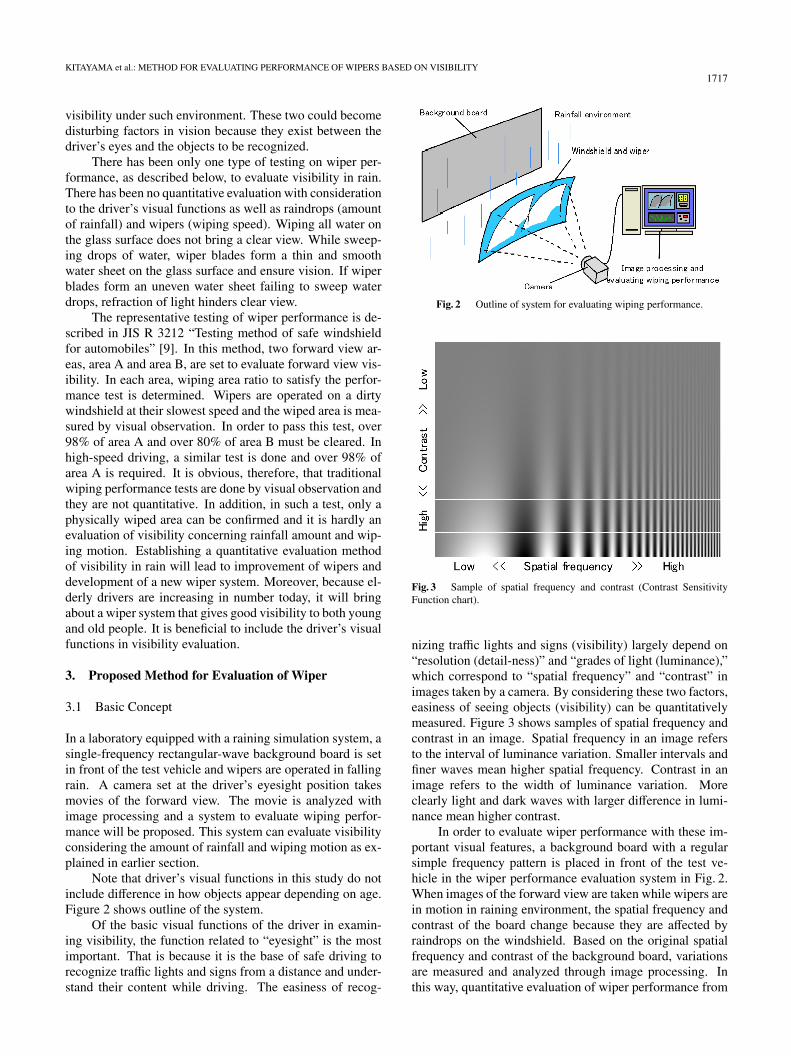
Fig. 3 Sample of spatial frequency and contrast (Contrast SensitivityFunction chart).
nizing traffic lights and signs (visibility) largely depend on“resolution (detail-ness)” and “grades of light (luminance),”which correspond to “spatial frequency” and “contrast” inimages taken by a camera. By considering these two factors,easiness of seeing objects (visibility) can be quantitativelymeasured. Figure 3 shows samples of spatial frequency andcontrast in an image. Spatial frequency in an image refersto the interval of luminance variation. Smaller intervals andfiner waves mean higher spatial frequency. Contrast in animage refers to the width of luminance variation. Moreclearly light and dark waves with larger difference in lumi-nance mean higher contrast.
In order to evaluate wiper performance with these im-portant visual features, a background board with a regularsimple frequency pattern is placed in front of the test ve-hicle in the wiper performance evaluation system in Fig. 2.When images of the forward view are taken while wipers arein motion in raining environment, the spatial frequency andcontrast of the board change because they are affected byraindrops on the windshield. Based on the original spatialfrequency and contrast of the background board, variationsare measured and analyzed through image processing. Inthis way, quantitative evaluation of wiper performance from
1718IEICE TRANS. ELECTRON., VOL.E95–C, NO.11 NOVEMBER 2012
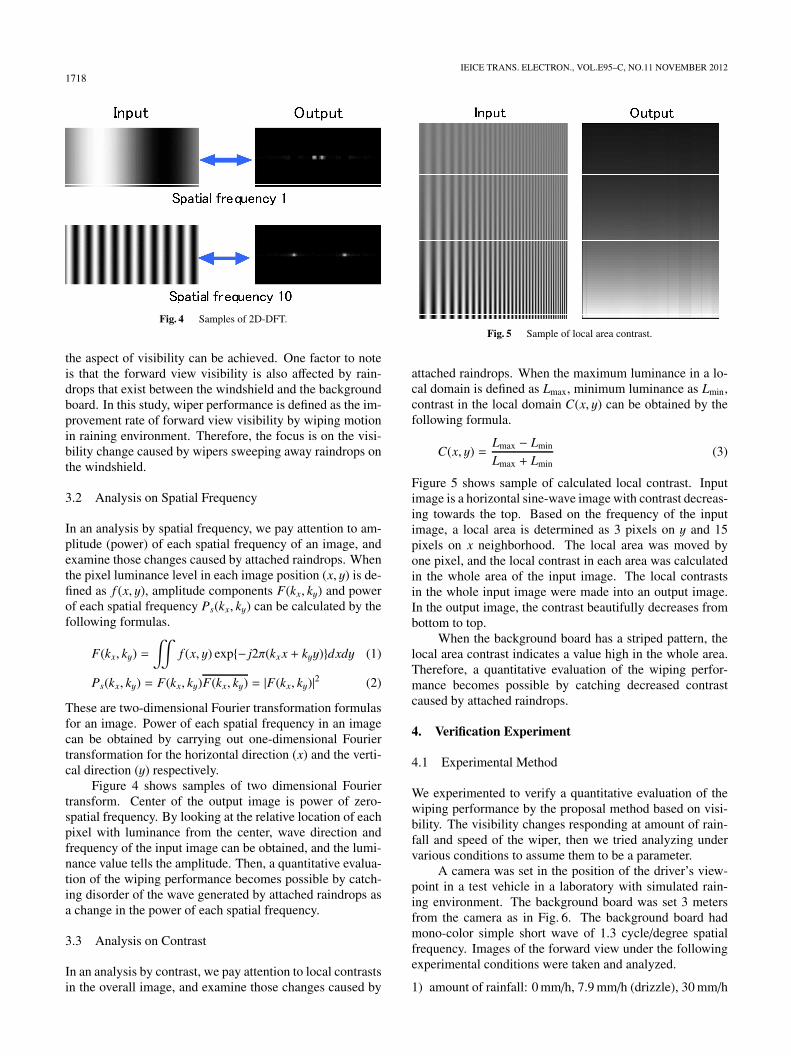
Fig. 4 Samples of 2D-DFT.
the aspect of visibility can be achieved. One factor to noteis that the forward view visibility is also affected by rain-drops that exist between the windshield and the backgroundboard. In this study, wiper performance is defined as the im-provement rate of forward view visibility by wiping motionin raining environment. Therefore, the focus is on the visi-bility change caused by wipers sweeping away raindrops onthe windshield.
3.2 Analysis on Spatial Frequency
In an analysis by spatial frequency, we pay attention to am-plitude (power) of each spatial frequency of an image, andexamine those changes caused by attached raindrops. Whenthe pixel luminance level in each image position (x, y) is de-fined as f (x, y), amplitude components F(kx, ky) and powerof each spatial frequency Ps(kx, ky) can be calculated by thefollowing formulas.
F(kx, ky) =�
f (x, y) exp{− j2π(kxx + kyy)}dxdy (1)
Ps(kx, ky) = F(kx, ky)F(kx, ky) = |F(kx, ky)|2 (2)
These are two-dimensional Fourier transformation formulasfor an image. Power of each spatial frequency in an imagecan be obtained by carrying out one-dimensional Fouriertransformation for the horizontal direction (x) and the verti-cal direction (y) respectively.
Figure 4 shows samples of two dimensional Fouriertransform. Center of the output image is power of zero-spatial frequency. By looking at the relative location of eachpixel with luminance from the center, wave direction andfrequency of the input image can be obtained, and the lumi-nance value tells the amplitude. Then, a quantitative evalua-tion of the wiping performance becomes possible by catch-ing disorder of the wave generated by attached raindrops asa change in the power of each spatial frequency.
3.3 Analysis on Contrast
In an analysis by contrast, we pay attention to local contrastsin the overall image, and examine those changes caused by
Fig. 5 Sample of local area contrast.
attached raindrops. When the maximum luminance in a lo-cal domain is defined as Lmax, minimum luminance as Lmin,contrast in the local domain C(x, y) can be obtained by thefollowing formula.
C(x, y) =Lmax − Lmin
Lmax + Lmin(3)
Figure 5 shows sample of calculated local contrast. Inputimage is a horizontal sine-wave image with contrast decreas-ing towards the top. Based on the frequency of the inputimage, a local area is determined as 3 pixels on y and 15pixels on x neighborhood. The local area was moved byone pixel, and the local contrast in each area was calculatedin the whole area of the input image. The local contrastsin the whole input image were made into an output image.In the output image, the contrast beautifully decreases frombottom to top.
When the background board has a striped pattern, thelocal area contrast indicates a value high in the whole area.Therefore, a quantitative evaluation of the wiping perfor-mance becomes possible by catching decreased contrastcaused by attached raindrops.
4. Verification Experiment
4.1 Experimental Method
We experimented to verify a quantitative evaluation of thewiping performance by the proposal method based on visi-bility. The visibility changes responding at amount of rain-fall and speed of the wiper, then we tried analyzing undervarious conditions to assume them to be a parameter.
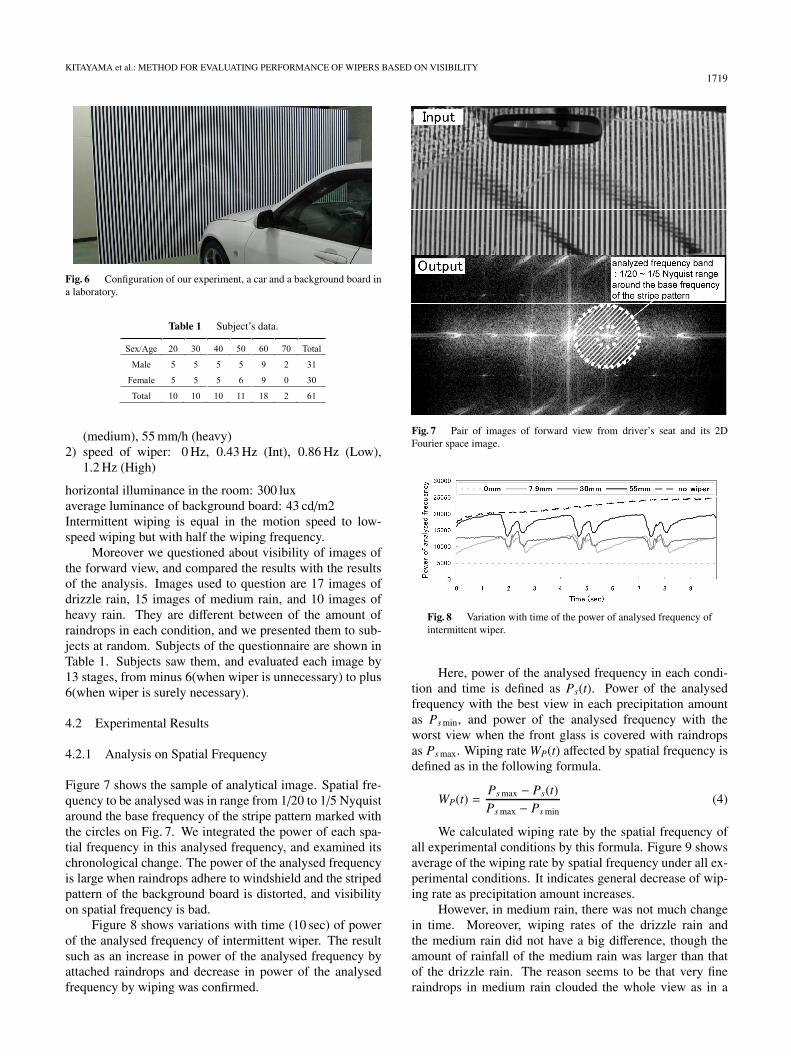
A camera was set in the position of the driver’s view-point in a test vehicle in a laboratory with simulated rain-ing environment. The background board was set 3 metersfrom the camera as in Fig. 6. The background board hadmono-color simple short wave of 1.3 cycle/degree spatialfrequency. Images of the forward view under the followingexperimental conditions were taken and analyzed.
1) amount of rainfall: 0 mm/h, 7.9 mm/h (drizzle), 30 mm/h
KITAYAMA et al.: METHOD FOR EVALUATING PERFORMANCE OF WIPERS BASED ON VISIBILITY1719
Fig. 6 Configuration of our experiment, a car and a background board ina laboratory.
Table 1 Subject’s data.
(medium), 55 mm/h (heavy)2) speed of wiper: 0 Hz, 0.43 Hz (Int), 0.86 Hz (Low),
1.2 Hz (High)
horizontal illuminance in the room: 300 luxaverage luminance of background board: 43 cd/m2Intermittent wiping is equal in the motion speed to low-speed wiping but with half the wiping frequency.
Moreover we questioned about visibility of images ofthe forward view, and compared the results with the resultsof the analysis. Images used to question are 17 images ofdrizzle rain, 15 images of medium rain, and 10 images ofheavy rain. They are different between of the amount ofraindrops in each condition, and we presented them to sub-jects at random. Subjects of the questionnaire are shown inTable 1. Subjects saw them, and evaluated each image by13 stages, from minus 6(when wiper is unnecessary) to plus6(when wiper is surely necessary).
4.2 Experimental Results
4.2.1 Analysis on Spatial Frequency
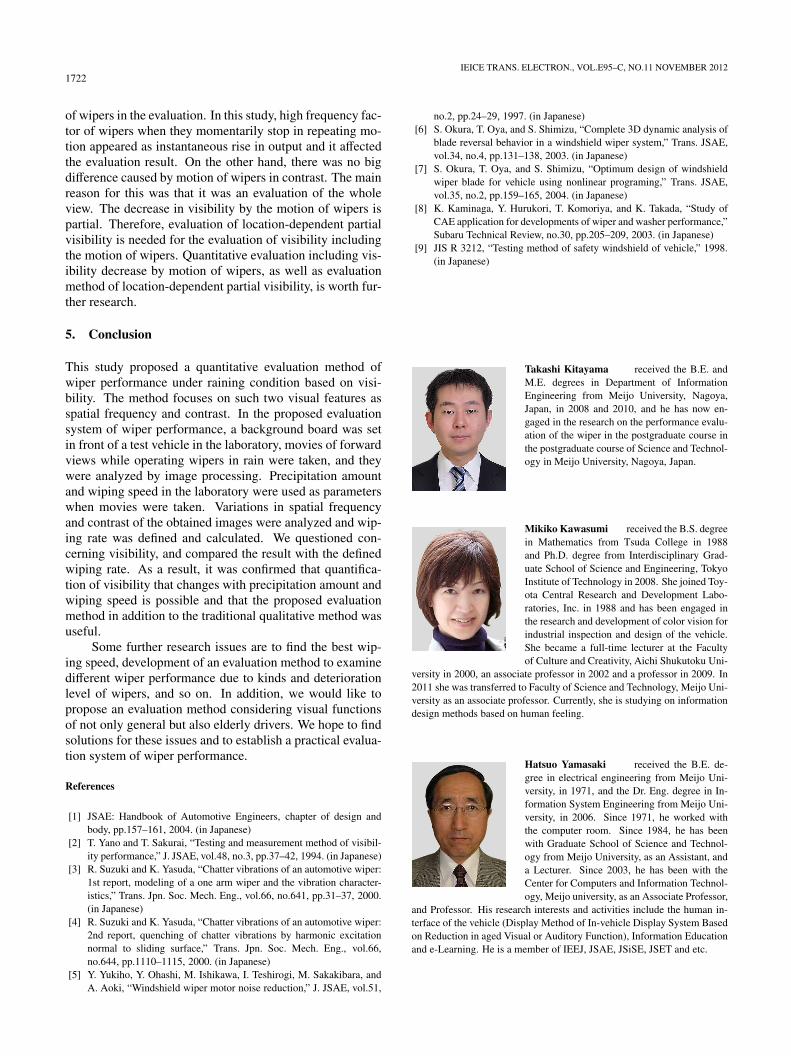
Figure 7 shows the sample of analytical image. Spatial fre-quency to be analysed was in range from 1/20 to 1/5 Nyquistaround the base frequency of the stripe pattern marked withthe circles on Fig. 7. We integrated the power of each spa-tial frequency in this analysed frequency, and examined itschronological change. The power of the analysed frequencyis large when raindrops adhere to windshield and the stripedpattern of the background board is distorted, and visibilityon spatial frequency is bad.
Figure 8 shows variations with time (10 sec) of powerof the analysed frequency of intermittent wiper. The resultsuch as an increase in power of the analysed frequency byattached raindrops and decrease in power of the analysedfrequency by wiping was confirmed.
Fig. 7 Pair of images of forward view from driver’s seat and its 2DFourier space image.
Fig. 8 Variation with time of the power of analysed frequency ofintermittent wiper.
Here, power of the analysed frequency in each condi-tion and time is defined as Ps(t). Power of the analysedfrequency with the best view in each precipitation amountas Ps min, and power of the analysed frequency with theworst view when the front glass is covered with raindropsas Ps max. Wiping rate WP(t) affected by spatial frequency isdefined as in the following formula.
WP(t) =Ps max − Ps(t)Ps max − Ps min
(4)
We calculated wiping rate by the spatial frequency ofall experimental conditions by this formula. Figure 9 showsaverage of the wiping rate by spatial frequency under all ex-perimental conditions. It indicates general decrease of wip-ing rate as precipitation amount increases.
However, in medium rain, there was not much changein time. Moreover, wiping rates of the drizzle rain andthe medium rain did not have a big difference, though theamount of rainfall of the medium rain was larger than thatof the drizzle rain. The reason seems to be that very fineraindrops in medium rain clouded the whole view as in a

1720IEICE TRANS. ELECTRON., VOL.E95–C, NO.11 NOVEMBER 2012
Fig. 9 Average of wiping rate under all experimental conditions (spatialfrequency).
Fig. 10 Pair of images of forward view from driver’s seat and its contrastimage.
fog, which caused little change in the spatial frequency ofthe background board.
4.2.2 Analysis on Contrast
Figure 10 shows the sample of analytical image. Becausethe background board has a continuous rectangular wavewith horizontal high contrast in a good viewing condition,3 pixels on y and 7 pixels on x neighborhood was taken forcalculation of local contrast. The local area was moved byone pixel, and the contrast of the local area was calculatedin the whole area. When raindrops don’t adhere, the con-trast of the local area has a high value in the whole area be-cause of the striped pattern of the background board. Basedon this high contrast when raindrops don’t adhere, we inte-grated amounts of a decrease in contrast of the local area inthe whole area caused by adhesion of raindrops. We calcu-lated average of the decreased contrast per pixel, and exam-ined its time transition. The decreased contrast is large when
Fig. 11 Variation with time of the decreased contrast of intermittentwiper.
Fig. 12 Average of wiping rate under all experimental conditions(contrast).
raindrops adhere to windshield and the windshield becomescloudy, and visibility on contrast is bad.
Figure 11 shows variations with time (10 sec) of de-creased contrast of intermittent wiper. This result shows de-crease of contrast caused by attached raindrops and recoveryof high contrast due to wiping.
As in the evaluation by spatial frequency, wiping rateWC(t) by contrast is defined as in the following formula.Average contrast in each condition and time frame is rep-resented by C(t), average contrast in the best viewing con-dition in each precipitation amount by Cmax, and averagecontrast in the worst viewing condition by Cmin.
WC(t) =C(t) −Cmin
Cmax − Cmin(5)
We calculated wiping rate by the contrast under all ex-perimental conditions by this formula. Figure 12 shows av-erage of the wiping rate by contrast under all experimen-tal conditions. The result of the wiping rate’s greatly de-creasing in medium rain was shown unlike the result by thespatial frequency. Small raindrops like the fog in mediumrain apparently clouded the whole view to equalize bright-ness more than big raindrops in the heavy rain. As a result,it is thought that the contrast of medium rain decreased asgreatly as the heavy rain, though the amount of rainfall ofthe heavy rain was larger than that of medium rain.

KITAYAMA et al.: METHOD FOR EVALUATING PERFORMANCE OF WIPERS BASED ON VISIBILITY1721
Fig. 13 Average of wiping rate under all experimental conditions (spatialfrequency and contrast).
Fig. 14 Average of evaluation value in each image of all subjects(Comparison between youths and seniors).
4.2.3 Overall Evaluation of Visibility
When wiping rate by spatial frequency is compared with thatby contrast, different results were obtained because of dif-ferent raindrop conditions. This suggests that it is necessaryto examine visibility in terms of both spatial frequency andcontrast. If either of WP or WC becomes “0”, overall wipingrate W becomes “0”, which means the “unable to see”.
Therefore, W is defined as in the following formula ofmultiplication, using wiping rates by both spatial frequencyand contrast.
W = WP ×WC (6)
Figure 13 is a graph of overall wiping rate under allconditions. The result showed that visibility decreased asprecipitation amount increased.
4.2.4 Comparison with Result of Questionnaire
Figure 14 shows average of evaluation value in each imageof all subjects. Image numbers of X axis of the graph wereassigned to each image used to questionnaire. The largerthe image number is, the more raindrops are included in theimage. All subjects wanted to move the wiper as the amount
Fig. 15 Comparison between result of analysis and result ofquestionnaire.
of raindrops increases. And, there was a great divergencein the result among seniors and youths. In all conditions,seniors wanted to wipe raindrops at a stage that was earlierthan young people.
Figure 15 shows a result of comparing the result ofevaluation by questionnaire with the result of analysis byproposed method. In the graph, the result of questionnairewas normalized so that “−6” and “+6”of the result of ques-tionnaire may become “1” and “0” respectively. This resultshows that wiping performance can be evaluated with a fairdegree of precision by the proposed method in respect ofvisibility. However, in the situation in which raindrops hadbegan to adhere, there were slightly different between resultof the analysis and result of the questionnaire. It is thoughtto be due to the differences between subject impression andadherence position of raindrops.
Moreover, some difference was always seen in the re-sult of medium rain. It is considered that the decrease in thecontrast by misty rain is perceived as a bigger decrease invisibility on human’s sense.
4.3 Discussion
Spatial frequency and contrast variation of forward visibilitydue to influence of raindrops and wipers were analyzed andwiping rate in each precipitation amount and wiping speedwas calculated and compared. Visibility decreased as pre-cipitation amount increased, and higher visibility was main-tained with low and high speed wipers than with intermit-tent wiping. Therefore, it was confirmed that this methodenables quantitative evaluation of wiper performance.
No significant difference was observed between theanalysis results of low speed wipers and high speed wipersin this experiment. There is a possibility in high speedwiping that the wiping rate may greatly change with muchmore rain such as typhoons. Under normal rain, however,it is assumed that attached raindrops and high speed wipingequally disturb visibility, which means that it is highly pos-sible that enough visibility can be maintained by low speedwiping.
In order to find the best wiping speed for good visibil-ity, it is necessary to include decrease in visibility by motion
1722IEICE TRANS. ELECTRON., VOL.E95–C, NO.11 NOVEMBER 2012
of wipers in the evaluation. In this study, high frequency fac-tor of wipers when they momentarily stop in repeating mo-tion appeared as instantaneous rise in output and it affectedthe evaluation result. On the other hand, there was no bigdifference caused by motion of wipers in contrast. The mainreason for this was that it was an evaluation of the wholeview. The decrease in visibility by the motion of wipers ispartial. Therefore, evaluation of location-dependent partialvisibility is needed for the evaluation of visibility includingthe motion of wipers. Quantitative evaluation including vis-ibility decrease by motion of wipers, as well as evaluationmethod of location-dependent partial visibility, is worth fur-ther research.
5. Conclusion
This study proposed a quantitative evaluation method ofwiper performance under raining condition based on visi-bility. The method focuses on such two visual features asspatial frequency and contrast. In the proposed evaluationsystem of wiper performance, a background board was setin front of a test vehicle in the laboratory, movies of forwardviews while operating wipers in rain were taken, and theywere analyzed by image processing. Precipitation amountand wiping speed in the laboratory were used as parameterswhen movies were taken. Variations in spatial frequencyand contrast of the obtained images were analyzed and wip-ing rate was defined and calculated. We questioned con-cerning visibility, and compared the result with the definedwiping rate. As a result, it was confirmed that quantifica-tion of visibility that changes with precipitation amount andwiping speed is possible and that the proposed evaluationmethod in addition to the traditional qualitative method wasuseful.
Some further research issues are to find the best wip-ing speed, development of an evaluation method to examinedifferent wiper performance due to kinds and deteriorationlevel of wipers, and so on. In addition, we would like topropose an evaluation method considering visual functionsof not only general but also elderly drivers. We hope to findsolutions for these issues and to establish a practical evalua-tion system of wiper performance.
References
[1] JSAE: Handbook of Automotive Engineers, chapter of design andbody, pp.157–161, 2004. (in Japanese)
[2] T. Yano and T. Sakurai, “Testing and measurement method of visibil-ity performance,” J. JSAE, vol.48, no.3, pp.37–42, 1994. (in Japanese)
[3] R. Suzuki and K. Yasuda, “Chatter vibrations of an automotive wiper:1st report, modeling of a one arm wiper and the vibration character-istics,” Trans. Jpn. Soc. Mech. Eng., vol.66, no.641, pp.31–37, 2000.(in Japanese)
[4] R. Suzuki and K. Yasuda, “Chatter vibrations of an automotive wiper:2nd report, quenching of chatter vibrations by harmonic excitationnormal to sliding surface,” Trans. Jpn. Soc. Mech. Eng., vol.66,no.644, pp.1110–1115, 2000. (in Japanese)
[5] Y. Yukiho, Y. Ohashi, M. Ishikawa, I. Teshirogi, M. Sakakibara, andA. Aoki, “Windshield wiper motor noise reduction,” J. JSAE, vol.51,
no.2, pp.24–29, 1997. (in Japanese)[6] S. Okura, T. Oya, and S. Shimizu, “Complete 3D dynamic analysis of
blade reversal behavior in a windshield wiper system,” Trans. JSAE,vol.34, no.4, pp.131–138, 2003. (in Japanese)
[7] S. Okura, T. Oya, and S. Shimizu, “Optimum design of windshieldwiper blade for vehicle using nonlinear programing,” Trans. JSAE,vol.35, no.2, pp.159–165, 2004. (in Japanese)
[8] K. Kaminaga, Y. Hurukori, T. Komoriya, and K. Takada, “Study ofCAE application for developments of wiper and washer performance,”Subaru Technical Review, no.30, pp.205–209, 2003. (in Japanese)
[9] JIS R 3212, “Testing method of safety windshield of vehicle,” 1998.(in Japanese)
Takashi Kitayama received the B.E. andM.E. degrees in Department of InformationEngineering from Meijo University, Nagoya,Japan, in 2008 and 2010, and he has now en-gaged in the research on the performance evalu-ation of the wiper in the postgraduate course inthe postgraduate course of Science and Technol-ogy in Meijo University, Nagoya, Japan.
Mikiko Kawasumi received the B.S. degreein Mathematics from Tsuda College in 1988and Ph.D. degree from Interdisciplinary Grad-uate School of Science and Engineering, TokyoInstitute of Technology in 2008. She joined Toy-ota Central Research and Development Labo-ratories, Inc. in 1988 and has been engaged inthe research and development of color vision forindustrial inspection and design of the vehicle.She became a full-time lecturer at the Facultyof Culture and Creativity, Aichi Shukutoku Uni-
versity in 2000, an associate professor in 2002 and a professor in 2009. In2011 she was transferred to Faculty of Science and Technology, Meijo Uni-versity as an associate professor. Currently, she is studying on informationdesign methods based on human feeling.
Hatsuo Yamasaki received the B.E. de-gree in electrical engineering from Meijo Uni-versity, in 1971, and the Dr. Eng. degree in In-formation System Engineering from Meijo Uni-versity, in 2006. Since 1971, he worked withthe computer room. Since 1984, he has beenwith Graduate School of Science and Technol-ogy from Meijo University, as an Assistant, anda Lecturer. Since 2003, he has been with theCenter for Computers and Information Technol-ogy, Meijo university, as an Associate Professor,
and Professor. His research interests and activities include the human in-terface of the vehicle (Display Method of In-vehicle Display System Basedon Reduction in aged Visual or Auditory Function), Information Educationand e-Learning. He is a member of IEEJ, JSAE, JSiSE, JSET and etc.
KITAYAMA et al.: METHOD FOR EVALUATING PERFORMANCE OF WIPERS BASED ON VISIBILITY1723
Tomoaki Nakano received the B.E., M.E.degree in Electrical and Electronic Engineer-ing from Nagoya University, Nagoya, Japan,in 1980 and 1982, and 1990, respectively. Hejoined Toyota Central Research and Develop-ment Laboratories, Inc., Aichi-ken, Japan, in1982. Since then, he has been engaged in theresearch and development of machine vision forindustrial inspection and driver assist and humaninterface on the vehicle. He became an Profes-sor of Meijo University, Nagoya, Japan. Cur-
rently, he is working on a display method and a warning method for elderwhile driving.
Shin Yamamoto received the B.E. degreein Electrical Engineering from Gifu University,Gifu, Japan, in 1965 and the D.E. degree inElectrical Engineering from Nagoya University,Nagoya, Japan in 1984, respectively. He joinedToyota Central Research and Development Lab-oratories, Inc., Aichi-ken, Japan, in 1965. Sincethen, he has been engaged in research and devel-opment of machine vision for FA and ITS sys-tem. Since 1998, he has been a Professor in theInformation Science Department, Meijo Univer-
sity, Nagoya, Japan. His current interests include human-machine interfacein automobiles.
Muneo Yamada received the B.E. degreeand the M.E. degree from Meijo University, Na-goya, Japan in 1989 and 1997 respectively, andthe Ph.D. degree from the Aichi Prifectural Uni-versity, Japan in 2006. From 1990 to 2007 hejoined Nagoya Electric Works Co., Ltd. Since2008, he has been an Associate Professor of theDepartment of Information Engineering, Fac-ulty of Science and Technology, Meijo Univer-sity, Nagoya, Japan. His research interest in-cludes image processing and image understand-
ing on intelligent transportation system. He is a member of IPSJ, IEEJ,JNNS and JSAP.
Yuta Doi ASMO Co., Ltd. engineer of de-velopment dept from 2006. He has researchedand developed wiper-system products for auto-motive. He is a member of JSAE.