Embed Size (px)
Citation preview
*For correspondence:
[email protected] (YBL);
[email protected] (TM);
[email protected] (AMW)
†These authors contributed
equally to this work
Competing interest: See
page 11
Funding: See page 11
Received: 24 October 2017
Accepted: 12 March 2018
Published: 13 March 2018
Reviewing editor: Arup K
Chakraborty, Massachusetts
Institute of Technology, United
States
Copyright Pogorelyy et al. This
article is distributed under the
terms of the Creative Commons
Attribution License, which
permits unrestricted use and
redistribution provided that the
original author and source are
credited.
Method for identification of condition-associated public antigen receptorsequencesMikhail V Pogorelyy1, Anastasia A Minervina1, Dmitriy M Chudakov1,2,3,Ilgar Z Mamedov1, Yuri B Lebedev1,4†*, Thierry Mora5†*,Aleksandra M Walczak6†*
1Department of Genomics of Adaptive Immunity, Shemyakin-Ovchinnikov Instituteof Bioorganic Chemistry of the Russian Academy of Sciences, Moscow, Russia;2Center for Data-Intensive Biomedicine and Biotechnology, Skolkovo Institute ofScience and Technology, Moscow, Russia; 3Central European Institute ofTechnology, Brno, Czech republic; 4Biological Faculty, Moscow State University,Moscow, Russia; 5Laboratoire de Physique Statistique, CNRS, Sorbonne University,Paris-Diderot University, Ecole Normale Superieure, Paris, France; 6Laboratoire dePhysique Theorique, CNRS, Sorbonne University, Ecole Normale Superieure, Paris,France
Abstract Diverse repertoires of hypervariable immunoglobulin receptors (TCR and BCR)
recognize antigens in the adaptive immune system. The development of immunoglobulin receptor
repertoire sequencing methods makes it possible to perform repertoire-wide disease association
studies of antigen receptor sequences. We developed a statistical framework for associating
receptors to disease from only a small cohort of patients, with no need for a control cohort. Our
method successfully identifies previously validated Cytomegalovirus and type one diabetes
responsive TCRb sequences .
DOI: https://doi.org/10.7554/eLife.33050.001
IntroductionT-cell receptors (TCR) and B-cell receptors (BCR) are hypervariable immunoglobulins that play a key
role in recognizing antigens in the vertebrate immune system. TCR and BCR are formed in the sto-
chastic process of V(D)J recombination, creating a diverse sequence repertoire. These receptors con-
sist of two hypervariable chains, the a and b chains in the case of TCR. Progress in high throughput
sequencing now allows for deep profiling of TCRa and TCRb chain repertoires, by establishing a
near-complete list of unique receptor chain sequences, or ‘clonotypes’, present in a sample. Most
sequencing data available correspond to TCRb only, but the same principles discussed below apply
to TCRa repertoires, or to paired ab repertoires.
Comparison of sequenced repertoires has revealed that in any pair of individuals, large numbers
of TCRb sequences have the same amino acid sequence (Venturi et al., 2011). Several mechanisms
leading to the repertoire overlap have been identified so far. The first mechanism is convergent
recombination. Due to biases in V(D)J recombination process, the probability of generation of some
TCRb sequences is very high, making them appear in almost every individual multiple times and
repeatedly sampled in repertoire profiling experiments (Britanova et al., 2014). This sharing does
not result from a common specificity or function of T-cells corresponding to the shared TCRb clono-
types, and may in fact correspond to cells from the naive compartment in both donors
Pogorelyy et al. eLife 2018;7:e33050. DOI: https://doi.org/10.7554/eLife.33050 1 of 13
TOOLS AND RESOURCES
(Quigley et al., 2010), or from functionally distinct subsets such as CD4 and CD8 T-cells. The second
possible reason for TCR sequence sharing is specific to identical twins, who may share T cell clones
as a consequence of cord blood exchange in utero via a shared placenta (Pogorelyy et al., 2017).
Note that in that scenario both the b and a chains are shared together. The third and most interest-
ing mechanism for sharing the sequence of either the b or a or both chains is convergent selection
in response to a common antigen. From functional studies, such as sequencing of MHC-multimer
specific T-cells, it is known that the antigen-specific repertoire is often biased, and the same anti-
gen-specific TCR b or a chain sequences can be found in different individuals (Miles et al., 2011;
Dash et al., 2017; Glanville et al., 2017).
Reproducibility of a portion of the antigen-specific T-cell repertoire in different patients creates
an opportunity for disease association studies using TCRb repertoire datasets (Faham et al., 2017;
Emerson et al., 2017). These studies analyse the TCRb sequence overlap in large cohorts of healthy
controls and patients to identify shared sequences overrepresented in the patient cohort. Here we
propose a novel computational method to identify clonotypes which are likely to be shared because
of selection for their response to a common antigen, instead of convergent recombination. Our
approach is based on a mechanistic model of TCR recombination and is applicable to small cohorts
of patients, without the need for a healthy control cohort.
ResultsAs a proof of concept, we applied our method to two large publicly available TCRb datasets from
Cytomegalovirus (CMV)-positive (Emerson et al., 2017) and type one diabetes (T1D) (Seay et al.,
2016) patients. In both studies the authors found shared public TCRb clonotypes that are specific to
CMV-peptides or self-peptides, respectively. Specificity of these clonotypes was defined using MHC-
multimers. We show that TCRb chain sequences functionally associated with CMV and T1D in these
studies are identified as outliers by our method.
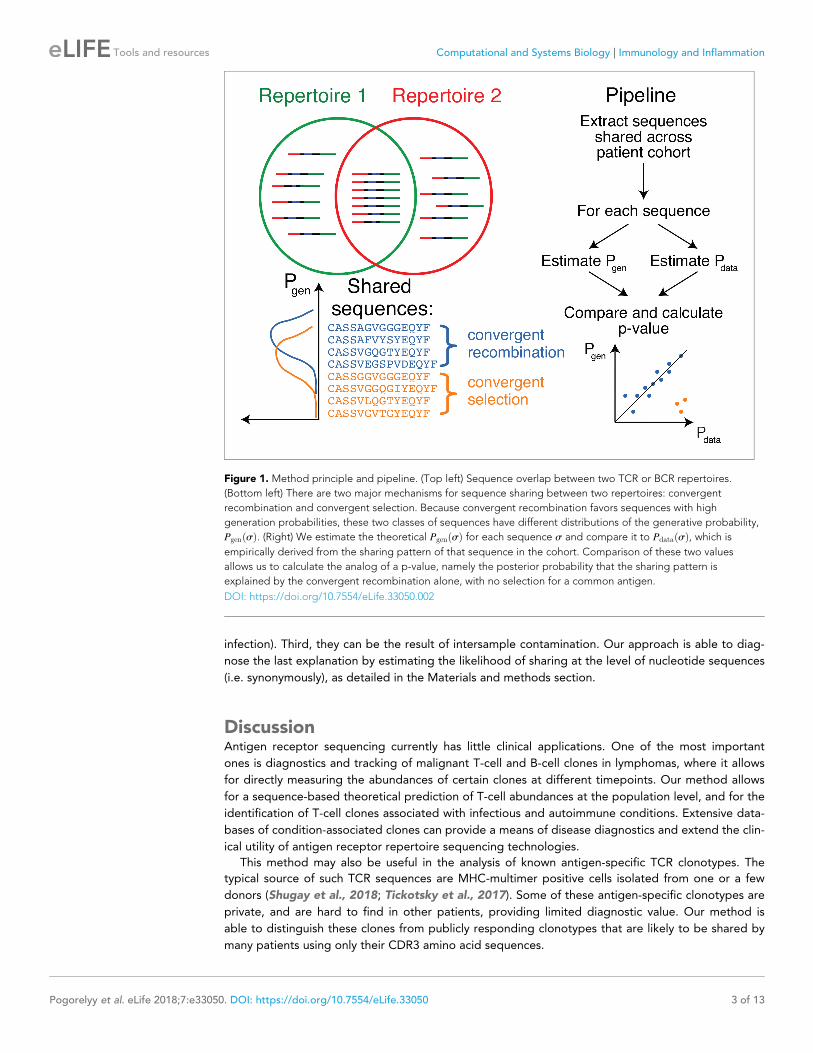
The main ingredient of our approach is to estimate the probability of generation of shared clono-
types, and to use this probability to determine the source of sharing (see Figure 1). Due to the lim-
ited sampling depth of any TCR sequencing experiment, chances to sample the same TCRb
clonotype twice are low, unless this clonotype is easy to generate convergently, with many indepen-
dent generation events with the same TCRb amino acid sequence in each individual (convergent
recombination), or if corresponding T-cell clone underwent clonal expansion, making its concentra-
tion in blood high (convergent selection). Thus, we reasoned that convergently selected clonotypes
should have a lower generative probability than typical convergently recombined clonotypes. To test
this, we estimated the generative probability of the TCRb’s Complementarity Determining Region 3
(CDR3) amino-acid sequences that were shared between several patients. Since no algorithm exists
that can compute this generative probability directly, our method relies on the random generation
and translation of massive numbers of TCR nucleotide sequences using a mechanistic statistical
model of V(D)J recombination (Murugan et al., 2012), as can be easily performed for example using
the IGoR software (Marcou et al., 2017).
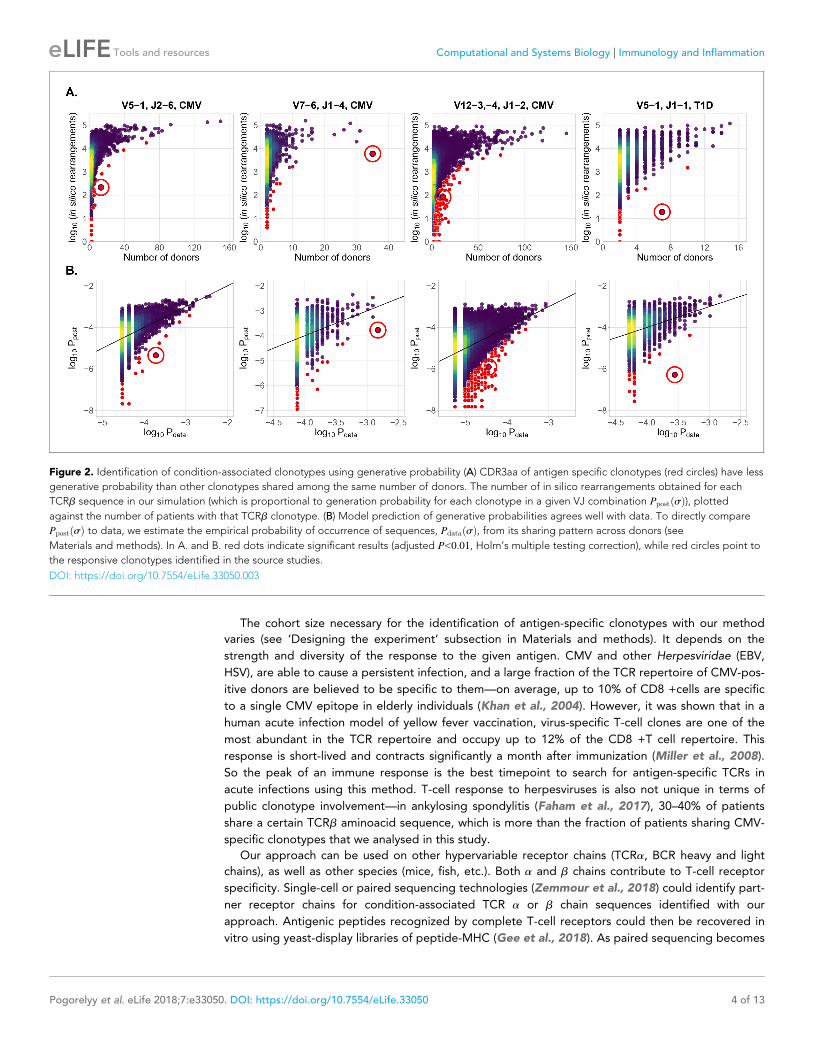
In Figure 2A we plot for each clonotype the number of donors sharing that clonotype against its
generation probability. Disease-specific TCRb variants validated by functional tests in source studies
are circled in red. Note that validated disease-specific TCRb sequences have a much lower genera-
tion probability than the typical sequences shared by the same number of donors. We developed a
method of axis transformation (see Materials and methods) to compare the model prediction with
data values on the same scale (Figure 2B), so that outliers can be easily identified by their distance
to identity line. Our method can be used to narrow down the potential candidates for further experi-
mental validation of responsive receptors. Additional information, like the expansion of the identi-
fied TCRb clonotype in the inflammation site, the presence of the same clonotype in the repertoire
of activated or memory T-cells, or absence in a cohort of healthy controls, could provide additional
evidence for functional association of identified candidates with a given condition.
Our method also identifies other significant outliers than reported in the source studies (shown in
red, and obtained after multiple-test correction – see Materials and methods), which may have three
possible origins. First, they may be associated with the condition, but were missed by the source
studies. Second, they may be due to other factors shared by the patients, such as features involved
in thymic or peripheral selection, or reactivity to other common conditions than CMV (e.g. influenza
Pogorelyy et al. eLife 2018;7:e33050. DOI: https://doi.org/10.7554/eLife.33050 2 of 13
Tools and resources Computational and Systems Biology Immunology and Inflammation
infection). Third, they can be the result of intersample contamination. Our approach is able to diag-
nose the last explanation by estimating the likelihood of sharing at the level of nucleotide sequences
(i.e. synonymously), as detailed in the Materials and methods section.
DiscussionAntigen receptor sequencing currently has little clinical applications. One of the most important
ones is diagnostics and tracking of malignant T-cell and B-cell clones in lymphomas, where it allows
for directly measuring the abundances of certain clones at different timepoints. Our method allows
for a sequence-based theoretical prediction of T-cell abundances at the population level, and for the
identification of T-cell clones associated with infectious and autoimmune conditions. Extensive data-
bases of condition-associated clones can provide a means of disease diagnostics and extend the clin-
ical utility of antigen receptor repertoire sequencing technologies.
This method may also be useful in the analysis of known antigen-specific TCR clonotypes. The
typical source of such TCR sequences are MHC-multimer positive cells isolated from one or a few
donors (Shugay et al., 2018; Tickotsky et al., 2017). Some of these antigen-specific clonotypes are
private, and are hard to find in other patients, providing limited diagnostic value. Our method is
able to distinguish these clones from publicly responding clonotypes that are likely to be shared by
many patients using only their CDR3 amino acid sequences.
Figure 1. Method principle and pipeline. (Top left) Sequence overlap between two TCR or BCR repertoires.
(Bottom left) There are two major mechanisms for sequence sharing between two repertoires: convergent
recombination and convergent selection. Because convergent recombination favors sequences with high
generation probabilities, these two classes of sequences have different distributions of the generative probability,
PgenðsÞ. (Right) We estimate the theoretical PgenðsÞ for each sequence s and compare it to PdataðsÞ, which is
empirically derived from the sharing pattern of that sequence in the cohort. Comparison of these two values
allows us to calculate the analog of a p-value, namely the posterior probability that the sharing pattern is
explained by the convergent recombination alone, with no selection for a common antigen.
DOI: https://doi.org/10.7554/eLife.33050.002
Pogorelyy et al. eLife 2018;7:e33050. DOI: https://doi.org/10.7554/eLife.33050 3 of 13
Tools and resources Computational and Systems Biology Immunology and Inflammation
The cohort size necessary for the identification of antigen-specific clonotypes with our method
varies (see ‘Designing the experiment’ subsection in Materials and methods). It depends on the
strength and diversity of the response to the given antigen. CMV and other Herpesviridae (EBV,
HSV), are able to cause a persistent infection, and a large fraction of the TCR repertoire of CMV-pos-
itive donors are believed to be specific to them—on average, up to 10% of CD8 +cells are specific
to a single CMV epitope in elderly individuals (Khan et al., 2004). However, it was shown that in a
human acute infection model of yellow fever vaccination, virus-specific T-cell clones are one of the
most abundant in the TCR repertoire and occupy up to 12% of the CD8 +T cell repertoire. This
response is short-lived and contracts significantly a month after immunization (Miller et al., 2008).
So the peak of an immune response is the best timepoint to search for antigen-specific TCRs in
acute infections using this method. T-cell response to herpesviruses is also not unique in terms of
public clonotype involvement—in ankylosing spondylitis (Faham et al., 2017), 30–40% of patients
share a certain TCRb aminoacid sequence, which is more than the fraction of patients sharing CMV-
specific clonotypes that we analysed in this study.
Our approach can be used on other hypervariable receptor chains (TCRa, BCR heavy and light
chains), as well as other species (mice, fish, etc.). Both a and b chains contribute to T-cell receptor
specificity. Single-cell or paired sequencing technologies (Zemmour et al., 2018) could identify part-
ner receptor chains for condition-associated TCR a or b chain sequences identified with our
approach. Antigenic peptides recognized by complete T-cell receptors could then be recovered in
vitro using yeast-display libraries of peptide-MHC (Gee et al., 2018). As paired sequencing becomes
Figure 2. Identification of condition-associated clonotypes using generative probability (A) CDR3aa of antigen specific clonotypes (red circles) have less
generative probability than other clonotypes shared among the same number of donors. The number of in silico rearrangements obtained for each
TCRb sequence in our simulation (which is proportional to generation probability for each clonotype in a given VJ combination PpostðsÞ), plotted
against the number of patients with that TCRb clonotype. (B) Model prediction of generative probabilities agrees well with data. To directly compare
PpostðsÞ to data, we estimate the empirical probability of occurrence of sequences, PdataðsÞ, from its sharing pattern across donors (see
Materials and methods). In A. and B. red dots indicate significant results (adjusted P<0:01, Holm’s multiple testing correction), while red circles point to
the responsive clonotypes identified in the source studies.
DOI: https://doi.org/10.7554/eLife.33050.003
Pogorelyy et al. eLife 2018;7:e33050. DOI: https://doi.org/10.7554/eLife.33050 4 of 13
Tools and resources Computational and Systems Biology Immunology and Inflammation
more widespread, our method can be extended to the analysis of full paired TCR by applying the
exact same analysis using the joint recombination probability of ab clonotypes.
Recent advances in computational methods allow us to extract TCR repertoires from existing
RNA-Seq data (Bolotin et al., 2017; Brown et al., 2015). Huge numbers of available RNA-Seq data-
sets from patients with various conditions can be used for analysis and identification of novel virus,
cancer, and self reactive TCR variants using our method. The more immunoglobulin receptors with
known specificity are found using this type of association mapping, the more clinically relevant infor-
mation can be extracted from immunoglobulin repertoire data.
Materials and methods
Statistical analysisProblem formulationOur framework is applicable to analyze the outcome of a next generation sequencing experiment
probing the immune receptor repertoires of n individuals with a given condition, for example CMV
or Type one diabetes. We denote by Mi the number of unique amino acid TCR sequences in patient
i, i ¼ 1; . . . ;N. For a given TCR amino acid sequence s, we set xi ¼ 1 to indicate that s is present in
patient i’s repertoire, and xi ¼ 0 otherwise. For a given shared sequence s, we want to know how
likely its sharing pattern is under the null hypothesis of convergent recombination, correcting for the
donors’ different sampling depths. In other words, is s overrepresented in the population of inter-
est? If s is significantly overrepresented, we also want to quantify the size of this effect.
OverviewUnder the null hypothesis, the presence of s in a certain number of donors is explained by indepen-
dent convergent V(D)J recombination events in each donor. Given the total number of recombina-
tion events that led to the sequenced sample of donor i, Ni, the presence of given amino acid
sequence s in donor is Bernoulli distributed with probability
pi ¼ xih i ¼ 1�Ppost sð Þ� �Ni ; (1)
PpostðsÞ ¼ PgenðsÞ�Q; (2)
where PpostðsÞ is the model probability that a recombined product found in a blood sample has
sequence s under the null hypothesis. It is formed by the product of PgenðsÞ, the probability to gener-
ate the sequence s, estimated using a V(D)J recombination model (see the following subsection), and
Q, a constant correction factor accounting for thymic selection (see Estimation of the correction factor
Q subsection). The number of independent recombination events Ni leading to the observed unique
sequences in a sample i is unknown, because of convergent recombination events within the sample,
but it can be estimated from the number of unique sequences Mi, using the model distribution Ppost
(see Estimation of Ni subsection).
We also calculate the posterior distribution of PdataðsÞ, corresponding to the empirical counterpart
of PpostðsÞ in the cohort, inferred from the sharing pattern of s across donors. We use information
about the presence of s in our donors, x1; . . . ; xn and the sequencing depth for each donor, N1; . . . ;Nn
(see Estimation of PdataðsÞ subsubsection), yielding the posterior density: �ðPdatajx1; . . . ; xNÞ.
Finally, we estimate the probability, given the observations, that the true value of Pdata is smaller
than the theoretical value Ppost predicted using V(D)J recombination model, analogous to a p-value
and used to identify significant effects:
PðPpost>PdataÞ ¼
Z Ppost
0
�ðPdatajx1; . . . ;xnÞdPdata: (3)
To estimate the effect size qðsÞ we compare Pdata to Ppost,
qðsÞ ¼PdataðsÞ
PpostðsÞ: (4)
Pogorelyy et al. eLife 2018;7:e33050. DOI: https://doi.org/10.7554/eLife.33050 5 of 13
Tools and resources Computational and Systems Biology Immunology and Inflammation
Estimation of Pgen, the probability of generation of a TCR CDR3 amino acidsequenceTo procedure outlined above requires to calculate PgenðsÞ, the probability to generate a given CDR3
amino acid sequence. Methods exist to calculate the probability of TCR and BCR nucleotide sequen-
ces from a given recombination model (Murugan et al., 2012; Marcou et al., 2017), but are imprac-
tical to calculate the probability of amino acid sequences, because of the large number of codon
combinations that can lead to the same amino acid sequence,QL
a¼1ncodonsðsðaÞÞ, where L is the
sequence length, and ncodonsðtÞ the number of codons coding for amino acid t. The number is about
1:4� 107 for a typical CDR3 length of 15 amino acid.
Instead, we estimated PgenðsÞ using a simple Monte-Carlo approach. We randomly generated a
massive number (Nsim ¼ 2� 109) of recombination scenarios according to the validated recombina-
tion model (Murugan et al., 2012):
Pbrearr ¼ PðVÞPðD;JÞPðdelV jVÞPðinsVDÞ
�PðdelDl;delDrjDÞPðinsDJÞPðdelJjJÞ:(5)
The resulting sequences were translated, truncated to only keep the CDR3, and counted. PgenðsÞ
was approximated by the fraction of events thus generated that led to sequence s. This approxima-
tion becomes more accurate as Nsim increases, with an error on PgenðsÞ scaling as ðPgenðsÞ=NsimÞ1=2.
Estimation of the correction factor QNot all generated sequences pass selection in the thymus. Pgen systematically underestimates the fre-
quency of recombination event that eventually make it into the observed repertoire. To correct for
this effect, we estimate a correction factor Q, as was suggested in (Elhanati et al., 2014):
PpostðsÞ ¼ PgenðsÞ�Q: (6)
Contrary to (Elhanati et al., 2014), which learned a sequence-specific factor for each individual,
here we assume that all observed sequences passed thymic selection. Q is a normalization factor
accounting for the fact that just a fraction Q�1 of sequences pass thymic selection. This factor is
determined for each VJ-combination as an offset when plotting logPgen against logP�data (see the fol-
lowing subsection for definition of P�data), using least squares fitting.
Estimation of PdataðsÞ, the probability of sequence occurrence in dataThe variable xi indicates the presence or absence of a given TCR amino acid sequence s in the ith
dataset with Ni recombination events per donor. We want to estimate PdataðsÞ, which is a fraction of
recombination events leading to s in the population of interest. According to Bayes’ theorem, for a
given s, the probability density function of Pdata reads:
�ðPdatajx1; . . . ;xnÞ ¼Pðx1; . . . ;xnjPdataÞ�priorðPdataÞ
R
1
0Pðx1; . . . ;xnjPdataÞ�priorðPdataÞdPdata
: (7)
The likelihood is given by a product of Bernouilli probabilities:
Pðx1; . . . ;xnjPdataÞ ¼Y
N
i¼1
1�ð1�PdataÞNi
� �xið1�PdataÞ
Ni� �1�xi
; (8)
and a flat prior �priorðPdataÞ ¼ const is used.
We estimate P�data (shown in Figure 2B) as the maximum of the posterior distribution:
P�data ¼ argmax
Pdata
�ðPdatajx1; . . . ;xnÞ: (9)
Estimation of Ni, the number of recombination eventsThe total number Ni of recombination events in ith dataset is unknown, but we can count the num-
ber of unique CD3 acid sequences Mi observed in the sequencing experiment. For a typical TRB
experiment, convergent recombination is relatively rare and one could use Ni »Mi as an
Pogorelyy et al. eLife 2018;7:e33050. DOI: https://doi.org/10.7554/eLife.33050 6 of 13
Tools and resources Computational and Systems Biology Immunology and Inflammation
approximation. However, for less diverse loci (e.g TRA), or for much higher sequencing depths, one
should correct for convergent recombination, as the the observed number of unique aminoacid
sequences could be much lower than the actual number of corresponding recombination events.
The average number of unique sequences resulting from Ni recombination events is, in theory:
hMii ¼X
s2T
ð1�PpostðsÞÞNi : (10)
where T is the set of sequences that can pass thymic selection. To estimate that number, we gener-
ate a very large number Nsim of recombinations, leading to Nuni unique CDR3 amino acid sequences
for which Pgen is estimated as explained above. We take T to be a random subset of unique sequen-
ces, T � fs1; . . . ;sNunig, of size jTj ¼Nuni=Q, and we apply Equation 8.
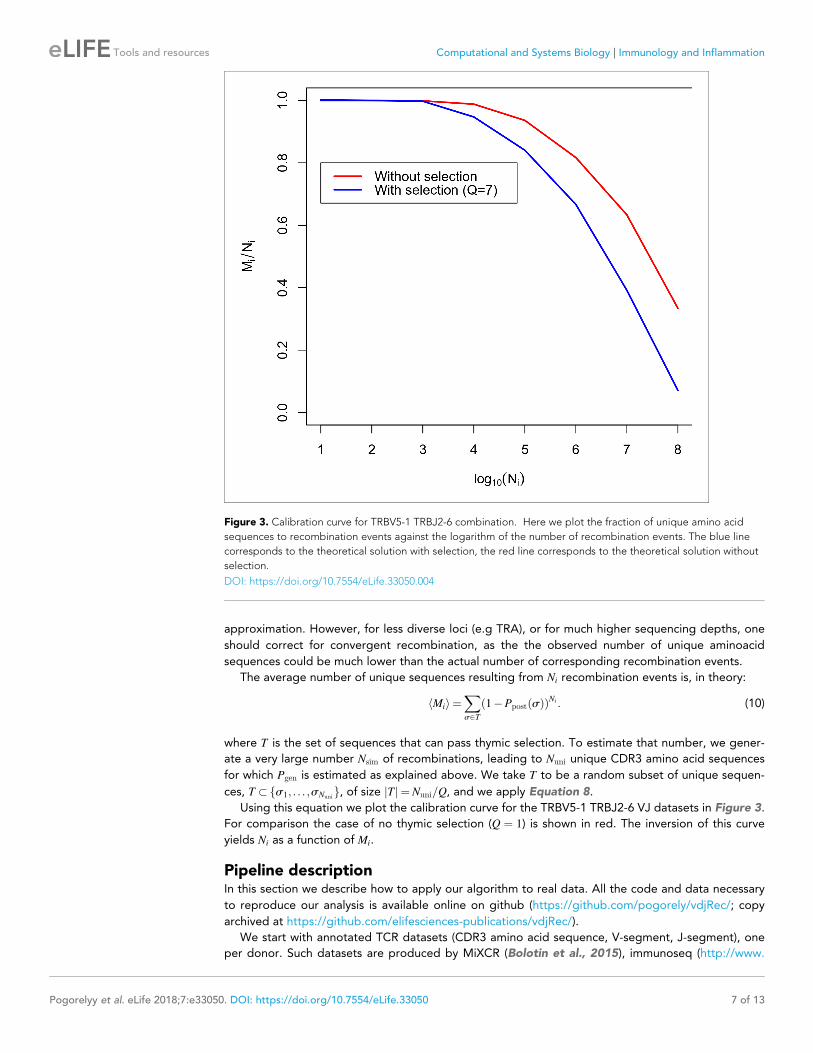
Using this equation we plot the calibration curve for the TRBV5-1 TRBJ2-6 VJ datasets in Figure 3.
For comparison the case of no thymic selection (Q ¼ 1) is shown in red. The inversion of this curve
yields Ni as a function of Mi.
Pipeline descriptionIn this section we describe how to apply our algorithm to real data. All the code and data necessary
to reproduce our analysis is available online on github (https://github.com/pogorely/vdjRec/; copy
archived at https://github.com/elifesciences-publications/vdjRec/).
We start with annotated TCR datasets (CDR3 amino acid sequence, V-segment, J-segment), one
per donor. Such datasets are produced by MiXCR (Bolotin et al., 2015), immunoseq (http://www.
Figure 3. Calibration curve for TRBV5-1 TRBJ2-6 combination. Here we plot the fraction of unique amino acid
sequences to recombination events against the logarithm of the number of recombination events. The blue line
corresponds to the theoretical solution with selection, the red line corresponds to the theoretical solution without
selection.
DOI: https://doi.org/10.7554/eLife.33050.004
Pogorelyy et al. eLife 2018;7:e33050. DOI: https://doi.org/10.7554/eLife.33050 7 of 13
Tools and resources Computational and Systems Biology Immunology and Inflammation
adaptivebiotech.com/immunoseq) and most other software for NGS repertoire data preprocessing.
Data we used was in immunoseq format, publicly available from https://clients.adaptivebiotech.com/
immuneaccess database.
We proceed as follows:
1. Split datasets by VJ combinations. The resulting datasets correspond to lists of unique CDR3amino acid sequences for each donor and VJ combination. All following steps should be doneindependently for each VJ combination.
2. (Optional). Filter out sequences present in only one donor to speed up the downstreamanalysis.
3. Generate a large amount of simulated nucleotide TCR sequences for a given VJ combination.Extract and translate their CDR3, and count how many times each sequence appears in thesimulated set (restricting to sequences actually observed in donors for better efficiency). Theresulting number divided by the total number of simulated sequences is an estimate of Pgen.
4. Estimate P�data for each sequence in the dataset, see Estimation of PdataðsÞ subsection.
5. Using P�data and Pgen, estimate for each VJ combination the normalization Q by minimizing
Pnj¼1
ðlogP�dataðsjÞ � logPgenðsjÞ � logQÞ2, see Estimation of the correction factor Q subsection,
where sj, j ¼ 1; . . . ; n are the shared sequences.6. Calculate Ppost ¼ Q� Pgen. Calculate the p-value (Equation 1) and effect size (Equation 2).
Usage exampleData sourcesData from (Emerson et al., 2017) and (Seay et al., 2016) is publicly available from the immuneac-
cess database: https://clients.adaptivebiotech.com/immuneaccess. For our analysis, we only consid-
ered VJ combinations for which the authors identified condition-associated clonotypes with MHC-
multimer proved specificity. CDR3 aminoacid sequences and V and J segment of these TCR clono-
types are given in Table 1.
Analysis resultsWe applied our pipeline to identify CMV-specific and self-specific TCR sequences listed in Table 1.
For our analysis we used only case cohorts, without controls. For each dataset we followed our pipe-
line described in Pipeline description subsection. We found that sequences reported in the source
studies as being both significantly enriched in the patient cohort, and antigen-specific according to
MHC-multimers, were the most significant in 3 out of 4 datasets (See Table 2). In the remaining
TRBV12 dataset, the sequence of interest was the top 40 most significant out of 27; 699 sequences
present in at least two CMV-positive donors.
Identifying contaminationsIntersample contamination may complicate high-throughput sequencing data analysis in many ways.
It could occur both during library preparation or the sequencing process itself (Sinha et al., 2017).
Contaminations have the same nucleotide and amino acid sequence in all datasets, and so our
method identifies them as outliers, because their sharing cannot be explained by a high recombina-
tion probability.
Our method provides a tool to diagnose contamination. Given an amino-acid sequence present
in many donors, we measure its theoretical nucleotide diversity using the same simulation approach
we used to calculate the generative probability Pgen of the amino acid sequence (see Estimation of
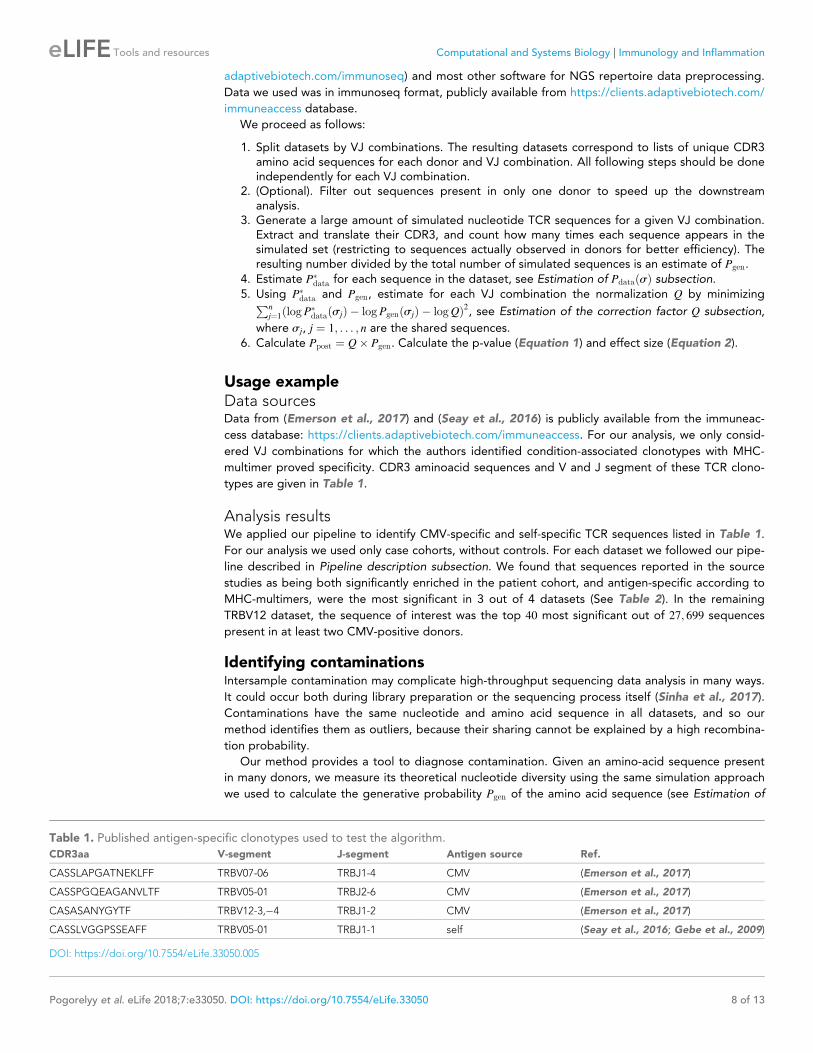
Table 1. Published antigen-specific clonotypes used to test the algorithm.
CDR3aa V-segment J-segment Antigen source Ref.
CASSLAPGATNEKLFF TRBV07-06 TRBJ1-4 CMV (Emerson et al., 2017)
CASSPGQEAGANVLTF TRBV05-01 TRBJ2-6 CMV (Emerson et al., 2017)
CASASANYGYTF TRBV12-3,�4 TRBJ1-2 CMV (Emerson et al., 2017)
CASSLVGGPSSEAFF TRBV05-01 TRBJ1-1 self (Seay et al., 2016; Gebe et al., 2009)
DOI: https://doi.org/10.7554/eLife.33050.005
Pogorelyy et al. eLife 2018;7:e33050. DOI: https://doi.org/10.7554/eLife.33050 8 of 13
Tools and resources Computational and Systems Biology Immunology and Inflammation
Pgen subsection). If the diversity of the simulated nucleotide sequences is much larger than observed
in the data, it is a sign of contamination.
We applied this approach to the CDR3 sequence CASSLVGGPSSEAFF associated to Type one
diabetes, and found 19 recombination events consistent with that amino acid sequence out of our
simulated dataset. We found 18 different nucleotide variants out of the 19 total possible. In contrast,
in the data this clononotype had the same nucleotide variant in all of the eight donors in which it
was present. That variant was absent from the simulated set. A one-sided Fisher exact test gives a
p<10�6 probability of this happening by chance, indicating contamination as a likely source of
sharing.
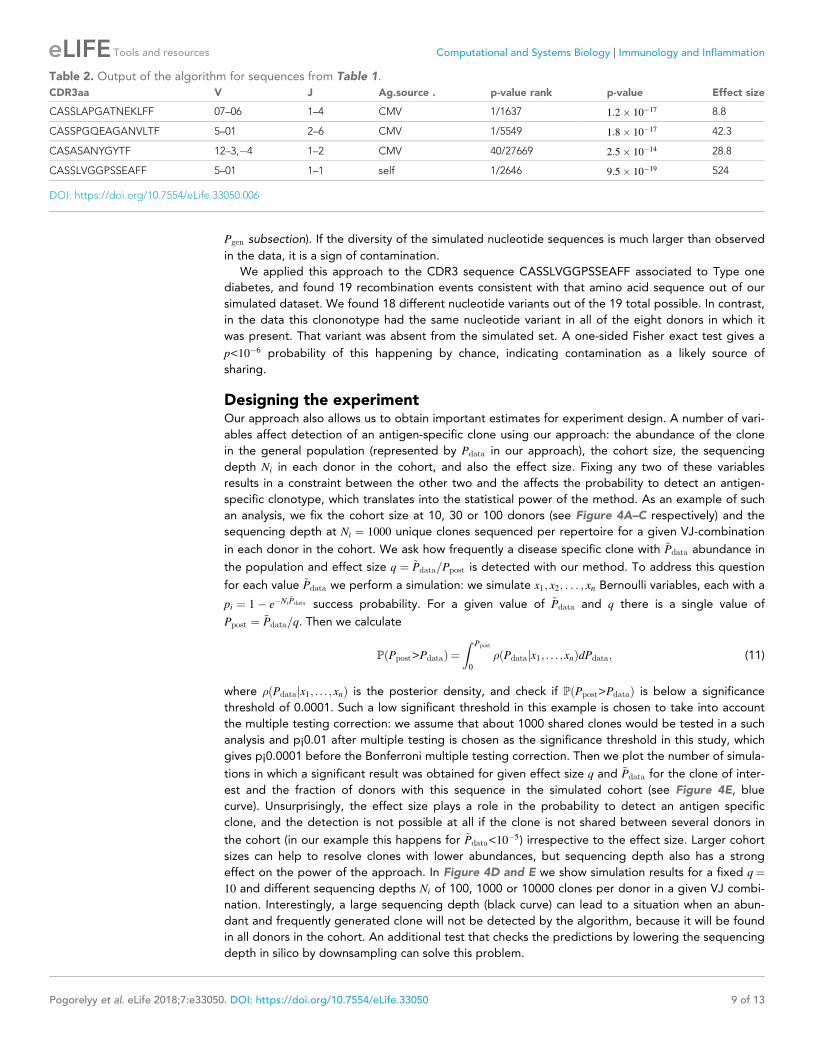
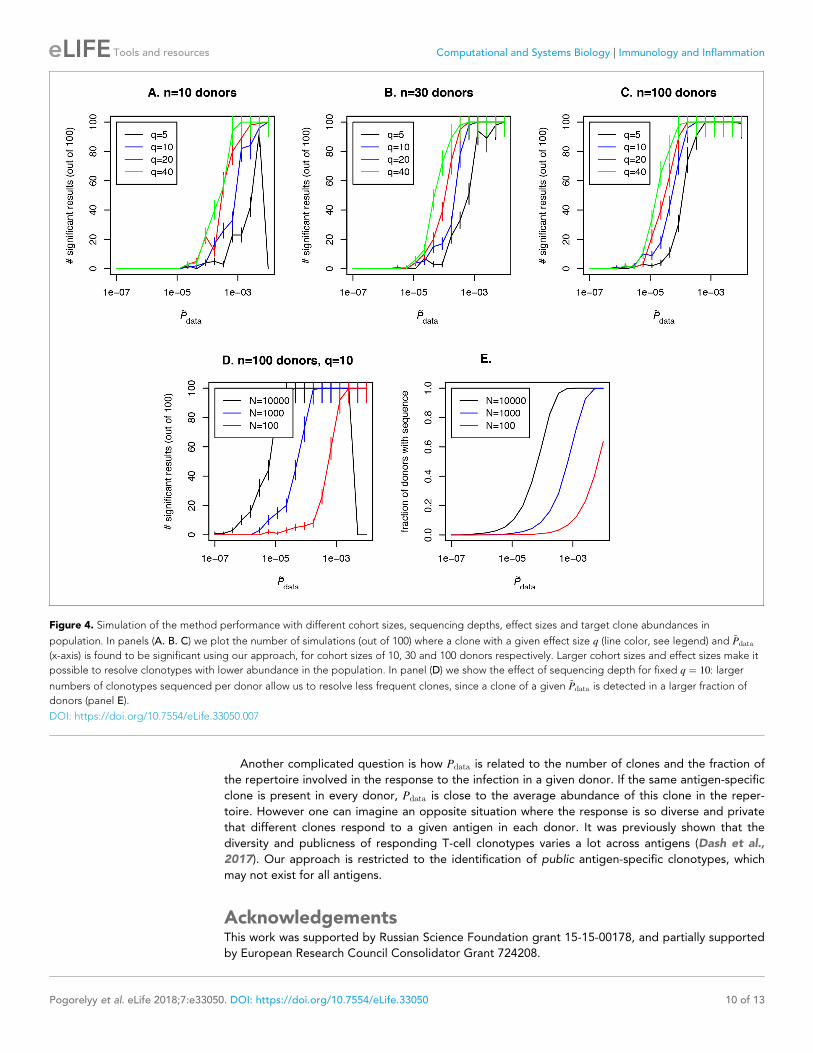
Designing the experimentOur approach also allows us to obtain important estimates for experiment design. A number of vari-
ables affect detection of an antigen-specific clone using our approach: the abundance of the clone
in the general population (represented by Pdata in our approach), the cohort size, the sequencing
depth Ni in each donor in the cohort, and also the effect size. Fixing any two of these variables
results in a constraint between the other two and the affects the probability to detect an antigen-
specific clonotype, which translates into the statistical power of the method. As an example of such
an analysis, we fix the cohort size at 10, 30 or 100 donors (see Figure 4A–C respectively) and the
sequencing depth at Ni ¼ 1000 unique clones sequenced per repertoire for a given VJ-combination
in each donor in the cohort. We ask how frequently a disease specific clone with ~Pdata abundance in
the population and effect size q ¼ ~Pdata=Ppost is detected with our method. To address this question
for each value ~Pdata we perform a simulation: we simulate x1; x2; . . . ; xn Bernoulli variables, each with a
pi ¼ 1� e�Ni~Pdata success probability. For a given value of ~Pdata and q there is a single value of
Ppost ¼ ~Pdata=q. Then we calculate
PðPpost>PdataÞ ¼
Z Ppost
0
�ðPdatajx1; . . . ;xnÞdPdata; (11)
where �ðPdatajx1; . . . ;xnÞ is the posterior density, and check if PðPpost>PdataÞ is below a significance
threshold of 0.0001. Such a low significant threshold in this example is chosen to take into account
the multiple testing correction: we assume that about 1000 shared clones would be tested in a such
analysis and p¡0.01 after multiple testing is chosen as the significance threshold in this study, which
gives p¡0.0001 before the Bonferroni multiple testing correction. Then we plot the number of simula-
tions in which a significant result was obtained for given effect size q and ~Pdata for the clone of inter-
est and the fraction of donors with this sequence in the simulated cohort (see Figure 4E, blue
curve). Unsurprisingly, the effect size plays a role in the probability to detect an antigen specific
clone, and the detection is not possible at all if the clone is not shared between several donors in
the cohort (in our example this happens for ~Pdata<10�5) irrespective to the effect size. Larger cohort
sizes can help to resolve clones with lower abundances, but sequencing depth also has a strong
effect on the power of the approach. In Figure 4D and E we show simulation results for a fixed q¼
10 and different sequencing depths Ni of 100, 1000 or 10000 clones per donor in a given VJ combi-
nation. Interestingly, a large sequencing depth (black curve) can lead to a situation when an abun-
dant and frequently generated clone will not be detected by the algorithm, because it will be found
in all donors in the cohort. An additional test that checks the predictions by lowering the sequencing
depth in silico by downsampling can solve this problem.
Table 2. Output of the algorithm for sequences from Table 1.
CDR3aa V J Ag.source . p-value rank p-value Effect size
CASSLAPGATNEKLFF 07–06 1–4 CMV 1/1637 1:2� 10�17 8.8
CASSPGQEAGANVLTF 5–01 2–6 CMV 1/5549 1:8� 10�17 42.3
CASASANYGYTF 12–3,�4 1–2 CMV 40/27669 2:5� 10�14 28.8
CASSLVGGPSSEAFF 5–01 1–1 self 1/2646 9:5� 10�19 524
DOI: https://doi.org/10.7554/eLife.33050.006
Pogorelyy et al. eLife 2018;7:e33050. DOI: https://doi.org/10.7554/eLife.33050 9 of 13
Tools and resources Computational and Systems Biology Immunology and Inflammation
Another complicated question is how Pdata is related to the number of clones and the fraction of
the repertoire involved in the response to the infection in a given donor. If the same antigen-specific
clone is present in every donor, Pdata is close to the average abundance of this clone in the reper-
toire. However one can imagine an opposite situation where the response is so diverse and private
that different clones respond to a given antigen in each donor. It was previously shown that the
diversity and publicness of responding T-cell clonotypes varies a lot across antigens (Dash et al.,
2017). Our approach is restricted to the identification of public antigen-specific clonotypes, which
may not exist for all antigens.
AcknowledgementsThis work was supported by Russian Science Foundation grant 15-15-00178, and partially supported
by European Research Council Consolidator Grant 724208.
Figure 4. Simulation of the method performance with different cohort sizes, sequencing depths, effect sizes and target clone abundances in
population. In panels (A. B. C) we plot the number of simulations (out of 100) where a clone with a given effect size q (line color, see legend) and ~Pdata
(x-axis) is found to be significant using our approach, for cohort sizes of 10, 30 and 100 donors respectively. Larger cohort sizes and effect sizes make it
possible to resolve clonotypes with lower abundance in the population. In panel (D) we show the effect of sequencing depth for fixed q ¼ 10: larger
numbers of clonotypes sequenced per donor allow us to resolve less frequent clones, since a clone of a given ~Pdata is detected in a larger fraction of
donors (panel E).
DOI: https://doi.org/10.7554/eLife.33050.007
Pogorelyy et al. eLife 2018;7:e33050. DOI: https://doi.org/10.7554/eLife.33050 10 of 13
Tools and resources Computational and Systems Biology Immunology and Inflammation
Additional information
Competing interests
Aleksandra M Walczak: Reviewing editor, eLife. The other authors declare that no competing inter-
ests exist.
Funding
Funder Grant reference number Author
Russian Science Foundation 15-15-00178 Dmitriy M ChudakovIlgar Z MamedovYuri B Lebedev
European Research Council 724208 Aleksandra M Walczak
The funders had no role in study design, data collection and interpretation, or the
decision to submit the work for publication.
Author contributions
Mikhail V Pogorelyy, Conceptualization, Data curation, Software, Formal analysis, Validation, Investi-
gation, Visualization, Methodology, Writing—original draft, Writing—review and editing; Anastasia
A Minervina, Data curation, Software, Investigation; Dmitriy M Chudakov, Ilgar Z Mamedov, Yuri B
Lebedev, Conceptualization, Resources, Supervision, Funding acquisition, Investigation, Methodol-
ogy, Project administration, Writing—review and editing; Thierry Mora, Conceptualization, Resour-
ces, Formal analysis, Supervision, Funding acquisition, Investigation, Methodology, Writing—original
draft, Project administration, Writing—review and editing; Aleksandra M Walczak, Conceptualiza-
tion, Resources, Supervision, Funding acquisition, Investigation, Methodology, Writing—original
draft, Project administration, Writing—review and editing
Author ORCIDs
Mikhail V Pogorelyy http://orcid.org/0000-0003-0773-1204
Dmitriy M Chudakov https://orcid.org/0000-0003-0430-790X
Thierry Mora https://orcid.org/0000-0002-5456-9361
Aleksandra M Walczak http://orcid.org/0000-0002-2686-5702
Decision letter and Author response
Decision letter https://doi.org/10.7554/eLife.33050.014
Author response https://doi.org/10.7554/eLife.33050.015
Additional filesSupplementary files. Transparent reporting form
DOI: https://doi.org/10.7554/eLife.33050.008
Major datasets
The following previously published datasets were used:
Author(s) Year Dataset title Dataset URL
Database, license,and accessibilityinformation
Emerson RO, De-Witt WS, Vignali M,Gravley J, Hu JK,Osborne EJ, Des-marais C, KlingerM, Carlson CS,Hansen JA, RiederM, Robins HS
2017 Immunosequencing identifiessignatures of cytomegalovirusexposure history and HLA-mediated effects on the T cellrepertoire
http://dx.doi.org/10.21417/B7001Z
Publicly available atImmuneAccess.
Pogorelyy et al. eLife 2018;7:e33050. DOI: https://doi.org/10.7554/eLife.33050 11 of 13
Tools and resources Computational and Systems Biology Immunology and Inflammation
Seay HR, Yusko E,Rothweiler SJ,Zhang L, Posgai AL,Campbell-Thomp-son M, Vignali M,Emerson RO, Kad-dis JS, Ko D, Na-kayama M, SmithMJ, Cambier JC,Pugliese A, Atkin-son MA, Robins HS,Brusko TM
2016 Tissue distribution and clonaldiversity of the T and B cellrepertoire in type 1 diabetes
http://doi.org/10.21417/B73S3K
Publicly available atImmuneAccess
ReferencesBolotin DA, Poslavsky S, Davydov AN, Frenkel FE, Fanchi L, Zolotareva OI, Hemmers S, Putintseva EV,Obraztsova AS, Shugay M, Ataullakhanov RI, Rudensky AY, Schumacher TN, Chudakov DM. 2017. Antigenreceptor repertoire profiling from RNA-seq data. Nature Biotechnology 35:908–911. DOI: https://doi.org/10.1038/nbt.3979, PMID: 29020005
Bolotin DA, Poslavsky S, Mitrophanov I, Shugay M, Mamedov IZ, Putintseva EV, Chudakov DM. 2015. MiXCR:software for comprehensive adaptive immunity profiling. Nature Methods 12:380–381. DOI: https://doi.org/10.1038/nmeth.3364, PMID: 25924071
Britanova OV, Putintseva EV, Shugay M, Merzlyak EM, Turchaninova MA, Staroverov DB, Bolotin DA, LukyanovS, Bogdanova EA, Mamedov IZ, Lebedev YB, Chudakov DM. 2014. Age-related decrease in TCR repertoirediversity measured with deep and normalized sequence profiling. The Journal of Immunology 192:2689–2698.DOI: https://doi.org/10.4049/jimmunol.1302064, PMID: 24510963
Brown SD, Raeburn LA, Holt RA. 2015. Profiling tissue-resident T cell repertoires by RNA sequencing. GenomeMedicine 7:125. DOI: https://doi.org/10.1186/s13073-015-0248-x, PMID: 26620832
Dash P, Fiore-Gartland AJ, Hertz T, Wang GC, Sharma S, Souquette A, Crawford JC, Clemens EB, Nguyen THO,Kedzierska K, La Gruta NL, Bradley P, Thomas PG. 2017. Quantifiable predictive features define epitope-specific T cell receptor repertoires. Nature 547:89–93. DOI: https://doi.org/10.1038/nature22383, PMID: 28636592
Elhanati Y, Murugan A, Callan CG, Mora T, Walczak AM. 2014. Quantifying selection in immune receptorrepertoires. PNAS 111:9875–9880. DOI: https://doi.org/10.1073/pnas.1409572111, PMID: 24941953
Emerson RO, DeWitt WS, Vignali M, Gravley J, Hu JK, Osborne EJ, Desmarais C, Klinger M, Carlson CS, HansenJA, Rieder M, Robins HS. 2017. Immunosequencing identifies signatures of cytomegalovirus exposure historyand HLA-mediated effects on the T cell repertoire. Nature Genetics 49:659–665. DOI: https://doi.org/10.1038/ng.3822, PMID: 28369038
Faham M, Carlton V, Moorhead M, Zheng J, Klinger M, Pepin F, Asbury T, Vignali M, Emerson RO, Robins HS,Ireland J, Baechler-Gillespie E, Inman RD. 2017. Discovery of T cell receptor b motifs specific to HLA-B27-positive ankylosing spondylitis by deep repertoire sequence analysis. Arthritis & Rheumatology 69:774–784.DOI: https://doi.org/10.1002/art.40028, PMID: 28002888
Gebe JA, Yue BB, Unrath KA, Falk BA, Nepom GT. 2009. Restricted autoantigen recognition associated withdeletional and adaptive regulatory mechanisms. The Journal of Immunology 183:59–65. DOI: https://doi.org/10.4049/jimmunol.0804046, PMID: 19535636
Gee MH, Han A, Lofgren SM, Beausang JF, Mendoza JL, Birnbaum ME, Bethune MT, Fischer S, Yang X, Gomez-Eerland R, Bingham DB, Sibener LV, Fernandes RA, Velasco A, Baltimore D, Schumacher TN, Khatri P, QuakeSR, Davis MM, Garcia KC. 2018. Antigen identification for orphan T cell receptors expressed on tumor-infiltrating lymphocytes. Cell 172:1–15. DOI: https://doi.org/10.1016/j.cell.2017.11.043, PMID: 29275860
Glanville J, Huang H, Nau A, Hatton O, Wagar LE, Rubelt F, Ji X, Han A, Krams SM, Pettus C, Haas N, ArlehamnCSL, Sette A, Boyd SD, Scriba TJ, Martinez OM, Davis MM. 2017. Identifying specificity groups in the T cellreceptor repertoire. Nature 547:94–98. DOI: https://doi.org/10.1038/nature22976, PMID: 28636589
Khan N, Hislop A, Gudgeon N, Cobbold M, Khanna R, Nayak L, Rickinson AB, Moss PA. 2004. Herpesvirus-specific CD8 T cell immunity in old age: cytomegalovirus impairs the response to a coresident EBV infection.The Journal of Immunology 173:7481–7489. DOI: https://doi.org/10.4049/jimmunol.173.12.7481, PMID: 15585874
Marcou Q, Mora T, Walczak AM. 2017. IGoR: a tool for high-throughput immune repertoire analysis. bioRxiv.https://arxiv.org/abs/1705.08246.
Miles JJ, Douek DC, Price DA. 2011. Bias in the ab T-cell repertoire: implications for disease pathogenesis andvaccination. Immunology and Cell Biology 89:375–387. DOI: https://doi.org/10.1038/icb.2010.139,PMID: 21301479
Miller JD, van der Most RG, Akondy RS, Glidewell JT, Albott S, Masopust D, Murali-Krishna K, Mahar PL,Edupuganti S, Lalor S, Germon S, Del Rio C, Mulligan MJ, Staprans SI, Altman JD, Feinberg MB, Ahmed R.2008. Human effector and memory CD8+ T cell responses to smallpox and yellow fever vaccines. Immunity 28:710–722. DOI: https://doi.org/10.1016/j.immuni.2008.02.020, PMID: 18468462
Pogorelyy et al. eLife 2018;7:e33050. DOI: https://doi.org/10.7554/eLife.33050 12 of 13
Tools and resources Computational and Systems Biology Immunology and Inflammation
Murugan A, Mora T, Walczak AM, Callan CG. 2012. Statistical inference of the generation probability of T-cellreceptors from sequence repertoires. PNAS 109:16161–16166. DOI: https://doi.org/10.1073/pnas.1212755109,PMID: 22988065
Pogorelyy MV, Elhanati Y, Marcou Q, Sycheva AL, Komech EA, Nazarov VI, Britanova OV, Chudakov DM,Mamedov IZ, Lebedev YB, Mora T, Walczak AM. 2017. Persisting fetal clonotypes influence the structure andoverlap of adult human T cell receptor repertoires. PLoS Computational Biology 13:e1005572. DOI: https://doi.org/10.1371/journal.pcbi.1005572, PMID: 28683116
Quigley MF, Greenaway HY, Venturi V, Lindsay R, Quinn KM, Seder RA, Douek DC, Davenport MP, Price DA.2010. Convergent recombination shapes the clonotypic landscape of the naive T-cell repertoire. PNAS 107:19414–19419. DOI: https://doi.org/10.1073/pnas.1010586107, PMID: 20974936
Seay HR, Yusko E, Rothweiler SJ, Zhang L, Posgai AL, Campbell-Thompson M, Vignali M, Emerson RO, KaddisJS, Ko D, Nakayama M, Smith MJ, Cambier JC, Pugliese A, Atkinson MA, Robins HS, Brusko TM. 2016. Tissuedistribution and clonal diversity of the T and B cell repertoire in type 1 diabetes. JCI Insight 1:1–19.DOI: https://doi.org/10.1172/jci.insight.88242
Shugay M, Bagaev DV, Zvyagin IV, Vroomans RM, Crawford JC, Dolton G, Komech EA, Sycheva AL, Koneva AE,Egorov ES, Eliseev AV, Van Dyk E, Dash P, Attaf M, Rius C, Ladell K, McLaren JE, Matthews KK, Clemens EB,Douek DC, et al. 2018. VDJdb: a curated database of T-cell receptor sequences with known antigen specificity.Nucleic Acids Research 46:D419–D427. DOI: https://doi.org/10.1093/nar/gkx760, PMID: 28977646
Sinha R, Stanley G, Gulati GS, Ezran C, Travaglini KJ, Wei E, Chan CKF, Nabhan AN, Su T, Morganti RM, ConleySD, Chaib H, Red-Horse K, Longaker MT, Snyder MP, Krasnow MA, Weissman IL. 2017. Index switching causes“spreading-of-signal” among multiplexed samples in illumina hiseq 4000 dna sequencing. bioRxiv. DOI: https://doi.org/10.1101/125724
Tickotsky N, Sagiv T, Prilusky J, Shifrut E, Friedman N. 2017. McPAS-TCR: a manually curated catalogue ofpathology-associated T cell receptor sequences. Bioinformatics 33:2924–2929. DOI: https://doi.org/10.1093/bioinformatics/btx286, PMID: 28481982
Venturi V, Quigley MF, Greenaway HY, Ng PC, Ende ZS, McIntosh T, Asher TE, Almeida JR, Levy S, Price DA,Davenport MP, Douek DC. 2011. A mechanism for TCR sharing between T cell subsets and individuals revealedby pyrosequencing. The Journal of Immunology 186:4285–4294. DOI: https://doi.org/10.4049/jimmunol.1003898, PMID: 21383244
Zemmour D, Zilionis R, Kiner E, Klein AM, Mathis D, Benoist C. 2018. Single-cell gene expression reveals alandscape of regulatory T cell phenotypes shaped by the TCR. Nature Immunology 19:291–301. DOI: https://doi.org/10.1038/s41590-018-0051-0, PMID: 29434354
Pogorelyy et al. eLife 2018;7:e33050. DOI: https://doi.org/10.7554/eLife.33050 13 of 13
Tools and resources Computational and Systems Biology Immunology and Inflammation