Embed Size (px)
Citation preview
HAL Id: hal-01165279https://hal-mines-albi.archives-ouvertes.fr/hal-01165279
Submitted on 18 Jun 2015
HAL is a multi-disciplinary open accessarchive for the deposit and dissemination of sci-entific research documents, whether they are pub-lished or not. The documents may come fromteaching and research institutions in France orabroad, or from public or private research centers.
L’archive ouverte pluridisciplinaire HAL, estdestinée au dépôt et à la diffusion de documentsscientifiques de niveau recherche, publiés ou non,émanant des établissements d’enseignement et derecherche français ou étrangers, des laboratoirespublics ou privés.
Method for Thermal Design of Paddle Dryers:Application to Municipal Sewage Sludge
Patricia Arlabosse, S Chavez, Didier Lecomte
To cite this version:Patricia Arlabosse, S Chavez, Didier Lecomte. Method for Thermal Design of Paddle Dryers: Applica-tion to Municipal Sewage Sludge. Drying Technology, Taylor & Francis, 2004, 22 (10), pp.2375-2393.�10.1081/LDRT-200040041�. �hal-01165279�

METHOD FOR THERMAL DESIGN OF PADDLE DRYERS:
APPLICATION TO MUNICIPAL SEWAGE SLUDGE
P. Arlabosse, S. Chavez and D. Lecomte
Ecole des Mines d’Albi Carmaux, Laboratoire de Génie des Procédés des Solides Divisés,
UMR 2392, Route de Teillet, 81013 Albi CT Cedex 09, France
ABSTRACT
An experimental methodology was developed to improve the energy design of paddle
dryers for sewage sludges. A laboratory batch dryer with a vertical agitator has been
especially designed and instrumented to determine the heat flux densities. To determine
the drying kinetic and the evaporating flow rates, the specific heat and the total heat of
desorption of the sludge were measured using calorimetric devices. The evaporating
flow rates recorded during the pasty and granular phases were then used in a simple
model of the paddle dryer. The good agreement between the computed drying kinetics
and the experimental ones measured in an industrial paddle dryer shows that the batch
dryer can be used to classify the sludges according to their capacity to be dried in a
paddle dryer.
Key Words: contact drying, mixing, drying kinetic, sludge, on site measurement

INTRODUCTION
Sludge management is an ever-increasing problem due to environmental pollution and energy
consumption that result from progressive generation of industrial and municipal sludge. For example, the
French municipal sludge production was estimated at 850,000 tons of dry matter in 1998, and projected to
some 1,300,000 tons in 2005. Drying is now widely recognized as an efficient means of processing
municipal sewage sludge to a product that can easily be handled, stored and recycled. After drying,
agricultural spreading, landfill and incineration remain available disposal routes. Moreover, the sludge
volume is considerably reduced and, due to long residence time at high temperature in most of the
conventional dryers, the product is pasteurized.
Thermal drying of industrial sludge has been practiced for many decades but the applications to
municipal sludge were rarely reported. In the late 1980s, the manufacturers, who had successfully applied
their technologies in chemical and food industries, tried to transfer existing technologies to sewage
sludge. Nowadays, few companies posess expertise successful experience in thermal processing of
sewage sludge and, among available technologies, paddle dryers are often encountered in France.
Agitation allows to renew the contact surface area between the heated wall and the sludge to keep high
heat transfer coefficient. In spite of a great number of industrial applications, the paddle dryer design still
remains a question of know how rather than scientific knowledge. The final purpose of our researches is
to establish a classification of the sludge according to their capacity to be dried in a paddle dryer but the
aim of the present paper is to show that the scaling up methodology is relevant. This methodology lies on
sludge characterization, on drying experiments performed at the laboratory scale in a batch agitated
reactor, and on drying experiments performed in situ with an industrial Naratherm
paddle dryer. Data
collected at the laboratory scale are then used in a simple model of the paddle dryer.[1]
The comparison
between the drying kinetics determined in the lab scale dryer and the ones measured in situ allows to
evaluate the quality of the scale-up protocol.

EXPERIMENTAL APPARATUS
Batch agitated dryer
The experimental set up is fully described in our previous paper.[2]
Therefore, only the main
characteristics will be described in the present section. The batch dryer capable of processing up to 5 kg
of raw sluge consists of a 0.2m diameter Teflon® cylindrical vessel screwed onto the top of metallic
plates, which simulate the wall of the dryer (S=0.0314m2) and its heating system. The stirring device
consists of three 0.02 m wide and 0.16 m long blades, sloped at 45°, fixed on a vertical shaft. The
distance between the first blade and the dryer wall was set to 0.001 m. Static scrapers are fixed on the
Teflon cell to break up the sludge. A motor supplies a constant rotation speed rpm40 to the stirrer. A
torque meter, which monitors the torque during drying, is incorporated into the stirrer drive. The accuracy
given by the manufacturer (HBM, Mennecy, France) is ±0.01 Nm. This setup operates in a closed drying
loop to control the temperature, velocity and nature of the gaseous environment. For the present study,
flow of superheated steam (1atm, 120°C) was maintained with a velocity less than 0.3 m/s, and the wall
temperature was maintained at 180°C. The whole device lays above a scale. During weight measurement,
the gaseous flow was bypassed, the stirring device stopped and the cell lowered onto the scale, which has
an accuracy of 5 g.
Elementary composition analyzer
The elementary composition was measured with a NA 2100 N/Protein analyzer (Thermoquest, Milan,
Italy). The measurement accuracy was ± 1% for the carbon, hydrogen and nitrogen contents and ± 2% for
the oxygen content. To estimate the organic fraction of the sludge, 20 grams of dry ground sludge were
heated up at 550°C over two hours. Considering that the decomposition of inorganic salts is restricted to

magnesium carbonate at this temperature level and that some of the organic complexes will oxidize only
around 700°C, this method gave a rough estimate of the organic fraction. The measurement accuracy was
± 0.5%.
Calorimeter
The specific heat is an important parameter for sludge processing, not only to calculate the
accumulated energy but also for dry sludge temperature control. Indeed, after a drying process and for
safety reasons, the dry sludge is often cooled down to ambient temperature in a jacketed screw conveyor.
The specific heat of the dry sludge sample was measured using a C80 II calorimeter (Setaram, Caluire,
France). A 5g dry sample was heated from 40°C to 100°C at 0.1°C / min. The dry matter specific heat
was derived from the calorimetric signal. The measure accuracy has been estimated to 5%.
TGA – DSC apparatus
According to Keey [3], the bonding of condensed moisture to the solid is proportional to the difference
between the bound water enthalpy and that of the free water (ΔHv), at the same temperature and total
pressure. This enthalpy difference is called the heat of wetting (ΔHwetting). The heat of wetting includes the
heat of sorption, hydration and solution and is a function of the moisture content.
Reports on direct measurements of the heat of wetting are scarce ([4], [5]). For a well characterized
solid adsorbent, like zeolite or graphite, the value can be theoretically calculated [6] but in the case of
complex heterogeneous solids, like foodstuff or sludge, the value is generally derived from water activity
data using the Clausius-Clapeyron law ([7], [8]).
A thermogravimetric analyzer (TGA) coupled with a differential scanning calorimeter DSC111
(Setaram, Caluire, France) used in isothermal mode enables a direct and continuous measurement of the
total heat of sorption as a function of the moisture content. The total heat of sorption is derived from the
calorimetric signal and the mass loss [9].

LAB SCALE DATA PROCESSING
The drying kinetics were computed from an energy balance rather than determined from the mass
measurements, which are discontinuous. The data processing and the assumptions made are described in
the sections that follow.
Energy balance
As weighting measurement is discontinuous and a lot the drying experiments is disturbed, the
evaporating flow rate .
m is calculated from an energy balance on the product, written as follow:
wettingv
.
effsvfreevssps HHm60
C2TTShSTCmt s
(1)
where the first term corresponds to the energy accumulated in the sludge, is the heat flux density
supplied by conduction at the heated wall of the dryer, hs-v is the heat transfer coefficient between the free
surface of the product in the vessel, Sfree, and the gas, Ceff is the effective mechanical torque, Hv is the
latent heat of vaporization, and Hwetting is the heat of wetting.
The specific heat of the wet sludge, spC , is a function of the moisture content and the temperature. If
the moisture content is known, it can be computed from the specific heat of the water,WpC , and that of
the dry sludge, DMpC , according to equation (2):
TCW1
1TC
W1
W)T,W(C
DMWs ppp
(2)
DMpC is measured with the C80II Calorimeter and the experimental data can be adjusted with a linear
expression, as follows:
TCDMp (3)
where and are two constants.
Once .
m is known, the drying kinetics are computed from equation (4):

dtmm
1WtW
t
0
.
DMinitial (4)
where DMm is the dry mass.
During the experiment, the product and vapor temperatures as well as the effective mechanical torque
are continuously recorded while the rotation speed is known. To compute the evaporating flow rate from
equation (1), it was also necessary to evaluate the heat flux density supplied by the dryer wall, , the heat
transfer coefficient between the product and the vapor, hs-v, and finally the free surface of the product,
Sfree.
Dryer wall heat flux density estimation
The dryer wall and its heating system, reproduced schematically in figure 1, consists of:
a heating device made of ten electrical resistors inserted in metallic plates. Each resistor can supply up
to 250W;
a 0.01 m thick buffer copper plate for temperature homogenization. A temperature sensor, set at 0.001
m from the buffer copper plate front side, is used for thermal regulation;
a 0.01 m thick stainless steel plate, which simulates the wall of the dryer. Four sensors, set at
0.0015 m from the steel plate front side, measure the temperature at different radii (0.015, 0.055,
0.075 and 0.095 m) from the center and one sensor, set at 0.001 m from the steel plate rear side,
measure the temperature at a radius of 0.035 m from the center.
The accuracy of all these thermal sensors with theirs acquisition lines was evaluated at 0.15°C.
The heat flux density exchanged between the stainless steel plate and the product could be
estimated either from the electrical power or from the temperature measurements. In the first case, is
given by the difference between the electrical power P supplied by the resistances, which is measured
during the drying experiment, and the heat losses lostP , estimated from experiments performed with an
empty setup in the same operating conditions.

lostPPS
1 (5)
The parameter can also be estimated by solving the inverse conduction problem in the dryer wall. The
numerical method is extensively described in Fudym et al. [10]. Because of the buffer copper plate, the
rear side temperature of the stainless steel plate is assumed to be homogeneous. On the front side, radial
temperature gradients are quite high due to stirring of the drying material. To take them into account, an
influence area was assigned to each thermocouple set on the front side of the steel plate. This area was
defined by:
2iLi
2iRii lrlrS (6)
where Si is the influence area assigned to the thermocouple located at the radius ri, liR and liL are the
distances, reported in Table 1, between the edges of the ring area and the position of the thermocouple.
The one-dimensional conduction problem is solved in each concentric zone and the heat flux density at
the dryer wall is computed from the heat flux densities i estimated in each zone Si according to:
4
1iii S
S
1 (7)
where 4
iiSS .
Heat transfer coefficient and free surface estimations
Three distinct phases occur during drying [2]. Transitions from the fluid state to the sticky one and
finally to the granular phase, which are evident from the heat flux signal, are better seen the torque
evolution curve (cf. Figure 2). Over first few minutes, the sludge behaves like a viscous fluid and the
contact with the heated wall is rather good. During this first stage, the free surface of the product is almost
equal to the heated surface ( freeS =0.0314 m2) and the heat transfer coefficient vsh between the free
surface freeS of the product and the vapor results from the vapor flow above the product. The magnitude
of vsh was estimated at 7 Wm-2
K-1
from experiments performed with the setup empty, computing the

heat flux density supplied by conduction with the inverse method and recording the wall and vapor
temperatures.
As drying continues, the sludge becomes sticky, accumulates in dead volumes or sticks on the stirring
device. Due to the dryer geometry, the contact with the heated wall is reduced and, as a consequence, the
heat flux density supplied to the product by the heated plate is very small. Nevertheless, weight
measurements show that the mass loss is significant. Thus, during this second phase, the product is
mainly dried by convection and conduction through the stirring device. As it was not possible to assess
neither the heat transfer coefficient vsh nor the free surface freeS , the measured and calculated mass
loss values were adjusted and the product freevs S*h estimated at 6.4 WK-1
.
At the end of the sticky phase, the granular phase appears and the heated surface is again fully covered
by the product and the geometric configuration is similar to the one observed during the fluid phase. Thus
the previously estimated values for the heat transfer coefficient vsh and the free surface freeS can be
used in a first attempt.
VALIDATION OF THE DATA PROCESSING
Drying experiments were performed with a digested sewage sludge, named A in the following
sections. Its characteristics are reported in Table 2. The values of the two constants, and , used to
adjust the dry matter specific heat (eq. 3) as well as the correlation coefficient are given in Table 3. The
heat of wetting, plotted in Figure 3, can be neglected as long as the moisture content remains higher than
0.3 kg/kg DM. However, when the moisture content further decreases, the heat of wetting strongly
increases and, for instance, reaches a value between 1 500 and 2 500 kJ/kg for a 0.05 kg/kg DM moisture
content. These orders of magnitude are in agreement with those reported by Herwijn [11] but are lower
than those achieved by Chen et al. [12]. According to Laidler and Meiser [13], this corresponds to an
intermediary step between the physical adsorption and chemisorption/chemical reaction.

For the drying experiment, the operating conditions were fixed to 180°C for temperature of the heated
surface and 3.5 kg for the initial mass of the sludge. The estimated heat flux densities, computed from
temperature measurements and from the electrical power, are plotted in Figure 4 versus drying time. The
agreement between the two methods is rather good except for the transition towards the granular phase
when the plate is suddenly coated with the wet granular matter. According to these results, the estimation
of the heat flux is considered correct and either of the two methods can be used for the determination of
the heat flux density supplied to the product by conduction.
Weight measurements were performed during this drying experiment. The calculated and measured
drying kinetics are compared in Figure 5. The good match of the computed values and the measured ones
validates the data processing. Since computation offers accurate predictions, it was decided to use the
energy balance for the determination of the drying kinetics in all experiments.
DRYING RATE CURVE AT THE LAB SCALE
According to the recommendations made by Kemp et al. [14], the moisture content - time data were
smoothed using a cubic spline fit over a number n of adjacent data points and the drying rate – moisture
curve (derivative of the previous curve) calculated from the spline equation. The first part of the moisture
content – time curve, corresponding to the initial heating of the product, and the following part were
adjusted separately. As smoothing tends to conceal information, the fit sensibility to the number n of
adjacent data points was investigated by comparing the drying rate curve obtained by differentiation of
the experimental data with the smoothed curve. It was found that n= 270 gives the most sensible data
fitting. With this processing method, the difference between the raw moisture contents and the smoothed
data is always less than 4%.
The drying rate – moisture curve, plotted in Figure 6, exhibits three different stages previously
described. So as not to overload this figure, the moisture contents corresponding to the transitions toward

the lumpy and granular phases are given in Table 4 as well as the mean evaporating flow rates per heated
surface area computed for each phase. Since the free surface of the product was to a great extent
unknown, it was not possible to plot the classical drying rate curve WfN . However, a more or less
constant rate period was observed during the pasty phase ( 3W .6 kg/kg DM). In the same time, the
sludge temperature remained equal to 100°C (cf. Figure 3). The decrease of the evaporating flow rate,
observed for 3.2 W 3.6 kg/kg DM, is attributed to a reduction of the contact surface between the
sludge and the heated wall. Between 3.0 and 0.32 kg water/kg dry matter, the sludge becomes sticky and,
as a consequence of the vertical design of the lab scale dryer in which the sludge is not compressed
against the heated wall, the contact between the sludge and the heated wall is imperfect and the drying
rate low. At the end of this sticky phase, the granular phase appears. Moist sludge is again in contact of
with the heated wall. A linear decrease of the evaporating flow rate is recorded during this period.
FROM THE LABORATORY SET UP TO THE INDUSTRIAL PADDLE DRYER
Wastewater treatment plant description
The in situ drying experiments were performed in a biological wastewater treatment plant, which was
equipped with a Naratherm® paddle dryer. This plant treats industrial wastewater (85%) and municipal
wastewater (15%). The annual sludge production is around 400 tons of dry matter. Before drying, the
sewage sludge (named sludge B in the following) is thickened by dissolved-air flotation, conditioned and
dewatered by centrifugation. The Naratherm®
paddle dryer consists of a 3.6 m long horizontal jacketed
trough with two 22 rpm rotating shafts. On each shaft, hollow wedge-shaped paddles are welded. To
ensure good mixing in any point of the dryer and plug flow along the trough, the paddles penetrate along
the shafts. The sludge is fed into one end and moves along the trough owing to gravity and rotation of the
paddles. The dry material is discharged at the opposite end. All metallic surfaces in contact with the
sludge (the jacket, the hollow shafts and paddles) are heated with saturated steam at a pressure close to 6

bar. This 32 m2
heated surface area is self-cleaned because of friction forces induced by rotors motion.
Vapors evolved during processing are carried out through a central exhaust port.
In theory, these indirect dryers [15] can treat the sludge in a single stage without back mixing but in
practice the production of small dry pellets is significant (due to an over designed mechanical stirring)
and a huge amount of dry product is recirculated in the dryer. As the production of small dry pellets was
significant, 45% of the dry product was recirculated in the dryer. Thus, the feeding flow rate was equal to
267 kg of dry solid per hour and the inlet moisture content of the sludge 1.5 kg water/kg dry matter. The
residence time of the sludge in the dryer was estimated to five and a half hours. At the dryer inlet, the
sludge has a pasty consistency. As its moisture content decreases, the sludge becomes sticky and breaks
into pellets. The transition between the pasty phase to the granular one appears at a distance of
ztransition=1.43 m from the dryer inlet, this corresponds to 0.35 *L, L being of the dryer length (L). The
outlet moisture content of the sludge is around 0.07 kg water / kg dry matter. This general behavior has
already been reported by Yamahata and Izawa [16]. According to their comments, the length of the paste
zone ranges between 0.26L and 0.33L.
Simple paddle dryer model
According to our observations in situ and at the lab scale, a simple paddle model has been proposed
[1]. The following assumptions were made:
The dryer is divided into a paste zone and a granular one;
The paste zone ranges between the dryer inlet and ztransition and the evaporating flow rate per unit
surface of the dryer is assumed to be constant and equal to the value recorded at the lab scale;
In the granular zone, the product height in the dryer is equal to the paddle diameter and, thus, the
contact surface is reduced to the sum of the two mixer shafts surface, the shaft mounted paddles
surface and a small part of the jacketed trough surface. A linear decrease of the evaporating flow
rate per heated surface of the dryer with the moisture content is assumed;
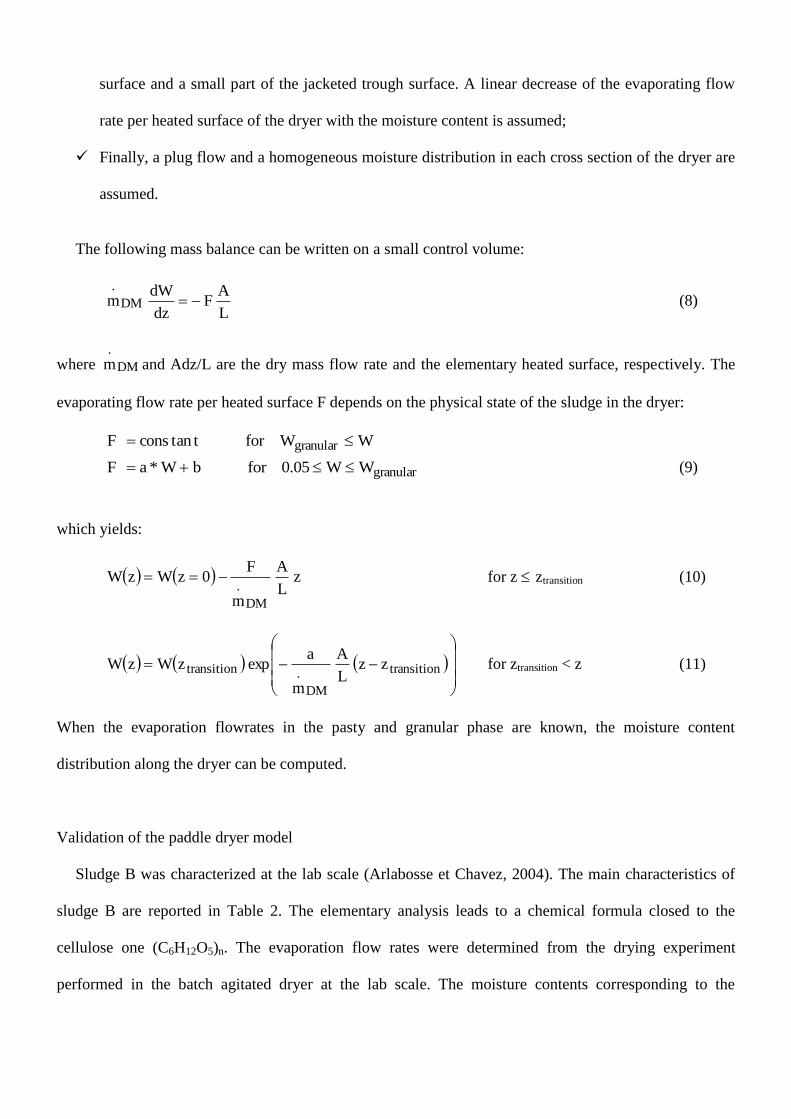
Finally, a plug flow and a homogeneous moisture distribution in each cross section of the dryer are
assumed.
The following mass balance can be written on a small control volume:
L
AF
dz
dWmDM
.
(8)
where DM
.
m and Adz/L are the dry mass flow rate and the elementary heated surface, respectively. The
evaporating flow rate per heated surface F depends on the physical state of the sludge in the dryer:
WWforttanconsF granular
granularWW05.0forbW*aF (9)
which yields:
zL
A
m
F0zWzW
DM
. for z ztransition (10)
transition
DM
.transition zzL
A
m
aexpzWzW for ztransition < z (11)
When the evaporation flowrates in the pasty and granular phase are known, the moisture content
distribution along the dryer can be computed.
Validation of the paddle dryer model
Sludge B was characterized at the lab scale (Arlabosse et Chavez, 2004). The main characteristics of
sludge B are reported in Table 2. The elementary analysis leads to a chemical formula closed to the
cellulose one (C6H12O5)n. The evaporation flow rates were determined from the drying experiment
performed in the batch agitated dryer at the lab scale. The moisture contents corresponding to the

transitions toward the lumpy and granular phases, the mean evaporating flow rates are reported in Table
4. From the drying kinetics, the two constants a and b were estimated at 34.38 kg dry matter/m2 h and
4.58 kg water/m2 h, respectively. Using equations (10) and (11), the drying kinetics in the paddle dryer
are computed and compared to the ones measured experimentally. As can be seen in Figure 7, the
agreement between computed and measured kinetics is rather good. This confirms the assumptions made,
specially that of a plug flow in the dryer.
CONCLUSIONS AND FURTHER DEVELOPMENTS
Since the thermal design of the paddle dryer is empirical, a methodology has been developed to
investigate the drying kinetics of the sludge in this type of a dryer. At the lab scale, drying experiments
are performed in a batch agitated vertical dryer. The drying kinetics and the evaporation flow rates are
computed from an energy balance, which requires the knowledge of the specific heat and the total heat of
desorption besides the temperature measurements. These kinetics exhibit three different zones, depending
on the consistency of the sludge. A constant evaporation flow rate is recorded in the pasty phase whereas
a linearly decrease is observed during the granular period. Besides these experiments at the lab scale, a
simple model of the paddle dryer has been proposed. The main assumption of this model concerns the
division of the dryer in pasty and granular zones. Data collected at the lab scale are used to compute the
moisture content distribution along the dryer. Good agreement between the calculated distribution with
that measured in situ on the industrial Naratherm
paddle dryer shows that measurements obtained at the
laboratory scale are sufficiently representative. Future experimental investigations will focus on the
influence of the sludge origin and treatment on the drying kinetics and the thermal design of the paddle
dryer. The final goal is to establish a classification of the sludge according to their capacity to be dried in
a paddle dryer.

ACKNOWLEDGMENTS
The authors are grateful to the Midi-Pyrénées Region (France) and to Degrémont for their financial
supports during this work. Furthermore, we are grateful to C. Jalbert for leading us through the use of the
Naratherm
paddle dryer.
NOMENCLATURE
A Heated surface of the paddle dryer (m2)
a Constant used in equation (9) (kg DM.m-2
. h-1
)
b Constant used in equation (9) (kg water.m-2
.h-1
)
C Mechanical torque (N.m)
pC Specific heat (J .kg-1
.K-1
)
F Evaporating flow rate per heated surface (kg.m-2
.s-1
)
h Heat transfer coefficient (W.m-2
.K-1
)
L Dryer length (m)
l Distance between the edges of the ring area
and the position of the front thermocouple
(m)
m mass (kg)
.
m Evaporating flow rate (kg.s
-1)
P Electrical power (W)
S Heated surface (m2)
r Radius (m)
T Temperature (°C)
W Moisture content dry basis (kg water.kg-1
dry solid)
z Abscissa (m)

Greek letters
Constant used in equation (3) (J.kg-1
.K-2
)
Constant used in equation (3) (J.kg-1
.K-1
)
vH Latent heat of vaporization (J.kg-1
)
totalH Total heat of desorption (J.kg-1
)
wettingH Heat of wetting (J.kg-1
)
Heat flux density (W.m-2
)
Rotation speed (rpm)
Subscripts
DM Dry matter
eff Effective
i Position
L left
R right
s Sludge
v Vapor
w Water
REFERENCES
[1] Arlabosse, P., Chavez S., 2004, Influence of the phosphoric acid addition on the drying kinetic of
dredged sediment, Proceeding of the International Drying Symposium, Sao Paolo (Brasil).
[2] Ferrasse, J.H., Arlabosse, P., and Lecomte, D., 2002, Heat, Momentum and Mass Transfer
Measurements in Indirect Agitated Sludge Dryer, Drying Technology, 20(4&5), pp. 749-769.
[3] Keey, R.B., 1978, Introduction to Industrial Drying Operations, Pergamon Press, Oxford

[4] Reidel L., 1977, Calorimetric determination of the heat of hydration of foods., Chem. Mikrobiol.
Lebensm, Vol. 5. (in German).
[5] Siperstein F., Gorte R. J., Myers A. L., 1999, A new calorimeter for simultaneous measurement of
loadings and heats of adsorption from gazeous mixtures, Langmuir, n°15, pp. 1570-1576.
[6] Ruthven D. M., 1984, Principles of adsorption and adsorption processes, John Wiley & Sons, NY.
[7] Nunes R.V., Rotsein E., 1991, Thermodynamics of the water-foodstuff equilibrium, Drying
Technology, Vol. 9, pp. 113-137.
[8] Ritzi, S.S.H., 1986, Thermodynamic properties of foods in dehydration, Engineering Properties of
Foods, Rao, M.A. and Ritzi S.S.H., Eds., Marcel Dekker, Inc., NY
[9] Ferrasse, J.H., Lecomte, D., 2004, Simultaneous heat-flow differential calorimetry and
thermogravimetry for fast determination of sorption isotherms and heat of sorption in environmental or
food engineering, Chemical Engineering Science, 59, n°6, pp. 1365-1376.
[10] Fudym, O., Carrère Gée, C., Lecomte D. and Ladevie B., 2003, Drying kinetics and heat flux in
thin-layer conductive drying, Int. Comm. Heat Mass Transfer, Vol. 30, n°3, pp. 333-347.
[11] Herwijn, A.J.M., 1996, Fundamental aspects of sludge characterization, PhD Dissertation,
Eindhoven Univ. Of Technol., The Netherlands
[12] Chen G.W., Hung W.T., Chang I.L., Lee S.F. and Lee D.J., 1997, Continuous classification of
moisture content in waste activated sludges, Journal of Environmental Engineering, 123, pp. 253-258
[13] Laidler K.J. and Meiser J.H., 1982, Physical Chemistry, Benjamin Cummings Publishing Co.,
London.
[14] Kemp, I.C., Fyhr, B.C., Laurent, S., Roques, M.A., Groenewold C.E., Tsotsas, E., Sereno, A.A.,
Bonazzi C.B., Bimbenet, J.J. and Kind M. (2001), Methods for processing experimental drying kinetics
data, Drying Technology, (19), 1, pp. 15-34.
[15] Chen, G., Yue, P.L., Mujumdar, A.S., 2002, Sludge dewatering and drying, Drying Technology,
(20)4&5, pp. 883-916.
[16] Yamahata, Y. and Izawa, H. (1984), Experimental study on application of paddle dryers for sludge
cake drying, Proceedings of the 4th
International Drying Symposium, IDS'84, Kyoto, pp. 719-724.
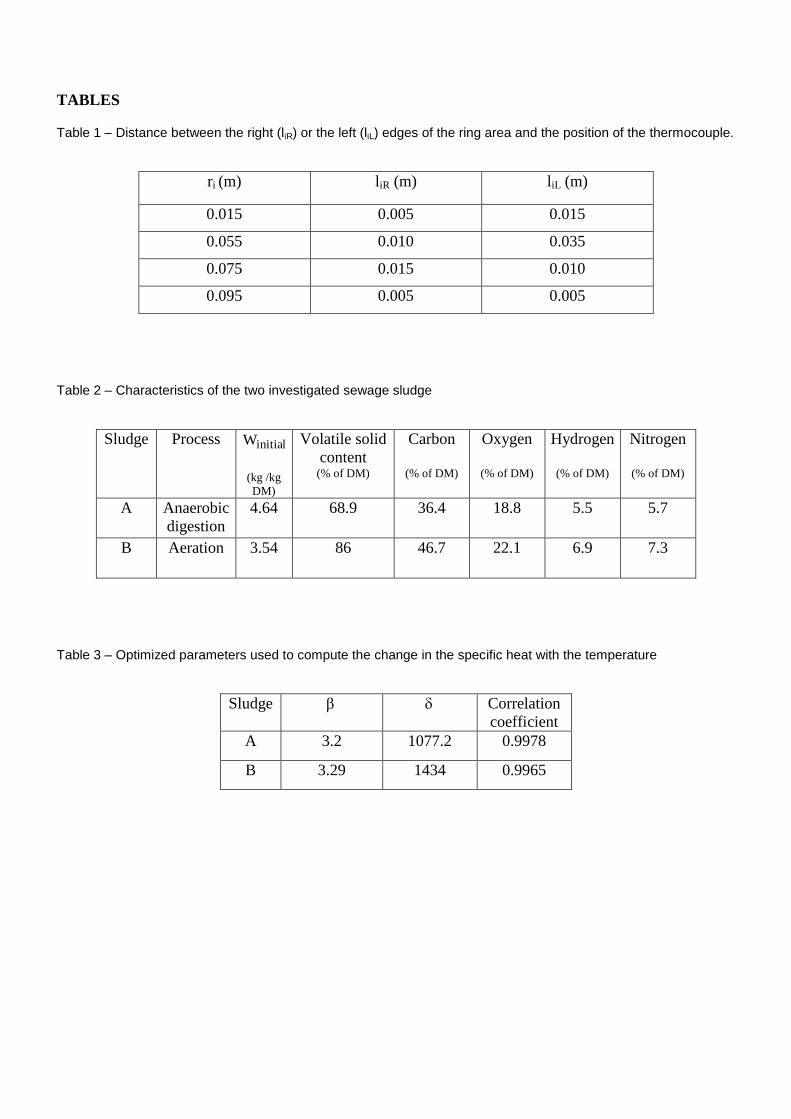
TABLES
Table 1 – Distance between the right (liR) or the left (liL) edges of the ring area and the position of the thermocouple.
ri (m) liR (m) liL (m)
0.015 0.005 0.015
0.055 0.010 0.035
0.075 0.015 0.010
0.095 0.005 0.005
Table 2 – Characteristics of the two investigated sewage sludge
Sludge Process initialW
(kg /kg
DM)
Volatile solid
content (% of DM)
Carbon
(% of DM)
Oxygen
(% of DM)
Hydrogen
(% of DM)
Nitrogen
(% of DM)
A Anaerobic
digestion
4.64 68.9 36.4 18.8 5.5 5.7
B Aeration 3.54 86 46.7 22.1 6.9 7.3
Table 3 – Optimized parameters used to compute the change in the specific heat with the temperature
Sludge Correlation
coefficient
A 3.2 1077.2 0.9978
B 3.29 1434 0.9965

Table 4 – Transition moisture contents and evaporating flow rates per unit surface of the dryer for the three sludge
consistency
Sludge lumpyW
(kg /kg DM)
granularW
(kg /kg DM) fluid
.
m
lumpy
.
m
granular
.
m
A 2.75 0.27 29.7 10.5 7.8
B 2.99 0.32 12.4 11.5 13.8

FIGURES
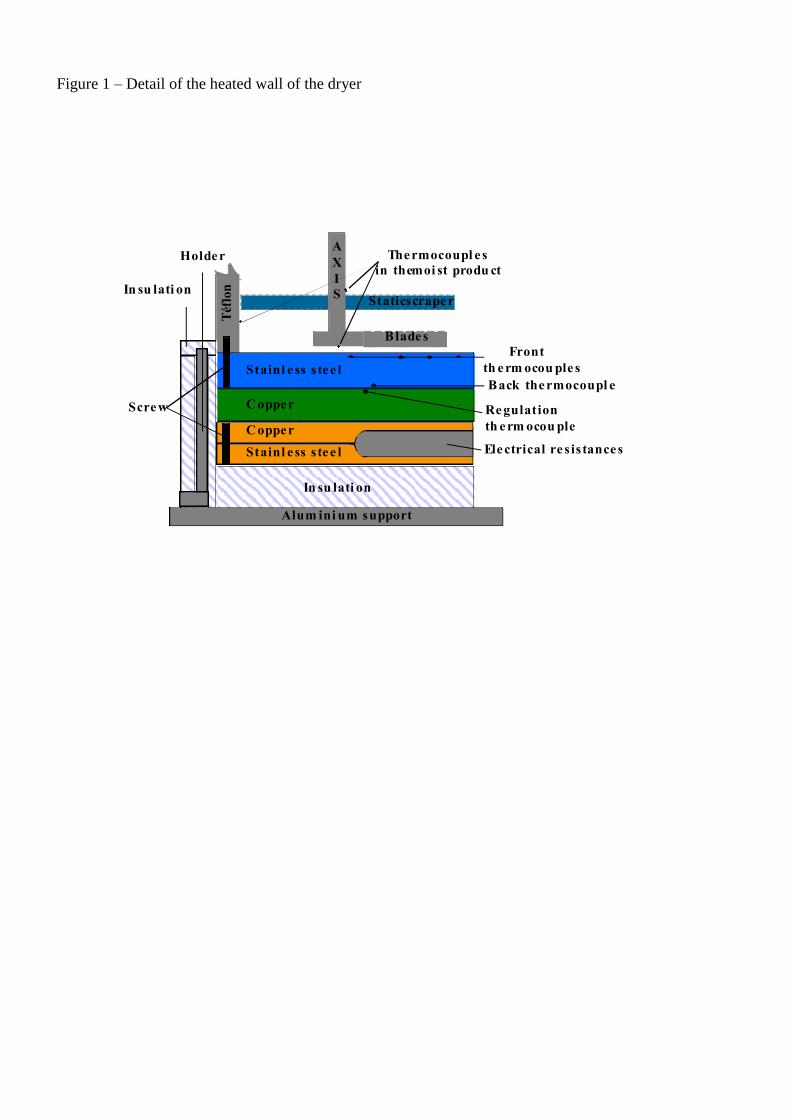
Figure 1 – Detail of the heated wall of the dryer
C opper
Stainl e ss s tee l
Téf
lon
Static scraper
Blades
A
X
I
S
Thermocoupl e s
in the moi st produ ct
Regulation
th erm ocou ple
Back thermocoupl e
Front
th erm ocou ple s
In su lati on
In su lati on
Holder
Alum ini um support
C opper
Electrical re s is tancesStainl e ss s tee l
Screw

Figure 2 – Evolution of the torque required to maintain a constant rotation speed in the dryer (sludge A,
Treg = 180°C, mini = 3.5 kg )
0
5
10
15
20
25
0 1 2 3 4 5 6 7
0
30
60
90
120
150
Time (hr)
To
rqu
e (N
m)
Slu
dg
e temp
erature (°C
)
Lumpy phase Granular
phase Pasty
phase

Figure 3 – Heat of wetting measured at 95°C (sludge A).
0.0E+00
5.0E+05
1.0E+06
1.5E+06
2.0E+06
2.5E+06
0.0 0.1 0.2 0.3 0.4 0.5 0.6 0.7 0.8 0.9 1.0
Moisture content (kg water/kg dry matter)
Hea
t o
f w
etti
ng
(J/
kg
)

Figure 4 – Evolution of the wall heat flux density during the drying experiment (sludge A, Treg = 180°C,
mini = 3.5 kg )
0.0E+00
5.0E+03
1.0E+04
1.5E+04
2.0E+04
2.5E+04
3.0E+04
3.5E+04
4.0E+04
0 2 4 6 8 10
Time (hr)
Hea
t fl
ux d
ensi
ty (
W /
m
2 )
Lumpy phase Granular
phase Pasty
phase

Figure 5 – Comparison between the measured and computed drying kinetics in the batch agitated dryer
(sludge A, Treg = 180°C, mini = 3.5 kg )
0.0
0.5
1.0
1.5
2.0
2.5
3.0
3.5
4.0
4.5
5.0
0 1 2 3 4 5 6 7
Time (hr)
Mois
ture
co
nte
nt
(kg
/kg D
M)

Figure 6 – Drying rate curve (sludge A, Treg = 180°C, mini = 3.5 kg )
0.0E+00
5.0E-05
1.0E-04
1.5E-04
2.0E-04
2.5E-04
3.0E-04
0 0.5 1 1.5 2 2.5 3 3.5 4 4.5 5
Moisture content (kg water/kg dry matter)
Ev
apora
tin
g f
low
rat
e (k
g /
s)

Figure 7 – Evolution of the computed ( line ) and measured (.) moisture content along the dryer
0
0.2
0.4
0.6
0.8
1
1.2
1.4
1.6
0 0.5 1 1.5 2 2.5 3 3.5 4 4.5
Distance from the dryer inlet (m)
Mois
ture
co
nte
nt
(kg w
ater
/kg d
ry m
atte
r)