Embed Size (px)
Citation preview

UPTEC X 19 001
Examensarbete 30 hpJuni 2019
Method for tracking orthogonal ribosomes in vivo using MS2 coat protein
John Lindström


Teknisk- naturvetenskaplig fakultet UTH-enheten
Besöksadress: Ångströmlaboratoriet Lägerhyddsvägen 1 Hus 4, Plan 0
Postadress: Box 536 751 21 Uppsala
Telefon: 018 – 471 30 03
Telefax: 018 – 471 30 00
Hemsida: http://www.teknat.uu.se/student
Abstract
Method for tracking orthogonal ribosomes in vivousing MS2 coat protein
John Lindström
Ribosomes are large macromolecules responsible for protein synthesis and they consist of both RNA and proteins. Each ribosome is made of one large and one small subunit. Even though the ribosome is one of the most studied machineries in the cell there is a gap in our understanding of how this macromolecule functions in vivo. In this project we aimed to develop a method for tracking a specific subset of ribosomes using super-resolution fluorescence microscopy. This was achieved by using the MS2 coat protein (MS2CP) fused to a fluorescent marker and by modifying ribosomes to have the RNA loop to which the MS2CP binds with high affinity. We were able to obtain the most promising results when the MS2CP was fused to a Halotag with the dye JF549 attached to it. The JF549 has good cell permeability which allows simple and efficient labelling of ribosomes. To be able to observe translation of specific mRNAs we used this labelling strategy to track orthogonal ribosomes which do not recognise mRNA normally produced in cells but can translate mRNAs with a modified 5’-UTR. Orthogonal ribosomes were tested with several different 5´-UTRs. With the construct for which we obtained the highest expression level we observed that up to 43% of the labelled orthogonal ribosomes were engaged in translation of the specific mRNA. The system will make it possible to determine how the sequence of a particular mRNA will affect its in vivo translation.
ISSN: 1401-2138, UPTEC X 19 001Examinator: Jan AnderssonÄmnesgranskare: Johan ElfHandledare: Magnus Johansson

ii

iii
Populärvetenskaplig sammanfattning
Celler består av många komponenter som är essentiella för deras överlevnad; en av dessa
nödvändiga komponenter är ribosomen. Ribosomernas uppgift är att syntetisera proteiner
utifrån budbärar-ribonukleinsyra (mRNA), kopierat från DNA, som fungerar som en mall för
proteinet. Ribosomer delas vanligen upp i två enheter och består av både (rRNA) och
proteiner. I bakterier består ribosomen av en mindre 30S-enhet och en större 50S-enhet, som
tillsammans bildar 70S ribosomer. Vilka proteiner som ska syntetiseras bestäms av att DNA
för en gen transkriberas till mRNA. Detta mRNA fungerar som en mall som ribosomen
translaterar till proteiner. Det har utförts många studier om ribosomens struktur och funktion,
men de flesta detaljerade studier är gjorda in vitro, dvs i provrör med framrenade
komponenter. Detta gör att interaktioner som sker med andra delar i celler lätt kan förbises.
Ett relativt nytt verktyg för att studera dynamiken hos proteinsyntesen inuti levande celler är
så kallad ribosomprofilering (ribosome profiling). Detta går ut på att man antingen fryser eller
behandlar celler med antibiotika som stoppar proteinsyntesen. Sedan använder man enzymer
för att bryta ner RNA som inte är bundet till ribosomen. På detta sätt kan man se vilka mRNA
som ribosomerna jobbar med just under det tillfället och hur långt de kommit. Från detta kan
man sedan tänka sig att där de flesta ribosomerna befinner sig på RNAt är det
hastighetsbegränsande steget. Problemet med denna metod är att hastigheterna man får inte är
direkta mätningar av hastigheterna (Michel and Baranov 2013) men att även när man stryper
reaktionen, i detta fall translationen, så är det väldigt snabba reaktioner som kan ge brusiga
mätningar. Vid användandet av antibiotika kan ribosomernas distribution på mRNA ändras
lokalt (Brar and Weissman 2015). Vid användandet av antibiotika kan även osäkra resultat
ges om antibiotikats effekt påverkas av vilket mRNA som ska translateras.
Målet med mitt projekt var att utveckla ett nytt system för att studera proteinsyntesdynamik
direkt i levande celler.
Ribosomer och proteinsyntesen kan studeras genom olika metoder. Exempelvis kan detta
göras genom att märka in molekyler med flourescens som sedan interagerar med ribosomen.
En annan metod utförs genom att stanna av reaktioner och studera vad som interagerar samt
hur strukturerna och interaktionerna ser ut under tillfället reaktionen stannar av. I detta projekt
märks ribosomerna in med flourescens. Detta görs med ett bakteriofagprotein, MS2 coat
protein, som binder in specifikt till en viss RNA-sekvens. I projektet har en optimerad version
av MS2 bindnings loopen använts som gör inbindningen stark och specifik. För att få
fluorescens kopplas MS2 proteinet till ett protein som kan belysas med laser och avge en
signal som kan studeras i mikroskop.
För att MS2-proteinet ska binda in till ribosomen har ribosomerna modifierats till att ha MS2
RNA loopen då den inte förekommer naturligt. Denna modifikation stör inte ut ribosomens
funktion men gör det möjligt att studera ribosomens rörelse och med vilken hastighet
ribosomen diffunderar.

iv
Med hjälp av denna metod har ribosomernas diffusion inuti bakterien Escherichia coli kunnat
avgöras. Från denna studies resultat dras slutsatsen att ribosomer som uttrycker proteiner (dvs
när den lilla och den stora subenheten sitter ihop på ett mRNA) i E. coli diffunderar med en
hastighet på runt 0,07–0,10 µm2/s och att den lilla subenheten rör sig i 0,6–0,7 µm2/s. Lilla
subenhetens hastighet mättes med ortogonala ribosomer som inte har något ortogonalt mRNA
att translatera. Att ribosomerna är ortogonala innebär att de inte translaterar de normala
proteinerna i cellen. Ortogonala ribosomer kan skapas genom en förändring i den sekvens
som ribosomerna vanligtvis använder för att känna igen mRNA.

v
Table of contents
Abbreviations ......................................................................................................................................... 1
1 Introduction and background ...................................................................................................... 3
1.1 MS2 bacteriophage coat protein ............................................................................................ 5
1.2 Fluorescent markers .............................................................................................................. 6
1.3 Orthogonal ribosomes ............................................................................................................ 6
2 Material and methods ................................................................................................................... 7
2.1 Strains .................................................................................................................................... 7
2.2 Plasmids ................................................................................................................................. 7
2.2.1 Plasmid containing ribosome operon ................................................................................ 7
2.2.2 Plasmid expressing MS2CP protein fused to a fluorescent protein or Halotag ................. 8
2.2.3 Plasmid expressing orthogonal Venusfast ........................................................................ 9
2.3 Competent cells ................................................................................................................... 10
2.4 Plasmid purification .............................................................................................................. 10
2.5 Gibson assembly .................................................................................................................. 10
2.6 Control if mutated helix 6 in ribosomes support growth ....................................................... 11
2.7 Sample preparation for imaging ........................................................................................... 12
2.8 Imaging and analysis ........................................................................................................... 13
3 Results and discussion .............................................................................................................. 13
3.1 MS2CP unspecific binding occurs to some small, but not very significant extent ............... 13
3.2 Mutated ribosomes remain functional .................................................................................. 14
3.3 Samples with mutated ribosomes show significant higher occupancy in slow state than
samples without a MS2CP binding loop ........................................................................................... 16
3.4 Orthogonal ribosomes are functional but with lower expression levels than at normal over
expression ......................................................................................................................................... 16
4 Conclusion .................................................................................................................................. 20
5 Thanks ......................................................................................................................................... 20
References ........................................................................................................................................... 22
Appendix A ........................................................................................................................................... 24

vi

1
Abbreviations
DNA Deoxyribonucleic acid
S Svedberg units
SD Shine-Dalgarno
GFP green florescent protein
MS2CP MS2 coat protein
wt wild type
H6 Helix 6

2
3
1 Introduction and background
The ribosome is an essential and highly conserved molecular machine of the cell responsible
for translation of the genetic information into functional proteins. Prokaryotes have smaller
70S ribosomes (where S refers to Svedberg units, sedimentation index) while eukaryotes have
larger 80S ribosomes, although both share many similarities in their architecture and thus
studies on bacterial ribosomes are useful for understanding how eukaryotic ribosomes
function (Volkov and Johansson 2018).
The ribosome is a large macromolecular complex, divided into two subunits, which consists
of both proteins and rRNA. Besides proteins the larger subunit consists of 23S rRNA and 5S
rRNA and the smaller subunit contain 16S rRNA. For initiation of translation of mRNA, the
ribosomes recognize a region called the Shine-Dalgarno (SD) sequence located 6-10
nucleotides upstream of the start codon AUG. The shine-Dalgarno sequence is present
upstream of the majority of translated genes but the sequence can vary to some extent. Some
mRNAs can be translated without a SD sequence though this is not very common (Rackham
and Chin 2005). The ribosome recognizes the SD-sequence through a corresponding sequence
called the anti-SD sequence located in the 3’ end of 16S rRNA in the ribosome.
Although overall structure and mechanism of action of the ribosome is well studied, not all
the dynamics and interactions are known. In vitro methods such as quench flow or single
molecule experiments with fluorescently labelled components of translation allowed to
explore more details of the dynamics of translation. Quench flow works by letting a reaction
happen for a short time before quenching it, for example by adding an acid. This is then done
at several timesteps and the reaction and its rates can be studied (Johansson 2012). For in
vitro single molecule fluorescent experiments components of translation such as ribosomes,
tRNAs, initiation and elongation factors are labelled by fluorescent dyes which allows direct
observation of interaction of different components during translation. In a study by
Dorywalska et al. (2005) they developed a method for labelling ribosomes using small
oligonucleotides with a fluorescent dye attached to the oligonucleotide. By immobilizing the
sample, they were able to study ribosomal molecules in vitro using single molecule
fluorescent microscopy (Dorywalska et al. 2005). A downside of these methods is that even
when one tries to keep the condition for the reaction close to the in vivo, one cannot foresee
all interactions nor include all components in the reaction environment.
Ribosome profiling is a recently developed method which can be used for observation of how
ribosomes translate mRNAs in vivo and, among other things, can help study the kinetics of
ribosomes, and works by interrupting the translation. The interruption of the ribosomes can be
made by quickly freezing the sample or by treating it with antibiotics. Then all RNAs not
bound to ribosomes are degraded using enzymes and the mRNA sequences bound to the
ribosome are thus protected from degradation and are sequenced (Michel and Baranov 2013).
With this method one can look at progression of ribosomes on mRNA and estimate how

4
abundant the ribosomes are at every position on the RNA. Depending on how many mRNAs
that are being translated the expression levels of a protein can be estimated and if many
mRNAs have stopped translation at the same location, that location probably has some
features which makes translation stall and become rate limiting.
A problem with this method is that a large sample size is needed and genes where expression
is low can be left out. When halting the translation these fast types of reactions can give
blurry measurements and when using antibiotics, the ribosomes local distribution on the
mRNA can change (Brar and Weissman 2015). Another thing that also can affect the
interpretation of the results is that our understanding of mode of actions of the antibiotics
being used is in many cases not comprehensive and that the antibiotics efficiency can
dependent on which mRNA that is being translated. Development of tools to increase our
knowledge about the dynamics of protein synthesis can help us understand how for example
antibiotics works and why some are bacteriostatic while others are bactericidal, even though
both are targeting the protein synthesis (Volkov and Johansson 2018).
The discovery of green fluorescent protein (GFP) was a breakthrough in the study of
intracellular dynamics. GFP allowed researchers to look at proteins and DNA at a subcellular
level. But observation of proteins at single-molecule level was problematic due to the weak
signal from a single fluorophore and high autofluorescence background of cells. Other
problems were quick photobleaching of fluorophores, and the resolution was limited to
around 250 nm (Kapanidis, et al. 2018). Today, super-resolution microscopy in combination
with more advanced fluorescent molecules has made single-molecule tracking possible.
Single-molecule studies using fluorescent proteins can today reach a resolution down to 10
nm (Stracy et al. 2014). Photoactivated fluorophores have been developed to make single
molecule tracking possible with higher copy number proteins. High copy number increases
the expression through more plasmids expressing the fluorophore. These photoactivatable
fluorophores need to be activated with laser pulse before they become fluorescent; this
activation allows us to only activate and observe just a few fluorophores at a time.
Recent year’s development in single-molecule tracking approaches has finally opened up the
possibility to study kinetics of mRNA translation directly inside living cells. One of these
ways is labelling of tRNA in vitro, electroporation of labelled tRNAs into cells and measuring
the diffusion rate of tRNAs in the cell (Volkov et al. 2018). Free tRNA diffuse much faster
than tRNAs bound to the ribosomes and thus the time when the tRNA is bound to the
ribosome can be calculated from the time the tRNA is in the slow diffusional state (Volkov
et al. 2018). Another way to study the translation using single molecule fluorescents was used
by Yan et al. (2016) were they linked fluorescence to both the mRNA being translated and to
the protein which the mRNA encodes for. The labelling was done using several Suntag
regions in the protein which scFv-GFP binds to and PP7-mCherry which binds to an RNA
hairpin (Yan et al. 2016). They anchored the mRNA to the membrane to be able to observe
several rounds of translation from the same mRNA. From this they could study translation for
a specific mRNA. The disadvantage of this method is the repeats of the binding sites on the

5
mRNA and the insertion of repeated tags in the peptide which can affect the translation rate
(Yan et al. 2016).
The present study aims to provide a tool for efficiently tracking ribosomes in vivo and
observation of translation from specific mRNAs. To achieve this the ribosome will be labelled
using MS2 coat protein (MS2CP) fused with a fluorescent marker, the labelling will be
performed in such way that there will be no need for electroporation of labelled molecules
into the cell. Labelling will be performed by introducing an RNA loop with specific MS2CP
binding into one of the 16S rRNA loops. This loop will be inserted in regions known to be
tolerant for modifications in the 16S rRNA. Furthermore, modification of the anti-SD
sequence of 16S rRNA will allow us to track orthogonal ribosomes translating specific
mRNAs with a substituted SD sequence.
1.1 MS2 bacteriophage coat protein
The MS2CP originates from the bacteriophage MS2 and has the property to bind specific
RNA structures. The RNA which MS2CP recognises is a small hairpin present in the
bacteriophage’s genomic RNA. Introduction of such a hairpin in different RNAs has been
shown to direct binding of MS2CP to these RNAs. The hairpin can be modified to make the
MS2 binding tighter by subs tituting an uracil to a cytosine (AUUA→AUCA) (Figure 1). This
mutation makes the binding between the RNA loop and the MS2CP 50-100-fold stronger
(Johansson et al. 1998).
Figure 1 A) helix 6 in ribosomes 16S, which were used in in this study. B) helix 6 in ribosomes 16S modified with wt
MS2 loop. C) helix 6 in ribosomes 16S with MS2 loop having a cytosine instead of a uracil at the top of the hairpin.

6
In this study we propose to introduce a hairpin for MS2CP binding in the structure of the
ribosome and employ a dimer of MS2CP fused to a fluorescent protein for labelling of
ribosomes to study their diffusion. The MS2CP recognize RNA hairpin but only when
structured as a dimer. To ensure stability of the dimeric form of the MS2CP we will express
the MS2CP as a single polypeptide chain with two monomers attached head-to-tail. For the
dimer to be functional and not break apart into MS2CP monomers, modifications of the
MS2CP are necessary. In this study a MS2CP dimer with deletion of several nucleotides
(CATGGCTTC) was used, these deletions include the starting codon for the second MS2
(Peabody and Lim, 1996). To avoid oligomerization of MS2CP several other mutations can
be used to prevent aggregation, such as V30I, A81G and deletion of several amino acids
(VATQTVGGVELPV) (Macías et al. 2008).
1.2 Fluorescent markers
The green fluorescent protein (GFP) is the first discovered fluorescent protein that allowed
labelling of proteins. Fluorescence of fluorescent proteins depends on the maturation of the
fluorophore core. Slow maturation of GFP, especially at 37˚C, along with non-optimal
photochemical properties are GFP’s biggest drawbacks which make it inappropriate for single
molecule studies. Several improved variants of GFP and other fluorescent proteins have then
been developed over the last few decades. In this study we employed two fluorescent
proteins: Venus and mEos2. Venus is a derivative of GFP with photophysical properties more
suitable for single molecule experiment with mutations which results in faster maturation,
increased brightness and stability (Nagai et al. 2002).
mEos2 is a red-shifted fluorescent protein which is derived from the Eos fluorescent protein.
Unlike Eos, mEos2 matures at 37˚C. mEos2 is photoactivatable with 405 nm laser (McKinney
et al. 2009), making it possible to activate fluorescence only when it is needed, and depending
on the time and illumination intensity the number of activated mEos2 can be controlled.
Besides the two abovementioned fluorescent proteins we use Halotag which is not fluorescent
on its own but can specifically bind to chemical fluorescent dyes which have superior
photochemical properties. In this study we use JF549, a small dye with high brightness and
photostability that can allow longer tracking of labelled molecules. The dye unlike the
fluorescent proteins is not synthesised in the cell but has good cell permeability and diffuses
into the cell when added to the growth media. Once it is inside the cell it binds to the Halotag
through a reactive group (Janelia.org 2018) which in this study is fused to the MS2CP.
1.3 Orthogonal ribosomes
Efficiently studying translation can be very hard while the whole proteome is translated. This
is difficult because when the whole proteome is translated many different proteins are being

7
expressed simultaneously and determining what you are really looking at can be difficult. To
remove this problem orthogonal ribosomes can be used. These orthogonal ribosomes can be
achieved by modifying the anti-SD sequence which only allows them to translate mRNAs
with the corresponding SD sequence. Using this, translation can be studied when only a
specific mRNA is translated.
2 Material and methods
2.1 Strains
All plasmids used in this study were constructed using the E. coli DH5α strain. For
microscopy experiments E.coli MG1655 carrying corresponding plasmids was used. The E.
coli SQ171 strain was used to examine if ribosomes remained functional after modification.
2.2 Plasmids
In this study we constructed a set of compatible plasmids for expression of ribosomal operons
(wt and orthogonal), MS2CP fusions to fluorescent proteins and Halotag and for expression of
the Venus gene with an orthogonal 5’-UTR region. All plasmids were constructed using the
Gibson assembly method and by site directed PCR mutagenesis.
2.2.1 Plasmid containing ribosome operon
To create a plasmid pAMM552-rrnB we amplified a fragment containing the entire rrnB
operon, a ribosomal operon (using oligonucleotides rrnB_Gibson_F and rrnB_Gibson_R)
using the genomic DNA of the MG1655 strain as a template. The fragment was fused with the
backbone of Ribo-T (Orelle et al. 2015) plasmid (from which the operon for Ribo-T was
removed) using the Gibson assembly method. The backbone was amplified using
oligonucleotides pAM552_Gibson_R, pAM552_Gibson_F2. The presence of correct insertion
of the rrnB operon was confirmed by sequencing.
The pAM552-rrnB was then used in PCR mutagenesis where an extension was added to one
of the selected helixes (helix 6, 33b, 39 and 44) separately in the 16S rRNA. This was done
using site directed PCR mutagenesis (with oligonucleotides H6_MS2_F, H6_R,
H33b_MS2_F, H33b_R, H39_MS2_F, H39_R, H44_MS2_F and H44_R). All locations
chosen for mutagenesis with the MS2-loop have been proven to support growth after
mutations (Dorywalska et al. 2005). The MS2-loop inserted had the C mutation (figure 1)
giving higher binding affinity to the MS2 dimer. As mentioned before this mutation gives a
50-100-fold increase in binding (Johansson et al. 1998). The constructed pAMM552-rrnB
plasmid variants (pAMM552-rrnB-H6, pAMM552-rrnB-H33b, pAMM552-rrnB-H39,
pAMM552-rrnB-H44) were verified by sequencing.

8
Orthogonal ribosomes were first attempted to be constructed from the pAM552-rrnB-H6
plasmid by inserting a CA mutation on position 722-723 in the 16S rRNA and then changing
the anti-SD to UGGGA (Rackham and Chin 2005) (using the oligonucleotides
ribo722_CAmut_F, ribo721_R, riboSDorthogonal_F and riboSD_R). However, we were not
able to obtain the desired construct, probably due to the toxicity of orthogonal ribosomes
expressed from a multicopy pAMM552 plasmid.
pSC101-o-ribo plasmid containing the operon for orthogonal ribosomes was received as a gift
from Chin lab (Rackham and Chin 2005). The orthogonal ribosomes expressed from the
pSC101-o-ribo plasmid were then modified to contain the MS2CP binding loop introduced at
helix 6. Loop insertion was done using site specific PCR mutagenesis using H6_MS2_F and
H6_R oligonucleotides. We also constructed a variant of the pSC101 plasmid which express
ribo-H6 ribosomes (with wt anti-SD) to use as a control. These constructs were prepared by
exchanging a fragment containing the anti-SD in pSC101-o-ribo-H6 to the one from
pAM552-rrnB. This was done using Gibson assembly by amplification of corresponding
fragments (using oligonucleotides rrb_Gibson_foroSD_F, rrb_Gibson_foroSD_R,
oSDfragment_Gibson_F and oSDfragment_Gibson_R). While pAM552-rrnB has ampicillin
resistance, pSC101 has kanamycin resistance.
2.2.2 Plasmid expressing MS2CP protein fused to a fluorescent protein or
Halotag
To be able to track the ribosomes they were labelled with MS2CP fused to a marker. The
markers tested were Venus, mEos2, and Halotag. All 3 variants of markers were expressed as
a fusion with MS2CP placed on a pCOLA plasmid and regulated by the lacUV5 promoter
with the lac operator. The pCOLA-MS2 plasmid has a different origin of replication than
pAMM552-rrnB and has a kanamycin resistance gene.
To construct the pColA-MS2CP plasmid with different markers we first substituted in
pColADuet-1 the original T7 promoter with the lacUV5 promotor with the lac operator using
site directed PCR mutagenesis (using oligonucleotides pColA1 and pColA2). Then, using
Gibson assembly the MS2CP dimer gene with deletion of several nucleotides
(CATGGCTTC), (Peabody and Lim 1996) was inserted in pCOLA downstream of the
lacUV5 promoter. Amplification of the pCOLA fragment was performed using
oligonucleotides pColA_Gibson_F and pColA_Gibson_R. For amplification of the MS2CP
dimer MCPd_Gibson_F and MCPd_Gibson_R were used. To lower the expression of labelled
MS2CP a mutation called lacIq was done leading to an increase of production of the lac
repressor. First Venus together with MS2CP was inserted and then mEos2 or HaloTag were
inserted, replacing Venus downstream of MS2CP by Gibson assembly (using the
oligonucleotides mEos2_Gisbson_F, mEos2_Gisbson_R, HaloTag_Gibson_F and
HaloTag_Gibson_R).
Since we were not able to obtain a construct with o-ribo-H6 on plasmid pAM552 (Ampicillin
resistance) it was exchanged to plasmid pSC101 (kanamycin resistance) and thereby we were
9
unable to use pCOLA plasmid, due to having the same resistance (kanamycin resistance) as
pSC101. Thus for further experiments we cloned the entire region containing lacUV5
promoter, lac operator and MS2CP-Halotag fusion into a backbone with p15a replication
origin and chloramphenicol resistance gene obtained from a pEVOL plasmid. Cloning was
performed by using two rounds of Gibson assembly. First constructing a plasmid with p15a
origin, chloramphenicol resistance and a rrnB terminator (using oligonucleotides
rrnBt_Gib_F, rrnBt_Gib_R, pEvol_Gib_F and pEvol_Gib_R). Then, in the second Gibson
assembly lacIq and MS2CP-HaloTag upstream of the terminator (using
p15CAM_Gibson_Halo_F, p15CAM_Gibson_lacI_R, MS2Halo_Gibson_p15CAM_F and
MS2Halo_Gibson_p15CAM_R) were inserted. The resulting plasmid is shown in the
appendix section (figure 7).
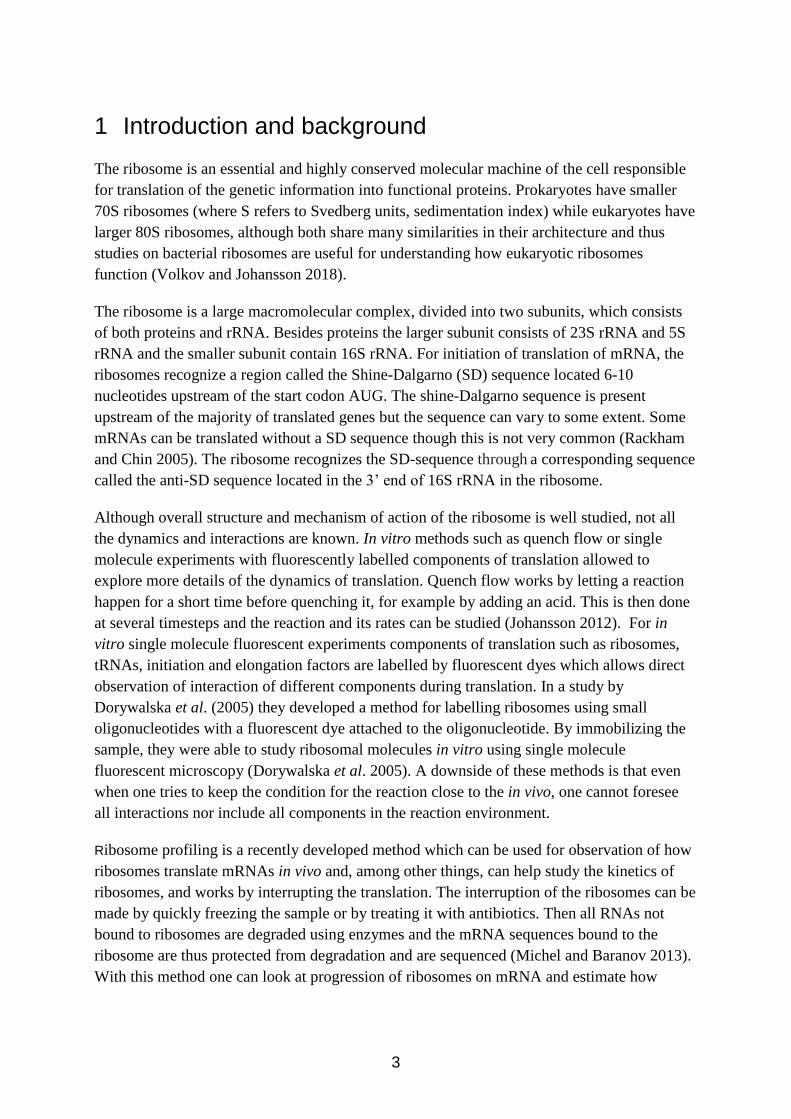
2.2.3 Plasmid expressing orthogonal Venusfast
A pBAD24CAM-Venusfast plasmid (a gift from Prune Leroy) containing Venusfast,
ampicillin and chloramphenicol resistance was first digested with XbaI, to excise the
chloramphenicol resistance gene, purified and ligated back together. We used site directed
PCR mutagenesis to change 5´UTR of Venusfast based on previous studies with orthogonal
ribosomes (An and Chin 2009, Darlington et al. 2018) and prepared three constructs (Table
1).
The expression level of Venus for each of the constructs was tested by using a Spark
Microplate Reader measuring the growth rate and light emission at 535 nm after excitation
from 485 nm laser. For expression induction 0.2 % arabinose was used.
Table 1 showing the sequence between the +1 nucleotide and the start codon in pBAD24-oVenusfast, including the
oSD.
Sequence oligonucleotides
Pair 1 cAGCGGCCGCTTGAGACCTACTCcGGGAAAG
GTCTCCCGCTTTCAcatccctCCGCAA
pBADoVenus_pair1_F
pBADoVenus_pair1_R
Pair 2 cccgtttttttgggctaACAATTTTCATATCCCTCCGCAA pBADoVenus_pair2_F
pBADoVenus_pair2_R
Pair 2.2 cccgtttttttgggctaATATCCCTCCGCAA pBADoVenus_pair2_2_F
pBADoVenus_pair2_R

10
2.3 Competent cells
To be able to insert larger fragment into the cell, for example plasmids which do not diffuse
into the cell on its own, competent cells are required. This is a natural way of horizontal gene
transfer which allow cells to take up genetic material from the surrounding environment when
experiencing harsh environments. In this study we used electrocompetent cells and chemically
competent cells. Chemically competent cells require heat chock for transformation while
electrocompetent cells needs an electric pulse, also known as electroporation.
To prepare electrocompetent cells an overnight culture was diluted 1:200 in 100 ml SOB
medium, and cells were then grown until reaching OD600=0.4-0.6. The cell culture was placed
on ice for 15 min and bacteria were then pelleted by centrifugation at 4000g for 15 min. The
medium was discarded, and the pellet was resuspended in 2ml of 10% glycerol and
centrifuged for 7 min at 4 ºC. This washing step was repeated 5 times after which cells were
resuspended in 400 µl of 10% glycerol and then aliquoted into 20 µl fractions. For
transformation a 20 µl fraction was mixed with 0.3 µl DNA (plasmid) and electroporation was
performed using Bio-Rad MicroPulser using standard settings. After electroporation cells
were immediately transferred to 1 ml of SOC medium and recovered for 1-2h. After recovery
cells were spread on plates containing corresponding antibiotics.
Chemically competent cells were purchased from Invitrogen and protocol suggested by the
manufacturer was used.
2.4 Plasmid purification
Plasmids were purified using mini preparation kit (Invitrogen) using provided instructions.
2.5 Gibson assembly
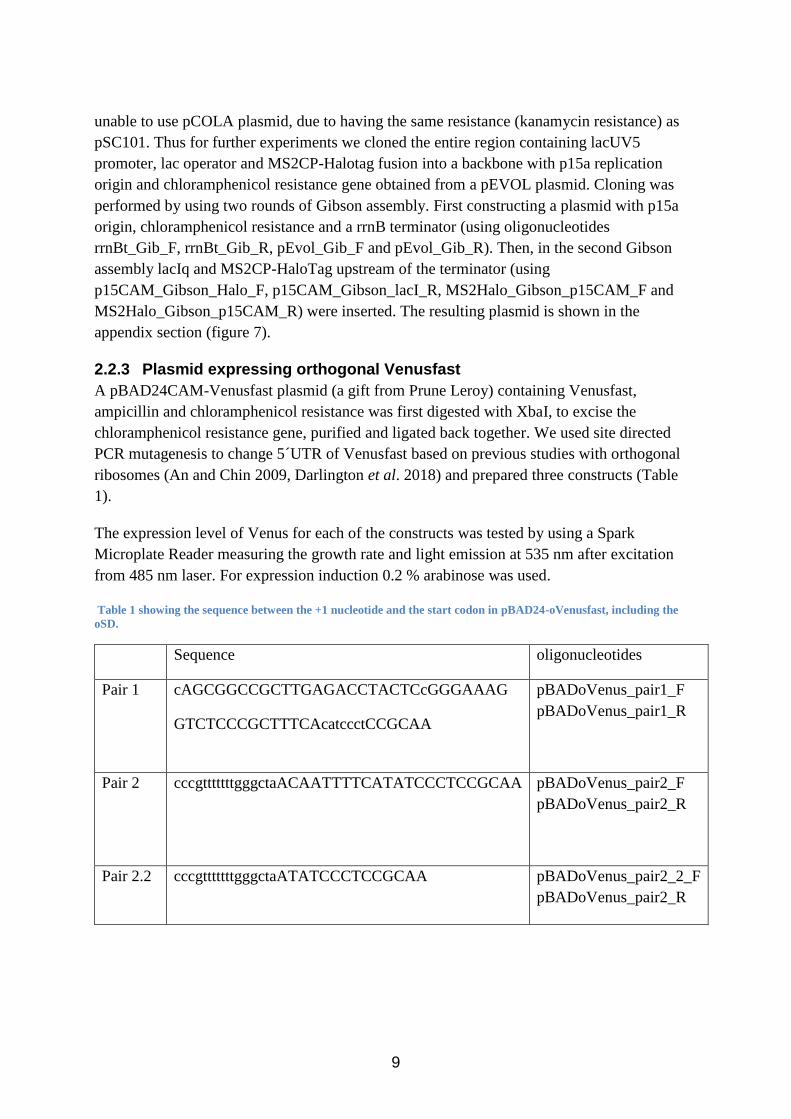
Gibson assembly is a method developed in a study by Dr Daniel Gibson (Gibson et al. 2009)
where they describe an isothermal method where DNA fragments can be assembled in a
single step. This is performed using 3 different enzymes: 5′ exonuclease, a DNA polymerase
and a DNA ligase which are all stored together in the same buffer. This mix is then used to
ligate fragments with overhangs complementary to each other (Gibson et al. 2009). When
being used the 5′ exonuclease chews back the 5′ end creating single stranded 3′ overhangs.
The polymerase fills in the gap in the 3′ ends and then the ligase fuses them into one double
stranded DNA segment (Figure 2). Gibson assembly is an effective way to fuse larger
fragments (New England Biolabs 2018).
11
Figure 2 reaction overview of Gibson assembly where the enzymes roles are displayed. Where the red and blue
sections represent complementary sequences to each other used for the ligation.
Ligation using Gibson assembly is very easy to use and depending on how many fragments
needed to be ligated, 10 µL of Gibson assembly mix is mixed with fragments in deionized
water to final volume of 20 µL. Fragment amount added depends on how many fragments are
being assembled, 0.02-0.5 pmol when assembling 2-3 fragments and 0.2-1 pmol when
assembling 4-6 fragments (New England Biolabs 2018).
2.6 Control if mutated helix 6 in ribosomes support growth
To check if the mutations on helix 6, 33b, 39, and 44 where functional and able to support
growth the strain SQ171fg/pCSacB was used. SQ171fg/pCSacB was a gift from Michael
Jewett (Addgene plasmid # 69344). This strain has the ribosomal operons on the chromosome
deleted and contains two plasmids, one with the ribosome operon and one with tRNAs (E.
coli Genetic Resources at Yale CGSC, The Coli Genetic Stock Center, n.d., Orelle et al.
2015). The plasmid containing the ribosome operon also contain a counterselection gene

12
called SacB. This gene becomes toxic to the cell when grown on sucrose and is used to
counter select cells which contain the plasmid carrying sacB.
To create strains with homogeneous population of ribosomes containing modification in one
of the selected loops SQ171fg/pCSacB was made electrocompetent. Then electroporated with
corresponding plasmid, and recovered in soc media. 150 µl of these recovered cells were then
transferred to 2 ml soc media with 100 mg ml-1 ampicillin, 30 mg ml-1 spectinomycin and
0.25% sucrose, and then grown overnight. Aliquots were plated on selective agar LB,
containing 100 mg ml-1 and 5% sucrose. All ribosomes with mutated helix 6, 33b, 39 or 44
supported growth on selective plates. Obtained strains were restreaked on both ampicillin and
kanamycin plates and the absence of kanamycin resistance was confirmed, supporting that
cells lost the pCSacB plasmid with the wt ribosomal operon.
SQ171 with pAM-rrnB wt and H6 were then transformed with pCOLA-MS2-HaloTag to
confirm that ribosomes with MS2-Halotag bound to ribosomes still supported growth. For this
pAM-rrnB wt and H6 together with pCOLA-MS2-HaloTag were grown in a humidity cassette
with a 96 well plate with no induction, 200 µM IPTG and 1 mM IPTG. Growth was then
tested using the Spark Microplate Reader measuring the OD600 every 5 min for 20 h at 37˚C.
For all 6 samples 6 replicates were made and 6 wells with LB were used as control.
2.7 Sample preparation for imaging
Before cells were imaged in the super-resolution microscope, they went through different
washing steps depending on if fluorescent protein (Venus and mEos2) was used or if cells
were expressing Halotag and were labelled with the JF549 dye.
When fluorescent proteins were imaged 1ml of cell culture in logarithmic phase were pelleted
and washed 3 times with 1 ml of PBS (salt solution) and then 1 µl droplets were put on an
agarose pad made of EZ Rich Defined Medium (RDM) containing 2% agarose.
When Halotag and JF549 was used for imaging an optimized protocol (Banaz et al. 2018) was
used to a large extent but with a few modifications. Cells were grown during the day in LB
then serial dilutions (1:100, 1:1000, and 1:10000) were made in M9 medium and cultures
were grown overnight at 37 ºC. Overnight cultures growing in logarithmic phase were taken
for labelling and imaging. 2-5 ml of culture were used for pelleting cells which were
resuspended in 100 µl of fresh M9 medium and mixed with 2.5 µl 50 mM JF549 dye for
labelling of Halotag. Cell suspension mixed with dye was incubated for 30 min at 25˚C and
then washed 3 times by spinning down the cells and resuspending them in 1 ml of M9
medium. After these 3 washes the cells were allowed to recover in 2 ml of M9 media for 30
min at 37˚C before being spun down and resuspended in 50-100 µl of media. Depending on
13
density they were further diluted 10-1000-fold and added on an agarose pad made of RDM
containing 2% agarose
2.8 Imaging and analysis
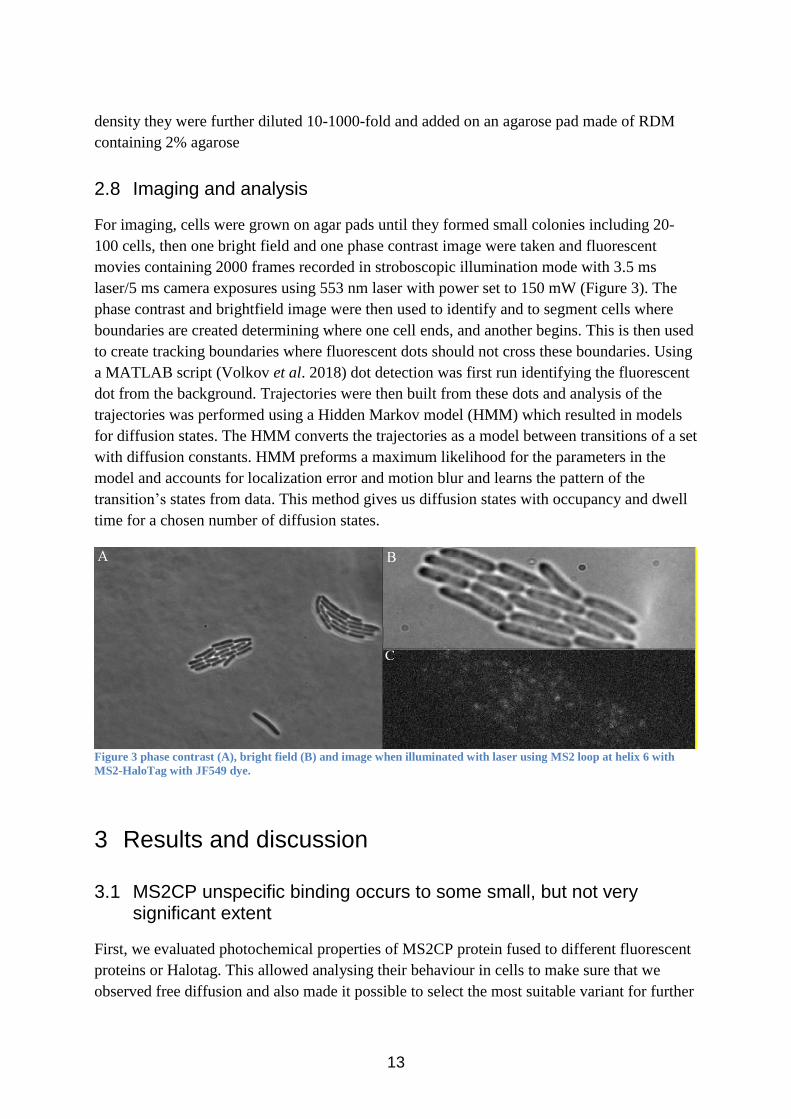
For imaging, cells were grown on agar pads until they formed small colonies including 20-
100 cells, then one bright field and one phase contrast image were taken and fluorescent
movies containing 2000 frames recorded in stroboscopic illumination mode with 3.5 ms
laser/5 ms camera exposures using 553 nm laser with power set to 150 mW (Figure 3). The
phase contrast and brightfield image were then used to identify and to segment cells where
boundaries are created determining where one cell ends, and another begins. This is then used
to create tracking boundaries where fluorescent dots should not cross these boundaries. Using
a MATLAB script (Volkov et al. 2018) dot detection was first run identifying the fluorescent
dot from the background. Trajectories were then built from these dots and analysis of the
trajectories was performed using a Hidden Markov model (HMM) which resulted in models
for diffusion states. The HMM converts the trajectories as a model between transitions of a set
with diffusion constants. HMM preforms a maximum likelihood for the parameters in the
model and accounts for localization error and motion blur and learns the pattern of the
transition’s states from data. This method gives us diffusion states with occupancy and dwell
time for a chosen number of diffusion states.
Figure 3 phase contrast (A), bright field (B) and image when illuminated with laser using MS2 loop at helix 6 with
MS2-HaloTag with JF549 dye.
3 Results and discussion
3.1 MS2CP unspecific binding occurs to some small, but not very significant extent
First, we evaluated photochemical properties of MS2CP protein fused to different fluorescent
proteins or Halotag. This allowed analysing their behaviour in cells to make sure that we
observed free diffusion and also made it possible to select the most suitable variant for further

14
studies. We constructed several plasmids (see Methods) where expression of genes for
MS2CP-Venus, MS2CP-mEos2, and MS2CP-HaloTag is regulated by the lacUV5 promoter
with the lac operator (IPTG inducible).
Cells expressing one of the fusion proteins: MS2CP-Venus, MS2CP-mEos2, and MS2CP-
HaloTag with JF549 – were imaged in microscopy experiments. The data was acquired by
images taken every 5 ms with 3.5 ms illumination with 514 (for Venus), 561 (for mEos2), or
553 (for Halotag) nm laser in order to estimate diffusion coefficient. MS2CP fused to Halotag
showed superior stability and brightness in comparison with both Venus-, and mEos2- fusions
and all subsequent experiments and data analysis were performed with MS2CP-Halotag. For
data analysis of images, which includes detection of fluorescent dots, tracking and prediction
of diffusional states with HMM analysis, we used a pipeline recently developed in the
Elf/Johansson labs (see Methods and paper (Volkov et al. 2018) for details). Results of the
simple 3 state HMM model for tracking of MS2CP-Halotag are provided in Table 2, showing
the diffusion rate (D), occupancy and dwell time (the average time a molecule stay in a certain
diffusion state). We observed that MS2CP-Halotag diffuses freely (67% of the time, D
(µm2/s) = 3.9) the majority of the time although free diffusion is often interrupted by
relatively short binding events (≈100 ms on average) with D (µm2/s) = 0.1. We also detect a
small fraction of molecules that according to the analysis are moving very fast (D (µm2/s) =
45), but this likely represents tracking artefacts (Volkov et al. 2018).
Although we observed MS2CP-Halotag molecules in a slow state, which probably is a result
of unspecific interactions by MS2, these events are short and thus should not lead to
misinterpretation of results when the MS2CP-Halotag is stably bound to ribosomes in the
presence of the MS2CP binding loop.
Table 2 diffusion rates for ribosomes without the MS2 loop expressed with MS2-HaloTag and image with JF549 dye.
Laser used was 553 nm and imaged every 5 ms with laser exposure for 3.5 ms.
Diffusion state 1 Diffusion state 2 Diffusion state 3
Diffusion rate (µm2/s) 0.1 3.9 45.0
Occupancy (%) 25.7 67.4 6.9
Dwell time (ms) 98 137 21
3.2 Mutated ribosomes remain functional
To create ribosomes that can stably bind MS2CP-Halotag we decided to create several
mutants of ribosomes in which the MS2CP binding loop was introduced in one of the
positions that previously have been shown to tolerate mutations. As a template we used the
pAM552-rrnB plasmid carrying the entire rrnB operon. We created constructs where the

15
MS2CP binding loop was introduced in loop 6, loop 33b, loop 39, and loop 44 of 16S rRNA.
To confirm that ribosomes containing the MS2CP binding loop were still functional we
introduced constructed plasmids in the SQ171 strain in which all 7 chromosomal ribosomal
operons were deleted and which carries a wt ribosomal operon on a plasmid with a
counterselectable SacB marker which can be cured from cells by supplementing growth
media with sucrose. After selection on plates with sucrose we observed growth for all the
mutants and the growth were comparable to that of cells carrying the wt operon. For one of
the mutants which carries the MS2CP binding loop at helix 6 (ribo-H6 mutant) we tested
growth in liquid media together with a plasmid expressing MS2-Halotag and observed similar
growth with high induction, intermediate induction and without induction of the MS2CP-
HaloTag for cells carrying wt rrnB or ribo-H6 operon. Growths were similar for all replicates
of the same sample and the average growth curve for each is shown in Figure 4. Thus, we
conclude that mutants constructed with a MS2CP binding loop retain their activity and that at
least in case of the ribo-H6 mutant co-expression with MS2CP-Halotag does not impair
functionality. All further experiments were performed with the ribo-H6 mutant.
Figure 4 Showing growth curves for H6 and wt ribosomes expressed from plasmid in SQ171 strain without induction,
with 200 µM or 1 mM IPTG. A LB sample is also included for reference. Cells where grown on a 96 well plate with a
humidity cassette at 37˚C with an error of ± 0.5˚C allowed. OD600 measurements were taken every 5 minutes and each
curve is made from the average of 6 replicates for each sample.

16
3.3 Samples with mutated ribosomes show significant higher occupancy in slow state than samples without a MS2CP binding loop
Next, we co-expressed the MS2CP-HaloTag and the ribo-H6 mutant and analysed apparent
diffusion of fluorescent molecules in the same way presented above. Results of the simple 3
state HMM model for tracking of the MS2CP-Halotag are provided in Table 3. We observed
dramatic change of MS2CP-Halotag diffusion comparing to results for experiment where the
MS2CP loop was not present. In this experiment most of the fluorescent molecules (79%)
were present in a slow diffusional state (D (µm2/s) = 0.07) which probably represents
MS2CP-Halotag bound to ribosomes engaged in translation. About 15% of molecules at each
time point were observed in a faster diffusional state (D (µm2/s) = 0.6), which may represent
MS2CP-Halotag bound to the 30S ribosomal subunit searching for mRNA to read. This
distribution of states is in agreement with data previously reported for proportion of
translating ribosomes. We again observe that analysis detects dots moving very fast (D
(µm2/s) = 25) which most likely is a result of tracking artefacts. Analysis of transitions
between diffusional states (data are not shown) also shows that trajectories of molecules in
slower states are mostly interrupted by transitions to tracking artefacts, leading to the times
presented in Table 3 are likely underestimated. Importantly, average dwell time in the slowest
state is significantly longer than dwell times observed in the control sample (Table 2), thus
excluding the possibility that it represents non-specific binding.
Table 3 diffusion rates for ribosomes containing MS2 loop at helix 6 expressed with MS2-HaloTag and image with
JF549 dye. Laser used was 553 nm and imaged every 5 ms with laser exposure for 3.5 ms.
Diffusion state 1 Diffusion state 2 Diffusion state 3
Diffusion rate (µm2/s) 0.1 0.6 25.0
Occupancy (%) 79 15 6
Dwell time (ms) 900 83 24
3.4 Orthogonal ribosomes are functional but with lower expression levels than at normal over expression
Tracking of ribo-H6 presented above lacks information on which mRNA is translated since
we observe the translation from the total mRNA pool. To follow translation from specific
mRNAs we decided to use orthogonal ribosomes which have a mutated anti-SD sequence in
their 3’-end (Chubiz and Rao 2008). We first attempted to construct the orthogonal ribosomes
using the pAM552-rrnB plasmid as a template by changing the anti-SD sequence to UGGGA
and introducing additional mutations at position 722-723 (CA) (Rackham and Chin 2005). We
were unable to obtain such a construct probably due to toxicity from orthogonal ribosomes
since pAMM552 is a high copy number plasmid, which may lead to too many orthogonal
17
ribosomes per wt ribosome drastically reducing cell growth. Toxicity might also be a result of
usage of the cell’s resources such as initiation factors for translation.
To overcome this problem, we used the pSC101-o-ribo plasmid (kindly provided by Chin lab)
which carries the entire ribosomal operon with mutations in the anti-SD sequence and at
positions 722-723 and which have been shown to allow cell growth (Rackham and Chin
2005). This plasmid has a copy number of around 5 which is about 10 times lower than that
for pAMM522. Cells carrying pSC101-o-ribo grew well and thus we introduced the MS2CP
binding loop into helix 6 (o-ribo-H6). Also, a version with wild type anti-SD was created to
serve as a control in expression efficiency.
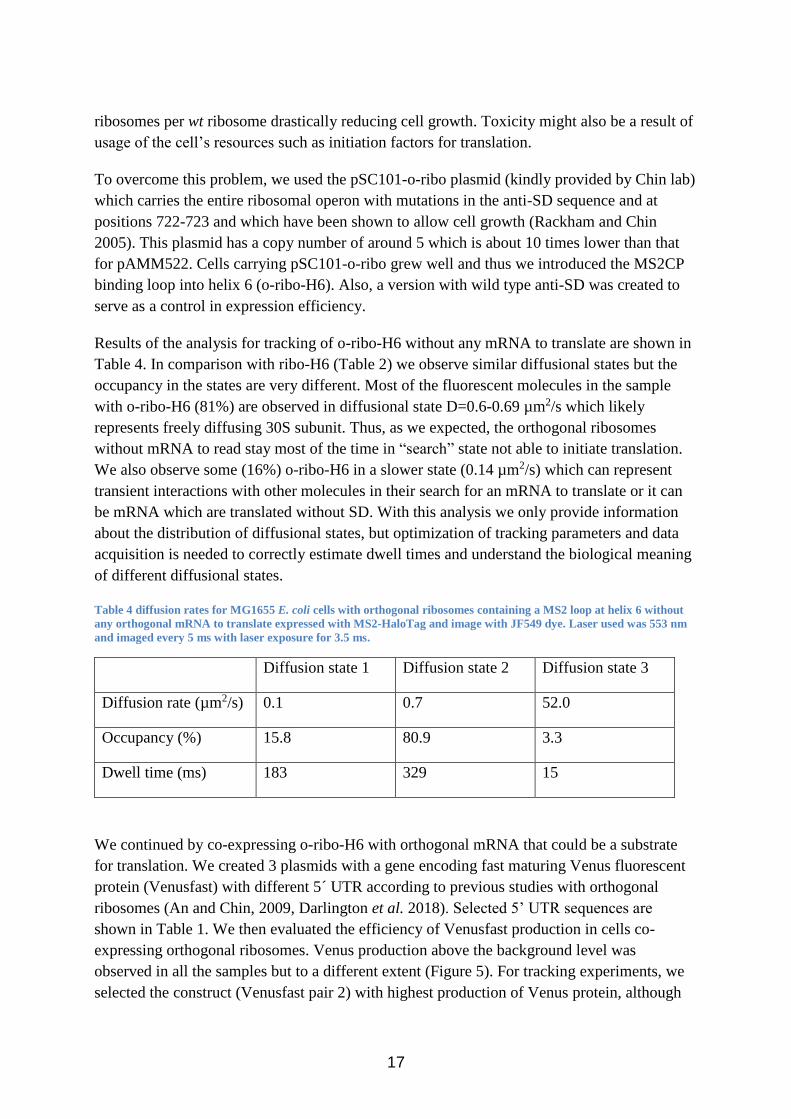
Results of the analysis for tracking of o-ribo-H6 without any mRNA to translate are shown in
Table 4. In comparison with ribo-H6 (Table 2) we observe similar diffusional states but the
occupancy in the states are very different. Most of the fluorescent molecules in the sample
with o-ribo-H6 (81%) are observed in diffusional state D=0.6-0.69 µm2/s which likely
represents freely diffusing 30S subunit. Thus, as we expected, the orthogonal ribosomes
without mRNA to read stay most of the time in “search” state not able to initiate translation.
We also observe some (16%) o-ribo-H6 in a slower state (0.14 µm2/s) which can represent
transient interactions with other molecules in their search for an mRNA to translate or it can
be mRNA which are translated without SD. With this analysis we only provide information
about the distribution of diffusional states, but optimization of tracking parameters and data
acquisition is needed to correctly estimate dwell times and understand the biological meaning
of different diffusional states.
Table 4 diffusion rates for MG1655 E. coli cells with orthogonal ribosomes containing a MS2 loop at helix 6 without
any orthogonal mRNA to translate expressed with MS2-HaloTag and image with JF549 dye. Laser used was 553 nm
and imaged every 5 ms with laser exposure for 3.5 ms.
Diffusion state 1 Diffusion state 2 Diffusion state 3
Diffusion rate (µm2/s) 0.1 0.7 52.0
Occupancy (%) 15.8 80.9 3.3
Dwell time (ms) 183 329 15
We continued by co-expressing o-ribo-H6 with orthogonal mRNA that could be a substrate
for translation. We created 3 plasmids with a gene encoding fast maturing Venus fluorescent
protein (Venusfast) with different 5´ UTR according to previous studies with orthogonal
ribosomes (An and Chin, 2009, Darlington et al. 2018). Selected 5’ UTR sequences are
shown in Table 1. We then evaluated the efficiency of Venusfast production in cells co-
expressing orthogonal ribosomes. Venus production above the background level was
observed in all the samples but to a different extent (Figure 5). For tracking experiments, we
selected the construct (Venusfast pair 2) with highest production of Venus protein, although

18
expression was only 1/6 of the expression of the Venus with 5’-UTR recognized by wild type
ribosomes (Figure 5C), which may reflect large difference in abundance of wt ribosomes and
orthogonal ribosomes.
Figure 5 A) Growth curves for three different 5´UTR sequences for pBAD24 o-Venusfast with pSC101 o-Ribo, one wt
Venusfast with pSC101-wt-ribo and one LB sample. B) Fluorescent measurements for the same samples as in A. C)
Comparison of o-Venusfast which gave the highest fluorescents and wt- Venusfast. With lines you can see the growth
and from filling the fluorescent intensity.

19
Using MG1655 E.coli cells expressing o-ribo-H6, MS2-HaloTag and orthogonal Venusfast
pair 2 we performed microscopy experiments and confirmed Venus expression with 514 nm
laser illumination. We then tracked labelled o-ribo-H6 using 553 nm laser. The results are
shown in Table 5. We observed higher abundance in the slowest state (43% in 0.07 µm2/s)
than previously when orthogonal ribosomes were tracked without any mRNA to translate. Yet
the occupancy is less compared to wt ribo-H6 which had an occupancy of 79% in the slowest
state (table 3). The possible explanation is that we did not saturate o-ribo-H6 with orthogonal
mRNAs, or that the 5´UTR is not optimal and does not allow fast translation initiation.
Table 5 diffusion rates for MG1655 E. coli cells with orthogonal ribosomes containing a MS2 loop at helix 6 with
orthogonal Venusfast pair 2 mRNA to translate expressed with MS2-HaloTag and image with JF549 dye. Laser used
was 553 nm and imaged every 5 ms with laser exposure for 3.5 ms.
Diffusion state 1 Diffusion state 2 Diffusion state 3
Diffusion rate (µm2/s) 0.1 0.7 39.5
Occupancy (%) 43.1 49.8 7.1
Dwell time (ms) 452 162 20
Same as in the sample with ribosomes with modified helix 6 and wt anti-SD, most transitions
from the slow state was towards the fastest state which is believed to be a tracking artefact.
Because of this, parameters in the analysis where changed from having a search radius of 20
pixels to a search radius of 4 pixels for tracking. By doing this the believed artefact could be
removed and dwell times were greatly increased (Table 6). Using the 4-pixel radius analysis
we see the 0.07 µm2/s state remain as before but the 0.67 µm2/s state in 20 pixels analysis has
become 0.49 µm2/s and 0.77 µm2/s separate states for the 4 pixels analysis. However, when
changing from a 3 state model to a 5 state model with 20 pixels search radius states similar to
what was seen for 4 pixels search radius can be observed. Tables can be found in the
Appendix table 8.
Table 6 diffusion rate given by analysing with 4 pixels search radius for MG1655 E. coli cells with orthogonal
ribosomes containing MS2 loop at helix 6 with orthogonal Venusfast pair 2 mRNA to translate expressed with MS2-
HaloTag and image with JF549 dye. Laser used was 553 nm and imaged every 5 ms with laser exposure for 3.5 ms.
Diffusion state 1 Diffusion state 2 Diffusion state 3
Diffusion rate (µm2/s) 0.1 0.5 0.8
Occupancy (%) 52.4 16.6 31.0
Dwell time (ms) 3804 6293 16634
20
4 Conclusion
Here we developed a method for tracking of ribosomes using MS2CP fused to Halotag by
introducing a MS2CP binding loop in the 16S RNA of the ribosome. The results presented
here shows great promise in being a tool for studying ribosomes and translation. The MS2CP
fused to Halotag does not seem to have any significant unspecific binding in E. coli. Usage of
Halotag in combination with the dye JF549 can provide very long trajectories in single
molecule studies opening good opportunities for studying translation using this method in the
future. One of the large problems when studying ribosomes and translation in vivo is that
ribosomes asynchronously translate the whole proteome with no information about which
protein is being translated. Here we address this challenge by using orthogonal ribosomes.
Further optimization of efficiency of apparent translation initiation is required for
development of the method into useful tool. We believe that optimisation of the 5´UTR of the
mRNA to translate, and adjustments in levels of expression of orthogonal ribosomes and
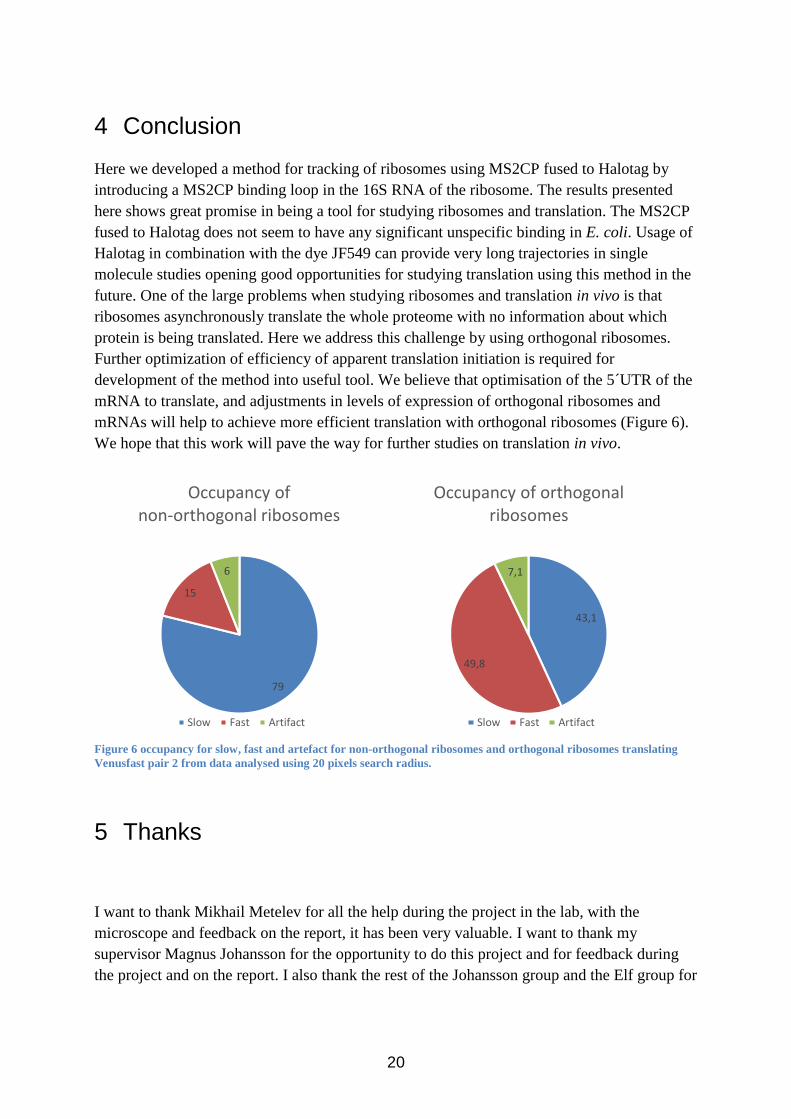
mRNAs will help to achieve more efficient translation with orthogonal ribosomes (Figure 6).
We hope that this work will pave the way for further studies on translation in vivo.
Figure 6 occupancy for slow, fast and artefact for non-orthogonal ribosomes and orthogonal ribosomes translating
Venusfast pair 2 from data analysed using 20 pixels search radius.
5 Thanks
I want to thank Mikhail Metelev for all the help during the project in the lab, with the
microscope and feedback on the report, it has been very valuable. I want to thank my
supervisor Magnus Johansson for the opportunity to do this project and for feedback during
the project and on the report. I also thank the rest of the Johansson group and the Elf group for
79
15
6
Occupancy ofnon-orthogonal ribosomes
Slow Fast Artifact
43,1
49,8
7,1
Occupancy of orthogonal ribosomes
Slow Fast Artifact

21
the help and making me feel welcome. The project idea originated from earlier work by Arvid
Gynnå in Elf group.

22
References
An, W. and Chin, J. (2009). Synthesis of orthogonal transcription-translation
networks. Proceedings of the National Academy of Sciences, 106(21), pp.8477-8482.
Banaz N., Makela J., Uphoff S. 2018. Choosing the right label for single-molecule tracking in
live bacteria: Side-by-side comparison of photoactivatable fluorescent protein and Halo tag
dyes. BioRxiv
Brar, G. and Weissman, J. (2015). Ribosome profiling reveals the what, when, where and how
of protein synthesis. Nature Reviews Molecular Cell Biology, 16(11), pp.651-664.
Chubiz, L. and Rao, C. (2008). Computational design of orthogonal ribosomes. Nucleic Acids
Research, 36(12), pp.4038-4046.
Darlington, A., Kim, J., Jiménez, J. and Bates, D. (2018). Dynamic allocation of orthogonal
ribosomes facilitates uncoupling of co-expressed genes. Nature Communications, 9(1).
Dorywalska M, Blanchard SC, Gonzalez RL, Kim HD, Chu S, Puglisi JD (2005). Site-
specific labeling of the ribosome for single-molecule spectroscopy. Nucleic Acids Research,
33(1), pp.182-189.
E. coli Genetic Resources at Yale CGSC, The Coli Genetic Stock Center. (n.d.). Strain -
SQ171. [online] Available at: https://cgsc2.biology.yale.edu/Strain.php?ID=122352
[Accessed 24 Oct. 2018].
Gibson, D., Young, L., Chuang, R., Venter, J., Hutchison, C. and Smith, H. (2009).
Enzymatic assembly of DNA molecules up to several hundred kilobases. Nature Methods,
6(5), pp.343-345.
Janelia.org. (2018). Janelia Fluor® Dyes | Janelia Research Campus. [online] Available at:
https://www.janelia.org/open-science/janelia-fluor-dyes [Accessed 20 Nov. 2018].
Johansson, H., Dertinger, D., LeCuyer, K., Behlen, L., Greef, C. and Uhlenbeck, O. (1998). A
thermodynamic analysis of the sequence-specific binding of RNA by bacteriophage
MS2CP. Proceedings of the National Academy of Sciences, 95(16), pp.9244-9249
Johansson, M. (2012). Rate and accuracy of bacterial protein synthesis. Uppsala: Acta
Universitatis Upsaliensis.
.
Kapanidis, A., Lepore, A. and El Karoui, M. (2018). Rediscovering Bacteria through Single-
Molecule Imaging in Living Cells. Biophysical Journal, 115(2), pp.190-202.
23
Macías, S., Bragulat, M., Tardiff, D. and Vilardell, J. (2008). L30 Binds the Nascent RPL30
Transcript to Repress U2 snRNP Recruitment. Molecular Cell, 30(6), pp.732-742.
McKinney, S., Murphy, C., Hazelwood, K., Davidson, M. and Looger, L. (2009). A bright
and photostable photoconvertible fluorescent protein. Nature Methods, 6(2), pp.131-133.
Michel, A. and Baranov, P. (2013). Ribosome profiling: a Hi-Def monitor for protein
synthesis at the genome-wide scale. Wiley Interdisciplinary Reviews: RNA, 4(5), pp.473-490.
Nagai, T., Ibata, K., Park, E., Kubota, M., Mikoshiba, K. and Miyawaki, A. (2002). A variant
of yellow fluorescent protein with fast and efficient maturation for cell-biological
applications. Nature Biotechnology, 20(1), pp.87-90.
New England Biolabs. (2018). Gibson Assembly® Master Mix. [online] Available at:
https://www.neb.com/products/e2611-gibson-assembly-master-
mix#Protocols%20&%20Manuals [Accessed 18 Dec. 2018].
Orelle, C., Carlson, E., Szal, T., Florin, T., Jewett, M. and Mankin, A. (2015). Protein
synthesis by ribosomes with tethered subunits. Nature, 524(7563), pp.119-124.
Peabody, D. and Lim, F. (1996). Complementation of RNA Binding Site Mutations in
MS2CP Heterodimers. Nucleic Acids Research, 24(12), pp.2352-2359.
Rackham, O. and Chin, J. (2005). A network of orthogonal ribosome·mRNA pairs. Nature
Chemical Biology, 1(3), pp.159-166.
Stracy, M., Uphoff, S., Garza de Leon, F. and Kapanidis, A. (2014). In vivo single-molecule
imaging of bacterial DNA replication, transcription, and repair. FEBS Letters, 588(19),
pp.3585-3594.
Volkov, I. and Johansson, M. (2018). Single-Molecule Tracking Approaches to Protein
Synthesis Kinetics in Living Cells. Biochemistry.
Volkov, I., Lindén, M., Aguirre Rivera, J., Ieong, K., Metelev, M., Elf, J. and Johansson, M.
(2018). tRNA tracking for direct measurements of protein synthesis kinetics in live
cells. Nature Chemical Biology, 14(6), pp.618-626.
Yan, X., Hoek, T., Vale, R. and Tanenbaum, M. (2016). Dynamics of Translation of Single
mRNA Molecules In Vivo. Cell, 165(4), pp.976-989.

24
Appendix A
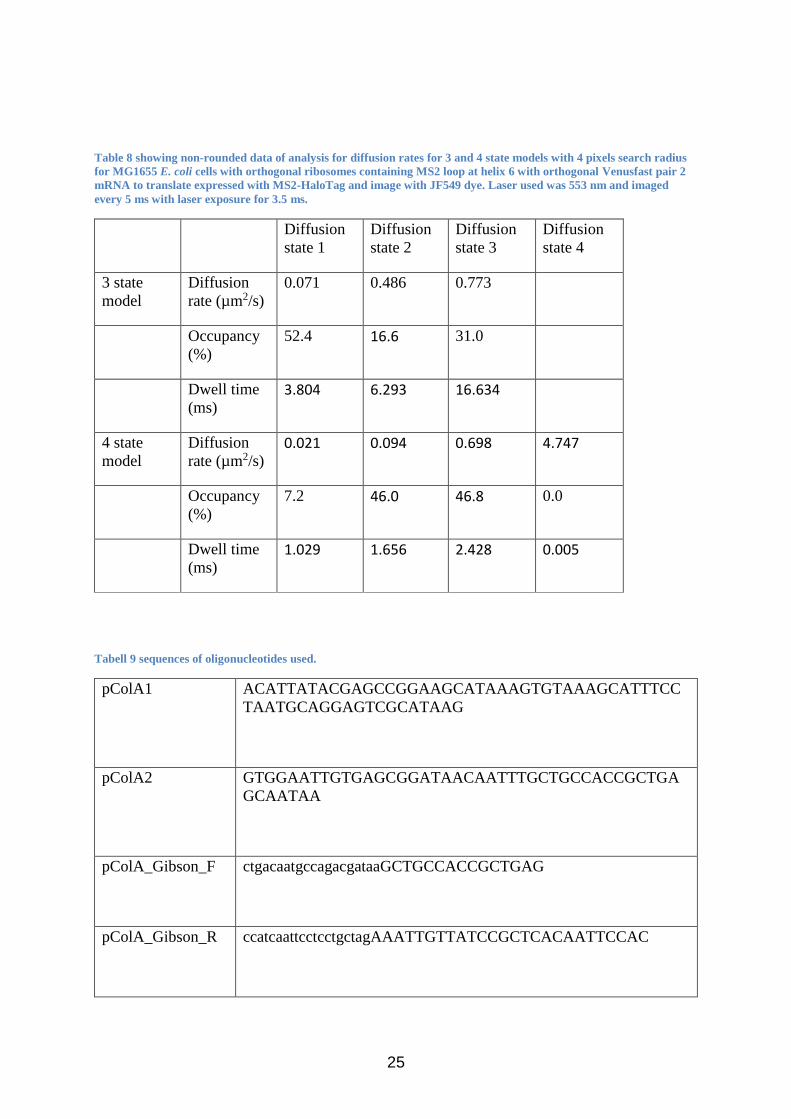
Table 7 showing non-rounded data of analysis for diffusion rates for 3, 4 and 5 state models with 20 pixels search
radius for MG1655 E. coli cells with orthogonal ribosomes containing MS2 loop at helix 6 with orthogonal Venusfast
pair 2 mRNA to translate expressed with MS2-HaloTag and image with JF549 dye. Laser used was 553 nm and
imaged every 5 ms with laser exposure for 3.5 ms.
Diffusion
state 1
Diffusion
state 2
Diffusion
state 3
Diffusion
state 4
Diffusion
state 5
3 state
model
Diffusion
rate (µm2/s)
0.070 0.667 39.526
Occupancy
(%)
43.1 49.8 7.1
Dwell time
(ms) 0.452 0.162 0.020
4 state
model
Diffusion
rate (µm2/s) 0.068 0.634 7.750 53.939
Occupancy
(%) 42.5 48.6 4.7 4.3
Dwell time
(ms) 0.436 0.199 0.080 0.015
5 state
model
Diffusion
rate (µm2/s) 0.060 0.413 0.759 4.057 52.503
Occupancy
(%) 41.7 21.4 29.3 3.0 4.7
Dwell time
(ms) 0.950 0.101 1.015 0.075 0.013
25
Table 8 showing non-rounded data of analysis for diffusion rates for 3 and 4 state models with 4 pixels search radius
for MG1655 E. coli cells with orthogonal ribosomes containing MS2 loop at helix 6 with orthogonal Venusfast pair 2
mRNA to translate expressed with MS2-HaloTag and image with JF549 dye. Laser used was 553 nm and imaged
every 5 ms with laser exposure for 3.5 ms.
Diffusion
state 1
Diffusion
state 2
Diffusion
state 3
Diffusion
state 4
3 state
model
Diffusion
rate (µm2/s)
0.071 0.486 0.773
Occupancy
(%)
52.4 16.6 31.0
Dwell time
(ms) 3.804 6.293 16.634
4 state
model
Diffusion
rate (µm2/s) 0.021 0.094 0.698 4.747
Occupancy
(%)
7.2 46.0 46.8 0.0
Dwell time
(ms) 1.029 1.656 2.428 0.005
Tabell 9 sequences of oligonucleotides used.
pColA1 ACATTATACGAGCCGGAAGCATAAAGTGTAAAGCATTTCC
TAATGCAGGAGTCGCATAAG
pColA2 GTGGAATTGTGAGCGGATAACAATTTGCTGCCACCGCTGA
GCAATAA
pColA_Gibson_F ctgacaatgccagacgataaGCTGCCACCGCTGAG
pColA_Gibson_R ccatcaattcctcctgctagAAATTGTTATCCGCTCACAATTCCAC

26
MCPd_Gibson_F TTGTGAGCGGATAACAATTTctagcaggaggaattgatggcttct
MCPd_Gibson_R tctggcttaatcgcactcatgcagaagggggatccgtagat
mEos2_Gisbson_F tctacggatcccccttctgcatgagtgcgattaagccagacatg
mEos2_Gisbson_R TATTGCTCAGCGGTGGCAGCttatcgtctggcattgtcaggcaa
rrnB_Gibson_F GATACTGAGCACGGGTACCGgccgctgagaaaaagcgaag
rrnB_Gibson_R CGCACATTTCCCGGCGCGCCggcttgtagatatgacgacaggaagag
pAM552_Gibson_
R
cttcgctttttctcagcggcCGGTACCCGTGC
pAM552_Gibson_
F2
tgtcgtcatatctacaagccGGCGCGCCGGGAAATGTGCGCG
H6_MS2_F ACTAGTTTTGATGAGGATcACCCATCTTTACTAGTcttctttgctga
cgagtggcg
H6_R cttcttcctgttaccgttcgacttg
H10_ MS2_F ACTAGTTTTGATGAGGATcACCCATCTTTACTAGTggcctcttgcc
atcggatgtg
H10_R ggtccccctctttggtcttgcg
H33b_MS2_F ACTAGTTTTGATGAGGATcACCCATCTTTACTAGTggaaccgtga
gacaggtgctgc
H33b_R ggcacattctcatctctgaaaac
H39_MS2_F ACTAGTTTTGATGAGGATcACCCATCTTTACTAGTccgggaactc
aaaggagactgcc

27
H39_R ccgctggcaacaaaggataaggg;
H44_MS2_F ACTAGTTTTGATGAGGATcACCCATCTTTACTAGTggagggcgct
taccactttgtg
H44_R ggttaagctacctacttcttttgc
pColA_lacIq_F aCCATTCGATGGTGTCCGGGAT
pColA_lacIq_R GCAAAACCTTTCGCGGTATGGC
HaloTag_Gibson_
F
tctacggatcccccttctgcgcagaaatcggtactggctttcc
HaloTag_Gibson_
R
TATTGCTCAGCGGTGGCAGCctagccggaaatctcgagcg
pColAMS2d_Gibs
onHalo_F
cgctcgagatttccggctagGCTGCCACCGCTGAGC
pColAMs2d_Gibso
nHalo_R
aagccagtaccgatttctgcgcagaagggggatccgtaga
ribo722_CAmut_F CAggcgaaggcggccccctgga
ribo721_R cggtattcctccagatctctacgc
riboSDorthogonal_
F
TGGGAttaccttaaagaagcgtactttgtagtgc
riboSD_R tgatccaaccgcaggttccccta
pBADoVenus_pair
1_F
AAAGGTCTCCCGCTTTCAcatccctCCGCAAatgagtaaaggagaagaact
tttcactgg
pBADoVenus_pair
1_R
CCCgGAGTAGGTCTCAAGCGGCCGCTgtatggagaaacagtagagagttg
cg
pBADoVenus_pair
2_F;
ACAATTTTCATATCCCTCCGCAAatgagtaaaggagaagaacttttcactgg
pBADoVenus_pair
2_R
tagcccaaaaaaacgggtatggagaaa
pBADoVenus_pair
2_2_F
ATATCCCTCCGCAAatgagtaaaggagaagaacttttcactgg

28
AraC_15aori_Gib_
F
tcgataagcttggtacccaaccaattatgacaacttgacggct
Venus_rrnBt_Gib_
R
atccgccaaaacagccaagcaagcttttatttgtatagttcatccatgcca
rrnBt_Gib_F aactatacaaataaaagcttgcttggctgttttggcgg
rrnBt_Gib_R ccgttctgccctgctgaactaacaaaagagtttgtagaaacgcaaaaagg
p15aOri_F agattacgcgcagaccaaaacg
oSD_VenusFast_F TTTCACATCCCTCCGCAAatgagtaaaggagaagaacttttcactgg
oSD_VenusFast_R cccaaaaaaacgggtatggagaaacag
pEvol_Gib_F tttctacaaactcttttgttagttcagcagggcagaacgg
pEvol_Gib_R cgtcaagttgtcataattggttgggtaccaagcttatcga
rrb_Gibson_foroS
D_F
gtgaggctgaagagaataaggccgttcgcttt
rrb_Gibson_foroS
D_R
tcagatgcagttcccaggttgagcccggggat
oSDfragment_Gibs
on_F
gatgtgaaatccccgggctcaacctgggaactgcatctgatact
oSDfragment_Gibs
on_R
attaatagaaagcgaacggccttattctcttcagcctcactcccaac
p15CAM_Gibson_Ha
lo_F cgctcgagatttccggctagaagcttgcttggctgttttgg;25nm;STD
p15CAM_Gibson_lac
I_R CTGGAAAGCGGGCAGTGAGCttggttgggtaccaagcttatcgatga
MS2Halo_Gibson_p1
5CAM_F taagcttggtacccaaccaaGCTCACTGCCCGCTTTCC
MS2Halo_Gibson_p1
5CAM_R caaaacagccaagcaagcttctagccggaaatctcgagcg

29
Figure 7 p15acam-MS2CP-halotag plasmid used to express MS2CP-Halotag with orthogonal ribosomes.

30
Figure 8 pBAD24- Venusfast plasmid used to express mRNA to test orthogonal ribosomes.

31
Figure 9 showing pAMM552 which was used to express non-orthogonal ribosomes.

32
Figure 10 pCOLA plasmid used to express MS2CP-Venus, versions of this plasmid with Venus exchanged to mEos2
and Halotag were also constructed.