Embed Size (px)
Citation preview

LabWrite Study
This study was driven by two primary hypotheses, that laboratory students using
the instructional materials of LabWrite will: (1) learn the scientific concepts the lab is
designed to teach more effectively than students using the traditional instruction in
writing lab reports and (2) learn to apply the elements of scientific reasoning more
effectively than students using the traditional instruction in writing lab reports. A third
hypothesis is that students using LabWrite will develop a more positive attitude toward
lab reports than students using the traditional instruction.
Method
Experimental Design
Participants in the study were North Carolina State University students registered
for Biology 183, the second of a two-course introduction to biology for biology and
other life science majors. The Biological Sciences program offers both courses every
semester; students are not required to take Biology 183 immediately following the first
course, Biology 181. Both courses are taught in the typical lecture/laboratory format,
one or two large lecture sections with students divided into laboratory sections of about
20 students per section. In the labs, students write traditional lab reports.
The study was quasi-experimental with a posttest-only control-group design
(Campbell & Stanley, 1966). The control group was comprised of students registered
for Biology 183 in Fall semester, 2000, the treatment group in Spring semester, 2001
(students had no knowledge of the study upon registration). Treatment instruction was
made available to all Biology 183 students in the Spring semester; however, in order to
limit possible teacher variable, the study focused on approximately 80 students from 4
lab sections in each semester. Control and treatment students were taught by the same
professor in the lecture sections and the same 2 instructors in the labs (each instructor
having 2 sections), with identical course syllabi, labs, and assigned lab reports.
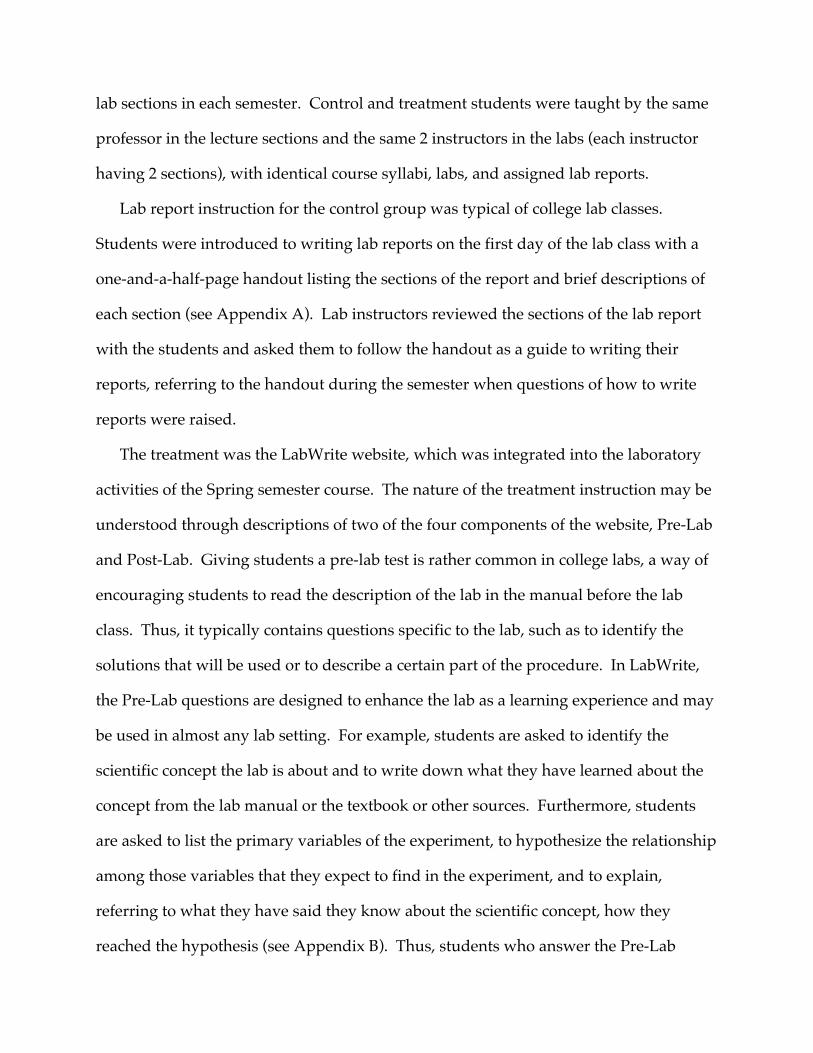
Lab report instruction for the control group was typical of college lab classes.
Students were introduced to writing lab reports on the first day of the lab class with a
one-and-a-half-page handout listing the sections of the report and brief descriptions of
each section (see Appendix A). Lab instructors reviewed the sections of the lab report
with the students and asked them to follow the handout as a guide to writing their
reports, referring to the handout during the semester when questions of how to write
reports were raised.
The treatment was the LabWrite website, which was integrated into the laboratory
activities of the Spring semester course. The nature of the treatment instruction may be
understood through descriptions of two of the four components of the website, Pre-Lab
and Post-Lab. Giving students a pre-lab test is rather common in college labs, a way of
encouraging students to read the description of the lab in the manual before the lab
class. Thus, it typically contains questions specific to the lab, such as to identify the
solutions that will be used or to describe a certain part of the procedure. In LabWrite,
the Pre-Lab questions are designed to enhance the lab as a learning experience and may
be used in almost any lab setting. For example, students are asked to identify the
scientific concept the lab is about and to write down what they have learned about the
concept from the lab manual or the textbook or other sources. Furthermore, students
are asked to list the primary variables of the experiment, to hypothesize the relationship
among those variables that they expect to find in the experiment, and to explain,
referring to what they have said they know about the scientific concept, how they
reached the hypothesis (see Appendix B). Thus, students who answer the Pre-Lab
Questionnaire should be well prepared to take advantage of the learning opportunity
offered by the lab experience. In Biology 183, students were required to do the Pre-Lab
before each major lab.
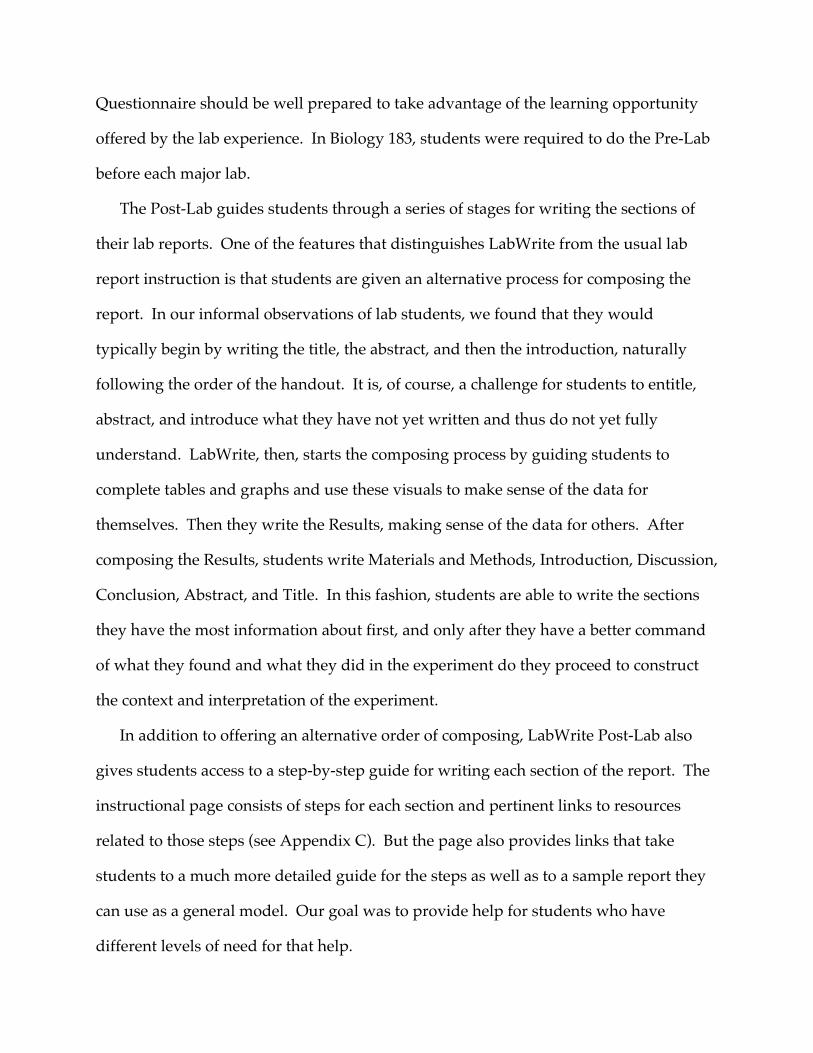
The Post-Lab guides students through a series of stages for writing the sections of
their lab reports. One of the features that distinguishes LabWrite from the usual lab
report instruction is that students are given an alternative process for composing the
report. In our informal observations of lab students, we found that they would
typically begin by writing the title, the abstract, and then the introduction, naturally
following the order of the handout. It is, of course, a challenge for students to entitle,
abstract, and introduce what they have not yet written and thus do not yet fully
understand. LabWrite, then, starts the composing process by guiding students to
complete tables and graphs and use these visuals to make sense of the data for
themselves. Then they write the Results, making sense of the data for others. After
composing the Results, students write Materials and Methods, Introduction, Discussion,
Conclusion, Abstract, and Title. In this fashion, students are able to write the sections
they have the most information about first, and only after they have a better command
of what they found and what they did in the experiment do they proceed to construct
the context and interpretation of the experiment.
In addition to offering an alternative order of composing, LabWrite Post-Lab also
gives students access to a step-by-step guide for writing each section of the report. The
instructional page consists of steps for each section and pertinent links to resources
related to those steps (see Appendix C). But the page also provides links that take
students to a much more detailed guide for the steps as well as to a sample report they
can use as a general model. Our goal was to provide help for students who have
different levels of need for that help.
Instruction for treatment students was given only by their biology lab instructors.
The instructors themselves received a one-hour workshop on how to use LabWrite and
how to introduce students to LabWrite. The introduction was given in the first lab class
meeting of the semester, consisting of an overview of the scientific method, a review of
the sections of a professional scientific paper, a discussion of the connection between
the scientific method and the sections of the scientific paper, a description of the
sections required in the lab report, and a tour of the LabWrite website (each lab table
provided access to computers). Beyond the introduction, instruction consisted of
assigning and grading Pre-Lab questions, reminding students to use the website at
appropriate times, and using the LabWrite rubric to grade the reports. Because the
LabWrite site provided the primary source of instruction, no special expertise in the
genre of the lab report was required of the instructors beyond grading the reports.
Because of the quasi-experimental design with control and treatment groups in
different semesters (in order to guarantee an untainted control group, given that
students in the same lecture section were likely to discuss different lab pedagogies),
both groups were given portions of the “Test of Science-Related Attitudes” (TOSRA) to
identify any significant differences in their attitudes toward science that could account
for differences in the results of the study. Developed by Fraser (1981), the TOSRA is a
70-item Likert-type test with 7 separate subscales. Scales 3 and 5 (10 items each) were
chosen for this survey, measuring attitude toward scientific inquiry and enjoyment of
science lessons, respectively. These scales were selected because they seemed to have
more relevance to this study and because they measure distinctly different dimensions
of science-related attitudes, as shown by previous studies (Schibeci & McGaw, 1981). In
addition, students were surveyed for demographic information that might reveal
significant pre-existent differences between the groups: academic class, major, number
of science courses taken, expected grade in Biology 183, and number of writing courses
taken.
No significant differences were found in the scores of the TOSRA (subscale 3, p=.92;
subscale 5, p=.41). The demographic survey revealed 2 significant differences (see
Table 1). First, students in the control group were higher in academic class (p<.0001).
Whereas the majority of students in the control group were sophomores, the majority in
the treatment group were freshmen (54% in each academic class; the control group also
had higher percentages of juniors and seniors). This difference may be accounted for by
differences in the students’ curriculum: students in the Fall semester section typically
take Biology 181 in the previous Spring semester and are therefore more likely to be
sophomores. The second significant difference was that the control group had taken
more science courses (p<.01), which can also be explained by their higher academic
class. Thus, whereas the TOSRA suggests similar attitudes in both groups toward
scientific inquiry and enjoyment of science lessons, the demographic survey suggests
significant differences that would seem to bias performance in Biology 183 labs in favor
of the control group.
Data Collection and Analysis
Data for testing hypotheses 1 and 2 consisted of copies of student lab reports
collected from the control and treatment groups throughout both semesters. Students
turned in two copies of their reports, one for themselves and one for their laboratory
instructors to keep for the study. Students’ names were blacked out and reports were
numbered. Random samples of control and treatment reports were selected for scoring
from each group (n=44).
Hypothesis 1, related to students’ learning the scientific concepts that the
experiments were intended to reinforce, was tested by a holistic analysis of the data
(White, 1985). Three raters were selected, on a voluntary basis, from a pool of
instructors, all of whom had taught introductory biology lab courses and were familiar
with the laboratory investigations in this course. The raters evaluated equally sized
random samples of reports from two different lab experiments as a way of ensuring that
there was no bias toward the scientific concept of either lab. Raters were trained to
grade the reports according to the degree to which they indicated that the writers
learned the scientific concepts of the labs, using a scale of 1-5 (low to high). Laboratory
1, for example, was focused on the concept of photosynthesis; the raters evaluated those
reports by how well the students appeared to have understood photosynthesis. Two
raters graded each report, and when graders disagreed, a third rater broke the tie.
Before raters began scoring, they calibrated with each other to establish a baseline at
each level of the scale (Huot, 1990). A two-way analysis of variance was used to
measure any group differences in evaluations.
Hypothesis 2, related to students’ ability to apply the elements of scientific
reasoning, was tested by a primary-trait analysis of the data. Primary-trait scoring is
designed to assess a writer’s ability to achieve the purpose of a particular writing task
by evaluating the key textual features that are closely tied to that purpose (Lloyd-Jones,
1977; Huot, 1990). In this study, the textual features are those that are identified with
effective scientific reasoning (AAAS, 1989; Kirscht, et al., 1994). Nine traits of scientific
reasoning were selected and described in the form of a rubric (see Appendix D).
Two raters, both science teachers, were trained to use the rubric in evaluating a
random sample of reports (n=40 per group) from laboratory 3, chosen because it was
the final single-authored lab report of the semester and would presumably represent

the students’ best work. The raters graded each trait on a four-point scale: 4=superior,
3=fair, 2=poor, and 1=not applicable (trait was not present in the report). Training
consisted of modeling the use of the rubric for the raters and having the raters grade
sample reports to attain relative consistency. Raters were calibrated periodically
throughout the session to ensure continued consistency. Agreement between
evaluators was determined using a basic formula for inter-rater reliability (number of
agreements/number of opportunities for agreement) as well as a polychoric correlation
coefficient, which accounts for consistency trends in individual raters (Olsson, 1979).
One-way analysis of variance was used to determine group differences for each of the
primary traits and the composite trait scores.
The third hypothesis, related to overall attitude toward laboratory reports, was
tested with a survey. Because there are no instruments that measure college students’
attitude toward lab reports, a survey was designed for this study. The instrument,
composed of 22 Likert-type items, addressed students’ positive or negative impressions
of lab reports, confidence and enjoyment in writing them, usefulness of learning to
write them, etc. (see Appendix E). Surveys were issued at the end of each semester, and
data were obtained from both control and treatment groups (n=60 for each group).
Surveys were anonymous. Composite scores (the sum of student ratings for all the
items) for both groups were tabulated. A one-way analysis of variance (ANOVA)
compared between-group differences. Cronbach’s alpha was also calculated to
establish reliability for each item of the survey, a way of assessing the validity of the
survey.
Results
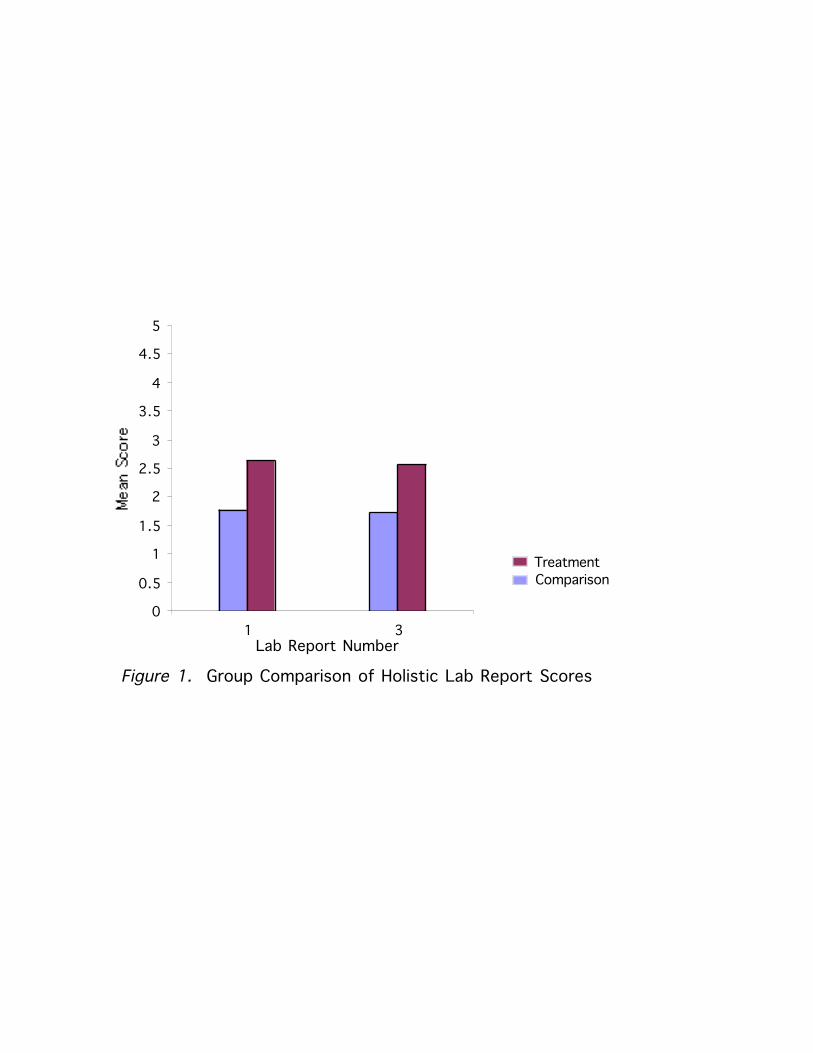
All three hypotheses were supported (see Table 1). First, the holistic analysis of lab
reports suggests that students using LabWrite learned the science of the labs more
effectively than students using normal instructional materials (p<.003). As Figure 1
indicates, the difference between groups was essentially the same for both lab reports 1
and 3, suggesting that LabWrite students learned the scientific concepts of the labs
independent of what those concepts were.
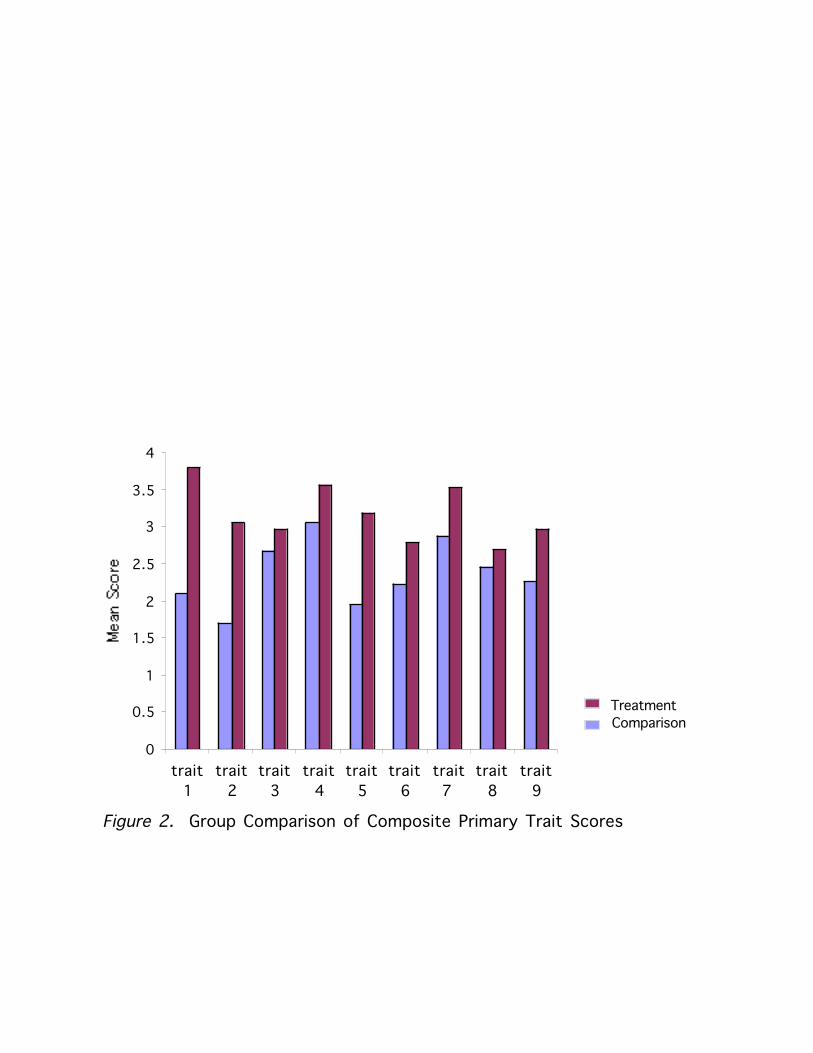
The treatment group was also judged to be significantly more effective in applying
scientific reasoning to the lab experiment (p<.0001). Between-group comparisons of
mean scores for each of the 9 primary traits that we associated with effective scientific
reasoning showed that LabWrite students scored higher in every trait (see Fig. 2).
Interrater reliability for the primary-trait analysis was .70, which is acceptable in writing
studies (Lauer and Asher, 1988). However, results from the polychoric test established
the overall reliability at .93, indicating a very high level of consistency between raters.
The polychoric correlation coefficient per item ranged from .74 to .99, for traits 8 and 1
respectively.
For the third hypothesis, students using LabWrite demonstrated a significantly more
positive attitude toward lab reports than students in the control group (p<.01). Overall
internal consistency of items on the attitudes survey created for this study was high,
with a Cronbach’s coefficient=.91, supporting reliability and content validity of the
instrument.
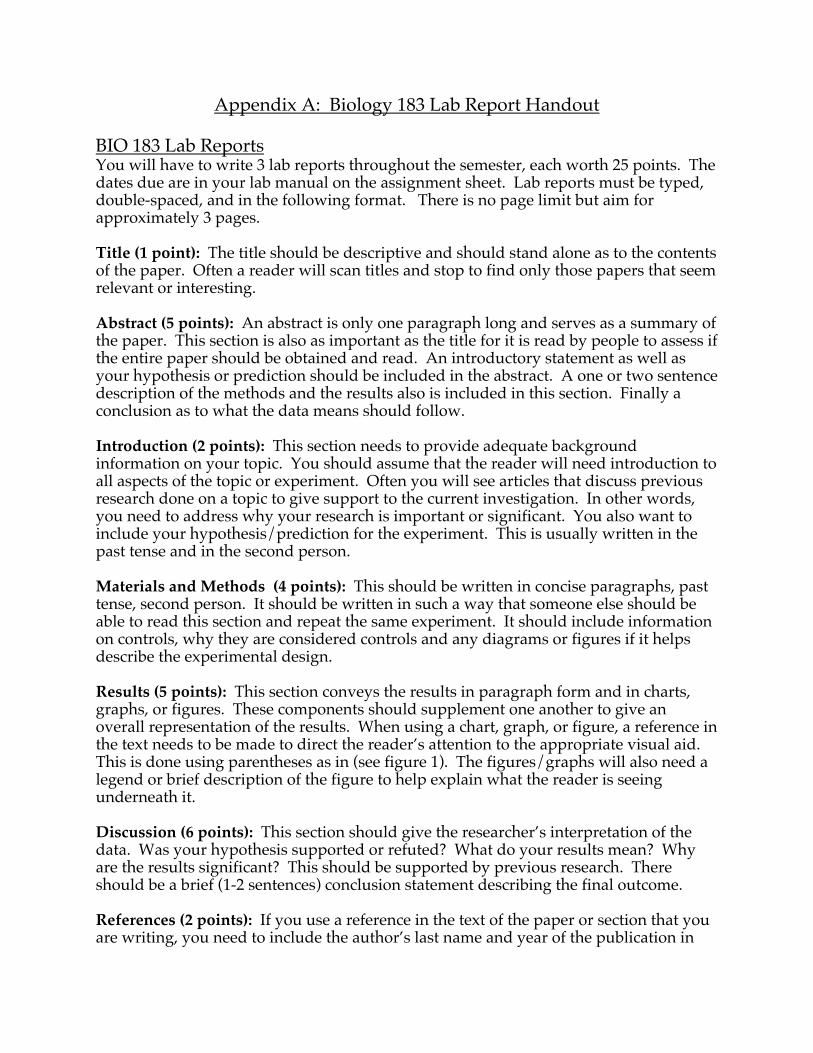
Appendix A: Biology 183 Lab Report Handout
BIO 183 Lab ReportsYou will have to write 3 lab reports throughout the semester, each worth 25 points. Thedates due are in your lab manual on the assignment sheet. Lab reports must be typed,double-spaced, and in the following format. There is no page limit but aim forapproximately 3 pages.
Title (1 point): The title should be descriptive and should stand alone as to the contentsof the paper. Often a reader will scan titles and stop to find only those papers that seemrelevant or interesting.
Abstract (5 points): An abstract is only one paragraph long and serves as a summary ofthe paper. This section is also as important as the title for it is read by people to assess ifthe entire paper should be obtained and read. An introductory statement as well asyour hypothesis or prediction should be included in the abstract. A one or two sentencedescription of the methods and the results also is included in this section. Finally aconclusion as to what the data means should follow.
Introduction (2 points): This section needs to provide adequate backgroundinformation on your topic. You should assume that the reader will need introduction toall aspects of the topic or experiment. Often you will see articles that discuss previousresearch done on a topic to give support to the current investigation. In other words,you need to address why your research is important or significant. You also want toinclude your hypothesis/prediction for the experiment. This is usually written in thepast tense and in the second person.
Materials and Methods (4 points): This should be written in concise paragraphs, pasttense, second person. It should be written in such a way that someone else should beable to read this section and repeat the same experiment. It should include informationon controls, why they are considered controls and any diagrams or figures if it helpsdescribe the experimental design.
Results (5 points): This section conveys the results in paragraph form and in charts,graphs, or figures. These components should supplement one another to give anoverall representation of the results. When using a chart, graph, or figure, a reference inthe text needs to be made to direct the reader’s attention to the appropriate visual aid.This is done using parentheses as in (see figure 1). The figures/graphs will also need alegend or brief description of the figure to help explain what the reader is seeingunderneath it.
Discussion (6 points): This section should give the researcher’s interpretation of thedata. Was your hypothesis supported or refuted? What do your results mean? Whyare the results significant? This should be supported by previous research. Thereshould be a brief (1-2 sentences) conclusion statement describing the final outcome.
References (2 points): If you use a reference in the text of the paper or section that youare writing, you need to include the author’s last name and year of the publication in

parentheses (Smith 1998). If two people are authors, both last names should beincluded. If three or more people are authors, only the first author’s name appearsfollowed by the words “et al.” and the year of publication. For these lab reports, thereshouldn’t have to be any outside research. So the only references that are required arethe lab manual and possibly your textbook.
Campbell, N.A., J.B. Reece, and L.G. Mitchell. 1999. Biology, fifth edition. AddisonWesley Longman, Menlo, CA.

Appendix B: Pre-Lab Questionnaire
Name: _____________________
Date: ______________________
Lab Section: ________________
Lab Title ___________________ 1. Establishing the learning context for the lab. a. What is the scientific principle (theory or concept) that you are supposed to be
learning about by doing the lab? (You'll probably be able to figure this out bychecking the lab manual for the title of the lab and the introduction to the lab.)
b. Write down everything you can find out about this scientific principle. (Look at thelab manual, class notes, textbook, handouts.)
2. Establishing the goals of the lab. a. List the objectives for the lab. (The objectives are the concrete acts you are supposed
to perform in the lab, such as to measure something, to analyze something, todetermine something, to test something, etc. You'll probably find them presented inthe lab manual.)
b. In a sentence or two, give the purpose of the lab. (The purpose tells how achievingthe objectives of the lab will help you to learn about the scientific principle the lab isabout.)
3. Establishing your hypothesis for the lab.
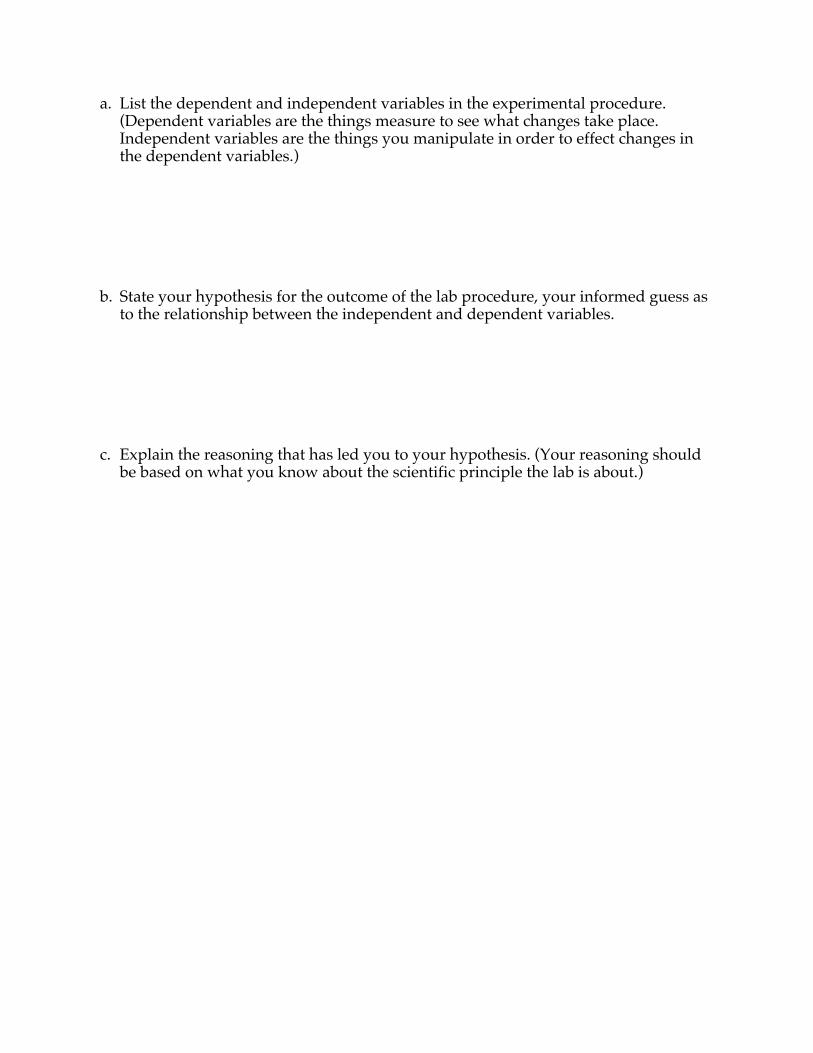
a. List the dependent and independent variables in the experimental procedure.(Dependent variables are the things measure to see what changes take place.Independent variables are the things you manipulate in order to effect changes inthe dependent variables.)
b. State your hypothesis for the outcome of the lab procedure, your informed guess asto the relationship between the independent and dependent variables.
c. Explain the reasoning that has led you to your hypothesis. (Your reasoning shouldbe based on what you know about the scientific principle the lab is about.)
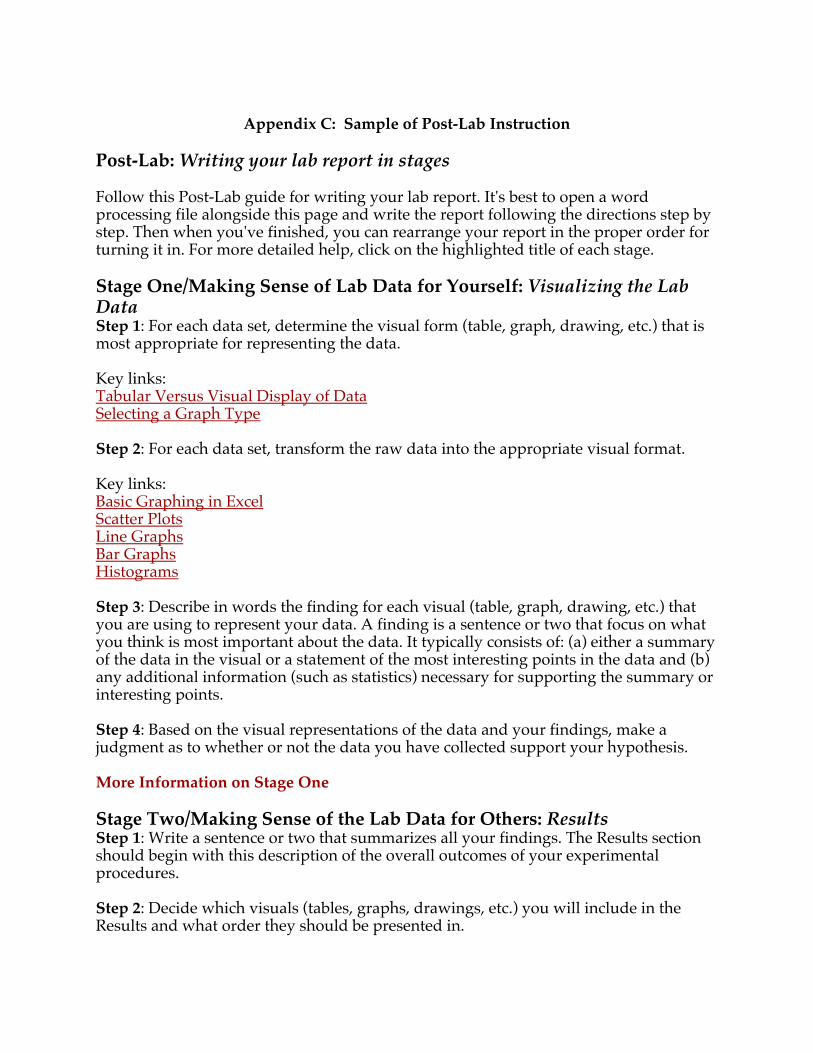
Appendix C: Sample of Post-Lab Instruction
Post-Lab: Writing your lab report in stages
Follow this Post-Lab guide for writing your lab report. It's best to open a wordprocessing file alongside this page and write the report following the directions step bystep. Then when you've finished, you can rearrange your report in the proper order forturning it in. For more detailed help, click on the highlighted title of each stage.
Stage One/Making Sense of Lab Data for Yourself: Visualizing the LabDataStep 1: For each data set, determine the visual form (table, graph, drawing, etc.) that ismost appropriate for representing the data.
Key links:Tabular Versus Visual Display of DataSelecting a Graph Type
Step 2: For each data set, transform the raw data into the appropriate visual format.
Key links:Basic Graphing in ExcelScatter PlotsLine GraphsBar GraphsHistograms
Step 3: Describe in words the finding for each visual (table, graph, drawing, etc.) thatyou are using to represent your data. A finding is a sentence or two that focus on whatyou think is most important about the data. It typically consists of: (a) either a summaryof the data in the visual or a statement of the most interesting points in the data and (b)any additional information (such as statistics) necessary for supporting the summary orinteresting points.
Step 4: Based on the visual representations of the data and your findings, make ajudgment as to whether or not the data you have collected support your hypothesis.
More Information on Stage One
Stage Two/Making Sense of the Lab Data for Others: ResultsStep 1: Write a sentence or two that summarizes all your findings. The Results sectionshould begin with this description of the overall outcomes of your experimentalprocedures.
Step 2: Decide which visuals (tables, graphs, drawings, etc.) you will include in theResults and what order they should be presented in.
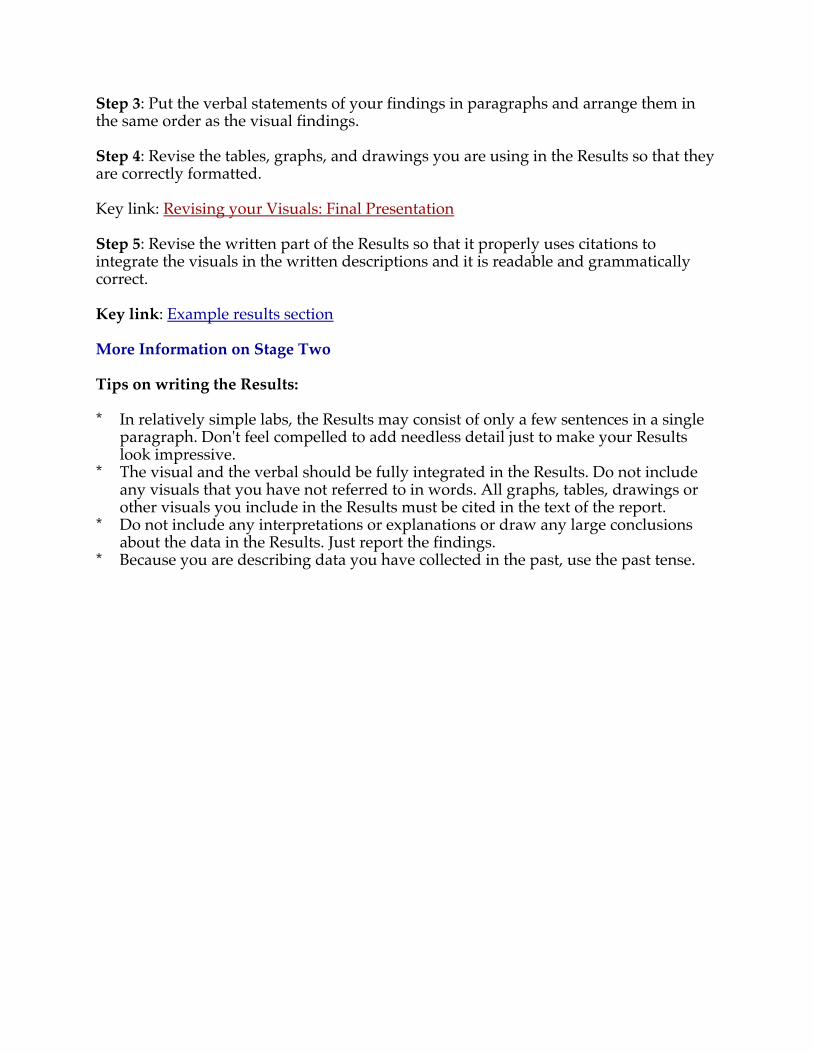
Step 3: Put the verbal statements of your findings in paragraphs and arrange them inthe same order as the visual findings.
Step 4: Revise the tables, graphs, and drawings you are using in the Results so that theyare correctly formatted.
Key link: Revising your Visuals: Final Presentation
Step 5: Revise the written part of the Results so that it properly uses citations tointegrate the visuals in the written descriptions and it is readable and grammaticallycorrect.
Key link: Example results section
More Information on Stage Two
Tips on writing the Results:
* In relatively simple labs, the Results may consist of only a few sentences in a singleparagraph. Don't feel compelled to add needless detail just to make your Resultslook impressive.
* The visual and the verbal should be fully integrated in the Results. Do not includeany visuals that you have not referred to in words. All graphs, tables, drawings orother visuals you include in the Results must be cited in the text of the report.
* Do not include any interpretations or explanations or draw any large conclusionsabout the data in the Results. Just report the findings.
* Because you are describing data you have collected in the past, use the past tense.
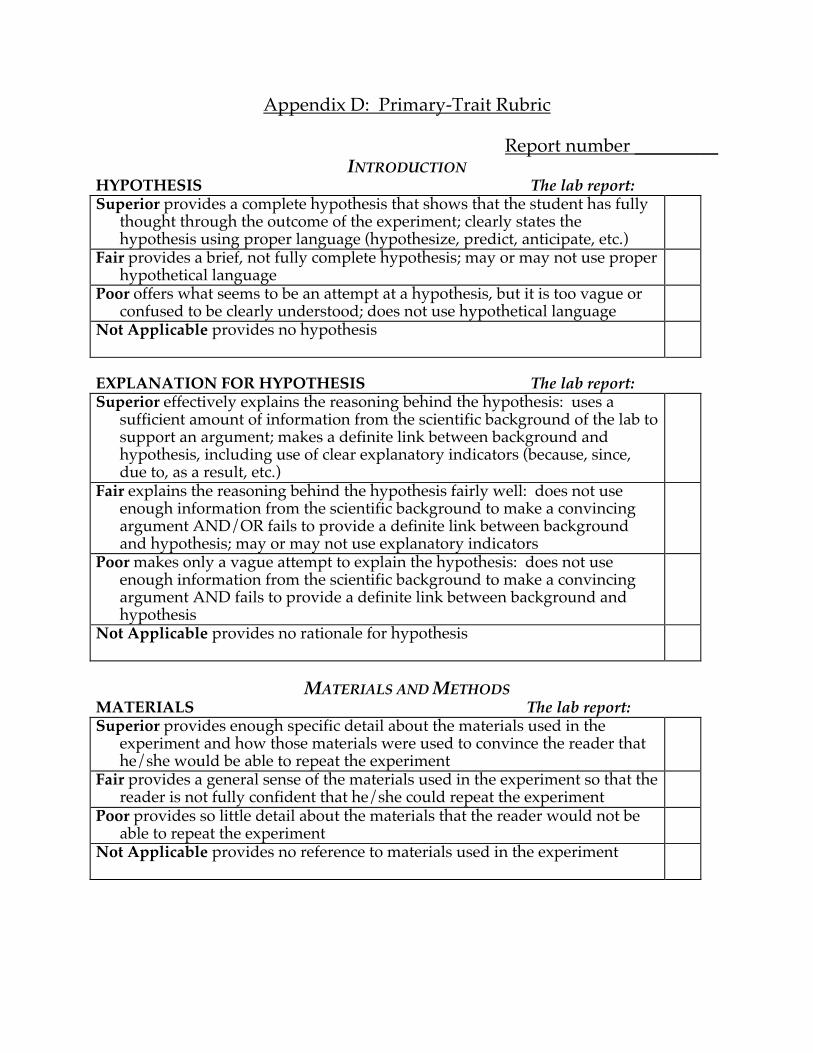
Appendix D: Primary-Trait Rubric
Report number _________INTRODUCTION
HYPOTHESIS The lab report:Superior provides a complete hypothesis that shows that the student has fully
thought through the outcome of the experiment; clearly states thehypothesis using proper language (hypothesize, predict, anticipate, etc.)
Fair provides a brief, not fully complete hypothesis; may or may not use properhypothetical language
Poor offers what seems to be an attempt at a hypothesis, but it is too vague orconfused to be clearly understood; does not use hypothetical language
Not Applicable provides no hypothesis
EXPLANATION FOR HYPOTHESIS The lab report:Superior effectively explains the reasoning behind the hypothesis: uses a
sufficient amount of information from the scientific background of the lab tosupport an argument; makes a definite link between background andhypothesis, including use of clear explanatory indicators (because, since,due to, as a result, etc.)
Fair explains the reasoning behind the hypothesis fairly well: does not useenough information from the scientific background to make a convincingargument AND/OR fails to provide a definite link between backgroundand hypothesis; may or may not use explanatory indicators
Poor makes only a vague attempt to explain the hypothesis: does not useenough information from the scientific background to make a convincingargument AND fails to provide a definite link between background andhypothesis
Not Applicable provides no rationale for hypothesis
MATERIALS AND METHODSMATERIALS The lab report:Superior provides enough specific detail about the materials used in the
experiment and how those materials were used to convince the reader thathe/she would be able to repeat the experiment
Fair provides a general sense of the materials used in the experiment so that thereader is not fully confident that he/she could repeat the experiment
Poor provides so little detail about the materials that the reader would not beable to repeat the experiment
Not Applicable provides no reference to materials used in the experiment

ORGANIZATION OF PROCEDURE The lab report:Superior describes the experiment in a clear and well organized manner that
can be easily followed step by step; convinces reader that he/she couldconduct the experiment; effectively; uses clear time-order indicators (first,second, then, next, after that, etc.)
Fair describes the experiment in a way that conveys a general sense of what thesteps are; leaves the reader with some uncertainty that he/she couldconduct the experiment; uses inadequate time-order indicators
Poor describes the experiment in a way that is difficult to follow; makes thereader uncertain that he/she could conduct experiment; uses few if anytime-order indicators
Not Applicable provides no description of experimental procedure
RESULTSSUMMARY OF RESULTS The lab report:Superior contains one or two sentences near the beginning of results section
that gives a fully sufficient, clearly stated summary of the findings of theexperiment
Fair contains one or two sentences somewhere in the results section that arerecognizable as a summary of the findings but are not fully sufficient andclearly stated
Poor contains what may be an attempt at summarizing the findings but is doneso in a way that is vague and confusing
Not Applicable provides no recognizable summary of findings
INTEGRATION OF VISUAL AND VERBAL FINDINGS The lab report:Superior fully integrates visual and verbal results: written part of results
section directly refers to tables and graphs and clearly addresses the data inthem
Fair fairly integrates visual and verbal results: written part refers to tables andgraphs but only as an afterthought AND/OR without clearly addressing thedata in them
Poor poorly integrates visual and verbal results: written part describes resultswithout any direct references to tables and graphs
Not Applicable provides no verbal results AND/OR no visual results
DISCUSSIONRETURN TO HYPOTHESIS The lab report:Superior provides a sentence or two in the discussion that directly restates the
hypothesis and indicates whether or not the hypothesis is supported by theexperiment
Fair provides a sentence or two that only indirectly refers to the hypothesis(without restating it) OR fails to state whether or not the hypothesis hasbeen supported
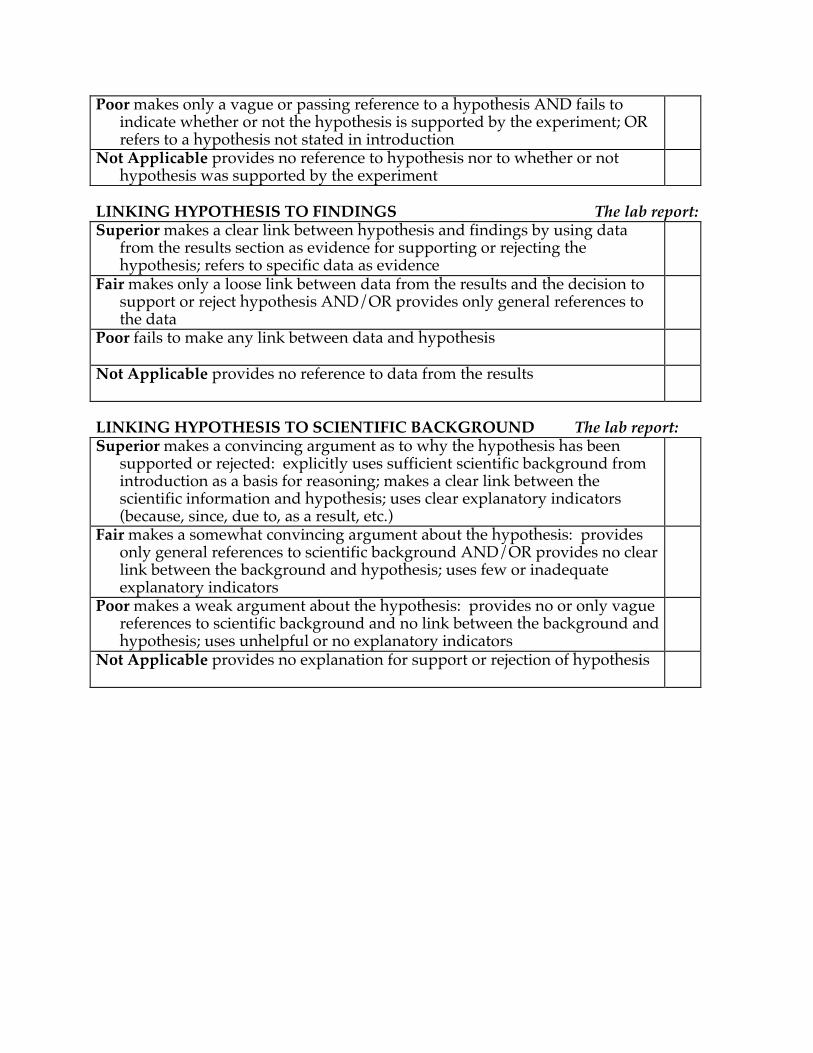
Poor makes only a vague or passing reference to a hypothesis AND fails toindicate whether or not the hypothesis is supported by the experiment; ORrefers to a hypothesis not stated in introduction
Not Applicable provides no reference to hypothesis nor to whether or nothypothesis was supported by the experiment
LINKING HYPOTHESIS TO FINDINGS The lab report:Superior makes a clear link between hypothesis and findings by using data
from the results section as evidence for supporting or rejecting thehypothesis; refers to specific data as evidence
Fair makes only a loose link between data from the results and the decision tosupport or reject hypothesis AND/OR provides only general references tothe data
Poor fails to make any link between data and hypothesis
Not Applicable provides no reference to data from the results
LINKING HYPOTHESIS TO SCIENTIFIC BACKGROUND The lab report:Superior makes a convincing argument as to why the hypothesis has been
supported or rejected: explicitly uses sufficient scientific background fromintroduction as a basis for reasoning; makes a clear link between thescientific information and hypothesis; uses clear explanatory indicators(because, since, due to, as a result, etc.)
Fair makes a somewhat convincing argument about the hypothesis: providesonly general references to scientific background AND/OR provides no clearlink between the background and hypothesis; uses few or inadequateexplanatory indicators
Poor makes a weak argument about the hypothesis: provides no or only vaguereferences to scientific background and no link between the background andhypothesis; uses unhelpful or no explanatory indicators
Not Applicable provides no explanation for support or rejection of hypothesis
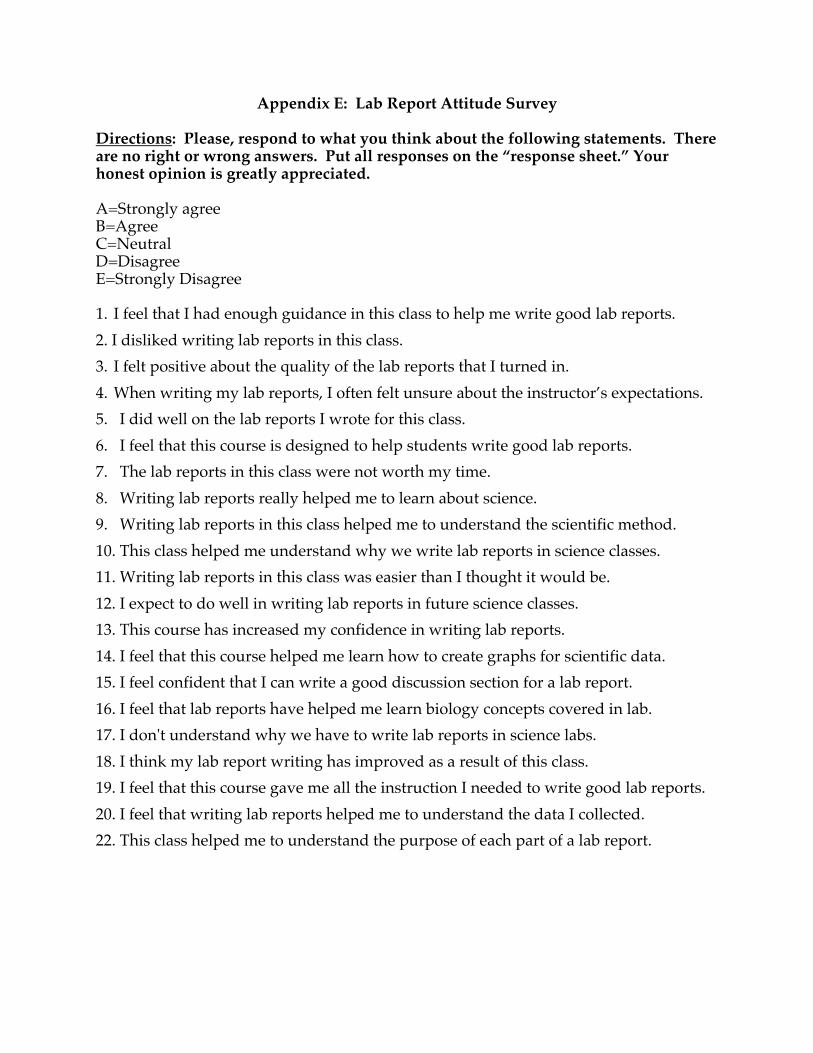
Appendix E: Lab Report Attitude Survey
Directions: Please, respond to what you think about the following statements. Thereare no right or wrong answers. Put all responses on the “response sheet.” Yourhonest opinion is greatly appreciated.
A=Strongly agreeB=AgreeC=NeutralD=DisagreeE=Strongly Disagree
1. I feel that I had enough guidance in this class to help me write good lab reports.2. I disliked writing lab reports in this class.3. I felt positive about the quality of the lab reports that I turned in.4. When writing my lab reports, I often felt unsure about the instructor’s expectations.5. I did well on the lab reports I wrote for this class.6. I feel that this course is designed to help students write good lab reports.7. The lab reports in this class were not worth my time.8. Writing lab reports really helped me to learn about science.9. Writing lab reports in this class helped me to understand the scientific method.10. This class helped me understand why we write lab reports in science classes.11. Writing lab reports in this class was easier than I thought it would be.12. I expect to do well in writing lab reports in future science classes.13. This course has increased my confidence in writing lab reports.14. I feel that this course helped me learn how to create graphs for scientific data.15. I feel confident that I can write a good discussion section for a lab report.16. I feel that lab reports have helped me learn biology concepts covered in lab.17. I don't understand why we have to write lab reports in science labs.18. I think my lab report writing has improved as a result of this class.19. I feel that this course gave me all the instruction I needed to write good lab reports.20. I feel that writing lab reports helped me to understand the data I collected.22. This class helped me to understand the purpose of each part of a lab report.

Table 1. Summary Statistics for Hypotheses 1-3
N Mean S.D. F-Value P-Value
controlHypothesis 1
experimental
44
44
1.78
2.65
1.01
1.30
4.9 .003
controlHypothesis 2
experimental
40
40
21.24
29.0
4.7
4.3
49.32 .0001
controlHypothesis 3
experimental
60
60
57.56
52.3*
14.4
11.8
6.41 .01
*Note: A lower experimental mean corresponds to higher agreement on the Lab Report AttitudeLikert-Scale as compared to the control mean.
0
0.5
1
1.5
2
2.5
3
3.5
4
4.5
5
1 3Lab Report Number
Figure 1. Group Comparison of Holistic Lab Report Scores
Treatment Comparison
0
0.5
1
1.5
2
2.5
3
3.5
4
trait1
trait2
trait3
trait4
trait5
trait6
trait7
trait8
trait9
Figure 2. Group Comparison of Composite Primary Trait Scores
Treatment Comparison