Embed Size (px)
Citation preview
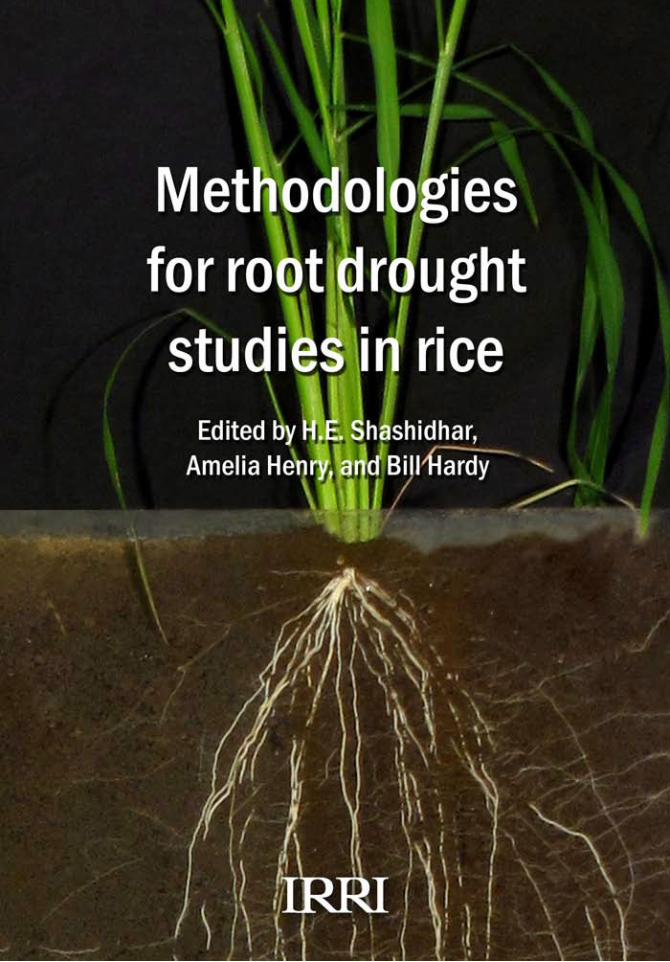
Methodologies for root drought studies in rice
2012
Edited by H.E. Shashidhar,Amelia Henry, and Bill Hardy

The International Rice Research (IRRI) was established in 1960 by the Ford and Rockefeller Foundations with the help and approval of the Government of the Philippines. Today, IRRI is one of the 15 nonprofit international research centers that are members of the CGIAR Consortium (www.cgiar.org). It is supported in part by government funding agencies, foundations, the private sector, and nongovernment organizations.
The responsibility for this publication rests with the International Rice Research Institute.
Copyright International Rice Research Institute 2012
This publication is copyrighted by the International Rice Research Institute (IRRI) and is licensed for use under a Creative Commons Attribution-NonCommercial-ShareAlike 3.0 License (Unported). Unless otherwise noted, users are free to copy, duplicate, or reproduce, and distribute, display, or transmit any of the articles or portions of the articles, and to make translations, adaptations, or other derivative works under the following conditions:
Attribution: The work must be attributed, but not in any way that suggests endorsement by IRRI or the author(s).
NonCommercial: This work may not be used for commercial purposes.
ShareAlike: If this work is altered, transformed, or built upon, the resulting work must be distributed only under the same or similar license to this one.
● For any reuse or distribution, the license terms of this work must be made clear to others.● Any of the above conditions can be waived if permission is obtained from the copyright holder.● Nothing in this license impairs or restricts the author’s moral rights.● Fair dealing and other rights are in no way affected by the above.● To view the full text of this license, visit http://creativecommons.org/licenses/by-nc-sa/3.0/
Mailing address: IRRI, DAPO Box 7777, Metro Manila, PhilippinesPhone: +63 (2) 580-5600Fax: +63 (2) 580-5699Email: [email protected]: www.irri.org.Rice Knowledge Bank: www.knowledgebank.irri.orgCourier address: Suite 1009, Security Bank Center 6776 Ayala Avenue, Makati City, Philippines Tel. +63 (2) 891-1236, 891-1174, 891-1258, 891-1303
Suggested citation: Shashidhar HE, Henry A, Hardy B, editors. 2012. Methodologies for root drought studies in rice. Los Baños (Philippines): International Rice Research Institute. 65 p.
Publication of this manual was supported by the Generation Challenge Program project G3008.06 “Targeting Drought-Avoidance Root Traits to Enhance Rice Productivity under Water-Limited Environments.”
Cover design: Sherri Maigne MenesesPage makeup and composition: Ariel PaelmoFigures and illustrations: Ariel Paelmo
ISBN 978-971-22-0290-2

Root sampling by using a root box–pinboard method iii
Contents
Foreword . . . . . . . . . . . . . . . . . . . . . . . . . . . . . . . . . . . . . . . . . . . . . . . . . . . . . . v
Greenhouse/container methodsRoot sampling by using a root box–pinboard method . . . . . . . . . . . . . . . . . . . . . . . . . . . . 3 Mana Kano-Nakata, Roel R. Suralta, Jonathan M. Niones, and Akira YamauchiSoil-filled glass rhizotrons for visualizing roots . . . . . . . . . . . . . . . . . . . . . . . . . . . . . . . . 9 Adam H. Price, Roshi Shrestha, Pietro Piffanelli, Elisabetta Lupotto, and Laura CasellaPVC tubes to characterize roots and shoots to complement field plant productivity studies . . . . 15 H.E. Shashidhar, H.S. Vimarsh Gowda, G.M. Raveendra, Pavan J. Kundur, G. Naveen Kumar, N. Suprabha, Preethi Upadhya, and Rakhi SonamQuantitative measurement of root growth angle by using the basket method . . . . . . . . . . . . . 22 Yusaku UgaAssessing root growth and water extraction for rainfed rice . . . . . . . . . . . . . . . . . . . . . . . 27 Len J. Wade, Joel Siopongco, Akihiko Kamoshita, Benjamin K. Samson, and Tina AcunaAssessing root penetration ability and resource capture from deeper soil layers . . . . . . . . . . . 34 Len J. Wade, Rolando T. Cruz, Joel Siopongco, Sergio Moroni, Benjamin K. Samson, and Tina Acuna
Field methodsMethodologies for managed drought stress experiments in the field . . . . . . . . . . . . . . . . . . 43 Rolando Torres, Amelia Henry, and Arvind KumarRoot sampling in the field with soil cores and monoliths . . . . . . . . . . . . . . . . . . . . . . . . . 52 Amelia Henry, Rolando Torres, and Leonardo Holongbayan The raised-bed system and deep-root restriction system: a unique method . . . . . . . . . . . . . . 62 of screening deep-rooted genotypes in the field Yoichiro Kato

iv Methodologies for root drought studies in rice

Root sampling by using a root box–pinboard method v
Root biology is at the forefront of progressing fields to improve agricultural productivity in low-input systems. Although there is a strong case for the role of roots in plant performance under drought stress, appropriate methods for evaluating them in relation to performance under drought (particularly in rice) are less clear-cut. There is also a strong need for advances in phenotyping to match the rapid progress in genotyping and breeding of rice. Since rice research has historically emphasized irrigated environments, and because of the difficulties associated with studying roots, large gaps exist in our knowledge about root traits for drought-resistant rice. The research community needs a better understanding of the genetic variation in rice for drought response and root traits—as well as practical methods for studying them. The focus of this manual is the description of relatively high-throughput, low-cost, and precise root phenotyping techniques, adopted by researchers across the world, that have been developed for drought studies on rice. Field phenotyping protocols for root studies in precise drought-stress treatments, as well as a range of root phenotyping systems, are described. Protocols to associate root traits with other plant traits and productivity are also included. This manual was developed with the viewpoint that characterizing rice root responses to drought will help to empower rice researchers to screen for root traits in local germplasm, and to realize the huge genetic potential of rice for root traits that can be effective for drought resistance.
Robert S. ZeiglerDirector GeneralInternational Rice Research Institute
Foreword

vi Methodologies for root drought studies in rice
Root sampling by using a root box–pinboard method 1
Greenhouse/container methods

2 Methodologies for root drought studies in rice

Root sampling by using a root box–pinboard method 3
Root sampling by using a root box–pinboard methodMana Kano-Nakata, Roel R. Suralta, Jonathan M. Niones, and Akira Yamauchi
Preamble
This method enables us to collect the whole root system with minimum impairment or disturbance to its structure. This can also be used to evaluate the response of root system development and plant water use precisely and to regulate the target soil moisture conditions.
Materials used
A. PVC root box: 25 cm length, 2 cm width, 40 cm height
B. Accessories for the greenhouse: ■ 6 clips per box ■ Packaging tape ■ Silicon sealants ■ 3-mm mesh ■ Weighing balance
C. Materials for root sampling: For the pinboard ■ 2.7-cm-length stainless-steel nails ■ Plywood board (30 cm width, 45
cm length, 7 mm thickness) ■ Hammer
For the plastic sheet ■ Transparent polyethylene bags (30
cm width, 40 cm length, 0.08 mm thickness)
■ Hole-puncher (5 mm diameter) ■ Cutter
D. Materials for taking root photos ■ Plastic boxes ■ 0.25% Coomassie Brilliant Blue R
aqueous solution ■ Light box ■ Digital camera ■ Scanner ■ Computer
E. Materials for root measurements ■ FAA solution (formalin:acetic acid:
70% ethanol = 1:1:18 by volume) ■ Ruler ■ A pair of tweezers ■ Cutter ■ Counter ■ Computer for digital root length
analysis
Methods adopted
Preparation of root boxThe root box is made of transparent PVC of 5 mm thickness. The dimensions are 25 cm × 2 cm × 40 cm (L × W × H). Put together the sides of the root box with a bonding agent. Only a wall of one side of the box (26 cm × 40 cm) is left removable. Carefully spread a silicon sealant on the contact point between the sliding wall and the main box to prevent water leakage when water-use measurements are needed. Then mount

4 Methodologies for root drought studies in rice
the wall to the main box, tape tightly, and bind with 6 clips per box. After the sealant has thoroughly dried, fill a root box with 2.5 kg of air-dried sandy loam soil, sieved through 3 mm mesh and mixed with the desired amount of fertilizer. We use a uniform soil bulk density of 1.25 g cm−3. First submerge the soil in the box overnight in water at 5–10 cm above the root box, which is enough to fully saturate the soil. Then, remove the root boxes from the water and allow them to drain for another 24 hours to stabilize soil moisture.
Cultural management of plants in the root boxSow three pregerminated seeds in a root box, which is placed in a vinyl greenhouse to protect it from rainfall. Thin the seedlings to one seedling per box after plant establishment. Do watering from the top of the root box, from the bottom, or by soaking the whole box in water when boxes are sealed, depending on the experimental objectives. For drought treatments, weigh each root box daily and replenish the amount of water lost, which is recorded as evapotranspiration, to maintain the target soil moisture. Also prepare some root boxes without plants to measure the amount of evaporation from the soil surface so that the amount of water lost through transpiration (water use) of each plant can be estimated. It takes about 1 month for the root system of rice to fill a root box of this size.
Preparation for root samplingDrive stainless-steel nails (2.7 cm length) vertically into a plywood board (45 cm × 35 cm × 7 mm, L × W × T) at equal intervals of 1 cm to make a pinboard. Screw the other board on this board as backing. Perforate a transparent polyethylene bag (45 cm × 30 cm × 0.08 mm, L × W × T) by using a hole-puncher of 5-mm diameter at equal intervals to those nails on the pinboard. Cut apart
both sides of the bag to wrap the root box with the perforated plastic sheet.
Root samplingLay the root box down on a flat surface so that the removable side of the root box is on top. Take off the clips, packaging tape, and silicon sealants, and then take off the removable wall by sliding it toward the top of the box. Press the pinboard with one side of the plastic sheet mounted on the nails against the soil in the box. After pressing, turn the box upside down and then downward. This leaves the soil profile attached to the pinboard. Then, wash away the soil on the pinboard gently by spraying tap water with adequate pressure. The root system is sandwiched between the plastic sheets and then the sheets are removed from the pinboard together with the whole root system.
Root digitizingThere are two options for root digitizing depending on the availability and convenience of the researcher.1. Taking photographsStain each root sample that is sandwiched between plastic sheets in 0.25% Coomassie Brilliant Blue R aqueous solution for 48 hours. This staining procedure is indispensable for taking high-resolution digital photographs of the entire root system, including fine lateral roots. Rinse the stained root samples with tap water to remove excess stain. Open up one side of the plastic sheet to expose the root system and put it on a light box for digital photographing using a digital camera at adequate resolution (300 dpi). Download the digital images in jpeg format in a computer and convert them into tiff format for measuring total root length.
2. Computer scanningThe procedure for preparing root samples for digitizing is similar to taking photographs, except for digitizing, which

Root sampling by using a root box–pinboard method 5
uses a scanner attached to a computer. Put the root system embedded in a sheet on top of the scanner and scan the whole root system at a resolution of at least 300 dpi and an output as a 256 gray-scale tiff file. Measure the total root length using an available computer software program such as a macro program on NIH developed by Kimura et al (1999) and Kimura and Yamasaki (2001), commercial software WinRhizo, and freeware ImageJ (Tajima and Kato 2011).
Traits recordedRoot traits■ Number of nodal roots■ Nodal root length■ Total root length■ Root length density■ Seminal root length■ Total lateral root length: total root
length − (seminal root length + total nodal root length)
■ Linear frequency: the number of lateral roots per unit length of seminal/nodal root axes
■ Root dry weight■ Specific root length: root length/root
dry weight
Shoot traits■ Shoot dry weight■ Plant height■ Number of tillers■ Leaf number■ Leaf area
Water use■ Water use■ Water-use efficiency
PrecautionsSoil filling and compaction of the soil should be uniform in all the root boxes.
Publications using this method
Kano-Nakata M, Inukai Y, Wade LJ, Siopongco JDLC, Yamauchi A. 2011. Root development and water uptake, and shoot dry matter production under water deficit conditions in two CSSLs of rice: functional roles of root plasticity. Plant Prod. Sci. 14:329-339.
Kono Y, Yamauchi A, Nonoyama T, Tatsumi J, Kawamura N. 1987. A revised experimental system of root-soil interaction for laboratory work. Environ. Contr. Biol. 25:141-151.
Suralta RR, Yamauchi A. 2008. Root growth, aerenchyma development, and oxygen transport in rice genotypes subjected to drought and waterlogging. Environ. Exp. Bot. 64:75-82.
Suralta RR, Inukai Y, Yamauchi A. 2010. Dry matter production in relation to root plastic development, oxygen transport and water uptake of rice under transient soil moisture stresses. Plant Soil 332:87-104.
Suralta RR. 2010. Plastic root system development responses to drought enhanced nitrogen uptake during progressive soil drying conditions in rice. Philipp. Agric. Sci. 93:458-462.

6 Methodologies for root drought studies in rice
Fig.
1. A
pin
boar
d w
rapp
ed in
a p
erfo
rate
d po
lyet
hyle
ne s
heet
(A)
. The
roo
t bo
x w
as la
id d
own
on a
fla
t su
rfac
e w
ith
rem
ovab
le s
idew
all r
emov
ed (
B).
The
box
was
slid
ed d
own
and
the
soil
was
left
on
the
pinb
oard
in b
etw
een
plas
tic
shee
ts (
C).
Was
hing
of
the
root
sys
tem
(D
). T
he r
oot
syst
em s
andw
iche
d be
twee
n th
e sh
eets
(E)
.

Root sampling by using a root box–pinboard method 7
Fig. 2. Root system profiles of Nipponbare (A-C), CSSL45 (D-F), and CSSL50 (G-I) grown under waterlogged (control; A, D, G), 25% w/w of soil moisture content (SMC) (B, E, H), and 20% w/w of SMC (C, F, I) for 31 days. Root systems were sampled with rootbox-pinboard method. Bars = 5 cm (Kano-Nakata et al 2011).

8 Methodologies for root drought studies in rice
Common mistakes■ Water use cannot be measured
precisely when water leaks from the root box. You must put silicon sealant carefully between the removable side wall and the box to fill gaps where water may pass through.
■ Measurement of scanned root system as sampled tends to underestimate the root length because of overlapping of roots, especially fine ones such as lateral roots.
ReferencesKimura K, Yamasaki S. 2001. Root length
and diameter measurement using NIH Image: application of the line intercept principle for diameter estimation. Plant Soil 234:37-46.
Kimura K, Kikuchi S, Yamasaki S. 1999 Accurate root length measurement by image analysis. Plant Soil 216:117-127.
Tajima R, Kato Y. 2011. Comparison of threshold algorithms for automatic image processing of rice roots using freeware ImageJ. Field Crops Res. 121:260-263.
NotesAuthors’ addresses: Mana Kano-Nakata,
International Cooperation Center for Agricultural Education, Nagoya University, Chikusa, Nagoya 464-8601, Japan; Roel R. Suralta, Philippine Rice Research Institute, Maligaya, Science City of Muñoz, Nueva Ecija, Philippines 3119; Jonathan M. Niones and Akira Yamauchi, Graduate School of Bioagricultural Sciences, Nagoya University, Chikusa, Nagoya 464-8601, Japan

Soil-filled glass rhizotrons for visualizing roots 9
Preamble
Plants are gown in thin rhizotrons with glass sides that are filled with soil and inclined at 15º. Photographs can be taken and nondestructive (visual) assessment made of root traits such as rooting angle and depth whenever required. After 6 or 7 weeks, the rhizotron can be harvested to assess root thickness and root and shoot mass. Withholding water followed by weighing can provide an assessment of water use. Delta-T theta probes can be inserted in the side to assess the volumetric water content at any stage. This technique has been used to assess a mapping population and collections of rice, sampling genetic diversity at scales of 24 to 320 rhizotrons at a time.
Materials used
A. Sheets of 4-mm-thick glass cut to 1,200 × 300 mm.
B. Sandy loam soil sieved using a coarse sieve (approximately 5 mm mesh) to remove stones and large clumps.
C. Drip irrigation system (available in gardening stores).
D. Supplies including duct tape, two lengths of straight 15-mm-thick and 1,000-mm-long wood, bottle tops, custom-made metal chute to guide soil, and chemicals for nutrient solution.
Soil-filled glass rhizotrons for visualizing rootsAdam H . Price, Roshi Shrestha, Pietro Piffanelli, Elisabetta Lupotto, and Laura Casella
Methods adopted
Two glass sheets are selected, at least one of which is clean on both sides. One is placed on a work surface with two of the four edges slightly overhanging. Two lengths of 15-mm-thick wood are placed on top of the first sheet, a 15-mm-thick bottle top (e.g., Coca Cola) is placed at the top and the bottom of the glass as spacers, and then the second sheet of glass is placed over the top. Duct tape is used to join the two sheets of glass together at the overhanging edges (Fig. 1A). The sheets are turned so that the remaining long edge is overhanging, and that is then sealed with duct tape. Three of the four sides are therefore completely sealed with duct tape. The empty rhizotron is set vertical, a single strip of duct tape is wound right around the rhizotron at a depth of about 300 mm from the bottom, and the two lengths of wood are removed. The two bottle tops prevent the glass from coming together and empty rhizotrons can therefore be stacked, waiting for filling. The one at the top can be removed at a later date during the soil-filling process. The bottle top at the bottom must remain in the rhizotron. The empty rhizotron is stood upon a soft support such as expanded polystyrene sheet and sieved soil is then encouraged into the rhizotron using a dustpan and the custom-made guide (Fig. 1B). When the rhizotron is nearly full, the upper bottle top can be removed. When full, the rhizotron is lifted and then

10 Methodologies for root drought studies in rice
gently dropped onto the support, causing the soil level to drop by 10–15 cm due to packing of the soil. The rhizotron is refilled, gently dropped once more, and refilled to within 5 mm of the top for a final time. The force of the drop will affect the amount of soil used. The aim is to pack the soil sufficiently well to prevent slumping of the soil when it is watered, but not so much that it splits the tape or creates impedance to the roots. The latter can be roughly assessed by pushing a sharpened pencil into the soil. If it is difficult to push, the roots will probably also find it difficult. Once filled, the rhizotron should be weighed with the aim to have each rhizotron the same weight. Typically, the rhizotrons weigh 13 kg and contain about 7 kg of wet soil. A small drainage hole should be made at each side at the bottom using an implement such as a sharpened pencil.
Typically, rhizotrons are placed in stacks of eight and are leaned at an angle of 15o to encourage roots to grow on the lower face (Fig. 1C). The exposed face of the first stack is backed with an insulation sheet to reduce heat exchange and prevent light penetration. Insulation is placed over the front of the stacks and an irrigation system is installed (Fig. 1D). This should supply water equally to each rhizotron and apply it slowly (to avoid soil slumping). Typically, an irrigation rate of 40 mL min−1 is used. This can be used to supply nutrients or water as required. Each rhizotron is labeled on the lower sheet so that in a photograph of that side (where roots are most visible) the identity of the rhizotron can be seen. Typically, two seeds are sown in each rhizotron, and are thinned to one when they have emerged. Watering is typically
Fig. 1. (A) Construction of empty rhizotron, (B) filling with soil, (C) stacking at 15º, (D closeup of drip irrigation, (E) Indian cultivar Black Gora, (F) improved cultivar IR64.
Soil-filled glass rhizotrons for visualizing roots 11
done three times a week with 250 mL of Yoshida’s nutrient solution for the first 3 weeks, moving up to more frequent and larger volumes of nutrient and water as the plants grow, reaching about 250 mL nutrient and 150 mL water every day when 6 weeks old. However, amounts will vary with climatic conditions. Photographs of the lower side of each rhizotron can be taken when required but must be done in the dark to reduce reflection from the glass. This can be done at night using spotlights at either side of the rhizotrons. Typically, two rhizotrons are photographed together. Withholding water followed by daily weighing using a 20-kg balance can provide data on daily water use once drainage from the rhizotrons has stopped (a few hours after irrigation). A Delta-T (Cambridge, UK) theta probe can be modified by removing one of the three exterior rods and inserted into the side of the rhizotron through the tape to give a reasonable estimate of volumetric water content. The holes created can be reused any number of times to monitor changes in soil moisture at different depths.
Traits to be recorded
■ On a weekly basis, shoot growth is monitored as height of the plant (length from the soil to the tip of the longest leaf) while the length of the longest visible root and the number of roots that passed 25, 50, 75, and 100 cm are recorded. After about 21 days, the angle of spread of the root system can be measured with a protractor (the angle between the most horizontal [shallowest] main axes on the left and the right sides of the plant).
■ To measure water use, daily weighing can be conducted. This is most easily achieved if watering is stopped; otherwise, added water must be recorded. For maximum accuracy, at least two control rhizotrons without plants can be used to assess water loss from drainage and evaporation from the exposed soil surface, although the former stops within a day and the latter is relatively small.
■ At any time, but typically at the end, the rhizotrons can be photographed two at a time with a reasonably high-resolution (e.g., 12-mega-pixel) digital camera. From the images, the angle of main (nodal) roots can be evaluated either using image analysis or manually. In the manual method, a protractor is placed against each image on a computer screen. With the protractor placed horizontally, the number of main axes in nine angle classes representing each of the 10º subdivisions of the protractor is counted. Roots in the division 0–10º and 170–180º are counted together in the 0–10º class to give the number of roots in the most horizontal of the nine angle classes. A weighted average of the angle is calculated by multiplying the number of roots in each class by the halfway angle of each class (e.g., 5 for the 0–10º class and 35 for the 30–40º class), summing across all classes and dividing that by the total number of axes.
■ At the end of the experiment (e.g., day 42), shoots are removed in a single day and dried to assess shoot dry weight. Over a 1-week period, each chamber is opened. Short sections of three of the thickest roots are removed from each root system near the base of the shoot, placed in water, and stored in the refrigerator, before being used to assess root thickness under a dissecting microscope. The entire root system is divided into sections (e.g., the top 0–40 cm, middle 40–80 cm,

12 Methodologies for root drought studies in rice
and bottom 80–120 cm), washed, dried, and weighed.
■ If information on fine root structure is required, instead of drying, the roots can be preserved in 50% ethanol before a subsample is scanned for analysis using software such as WinRhizo.
Precautions to be taken■ Glass is superior to sheet plastic
alternatives because it is more rigid.■ The glass presents a risk of cutting.
Use carborundum paper to remove the sharp edges from new glass and wear gloves when constructing rhizotrons.
■ Make sure that one sheet of glass (the one that will be photographed) is clean on both sides.
■ A thickness of more than 15 mm of soil can be used but be aware that every 2 mm of thickness adds 1 kg to the weight of each rhizotron and this will have major implications for health and safety if regularly moving the rhizotrons.
■ During watering, there is a tendency for the soil to move down. This is minimal if the rhizotron is well packed with soil (not loose) and if water is applied slowly. Practice packing and watering before deciding on the amount of soil to use.
■ Temperature strongly affects root growth. If there is a relatively small gradient of temperature across the experiment, use of blocks in the experimental design will take care of it. If the gradient is suspected to be large (>1 ºC), consider moving the rhizotrons on a weekly basis.
■ Make sure the labeling is large enough to be read in the photographs.
■ Light should be excluded as much as possible.
■ Within a greenhouse in temperate regions, these experiments can be done only in the summer months since the light intensity is limited in the winter even with supplementary lights.
Case study ObjectiveTo assess the degree of variation for root traits in Italian cultivars as part of the Italian-funded project DryRice.
Materials and methodsPlant materialsThirteen Italian cultivars (Augusto, Baldo, Balilla, Carnaroli, Euro Sis, Gladio, Koral, Loto, Perla, Salvo, Sis R215, Thaibonnet, and Vialone Nano) plus check varieties IR64 and Black Gora.
Rhizotron methodology The experiment was sown on 13 May 2010. Four replicates were organized as a randomized complete block design. Plants were grown for 42 days and water was withheld from day 39 so that daily water use in the last 3 days could be assessed.
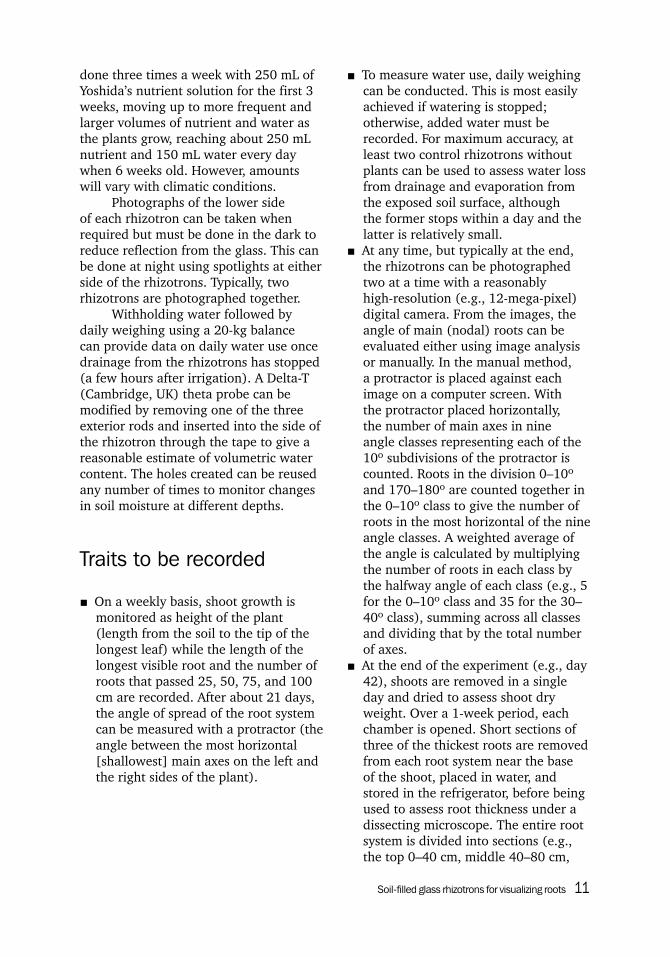
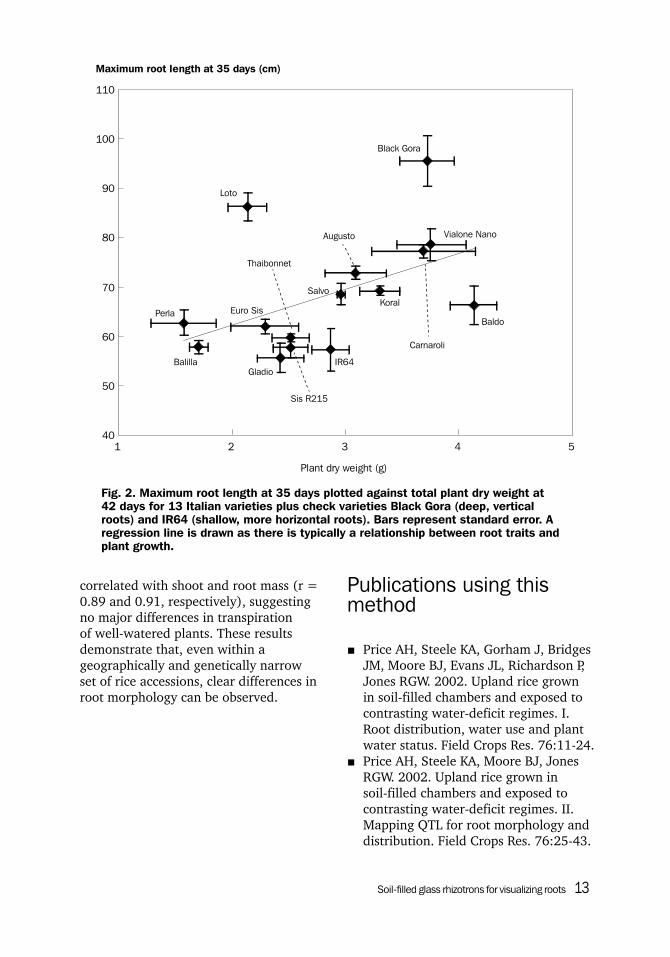
Results and discussionAs typically observed, many root traits are significantly correlated with overall plant growth and it is important to assess traits in that context. Clear differences in traits were observed, indicating major differences in root morphology of Italian rice cultivars. Variety Loto was notable for having long roots in absolute terms and relative to total plant growth while most were relatively short (Fig. 2). Salvo and Carnaroli roots had notably thick main axes, while those of Balilla and Perla were thin (Fig. 3). Perla also had a low mean root angle, indicative of a shallow root system, while Vialone Nano was notably vertical (Fig. 3). Water use between day 40 and 42 was very strongly
Soil-filled glass rhizotrons for visualizing roots 13
correlated with shoot and root mass (r = 0.89 and 0.91, respectively), suggesting no major differences in transpiration of well-watered plants. These results demonstrate that, even within a geographically and genetically narrow set of rice accessions, clear differences in root morphology can be observed.
Publications using this method
■ Price AH, Steele KA, Gorham J, Bridges JM, Moore BJ, Evans JL, Richardson P, Jones RGW. 2002. Upland rice grown in soil-filled chambers and exposed to contrasting water-deficit regimes. I. Root distribution, water use and plant water status. Field Crops Res. 76:11-24.
■ Price AH, Steele KA, Moore BJ, Jones RGW. 2002. Upland rice grown in soil-filled chambers and exposed to contrasting water-deficit regimes. II. Mapping QTL for root morphology and distribution. Field Crops Res. 76:25-43.
Fig. 2. Maximum root length at 35 days plotted against total plant dry weight at 42 days for 13 Italian varieties plus check varieties Black Gora (deep, vertical roots) and IR64 (shallow, more horizontal roots). Bars represent standard error. A regression line is drawn as there is typically a relationship between root traits and plant growth.
40
50
60
70
80
90
100
110
1 2 3 4 5
Plant dry weight (g)
Maximum root length at 35 days (cm)
Loto
Augusto
Perla
BalillaGladio
IR64
Carnaroli
Euro Sis
SalvoKoral
Thaibonnet
Vialone Nano
Baldo
Black Gora
Sis R215
14 Methodologies for root drought studies in rice
Common mistakesNot packing soil sufficiently well to prevent slumping when water is applied is the major problem encountered. Practice packing and watering before deciding on the amount of soil to use.
Fig. 3. Root thickness plotted against mean angle of main roots (90o is vertical) for 13 Italian varieties plus check varieties Black Gora (deep, vertical roots) and IR64 (shallow, more horizontal roots). Bars represent standard error.
0.6
0.7
0.8
0.9
1.0
1.1
1.2
50 55 60 65 70 75 80
Mean root angle (°)
Root thickness (mm)
Loto
Augusto
Perla
Balilla
Gladio
IR64
Carnaroli
Euro Sis
Salvo
Koral
Thaibonnet
Vialone NanoBaldo
Black Gora
Sis R215
NotesAuthors’ addresses: Adam H. Price, Institute of
Biological and Environmental Sciences, University of Aberdeen, AB24 3UU, Aberdeen; Roshi Shrestha, Dipartimento di Biologia, Università degli Studi di Milan, Milan, Italy; Pietro Piffenelli and Laura Cassella, Parco Technol Padano, I-26900 Lodi, Italy; Elisabetta Lupotto, CRA-Dipartimento di Biologia e Produzioni Vegetali, Via Nazionale 82, 00184 Roma, Italy.

PVC tubes to characterize roots and shoots to complement field plant productivity studies 15
What and why
Plants are gown in PVC tubes that are filled with soil. For rice, 20-cm-wide and 100-cm-long tubes are recommended. However, the size of the tube depends on the number of days the plants are expected to be grown in the soil (days from sowing to sampling) and the spacing that is given for the crop when it occupies the field. Sampling of roots can be done at any phenological stage. It is not advisable to sample by “days after sowing” as the rate of growth of roots depends on the overall duration of the plant, for which considerable genetic variability exists. The study can be done in a greenhouse or in an open field. In a neighboring field, the same genotypes can be raised with similar treatments of moisture regime to assess grain yield and other shoot characters. Moisture stress can be imposed as desired, with a rainout shelter covering the root study area, or applied in the neighboring field in the same season and imposing the same moisture region. Any number of genotypes can be studied in this method, depending on the tubes available. Breeding for drought resistance based on deep rooting habit can be carried out.
PVC tubes to characterize roots and shoots to complement field plant productivity studiesH.E. Shashidhar, H.S. Vimarsh Gowda, G.M. Raveendra, Pavan J. Kundur, G. Naveen Kumar, N. Suprabha, Preethi Upadhya, and Rakhi Sonam
Materials used
A. Pipe: PVC tube of 1 m in length and 18–20 cm in diameter and 4 kg/cm3 thickness/strength.
B. Soil and organic manure.C. A crowbar or a long iron rod to
compact the soil.D. Soil moisture meter.E. Pit: The depth of the pit is the same as
the length of the PVC tube. The length and breadth of the pit is proportional to the number of genotypes being studied (Figs. 1 and 2), moisture stress treatments if any, replications, and design adopted.
F. Accessories in the field: ■ A shallow washing tank where PVC
tubes can be immersed prior to sampling roots
■ A measuring tape or ruler with a minimum graduation of 0.1 mm
■ Paper bags in which to place roots and shoots
■ Hot-air oven (for dry-weight measurement)
■ Measuring jar (root volume) with graduations of 0.1 mL
■ Strong rope (to pull PVC tubes into a water tank for soaking before washing)
■ Wooden planks ■ Weighing balance ■ Marker pencils ■ Tags

16 Methodologies for root drought studies in rice
Fig. 1. PVC tubes filled with soil, arranged in the pit.
Fig. 2. Seedlings growing in PVC tubes.

PVC tubes to characterize roots and shoots to complement field plant productivity studies 17
Methods adoptedRoot studiesIn this method, root growth is studied in a soil medium. A large volume of soil is provided. Either PVC sheets rolled in the form of a tube or PVC tubes can be used. The size of the tube depends on the volume of soil to be used, how long the plants are expected to be grown, the spacing prescribed for the crop when it occupies the field, etc. The size of the tube depends on the crop spacing in the field. For rice, which has a spacing of about 20 × 10 cm in the field, a tube diameter of 20 cm would be ideal. The length of the tube is also dependent on prior information on root growth, if available, or on an intelligent guess, if roots are being studied for the first time. It is advisable to have a relatively larger tube than expected to accommodate the long-rooted genotypes. For rice, PVC tubes of 1 m in length and 18–20 cm in diameter are chosen. These tubes are actually sold in lengths measuring 6 m. For sorghum and maize, we use tubes of 150 cm in length and a diameter of 25 cm. When procured, the PVC tubes come in lengths of 6 m. They have to be cut into smaller pieces as required. The cut PVC tubes are placed vertically in a pit dug in the soil and measuring 1 m deep. This is to ensure that the tops of the tubes are at the surface of the soil. In this way, the plants that grow in the tubes are at the same level in terms of vapor pressure deficit. It is important to see that the tubes are not exposed to heat from the sun, as this may influence root growth. The number of tubes required depends on the number of genotypes used for the study and the number of replications planned. A complete randomized design (CRD) is advisable as it is appropriate for a pot study done in the field. Rainout shelters can be provided to have control over moisture.
Evaluating productivityGrain yield is what farmers expect from the crop raised. A plant with a well-endowed root system will have better access to water from a deeper and larger volume of soil. It is important that the genetic differences that exist for root parameters be manifested as improved grain yield. The link between deep, extensive, and efficient roots and higher grain yield has to be established to justify the advantage of roots to a plant when challenged by drought. Hence, grain yield evaluated in neighboring plots, in the same season, as root studies are done would be appropriate in breeding programs and in validating the results of breeding programs on drought resistance. Grain yield can be evaluated by adopting the well-established tools and techniques of field trials. Usually, an RCBD is adopted if genotypes are fewer than 20 or 30. When a large number of genotypes are being evaluated, there is a need to adopt the Latin square of augmented design as appropriate. Moisture treatments are similar to those adopted in the PVC tubes study.
Traits to be observed
After washing the roots from a plant thoroughly and removing all attached soil particles (Fig. 3), the following observations can be made.
Traits to record in PVC tubes, the field, or both■ Plant height: Measure plant height
from the root tip to the longest leaf tip and express it in cm (to be recorded in the field and tube experiments).
■ Number of tillers per plant: Count the total number of tillers (both productive and nonproductive) per plant at the time of harvest (to be recorded in the field and tube experiments).

18 Methodologies for root drought studies in rice
Fig. 3. Roots washed from the PVC tubes.

PVC tubes to characterize roots and shoots to complement field plant productivity studies 19
■ Maximum root length: Measure root length from the crown of the root to the tip of the root and express it in cm.
■ Root number: Count the number of roots from the crown of the root.
■ Root volume: Measure root volume using WinRhizo software or the water displacement method.
■ Root dry weight: Dry the plant samples in a hot-air oven for 2 days at 70 °C. The dry weights of three replications have been recorded by using an electronic balance and the mean value is taken, expressed in g.
■ Root diameter: Express the diameter of the root when seen in a microscope under 100x magnification in mm or microns. Record readings using an ocular micrometer after standardization, at that magnification, with a stage micrometer.
■ Root surface area: Compute the surface area of the roots by scanning and computation tools (WinRhizo software).
■ Days to maturity: Record the number of days from sowing to the physiological maturity of the crop as days to maturity (to be recorded in the field and tube experiments).
■ Shoot dry weight: Weigh oven-dried shoots (to be recorded in the field and tube experiments).
■ 50% flowering: Record the number of days taken by each genotype from transplanting to opening of the first flower in 50% of the plants (to be recorded in the field and tube experiments).
■ Biomass yield: Harvest five plants from each replication from the middle 2 m of all three rows, leaving 0.5 m of the row at each end. Oven-dry harvested plants for 3 days and use them for biomass yield measurements (g).
■ Grain yield per plot: Record net plot yield after oven-drying the harvested grains.
Computed traits■ Root:shoot ratio: Ratio of root dry
weight (g) to shoot dry weight (g).■ Root:shoot ratio by dry weight or
length: The ratio of root to shoot by weight or length.
■ Growth rate of root or shoot by weight or length: The per day value obtained after dividing the total weight or length by the days to maturity.
■ Total length: Compute the sum of maximum root length and plant height and express it in cm.
■ Total dry weight: Compute the sum of root dry weight and shoot dry weight and record it in g.
■ Grain yield (kg/ha): Harvest ten plants from each replication from the middle 2 m of all three rows, leaving 0.5 m of the row at each end. Therefore, the total harvest area was 1.5 m2. Thresh and air-dry harvested plants. Measure total grain weight for each plot in g and convert this to kg/ha at 14% moisture content.
Precautions to be taken■ Soil filling and compaction of the soil
should be uniform in all experimental tubes.
■ Be careful not to break roots while washing them.
■ Use enough replications.■ Do not use very small tubes.■ Label tubes properly.
Case studyTo study root morphology of 10 genotypes in two moisture regimes along with grain yield parameters:1. Procure PVC tubes of 20-cm diameter
and 4 kg/cm3 thickness/strength.2. Use an RCBD with four replications.
20 Methodologies for root drought studies in rice
3. Use two moisture regimes, well watered and aerobic.
4. Choose the appropriate number of genotypes for study. The experimental design depends on the number of genotypes; typically, a CRD is used. (For example, 100 × 3 = 300.) Three replications are minimum. The more, the better.
5. Procure PVC pipes for rice with 20 cm in diameter. For PVC pipes, 100 cm of length is ideal.
6. Pipes are supplied in 6-m lengths after cutting them.
7. You need to dig a pit in the ground. The dimensions depend on the number of samples (for example, 300/6 = 50).
Publications using this method
Hemamalini GS, Shashidhar HE, Hittalmani S. 2000. Molecular marker assisted tagging of root morphological and physiological traits under two contrasting moisture regimes at peak vegetative stage in rice (Oryza sativa L.). Euphytica 112:69-78.
Kanbar A, Chandrashekara M, Manjunatha K, Vinod MS, Hittalmani S, Janamatti M, Shashidhar HE. 2004. Molecular markers for root morphological traits under low-moisture stress using transgressant backcross of rice (Oryza sativa L.). Indian J. Genet. Plant Breed. 4(3):185-188.
Kanbar A, Shashidhar HE, Hittalmani S. 2002. Mapping of QTL associated with root and related traits in DH mapping population of rice (Oryza sativa L.). Indian J. Genet. 62:287-290.
Prabuddha HR, Manjunatha K, Venuprasad R, Vinod MS, Jureifa JH, Shashidhar HE. 2008. Identification of isogenic lines and near-isogenic lines: an innovative approach, validated for root and shoot morphological characters in a mapping population of rice (Oryza sativa L.). Euphytica 160:357-368.
Sharma N, Shashidhar HE, Hittalmani S. 2003. Root length specific SCAR marker in rice (Oryza sativa L.). Rice Genet. Newsl. Vol. 19.
Shashidhar HE, Vinod MS, Sudhir, Naveen Sharma GV, Krishnamurthy K. 2005. Markers linked to grain yield using bulked segregant analysis approach in rice (Oryza sativa L.). Rice Genet. Newsl. 22:69-71.
Steele K, Price A, Shashidhar HE, Witcombe J. 2006. Marker-assisted selection to introgress rice QTLs controlling root traits and aroma into an Indian upland rice variety. Theor. Appl. Genet. 112:208-221.
Toorchi M, Shashidhar HE, Hittalmani S, Gireesha TM. 2002. Rice root morphology under contrasting moisture regimes and contribution of molecular marker heterozygosity. Euphytica 126(2):251-257.
Venuprasad R, Shashidhar HE, Hittalmani S, Hemamalini GS. 2002. Tagging quantitative trait loci associated with grain yield and root morphological traits in rice (Oryza sativa L.) under contrasting moisture regimes. Euphytica 128:293-300.
Venuprasad R, Shashidhar HE, Hittalmani S. 2002. Screening for rice root system and grain yield simultaneously by “single tiller approach.” Int. Rice Res. Newsl. 27(1):30-31.

PVC tubes to characterize roots and shoots to complement field plant productivity studies 21
Common mistakes■ Insufficient compacting while filling
PVC tubes.■ Breaking roots when handling them.■ Sampling at different phonological
stages of the crop instead of at the same stage for each variety.
Notes
Authors’ address: Department of Biotechnology, College of Agriculture, University of Agricultural Sciences, GKVK, Bangalore 560065, India.

22 Methodologies for root drought studies in rice
Preamble
This method enables us to evaluate the average growth angle of rice nodal roots easily. With this method, we can determine quantitatively which accession is a shallow- or deep-rooting type. This method can also be used in several experimental conditions from field to hydroponic culture.
Materials used
For evaluation of traits in the field■ Open plastic mesh basket (e.g., top
diameter of 15 cm, bottom diameter of 8.5 cm, height of 6 cm, and mesh size of 2 mm)
For evaluation of traits in cultivation using pots■ Open plastic mesh basket (e.g., top
diameter of 15 cm, bottom diameter of 8.5 cm, height of 6 cm, and mesh size of 2 mm)
■ Pots (e.g., top diameter of 15.5 cm and volume of 3.5 L)
■ Large container to hold the pots
For evaluation of traits in hydroponic culture■ Open stainless-steel mesh basket (e.g.,
top diameter of 7.5 cm, depth of 5.0 cm, and mesh size of 2 mm)
Quantitative measurement of root growth angle by using the basket methodYusaku Uga
■ Large container to hold the PVC pipes■ PVC pipe (e.g., top diameter of 7.5 cm
and length of 10–15 cm) to hold the baskets
■ Hydroponic solution (e.g., Yoshida or Kimura B solution)
■ Soil to fill baskets
Methods adopted
Discriminating criteria of shallow and deep rootingDeep rooting is evaluated from the position where the nodal roots penetrate the mesh of hemispherical baskets that hold the rice plants. Kato et al (2006) evaluated the variation in deep rooting of rice from the frequency of high root-growth angles (50° to 90° with respect to the horizontal). In this method, ratio of deep rooting (RDR) is defined as the number of roots that penetrated the lower part of the mesh basket (i.e., the part defined by an angle of 50° from the horizontal, centered on the stem of the rice plant) divided by the total number of roots that penetrated the whole mesh basket. For this measurement, the basket is set up with a line to classify roots emerging from the upper and lower parts of the basket as shallow or deep, according to the horizontal angle with respect to the ground surface (0° to 50° and 50° to 90°). This method allows us to easily count roots penetrated from each part of the basket. The cutoff angle can

Quantitative measurement for root growth angle by using the basket method 23
be changed (e.g., 0° to 30°, 30° to 60°, and 60° to 90°) as you think proper for classification of deep-root growth. This method can be applied to other crops because the basket method was originally developed in wheat (Oyanagi et al 1993).
Preparation of basket for evaluation in field or potFor evaluation in upland fields, a plastic basket is filled with upland-field topsoil mixed evenly with fertilizer (e.g., rates of 26 kg N, 36 kg P, and 28 kg K ha−1). The baskets are buried at a spacing of 40 × 40 cm at least in the upland field, which allows enough spacing for researchers to enter the field and observe the plants (Fig. 1). Three seeds are sown in each basket, and plants are thinned to one per basket after seedling establishment. RDR can be estimated 5 to 7 weeks after sowing. For counting roots, the basket is pulled out carefully from the field and soil around the basket is removed and then washed. For cultivation using pots, the basket is filled with soil that had been mixed evenly with inorganic fertilizer (e.g., rates of 26 kg N, 36 kg P, and 28 kg K ha−1) and installed in pots filled with the same soil and fertilizer. Seeds are pregerminated at 30 °C for 2 days in an incubator, then each seed is sown in separate baskets in a greenhouse.
Preparation of the basket for evaluation in hydroponic cultureThe stainless-steel baskets are filled with soil but without fertilizer, and groups of 20–40 baskets are put together in a large container filled with tap water (pH 6.0) in a greenhouse. Seeds are pregerminated at 30 °C for 2 days in an incubator, then each seed is sown at the center of a basket; 7 days after sowing, the water is replaced with half-strength Kimura B hydroponic solution (182.5 µM (NH4)2SO4, 45.5 µM K2SO4, 273.5 µM MgSO4, 91.5 µM KNO3, 182.5 µM Ca(NO3)2, 91.0 µM KH2PO4, 8.9 µM
FeCl3, pH 6.0). The solution with normal-strength Kimura B solution (pH 6.0) is replaced 14 days after sowing. The hydroponic solution is renewed every other day. RDR can be estimated 5 to 7 weeks after sowing.
Traits recorded■ Ratio of deep rooting■ Total number of roots■ Shoot length■ Tiller number
Precautions and common mistakes
■ In the case of upland conditions, soil moisture content should be measured and controlled uniformly.
■ In the case of hydroponic culture, soil filling and compaction of the soil should be uniform.
■ Mesh size of 2 mm was sufficiently large that the mesh did not interfere with root emergence from the baskets. A mesh size of less than 2 mm is too small to allow emergence of thicker nodal roots through the basket.
24 Methodologies for root drought studies in rice
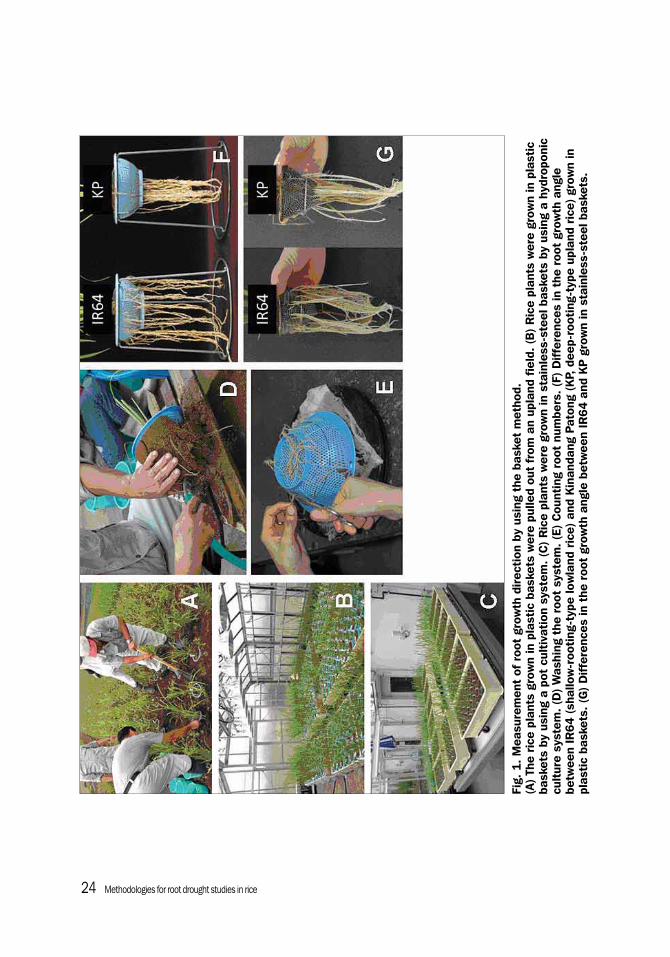
Fig.
1. M
easu
rem
ent
of r
oot
grow
th d
irec
tion
by
usin
g th
e ba
sket
met
hod.
(A
) Th
e ri
ce p
lant
s gr
own
in p
last
ic b
aske
ts w
ere
pulle
d ou
t fr
om a
n up
land
fie
ld. (
B)
Ric
e pl
ants
wer
e gr
own
in p
last
ic
bask
ets
by u
sing
a p
ot c
ulti
vati
on s
yste
m. (
C)
Ric
e pl
ants
wer
e gr
own
in s
tain
less
-ste
el b
aske
ts b
y us
ing
a hy
drop
onic
cu
ltur
e sy
stem
. (D
) W
ashi
ng t
he r
oot
syst
em. (
E) C
ount
ing
root
num
bers
. (F)
Dif
fere
nces
in t
he r
oot
grow
th a
ngle
be
twee
n IR
64
(sha
llow
-roo
ting
-typ
e lo
wla
nd r
ice)
and
Kin
anda
ng P
aton
g (K
P, d
eep-
root
ing-
type
upl
and
rice
) gr
own
in
plas
tic
bask
ets.
(G
) D
iffe
renc
es in
the
roo
t gr
owth
ang
le b
etw
een
IR64
and
KP
gro
wn
in s
tain
less
-ste
el b
aske
ts.

Quantitative measurement for root growth angle by using the basket method 25
Case studyObjectiveTo clarify whether RDR of rice accessions grown in two different culture conditions shows significant correlation, we measured RDR of a rice core collection cultivated under upland and hydroponic conditions at the National Institute of Agrobiological Sciences (NIAS) in Japan.
Materials and methodsPlant materials. The core collection used in this study consists of 69 cultivated rice accessions called the NIAS Global Rice Core Collection (www.gene.affrc.go.jp/databases-core_collections_en.php) developed by the Genebank of NIAS based on a genome-wide RFLP polymorphism survey (Kojima et al 2005). This collection is classified into three varietal groups (two indica groups designated as indica I and indica II, and japonica in this manual), based on principal coordinate analysis using data from 179 RFLP markers. Evaluation of RDR in an upland field. This experiment was conducted under rainfed conditions in an upland field at NIAS (36°1ʹN, 140°6ʹE) in the summer of 2007. The soil at the experimental site is a volcanic ash soil of the Kanto loam type (Humic Andosol). The topsoil layer (0–30 cm) was a dark humic silty loam (pH = 6.2). The subsoil layer (below 30 cm) was a red-brown silty clay loam (pH = 5.8). Chemical fertilizers were applied at sowing at 26 kg N, 36 kg P, and 28 kg K ha–1. According to the Methods adopted, plastic baskets were prepared in the upland field. Three plants in each accession were grown in separate baskets. At 7 weeks after sowing, RDR of each plant was measured and mean RDR of each accession was calculated by its three plants. Evaluation of RDR in hydroponic culture. The 40 stainless-steel baskets filled with soil were set up on PVC pipes in each container filled with tap water
(pH 6.0) in a greenhouse (average air temperature, 30 °C; average relative humidity, 50%; natural lighting). Seeds were pregerminated at 30 °C for 2 days in an incubator; then each seed was sown at the center of a basket. Five plants in each accession were grown in separate baskets. Plants were grown according to the Methods adopted. At 6 weeks after sowing, RDR of each plant was measured and mean RDR of each accession was calculated from five plants. Results and discussion. In upland field conditions, no significant differences were found in mean RDR among the three varietal groups. On the other hand, mean RDR of the indica I group showed significantly higher RDR than that of the indica II group in hydroponic conditions. The correlation coefficient of the 69 rice accessions was relatively high (r = 0.6782), suggesting that RDR of rice in artificial conditions such as hydroponic culture can be used as a substitute measurement for root growth angle in natural field conditions (Fig. 2). In this study, however, the upland field was relatively well watered for rice cultivation. Correlation of RDRs between well-watered and drought conditions in the field will be needed to elucidate the influence of soil moisture stress on root growth angle in rice.
Publications using this method
Uga Y, Ebana K, Abe J, Morita S, Okuno K, Yano M. 2009. Variation in root morphology and anatomy among accessions of cultivated rice (Oryza sativa L.) with different genetic backgrounds. Breed. Sci. 59:87-93.
Uga Y, Okuno K, Yano M. 2011. Dro1, a major QTL involved in deep rooting of rice under upland field conditions. J. Exp. Bot. 62:2485-2494.

26 Methodologies for root drought studies in rice
References
Kato Y, Abe J, Kamoshita A, Yamagishi J. 2006. Genotypic variation in root growth angle in rice (Oryza sativa L.) and its association with deep root development in upland fields with different water regimes. Plant Soil 287:117-129.
Kojima Y, Ebana K, Fukuoka S, Nagamine T, Kawase M. 2005. Development of an RFLP-based rice diversity research set of germplasm. Breed. Sci. 55:431-440.
Oyanagi A, Nakamoto T, Wada M. 1993. Relationship between root growth angle of seedlings and vertical distribution of roots in the field in wheat cultivars. Jpn. J. Crop Sci. 62:565-570.
Notes
Author’s address: National Institute of Agrobiological Sciences, 2-1-2 Kannondai, Tsukuba, Ibaraki 305-8602, Japan.
Fig. 2. Correlation of RDR of 69 rice accessions grown in two different culture conditions. Indica I (n = 22), indica II (n = 32), japonica (n = 15). r = correlation coefficient calculated based on RDR data of 69 rice accessions, ** = 1% significance level.
0
10
20
30
40
50
60
70
80
90
0 10 20 30
RDR (%) in plastic basket under upland
40 50 60 70
Indica IIndica IIJaponica
RDR (%) in stainless-steel basket under hydroponic conditions
r = 0.6782**

Assessing root growth and water extraction for rainfed rice 27
Preamble
In drought-prone rainfed lowlands, rice encounters fluctuating water conditions in the same season, ranging from anaerobic soils with ponded water to aerobic soils with water deficit (Wade et al 1998, 1999a, b). Other rainfed environments encounter varying combinations of stresses over a related range of hydrology and oxygen status, from submergence to saturated soils to severe water deficit. Whichever ecosystem is the target, rice fields are variable—especially those that are rainfed—and field measurements of root systems are difficult. Controlled environments offer the opportunity to provide repeatable conditions that mimic those likely to be encountered in the field, but in circumstances in which reliable measurements on root growth and water extraction can be obtained. Water uptake can readily be monitored by weighing the pots in which plants are growing. For a more complete understanding, water extraction by soil layer can be measured using time-domain reflectometry. Field validation is essential for correct results.
Assessing root growth and water extraction for rainfed riceLen J. Wade, Joel Siopongco, Akihiko Kamoshita, Benjamin K. Samson, and Tina Acuna
Materials used
■ PVC pipes, 0.20 m in diameter with lids; silicone sealant; and platform balance with 35-kg capacity
■ Comair Root Length Scanner (Hawker De Havilland Victoria Limited, Australia)
■ 1502 Metallic Time Domain Reflectometer (Tektronix Inc., Wilsonville, Oregon, USA)
■ Ocular micrometer for root thickness measurements
Methods adopted
A simple experimental protocol was developed to mimic the fluctuating hydrology of rainfed lowland fields, using soil columns in pots containing a single rice plant (Wade et al 2000, Azhiri-Sigari et al 2000, Kamoshita et al 2000, 2004). Each pot is an experimental unit to control water deficit and allow measurement with less error.
Cultural detailsCylindrical columns are made from polyvinyl chloride (PVC) of 0.20-m internal diameter and 0.55-m height, with lids fitted to the bases with epoxy to seal the pots. Twenty-one kg of sieved air-dried Maahas clay soil (28% clay, 44% silt, 28% sand; pH 5.2; Wopereis 1993) are placed in a plastic sleeve inside each column, with each 5-cm
28 Methodologies for root drought studies in rice
increment firmed to a consistent bulk density in turn. Holes for drainage or water entry are drilled just above the base of the pot and covered with a rubber stopper for the period during which ponded water is required (before imposition of stress). Four presoaked seeds are sown on the wet soil and thinned to one healthy seedling per pot by 10 days after sowing (DAS). The top of each column is then covered with aluminum foil around the base of the plant to minimize soil evaporation. The sides of the pots are also covered with aluminum foil to minimize the increase in soil temperature. The distance between any two neighboring pots is usually more than 0.40 m, to keep the effects of mutual shading negligible. A split-plot design is used, with two watering regimes (well-watered and drought followed by re-watering) as main plots and genotypes as subplots, with five replicates. Ponded water of 0.02-m depth is maintained in the well-watered treatment. At the beginning of the water-deficit treatment, water is drained from the bottom of the columns, and no further water is added until the end of the drought treatment, when water loss is replenished and then water is added daily to keep the level of ponded water similar to that of the well-watered treatment.
MeasurementsThe minimum and maximum daily air temperatures are collected by a thermohydrograph, and evaporation measured with seven pan evaporimeters randomly placed inside the greenhouse. Daily transpiration or plant water uptake is measured by weight loss using a platform balance of 35-kg capacity in the drought treatment and the amount of water added is measured in the well-watered treatment. Cumulative transpiration is calculated as the sum of daily increments. Plants are harvested before stress imposition, at the end of the drought period, and the end of the
re-watering period. After sampling of above-ground parts, the soil mass within the plastic sleeve is slowly pulled from the PVC columns, and divided into layers of 0–5, 5–10, 10–20, 20–30, 30–40, and 40–50 cm from the soil surface. Gravimetric water content and bulk density are taken from soil samples of known volume from each soil layer. Roots are carefully separated from the soil on a 1-mm sieve screen. Root length is determined with the Comair Root Length Scanner for each soil layer, and root dry weight is determined. Root thickness is measured with an ocular micrometer for major seminal and nodal root axes at a distance of 1 cm from the crown of the plant. Root length density, root dry mass per tiller, root to shoot ratio, deep root to shoot ratio, and specific root length are calculated.
Time Domain Reflectometer The water status of each soil layer can be monitored daily during the drought period using a Time Domain Reflectometer. Five pairs of stainless-steel waveguides are inserted horizontally into the soil from holes drilled in the sides of pots at depths of 5, 15, 25, 35, and 45 cm from the soil surface (Fig. 1). The waveguides are connected to the TDR unit using an extension cable, and electronic wavelength is recorded daily. The dielectric constant, k, is calculated from the TDR readings according to the equation of Cassel (1992) adjusted by the constant of the machine used in the experiment, in our case:
k = 4.08 (TDR reading)2
The three-degree polynomial equation between the dielectric constant and volumetric soil water content (VWC) (Topp et al 1980, Cassel 1992) is re-calibrated as below:

Assessing root growth and water extraction for rainfed rice 29
VWC (m3 m–3) = 0.080280 + 0.036329 k − 0.002816 k2 +
0.00008416 k3
The amount of soil water extraction (WE; g) at each measured depth is calculated by multiplying the difference between VWC and soil water content just after drainage by the dissected area of the pot in the following equation:
WE (g) = (0.50 − VWC) × 3.14 × 10²
Since the TDR may not measure high VWC well, the estimated value of VWC just after drainage can be calculated from the gravimetric water content of the soil ((pot weight after draining – weight of PVC column)/mass of dry soil that was filled into the PVC column) times the bulk density of the soil (mass of dry soil that was filled into the PVC column/volume of the PVC column that is occupied by the soil).
Soil water extraction (WE10) in the 10-cm layer around each measured depth (i.e., 5–15-, 15–25-, 25–35-, and 35–45-cm layers) is calculated according to the following equation:
WE10 (g) = WE × 10
This equation converts the measured TDR values to the water content of the soil mass from 5 cm above and below each probe. The total amount of water extracted from the 5–45-cm soil layer can be estimated by simply summing the WE10 at each depth. The amounts of soil water extracted from the 0–5- and 45–50-cm layers are not included in the TDR estimation because measurements may become invalid if all of the volume scanned by the waveguide is not soil.
Fig. 1. Plants growing in PVC cylinders with holes drilled in the side for insertion of TDR waveguides to monitor soil water uptake.

30 Methodologies for root drought studies in rice
Traits■ Leaf stage, tiller number, and leaf area■ Progress of water use by weighing of
soil columns on platform balance■ Number of seminal and nodal roots ■ Root length of the main seminal and
nodal root axes ■ Gravimetric soil water content and
bulk density■ Root and shoot dry mass
PrecautionsCare is needed to ensure consistency in packing of soil into the columns so that bulk density is consistent. Soil should be added to the columns in 5-cm-depth increments, which should be pressed into place with a flat plunger before the next increment is added. Using a consistent mass of soil for each pot is essential to ensure that a consistent volume of plant-available water is available to each genotype.
Case studyThe experimental regime described above was implemented by Siopongco et al (2005, 2006), with drought pots drained at 21 DAS and water withheld until about 4 kg of water was lost by transpiration, as estimated by pot weighing. Soil water content in each soil layer was also evaluated nondestructively during the drought period using TDR, from 31 DAS (10 days after drought imposition, during the late drought period).
ResultsThere was close agreement between estimates of soil water content from pot weight and TDR measurements. Genotypes differed significantly in root parameters and in patterns of water
extraction over soil depth. The greater water extraction by DHL-79 in deeper soil layers was associated with a greater root dry weight, a greater root length density, and a higher root growth rate below 30 cm (Table 1). The system provided robust measurements of root growth and water extraction, for quantitative assessment of rice response to water deficit under rainfed lowland conditions. These methods can be adapted to other target ecosystems for study of root growth and water extraction. In addition, the methods could be adapted for study of nutrient uptake dynamics in relation to patterns of root growth in controlled conditions. The use of undisturbed soil cores may provide additional merit for nutrient studies in nonpuddled soils.
Common mistakesThe most common mistake is to inadequately simulate the complex hydrology of rainfed lowland fields, where plants are subjected to fluctuating water conditions, from anaerobic soils with ponded water to aerobic soils with water deficit, during the same growing season. Simplifying the water regime, by using saturated soils from aerobic culture, or well-watered soils as in a favorable upland environment, alters the pretreatment condition before the onset of water deficit, so the plants encounter water deficit from a different initial phenotype. Second, it is essential that the duration of the drought period match the expected duration and intensity of water deficit in the field. If plants are commonly subjected to drought of 28 days’ duration in the field, it is essential that the drought period be 28 days in the soil columns, with the intensity of water deficit (i.e., the extent of water extraction) being similar to the field (i.e., similar soil water potential or similar percent of plant-available volumetric

Assessing root growth and water extraction for rainfed rice 31
Table 1. Average root growth rate from 21 to 43 days after sowing, root to shoot ratio, root mass per tiller, specific root length, deep root mass, and deep root ratio below 30 cm from soil surface at 43 days after sowing among parent and four DHLs. Mean values and LSD0.05 for genotype effect are also shown.
Genotype Root growth ratea (g d–1)
Root to shoot ratio (%)
Root mass per tiller (mg)
Specific root length (m g−1)
Deep root mass (g)
Deep root ratio (%)
Experiment 1
Well-watered
IR62266 0.996 35.2 162 100 0.056 0.4
DHL-51 1.045 41.9 185 69 0.007 0.1
DHL-54 0.956 37.2 164 86 0.152 1.4
DHL-79 1.013 52.3 152 71 0.026 0.3
DHL-32 0.785 37.6 198 77 0.012 0.1
Mean 0.959 40.8 172 81 0.051 0.4
LSD0.05 0.046 3.1 8 6 0.027 0.3
Drought
IR62266 0.137 14.8 76 136 0.379 13.8
DHL-51 0.159 17.6 158 94 0.695 20.3
DHL-54 0.167 16.6 114 94 0.595 21.1
DHL-79 0.249 21.3 128 91 0.462 15.5
DHL-32 0.103 15.1 107 92 0.452 19.5
Mean 0.163 17.1 116 101 0.516 18.0
LSD0.05 0.024 1.2 13 9 0.057 1.4
Experiment 2
Well-watered
IR62266 0.754 38.8 262 88 0.526 2.1
DHL-51 1.068 57.2 506 56 0.910 2.7
DHL-54 0.943 47.3 401 52 1.767 5.8
DHL-79 1.039 65.6 535 48 1.824 5.7
DHL-32 0.567 31.8 405 65 0.569 2.6
Mean 0.874 48.2 422 62 1.119 3.8
LSD0.05 0.094 6.1 48 7 0.284 0.8
Drought
IR62266 0.239 24.2 107 104 0.418 5.3
DHL-51 0.323 34.8 218 74 0.460 4.4
DHL-54 0.333 31.0 198 62 0.635 5.9
DHL-79 0.337 32.6 258 67 0.757 7.2
DHL-32 0.165 23.0 191 79 0.704 11.2
Mean 0.279 29.1 195 77 0.595 6.8
LSD0.05 0.034 2.3 25 7 0.067 1.2
aWithin a column, the largest value is shown in bold, and the smallest in italics.Source: Siopongco et al (2005).
32 Methodologies for root drought studies in rice
water remaining). For valid outcomes in any target environment (e.g., irrigated lowland, rainfed lowland, flood prone, upland, aerobic, alternate wetting and drying, etc.), it is essential that conditions in soil columns mimic those in the field. Hydrologic sequence has strong implications for patterns of G × E and adaptation (Wade et al 1999c, Samson et al 2002, Acuna et al 2008). Consequently, field validation is essential for controlled-environment studies to ensure that results are correct.
ReferencesAcuna TLB, Lafitte HR, Wade LJ.
2008. Genotype by environment interactions for yield in upland rice backcross lines in diverse hydrological environments. Field Crops Res. 108:117-125.
Azhiri-Sigari T, Yamauchi A, Kamoshita A, Wade LJ. 2000. Genotypic variation in response of rainfed lowland rice to drought and rewatering. 2. Root growth. Plant Prod. Sci. 3:180-188.
Cassel DK. 1992. Time domain reflectometer version 2.1. North Carolina State University, Raleigh, N.C.
Kamoshita A, Rodriguez R, Yamauchi A, Wade LJ. 2004. Genotypic variation in response of rainfed lowland rice to prolonged drought and rewatering. Plant Prod. Sci. 7:406-420.
Kamoshita A, Wade LJ, Yamauchi A. 2000. Genotypic variation in response of rainfed lowland rice to drought and rewatering. 3. Water extraction during the drought period. Plant Prod. Sci. 3:189-196.
Samson BK, Hasan M, Wade LJ, 2002. Penetration of hardpans by rice lines in the rainfed lowlands. Field Crops Res. 76:175-188.
Siopongco J, Yamauchi A, Salekdeh H, Bennett J, Wade LJ. 2005. Root growth and water extraction response of doubled-haploid rice lines to drought and rewatering during the vegetative stage. Plant Prod. Sci. 8:497-508.
Siopongco J, Yamauchi A, Salekdeh H, Bennett J, Wade LJ. 2006. Growth and water use response of doubled-haploid rice lines to drought and rewatering during the vegetative stage. Plant Prod. Sci. 9:141-151.
Topp GC, Davis JL, Annan AP. 1980. Electromagnetic determination of soil water content: measurements in coaxial transmission lines. Water Resour. Res. 16:574-582.
Wade LJ, Amarante ST, Olea A, Harnpichitvitaya D, Naklang K, Wihardjaka A, Sengar SS, Mazid MA, Singh G, McLaren CG. 1999a. Nutrient requirements in rainfed lowland rice. Field Crops Res. 64:91-107.
Wade LJ, Fukai S, Samson BK, Ali A, Mazid MA. 1999b. Rainfed lowland rice: physical environment and cultivar requirements. Field Crops Res. 64:3-12.
Wade LJ, George T, Ladha JK, Singh U, Bhuiyan SI, Pandey S. 1998. Opportunities to manipulate nutrient by water interactions in rainfed lowland rice systems. Field Crops Res. 56:93-112.
Wade LJ, Kamoshita A, Yamauchi A, Azhiri-Sigari T. 2000. Genotypic variation in response of rainfed lowland rice to drought and rewatering. 1. Growth and water use. Plant Prod. Sci. 3:173-179.

Assessing root growth and water extraction for rainfed rice 33
Wade LJ, McLaren CG, Quintana L, Harnpichitvitaya D, Rajatasereekul S, Sarawgi AK, Kumar A, Ahmed HU, Sarwoto Singh AK, Rodriguez R., Siopongco J, Sarkarung S. 1999c. Genotype by environment interaction across diverse rainfed lowland rice environments. Field Crops Res. 64:35-50.
Wopereis MCS. 1993. Quantifying the impact of soil and climate variability on rainfed rice production. PhD thesis. Wageningen (Netherlands): Wageningen Agricultural University. 188 p.
NotesAuthors’ addresses: L.J. Wade, Charles Sturt
University, EH Graham Centre, Wagga Wagga NSW 2678, Australia; J. Siopongco, National Institute of Crop Science, 2-1-18 Kannondai, Tsukuba, Ibaraki 305-8515, Japan; A. Kamoshita, The University of Tokyo, Midoricho, Tanashi, Nishitokyo 1880002, Japan; B.K. Samson, IRRI-Lao Office, NAFRI Compound, Xaythani District, Vientiane Capital, Lao PDR; T. Acuna, University of Tasmania, Tasmanian Institute of Agriculture, Hobart TAS 7001, Australia.

34 Methodologies for root drought studies in rice
Preamble
Rice crops commonly encounter zones of restricted root access, which can greatly reduce uptake of resources from deeper soil layers. As a result, yield can decrease with greater vulnerability to fluctuating weather conditions, especially under rainfed systems (Samson et al 2002). Root access can be restricted by hardpan formation during cultivation, smearing during puddling, or sudden changes in soil texture with depth. These zones of higher soil strength and increased impedance to root elongation are not uniform across the field, so repeatable screens involving the placement of a paraffin wax/petroleum jelly layer in a soil column have been used to identify promising lines (Yu et al 1995, Ray et al 1996, Babu et al 2001, Clark et al 2000, 2002). Field validation is still essential (Samson et al 2002).
Materials used■ Paraffin wax pellets■ Petroleum jelly (Vaseline, Sigma-
Aldrich)■ PVC pipes, 0.20 m in diameter
Assessing root penetration ability and resource capture from deeper soil layersLen J. Wade, Rolando T. Cruz, Joel Siopongco, Sergio Moroni,Benjamin K. Samson, and Tina Acuna
Methods adopted
Wax layersWax layers were prepared by melting together paraffin wax pellets with petroleum jelly in the required quantities to produce wax layers (WV) 0.20 m in diameter and 0.03 or 0.05 m thick of 3:97, 20:80, 40:60, 60:40, and 80:20 paraffin wax:petroleum jelly (Acuna and Wade 2005, Acuna et al 2007), following the techniques of Yu et al (1995) and Clark et al (2000). The mixture was poured into molds of 0.20 m in diameter to match the internal diameter of the polyvinyl chloride (PVC) columns. Yu et al (1995) reported that these wax layers were equivalent to strengths of 0.1, 0.2, 0.5, 1.5, and 3.0 MPa, respectively, at 20 oC. With a hand-held pressure gauge, our values were 0.01, 0.03, 1.00, 1.70, and 2.50 MPa.
Cultural detailsCylindrical columns made from PVC of 0.20-m internal diameter and 0.55-m height were split in half length-ways for easy access to roots. Columns were partially filled with air-dried Mahaas clay soil (28% clay, 44% silt, 28% sand; pH 5.2, Wopereis 1993) to a depth of 0.20 m below the intended soil surface. The wax layer was placed on top and sealed to the column wall with silicone to prevent roots from escaping. The column above the wax layer was then filled with Mahaas clay soil, so the wax layer was at 0.20-m depth. Holes for drainage or
Assessing root penetration ability and resource capture from deeper soil layers 35
water entry were drilled in pots just above the depth of the wax layer, and just above the base of the column, which was sealed to the column with epoxy (Siopongco et al 2008, 2009). Depending on the treatment, these drainage holes could be sealed with a rubber stopper to prevent water entry or loss, or the stopper could be removed to allow drainage or water entry. Columns were watered from the soil surface and/or by placing the column in a shallow tray containing 0.10 mm of water, according to the treatment.
TreatmentsFour contrasting water regimes were applied: well-watered above and below the wax layer (WW), water deficit above and well-watered below (WD/WW), well-watered above and water deficit below (WW/WD), and water deficit above and below the wax layer (WD/WD). For WW, the water regime depended upon the target environment. For rainfed lowland, a flooding depth of 0.02 m was maintained, while for aerobic or upland conditions, soil was watered to saturation without ponding of surface water. For WD, columns were drained and watering withheld for the period of drought stress. If re-watering was intended after the period of drought stress, conditions reverted to the WW treatment imposed earlier.
VariationsThis experimental system allows water availability to be varied independently of wax layer strength, allowing exploration of how an entry may be successful in penetrating a zone of higher impedance (Acuna and Wade 2005, Acuna et al 2007). Likewise, a series of wax layers may be placed within the same soil column, with successive wax layers being higher in impedance (i.e., higher wax content), in order to efficiently screen for root penetration ability (Kubo et al 2004). Alternative methods can also be
evaluated, such as weighted soils, as it is important to recognize that all artificial systems involve assumptions about root behavior (Clark et al 2002). A root finds a passage between soil particles, rather than penetrating per se. The wax layer itself is anaerobic and uniform in texture, so it is recommended that the wax layer be kept thin. Although agreement in penetration ability is reported between wax layers and the field (Clark et al 2002, Samson et al 2002), we believe it is essential to validate results in the field.
Traits■ Leaf stage, tiller number, and leaf area■ Progress of water use by weighing of
soil columns on platform balance■ Number of seminal and nodal roots
above and below the wax layer■ Root length of the main seminal and
nodal root axes below the wax layer■ Gravimetric soil water content and
bulk density above and below the wax layer
■ Root and shoot dry mass■ Proportions of root number and of root
dry weight below the wax layer
PrecautionsTo ensure consistent resistance to root penetration, the paraffin wax/vaseline mixture should be poured into the mold on an electronic balance so that consistent mass and thickness are attained (Acuna and Wade 2005, Acuna et al 2007). Allow the mixture to cool and harden before placing it in the soil columns. Use a consistent mass of soil below and above the wax layer in each column. Add soil to the column in 0.05-m increments, pressing each layer into place firmly with a flat plunger to ensure that a consistent bulk density is attained. It

36 Methodologies for root drought studies in rice
is essential that the wax layer be placed gently but firmly onto the leveled and tamped soil surface in the column, prior to sealing the wax layer to the column wall with silicone. Soil above the wax layer is then added and firmed in 0.05-m increments until the desired depth to wax layer is achieved.
Case studyA modified system of sealing the wax layer in place, so there was no prospect of root escape through cracks or past the wax layer, was devised by Cruz et al (n.d.), as described below.
MethodsPVC cylinders were cut horizontally to create an upper 20-cm and a lower 30-cm layer (Fig. 1A, B). The upper and lower halves of the cylinders were attached by clamps and silicone was applied on the cut surfaces. The bottom of the lower half was capped and silicone was applied on the edges to prevent water seepage. After increments of soil were added to form the lower layer, clamps were removed, and a thin-walled PVC cylinder (0.3 cm thick, 30 cm long) with a 30-cm slit tightly enclosed the upper portion of the lower cylinder. The wax layer was placed on the surface of the PVC and soil (i.e., it extended to the outside edge of the inner cylinder). Then, the upper 20-cm PVC cylinder was slid inside the jacket until it tightly compressed the wax layer, and the clamp was tightened around the jacket over the wax layer zone, rendering it rigid. Increments of soil were then loaded and pressed into the upper cylinder. Compression of the wax layer by the PVC cylinders prevented root escape (Fig. 1 C, D). Two wax strengths were used: (a) 35 wax:65 vaseline, 4 mm thick, giving a wax strength of 0.05 MPa, and (b) 70 wax:30 vaseline, 8 mm thick, giving a
wax strength of 0.40 MPa. Pots were well watered initially, with a ponded water depth of 1 cm being maintained. From 26 DAS (days after sowing), water was withheld in the drought treatment for 28 days.
ResultsIn the well-watered treatment, the number of nodal roots that penetrated the wax layer increased linearly, and root penetration was higher with 0.05 MPa than with 0.40 MPa wax strength (Table 1). Under water deficit, the number of penetrated roots declined significantly, and the reduction was greater with 0.40 MPa wax strength. Percent of total root dry weight below the wax layer was higher in the stress than in the control. In stress and control, the percent of total root dry weight below the wax layer was greater with 0.05 MPa wax strength. Root dry weight in the control increased linearly during the treatment period. The increase was greater with 0.05 MPa wax strength than with 0.40 MPa wax strength. Under water deficit, root dry weight decreased significantly, and reached a plateau at 21 DAWW (days after withholding water). Although root dry weight was lower under water deficit, the plateau was higher for 0.05 MPa wax strength than for 0.40 MPa wax strength. Shoot dry weight increased exponentially in well-watered at both wax strengths. Under water deficit, shoot dry weight was lower than the control, but still increased linearly with time. This system, with the wax layer carefully clamped in place, allowed robust data to be collected on root penetration and root growth below the wax layer, without any root escape.

Assessing root penetration ability and resource capture from deeper soil layers 37
Fig. 1. (A) Schematic of the PVC cylinder/pot–wax disc/layer system used in the current study. After placing the wax disc on the surface of the soil and lower 30-cm PVC cylinder, the upper 20-cm PVC cylinder was inserted in the thin-walled PVC jacket until it compressed the wax disc. Then, soil, NPK fertilizers, and water were added. (B) Compressing the wax disc (8 mm thick, 0.40 MPa wax strength) prevented root bypass as shown here. A similar response was observed with wax disc 4 mm thick and 0.05 MPa wax strength (photo not shown). Hence, the technique of compressing the wax disc enabled better assessment of root penetration through wax layers of various strengths. (C) Schematic of the PVC cylinder–wax disc system used in an earlier trial. After inserting the wax disc and laying it on the surface of the soil at 20-cm depth, silicone was applied around the edges of the wax disc and wall of the cylinder. (D) Application of silicone around the edges of the wax disc and PVC wall did not completely seal the edges of the wax disc and PVC wall and this resulted in 30–40% of the roots bypassing the wax disc or roots passing through spaces between the silicone and wax disc and between the silicone and PVC wall.
A C10 cm 10 cm
30 cm30 cm
20 cm 20 cm
Upper 20-cm cylinder inserted in the jacket pressed against the wax disc and soil added
Thin-walled PVC jacket tightly enclosed the upper and lower cylinders and clamped
Silicone applied around the edges of the wax disc and PVC wall
Cap placed at the bottom and sealed to prevent drainage
Cap placed at the bottom and sealed to prevent drainage
Wax disc Wax disc
Clamp
Soil
Soil
Soil
B D
After removal of the other half of the PVC cylinder and soil, shows wax disc (strength 0.40 MPa) placed inside the PVC cylinder and silicone applied around its edges and PVC wall
After removal of the other half of the PVC cylinder, thin-walled jacket, and some soil, shows wax disc (strength 0.40 MPa) compresed by the upper and lower PVC cylinders
No root bypass Root bypass
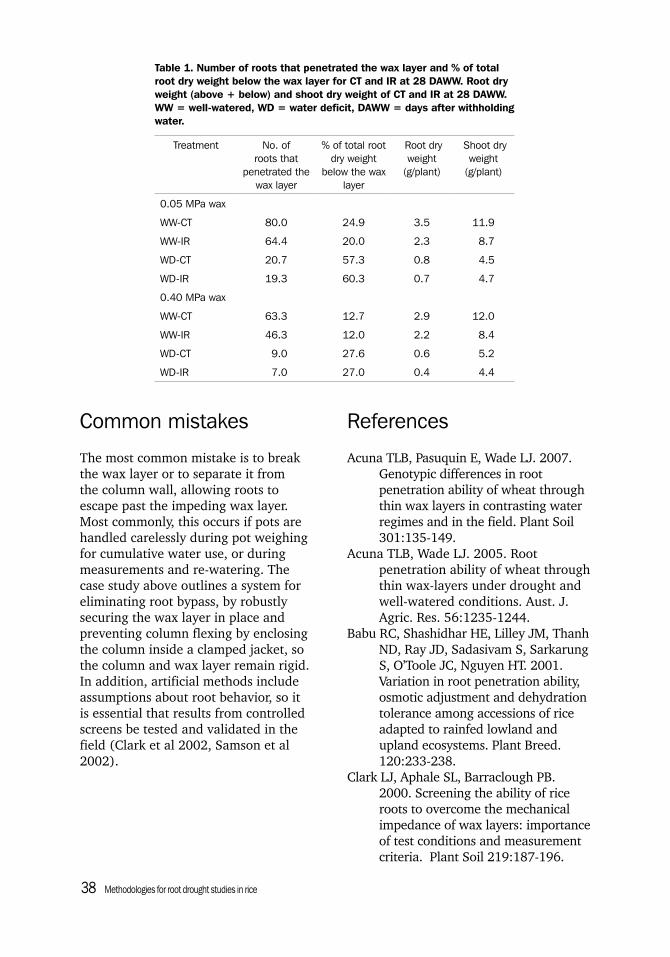
38 Methodologies for root drought studies in rice
Common mistakes
The most common mistake is to break the wax layer or to separate it from the column wall, allowing roots to escape past the impeding wax layer. Most commonly, this occurs if pots are handled carelessly during pot weighing for cumulative water use, or during measurements and re-watering. The case study above outlines a system for eliminating root bypass, by robustly securing the wax layer in place and preventing column flexing by enclosing the column inside a clamped jacket, so the column and wax layer remain rigid. In addition, artificial methods include assumptions about root behavior, so it is essential that results from controlled screens be tested and validated in the field (Clark et al 2002, Samson et al 2002).
Table 1. Number of roots that penetrated the wax layer and % of total root dry weight below the wax layer for CT and IR at 28 DAWW. Root dry weight (above + below) and shoot dry weight of CT and IR at 28 DAWW. WW = well-watered, WD = water deficit, DAWW = days after withholding water.
Treatment No. of roots that
penetrated the wax layer
% of total root dry weight
below the wax layer
Root dry weight
(g/plant)
Shoot dry weight
(g/plant)
0.05 MPa wax
WW-CT 80.0 24.9 3.5 11.9
WW-IR 64.4 20.0 2.3 8.7
WD-CT 20.7 57.3 0.8 4.5
WD-IR 19.3 60.3 0.7 4.7
0.40 MPa wax
WW-CT 63.3 12.7 2.9 12.0
WW-IR 46.3 12.0 2.2 8.4
WD-CT 9.0 27.6 0.6 5.2
WD-IR 7.0 27.0 0.4 4.4
References
Acuna TLB, Pasuquin E, Wade LJ. 2007. Genotypic differences in root penetration ability of wheat through thin wax layers in contrasting water regimes and in the field. Plant Soil 301:135-149.
Acuna TLB, Wade LJ. 2005. Root penetration ability of wheat through thin wax-layers under drought and well-watered conditions. Aust. J. Agric. Res. 56:1235-1244.
Babu RC, Shashidhar HE, Lilley JM, Thanh ND, Ray JD, Sadasivam S, Sarkarung S, O’Toole JC, Nguyen HT. 2001. Variation in root penetration ability, osmotic adjustment and dehydration tolerance among accessions of rice adapted to rainfed lowland and upland ecosystems. Plant Breed. 120:233-238.
Clark LJ, Aphale SL, Barraclough PB. 2000. Screening the ability of rice roots to overcome the mechanical impedance of wax layers: importance of test conditions and measurement criteria. Plant Soil 219:187-196.

Assessing root penetration ability and resource capture from deeper soil layers 39
Clark LJ, Cope RE, Whalley WR, Barraclough PB, Wade LJ. 2002. Root penetration of strong soil in rainfed lowland rice: comparison of laboratory screens with field performance. Field Crops Res. 76:189-198.
Cruz RT, Moroni S, Wade LJ. n.d. Leaf and root osmotic adjustment and dry matter in rice in response to water deficit and mechanical impedance to root growth (in preparation).
Kubo K, Jitsuyama Y, Iwama K, Hasegawa T, Watanabe N. 2004. Genotypic difference in root penetration ability by durum wheat (Triticum turgidum L. var. durum) evaluated by a pot with paraffin-Vaseline discs. Plant Soil 262:169-177.
Ray JD, Yu L, McCouch SR, Champoux MC, Wang G, Nguyen HT. 1996. Mapping quantitative trait loci associated with root penetration ability in rice (Oryza sativa L.). Theor. Appl. Genet. 42:627-636.
Samson BK, Hasan M, Wade LJ. 2002. Penetration of hardpans by rice lines in the rainfed lowlands. Field Crops Res. 76:175-188.
Siopongco J, Sekiya K, Yamauchi A, Egdane J, Ismail AM, Wade LJ. 2008. Stomatal responses in rainfed lowland rice to partial soil drying: evidence for root signals. Plant Prod. Sci. 11:28-41.
Siopongco J, Sekiya K, Yamauchi A, Egdane J, Ismail AM, Wade LJ. 2009. Stomatal responses in rainfed lowland rice to partial soil drying: comparison of two lines. Plant Prod. Sci. 12:17-28.
Wopereis MCS. 1993. Quantifying the impact of soil and climate variability on rainfed rice production. PhD thesis. Wageningen (Netherlands): Wageningen Agricultural University. 188 p.
Yu LX, Ray JD, O’Toole JC, Nguyen HT. 1995. Use of wax-petrolatum layers for screening rice root penetration. Crop Sci. 35:684-687.
NotesAuthors’ addresses: L.J. Wade and S. Moroni,
Charles Sturt University, EH Graham Centre, Wagga Wagga NSW 2678, Australia; R.T. Cruz, Philippine Rice Research Institute, Science City of Muñoz, Nueva Ecija 3119, Philippines; J. Siopongco, National Institute of Crop Science, 2-1-18 Kannondai, Tsukuba, Ibaraki 305-8515, Japan; B.K. Samson, IRRI-Lao Office, NAFRI Compound, Xaythani District, Vientiane Capital, Lao PDR; T. Acuna, University of Tasmania, Tasmanian Institute of Agriculture, Hobart TAS 7001, Australia.

40 Methodologies for root drought studies in rice

Methodologies for managed drought stress experiments in the field 41
Field methods

42 Methodologies for root drought studies in rice
Methodologies for managed drought stress experiments in the field 43
Introduction
Drought experiments under field conditions are necessary to obtain results targeted to farmers’ fields. However, field experiments require some manipulation and strategies to manage the severity and duration of drought, and to be able to reduce the effects of other environmental factors. These management strategies and experimental controls are discussed below for upland and lowland rice environments.
Protocols common to both lowland and upland fields
1. Site selectionThe site characteristics must be representative of the target production environment (soil type and climate). The field for the drought-stress treatment should be located at the upper position of the toposequence, for example, by terracing. There should be no flooded field, active irrigation canal, or impounded water such as a reservoir nearby in order to prevent seepage that can influence the moisture content of the top 70-cm soil column of the experimental plots. Locating the control treatment lower in the toposequence than the stress treatment can help to reduce seepage and improve drainage of the stress treatment. Spatial variability should be minimal, such as the depth
Methodologies for managed drought stress experiments in the fieldRolando Torres, Amelia Henry, and Arvind Kumar
of top soil and other soil characteristics. The source of irrigation water should be reliable and easily accessible. The plots must be easy to drain when imposing drought stress. A canal surrounding the drought treatment field can help with drainage. Finally, the area should be safe against stray animals, vandalism, and other external interferences. Some passers-by may want to irrigate the drought-stressed plots out of mercy for the plants. Therefore, putting up a “Do Not Irrigate” sign may be necessary.
2. Setting up the experimentSchedule the field experiment during the dry season or when there will be a substantially long dry spell to create drought stress coinciding with the target crop stage. Plan to irrigate the control treatment throughout the study, and the drought treatment as needed when soil moisture reaches critical levels, as described below. Types of irrigation include sprinkler systems, line source, surface flooding, and drip tape (Fig. 1). Apply basal fertilizer during the final land preparation at the rate of 40-40-40, a topdress of 40 kg N ha−1 at 4 to 5 weeks after emergence, and a similar topdress at least 3 days before draining the field. Surface water should be reduced to a minimum before applying fertilizer. Do not apply fertilizer to the crop when the soil is too dry or the plants can be damaged. If there is a local recommended fertilizer rate, use it instead.

44 Methodologies for root drought studies in rice
Surface soil should be thoroughly leveled to achieve an even spread of water during irrigation and even drying when draining to impose drought stress. Refrain from entering the water-soaked plots to avoid creating footprints that will serve as water pockets when draining to initiate drought. Establish the well-watered and drought-stressed treatments in separate field blocks to avoid a seepage problem, except if a regulated drip irrigation system will be used. However, it is ideal to have these treatments at the same site so that they will incur similar soil and other environmental conditions. When more than 20 cultivar entries are to be tested, the plots should be laid out in an alpha lattice design; otherwise, a randomized complete block design can be used. If there are significant gradients or spatial variations in the area, a suitable experimental design should be used. There should be at least three treatment
replications. Include drought-tolerant, drought-susceptible, and local cultivars among the test entries as checks for comparisons of drought effects. The plot should be at least 3 m long containing 3 rows with 25 cm of space in between to obtain a harvest sampling area of 3 rows × 2 m with a 50-cm border at the end of each row. Adjacent plots serve as borders, and an extra row can be planted as a border around the outermost plots.
3. Crop managementProper agronomic management such as fertilizer application and pest control should be followed to prevent confusing other stress symptoms with those of drought stress. One exception is for the second topdressing of fertilizer: this is skipped in drought experiments in both the well-watered control and drought treatments, since the two treatments should receive the same fertilizer
Fig. 1. Types of irrigation for rice/drought studies: (A) sprinkler irrigation, (B) surface/flooding, (C) drip tape, and (D) line-source experiment.

Methodologies for managed drought stress experiments in the field 45
treatment and the fertilizer will not be effective when applied to dry soil of the drought treatment. It may be necessary to follow local cultural and agronomic crop management practices.
4. Timing of drought stressThe flowering stage was found to be the most sensitive period of rice for drought stress. However, rice growth and yield can be affected significantly by drought at any crop stage. Managing the timing and severity of drought in the experiment should be based on the drought characteristics in the target production area. Since timing is an important element of drought, it is necessary to group the test cultivars by maturity duration and establish them in separate fields or plant the longer duration group ahead of time in order to synchronize drought imposition with the crop growth stage. It would help to know the flowering date of the test materials for planning the time to initiate drought stress. Since the period from panicle initiation to flowering and flowering to maturity in rice each generally take about 30 days, these crop growth stages can also be estimated if the maturity duration of the cultivar is known. The drought treatment plots should be irrigated and fertilized similarly to the nonstressed plots before the drought treatment is imposed. To compare drought response with susceptible checks, we do not allow drought stress to become so severe as to kill drought-susceptible genotypes. As described below for lowland and upland experiments, drought treatments are re-watered when soil water potential declines to a certain threshold. However, care should be taken when deciding when to re-water, because this will differentially affect genotypes with different times to flowering. Re-watering could favor the yield of genotypes about to flower at the time of re-watering, but not those that have already flowered. If genotypes
were severely drought stressed and are re-watered after grain filling has begun, it is also possible that new tillers will form that subsequently set seed. Re-watering by flooding will result in another long-duration drydown cycle, whereas a light re-watering by sprinkler irrigation could be enough to keep plants alive but not cause a lot of discrepancy among genotypes with different times to flowering. All of these factors should be considered when deciding when and how to re-water.
5. Drought stress severityThe severity of the drought stress to apply in lowland or upland fields can be gauged in the expected yield reduction of drought-stressed over well-watered rice plants (Table 1).
6. Monitoring soil moistureSoil moisture can be monitored soon after the imposition of drought stress. The following devices are commonly used (Fig. 2):a. Rain gauge—to be monitored each day
that there was rain.b. Tensiometers—If available, install at
least one unit per replicate with the porous cup set at 30-cm soil depth and monitored at least every 2 days. It is important to maintain enough water inside the tensiometer so that a vacuum will be maintained inside the tube as water moves out through the porous cup.
Table 1. Classification of drought-stress severities in field trials as determined by yield reduction in the stress treatment compared with the well-watered control.
Stress Yield reduction
Lowland Upland
Mild Less than 30% Less than 40%
Moderate 31–64% 41–75%
Severe 65–85% 75–90%
Overstressed 85% or more 90% or more

46 Methodologies for root drought studies in rice
c. Observational tube well (also called a piezometer or water table tube)—to monitor water table depth throughout the drydown period. A tube well can be made from a 1.2-meter-long × 2-inch-diameter PVC pipe with small perforations/slits. The bottom of the tubes and, if necessary, the perforations on the side of the tube can be wrapped with hardware cloth so as not to clog the perforations. It is very important to prevent filling of the tubes with mud. Tubes are installed to a depth of 1 meter, with the extra 20 cm protruding above the soil surface. The water table depth is monitored using a measuring stick, and recorded as distance from the soil surface.
Other devices can be used to monitor soil water status, most of which determine volumetric water content of the soil through reflection of electric signals (Table 2). Gravimetric soil moisture measurements are also reliable. Soil is sampled into a sealed container, weighed, dried, and weighed again. The gravimetric soil moisture content is equal to the weight of the water in the sampled soil/weight of the dry soil.
7. Plant water status Plant water status measurements can help supplement soil moisture data for characterizing the type of drought stress, and to distinguish between drought-tolerant and sensitive genotypes. Leaf water potential (LWP) is the pressure
Fig. 2. Simple tools for characterizing the type of drought stress that occurs in drought field experiments. (A) A tensiometer for measuring soil water potential and (B) a home-made tube well (piezometer or water table tube) that is sealed on the bottom with cotton cloth, and with narrow slits in the side to allow entry of water but prevent filling with mud.
A B

Methodologies for managed drought stress experiments in the field 47
Table 2. Devices for monitoring soil and plant water status.
Device Description
Tensiometer Measures soil water potential (kPa) using a tube with porous cap and dial gauge instead of the conventional mercury column.
Capacitance or TDR sensors for volumetric water content
Sensors can be installed directly in the soil, or can be portable and inserted through PVC access tubes for measurement. Data are stored by a datalogger or in the console and downloaded to a computer.
Pressure chamber To determine plant water status (leaf water potential) by measuring the amount of pressure that would cause water to be exuded from a plant (leaf) inside the pressure chamber.
Infrared gun Indirect measurement of plant water status by measuring its canopy temperature.
required for exudation of sap from the cut tip of an excised leaf. LWP becomes more negative as soil moisture decreases. This measurement is done with a pressure chamber. Canopy temperature can be measured using an infrared (IR) gun. This measurement is a rapid estimation of leaf water status, since transpiring leaves with open stomates have a cooler temperature due to evaporation compared with leaves with the stomates closed. Care must be taken to avoid the soil background when measuring, which is usually much hotter than the leaves.
8. Minimum data collection for characterization of drought-stress treatments
The following data should be collected during the course of the study:a. Flowering date recorded when
about 50% of the hills in a plot have flowered.
b. Maturity dates recorded when almost all filled grains turn brown. This is not always equal to harvest date since sometimes harvesting is delayed for different reasons even if the crop is mature.
c. Leaf rolling and leaf drying ratings with a score of 0 for nonstress and 9 for stress near permanent wilting point, as described in the SES (IRRI 1996).
d. Plant height at maturity taken from at least three random plants per plot measured from the ground level to the highest part of the plant.
e. Grain yield taken from at least 3 rows × 2 linear m per row weighed as filled grains with the corresponding grain moisture content. This should be normalized to filled grain weight at 14% moisture content.
f. Dry weight of above-ground biomass consisting of filled and unfilled grains + straw + rachis from which the harvest index (HI) is determined. HI = filled grains/total above-ground biomass.
Protocols for upland field conditions
1. Land preparationPlow, then rotovate the field until the soil clods are broken into small granules. If the soil is too tough to break the clods, allow the field to dry completely, then apply a sprinkler irrigation followed by rotovation or harrowing. Construct furrows about 10 cm deep and 25 cm apart.

48 Methodologies for root drought studies in rice
2. Sowing Sowing can be done by dibbling 3 to 5 seeds directly in the furrows at 10-cm intervals or by spreading the seed continuously in the furrows at 1.5 to 2.0 grams per linear meter. Do not overseed. Cover the sown seeds thinly with fine soil granules.
3. IrrigationApply sprinkler or surface irrigation to wet at least the top 15 cm of the soil starting after sowing. If surface irrigation will be used, it should be done carefully so that the soil will not be washed out, especially when the seedlings have not yet fully established. Repeat the irrigation every 2 to 3 days to keep the soil moisture at least close to field capacity. In some upland experiments, a line source irrigation setup will be used to apply a linearly decreasing source of water from a central irrigation line. This differential irrigation should be initiated after the crop has established (about 4 weeks) and applied several times per week. Amounts of irrigation to each differentially-irrigated block should be monitored by collection of irrigation water into rain gauges. Since differential irrigation is critical in line-source experiments, it is important to irrigate during periods of low wind. It may be necessary to irrigate before dawn in some locations. The line-source technique cannot be used effectively in lowland conditions due to the typical appearance of cracks, through which the irrigation water moves very quickly.
4. Drought-stress treatmentImpose drought stress by withholding irrigation or reducing its frequency. The frequency may vary based on the drying capacity of the soil and the degree of drought stress desired. Upland fields tend to dry much more rapidly than lowland fields. To impose drought stress on cultivars maturing in about 110 days,
irrigation should be withheld starting at about■ 35 to 40 days after emergence (DAE)
to target the vegetative stage. The drought stress cycle for this period would cover about 2 weeks.
■ 45 to 50 DAE or at about panicle initiation (PI) stage to target the reproductive stage.
■ 35 DAE to target mild stress at the vegetative stage to more severe stress at the reproductive stage. If severe drought stress is expected from the vegetative through reproductive stages in the target production area, that area may not be suitable for rice at all.
Leaf rolling symptoms of drought stress in upland rice can start within 5 days after withholding the irrigation. Plants should be re-watered twice in the same manner as before draining when soil tensiometers installed at a 30-cm depth register soil water potentials of −50 to −70 kPa. This usually starts to happen after 2 weeks of drought when drought-sensitive checks are wilting and at least 50% of the entries show severe leaf rolling during the peak sunshine of the day. For drought stress that includes the reproductive stage, the cycle of drying and re-watering is repeated until crop maturity.
Protocols for lowland field conditions
1. Land preparationSurround the experimental block with bunds to be able to impound water. Puddle the soil thoroughly and keep it soaked for transplanting.
2. PlantingEstablish the seedlings in either a dry or wet bed nursery. Pull the seedlings when they are 17 to 21 days old. Transplant 3 to 4 seedlings per hill at 20-cm intervals in rows with 25-cm spacing.

Methodologies for managed drought stress experiments in the field 49
3. Irrigation After transplanting, the plots can be kept wet-soaked but not flooded for a week to reduce the incidence of early-stage pests. It will be necessary to apply preemergence herbicide if many weeds are expected to emerge. A week after transplanting, flood the plots to about 5-cm surface water.
4. Drought-stress treatmentThe whole drought treatment block should be uniformly wet before starting the drought treatment. Draining the field by allowing water to just subside naturally may cause differential draining time between elevated and depressed areas. Therefore, the plots should be first completely irrigated before manually draining them. Drain by opening the bunds and water outlets around the field. Some depressed areas may need a small lead canal to drain the water out. Because of differences in soil structure, it takes a longer time for the lowland soil to dry; hence, drought-stress treatments should be started much earlier than in the upland. To impose drought stress of cultivars maturing in about 110 days, irrigation should be withheld starting at about■ 15 days after transplanting (DAT) to
target the vegetative stage. Drought stress for this stage would cover about 2 weeks. Since it usually takes more than 3 weeks after draining to attain severe drought stress in lowland, only mild stress may occur at the vegetative stage before the plants reach the panicle initiation (PI) stage and are re-watered.
■ 30 DAT or about PI stage to target the reproductive stage.
■ 15 DAT to target the vegetative through reproductive stage.
Plants should be re-watered when soil tensiometers installed at 30-cm depth register soil water tension of −50 to −70 kPa. This usually happens after about 3 weeks or later after draining when
drought-sensitive checks are wilting and at least 50% of the entries are showing severe leaf rolling during the sunshine peak of the day. Re-water by closing the water outlets and then completely soaking the plots. After cutting the irrigation supply, the water usually subsides through soil cracks evenly from the whole field. If this does not happen, the plots should be drained after 6 hours of soaking. The soil is allowed to dry again and will be re-watered when soil water tension again reaches −50 to −70 kPa. For drought stress that includes the reproductive stage, the cycle of drying and re-watering is repeated until crop maturity.
Case study: growth of IR64 under drought stress in lowland conditions
This experiment was conducted during the 2010 wet season at IRRI. The experiment was managed according to the procedures described above, in order to compare root growth of IR64 in drought and well-watered treatments, and to compare the monolith and soil core methods for root sampling (as described in the following chapter, Henry et al). Irrigation was conducted by surface flooding. Rainfall was measured at a nearby weather station managed by the IRRI Climate Unit (Fig. 4), and soil water potential and water table depths were monitored as described above (Figs. 5 and 6). Based on yield reductions (Table 3), rainfall and other climate conditions in addition to the timing of drainage and soil drydown resulted in a “mild” drought stress, as described in Table 1.

50 Methodologies for root drought studies in rice
Fig. 4. Daily rainfall during the course of the experiment.
0
50
100
150
200
250
300
0 20 40 60 80 100 120Days after sowing
Daily rainfall (mm)
Fig. 5. Tensiometer readings of soil water potential. Data points are the average of three tensiometers ± standard error.
0
10
20
30
40
50
60
70
8060 65 70 75 80 85 90 95 100 105 110
Days after sowing
Soil water potential (–kPa)
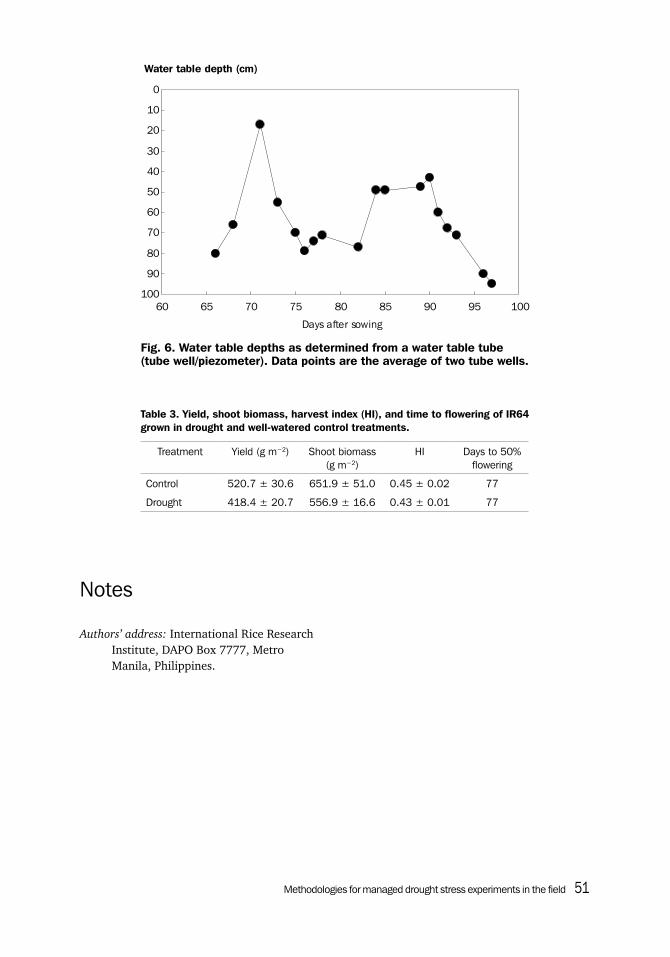
Methodologies for managed drought stress experiments in the field 51
Table 3. Yield, shoot biomass, harvest index (HI), and time to flowering of IR64 grown in drought and well-watered control treatments.
Treatment Yield (g m−2) Shoot biomass (g m−2)
HI Days to 50% flowering
Control 520.7 ± 30.6 651.9 ± 51.0 0.45 ± 0.02 77
Drought 418.4 ± 20.7 556.9 ± 16.6 0.43 ± 0.01 77
Notes
Authors’ address: International Rice Research Institute, DAPO Box 7777, Metro Manila, Philippines.
Fig. 6. Water table depths as determined from a water table tube (tube well/piezometer). Data points are the average of two tube wells.
0
10
20
30
40
50
60
70
80
90
10060 65 70 75 80 85 90 95 100
Days after sowing
Water table depth (cm)

52 Methodologies for root drought studies in rice
Root sampling in the field with soil cores and monoliths Amelia Henry, Rolando Torres, and Leonardo Holongbayan
Preamble
Whereas excavation of an entire root system is impractical for studies with replications and multiple genotypes, root sampling by core or monolith allows a representative sample of root length density and comparison of genotypes and treatments in a timely manner. The first step in any root/drought field study is to ensure a uniform and effective drought treatment; these protocols are described in the previous chapter (Torres et al). We have found core sampling to be preferable over monolith sampling due to greater efficiency in sample processing and less disturbance to surrounding plants. Protocols for both strategies and some supporting data on root length density are described here.
Materials used
This method can be divided into three separate steps, each of which requires different materials: sampling in the field (Box 1), root washing (Box 2), and root scanning (Box 3). Equipment for sampling includes a monolith (Fig. 1) or core sampler (Fig. 2) and chain block with stand (Fig. 3). Infrastructure for a root washing area is helpful (Fig. 4). A root scanner and image analysis program (WinRhizo, Regent Instruments, Quebec, Canada) is used for determining root length and diameter.
Box 1. Accessories for the field component of root sampling.
■ Core or monolith samplers (Figs. 1 and 2) ■ Hammer/mallet■ Block of wood or a segment cut from a rubber tire to protect core tube/monolith sampler
while hammering into soil■ Metal rods for pulling out core tubes■ Chain block■ Chain block stand■ Work table, with one protruding edge to facilitate hammering soil from end of core tube■ Wooden dowel (slightly smaller than diameter of core tube) and smaller hammer for
removing soil from end of core tube■ Spatulas, etc., for dividing soil core and removing from core tube■ Meter stick for dividing soil sample into depth segments■ Plastic bags■ Rubber bands■ Marker pens

Root sampling in the field with soil cores and monoliths 53
Box 2. Materials for root washing.
■ Plastic sieves■ Large plastic containers for soil■ Small plastic containers for roots■ Metal forceps■ Small plastic bags for root samples■ Rubber bands■ Marker pens for labeling■ 25% ethanol (75% if roots will be used
for sectioning)
Box 3. Materials for root scanning.
■ Plastic forceps■ Plastic sieves■ Plexiglas trays for scanning (clean with
no scratches)■ Deionized water■ Scanner, computer, and root analysis
software
Removable slot cover
5-cm rim wing
60 cm
20 cm
20 cm
Material: 4.76-mm-thick metal sheet
Fig. 1. Monolith sampler: 20 × 20 cm, 45–60-cm depth.
Fig. 2. Core sampler: 4-cm diameter, 60-cm depth, with a hinged opening for soil removal. Holes at the top allow for escape of excess water when sampling in flooded paddies.
2-cm holes on either side to hook the chain block
B. Stainless steel rod, 24-cm long, 2-cm
diameter
10 cm
70 cm
55 cm
5 cmSharpened end
Hinges here
170˚ opening
Schedule 40 stainless-steel pipe
Bar with loop to
hang chain block from
6-cm-diameter hole, to go
around corer tube in soil
30 cm
45 cm
1.5-m pipes
2.54-cm diam.
Fig. 3. Chain block stand to facilitate removal of the core tube from the soil.
Metal plate to stabilize stand and prevent sinking
into ground as core is pulled out
of soil

54 Methodologies for root drought studies in rice
Methods adopted
General comments■ To maximize speed of sampling and
minimize damage to equipment, we normally time our sampling of the drought treatment with re-watering (after a few days, so that soil is softer to insert the sampler but isn’t too muddy and roots have not grown much in response to re-watering). Decision-making for the timing of re-watering of the drought-stress treatment is discussed in the previous chapter (Torres et al).
■ Sampling throughput: for small experiments (10 genotypes or fewer),
we aim to complete sampling of an entire treatment in 1 day. For larger experiments, sampling is scheduled by replicate.
■ For both monolith and core protocols, samples are separated into depth increments of 15 cm of sampled soil.
■ Since field sampling of roots involves many samples and many steps, we keep a data sheet for each experiment. This allows for tracking of samples, and for notation of samples in which no roots were found (so as not to be confused with any missing samples). We use the following column headings on the data sheets:
Fig. 4. Root washing area with a continuous supply of water, perforated work surface (10 cm × 10 cm welded wire screen) allowing flow-through of water, and an open drain that can accommodate wash-through of soil into a catch area.
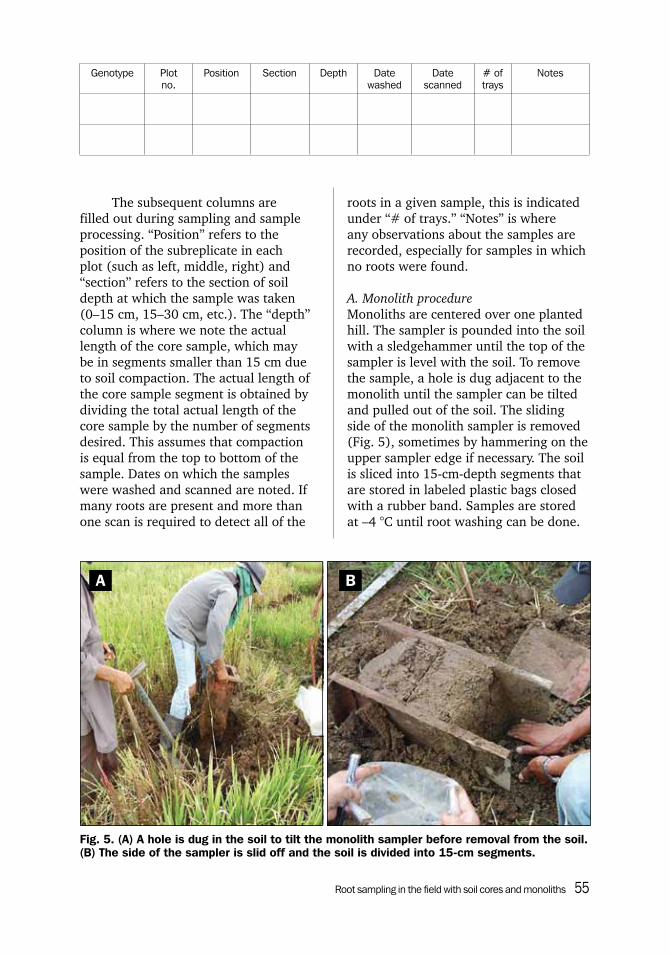
Root sampling in the field with soil cores and monoliths 55
The subsequent columns are filled out during sampling and sample processing. “Position” refers to the position of the subreplicate in each plot (such as left, middle, right) and “section” refers to the section of soil depth at which the sample was taken (0–15 cm, 15–30 cm, etc.). The “depth” column is where we note the actual length of the core sample, which may be in segments smaller than 15 cm due to soil compaction. The actual length of the core sample segment is obtained by dividing the total actual length of the core sample by the number of segments desired. This assumes that compaction is equal from the top to bottom of the sample. Dates on which the samples were washed and scanned are noted. If many roots are present and more than one scan is required to detect all of the
Genotype Plot no.
Position Section Depth Date washed
Date scanned
# of trays
Notes
roots in a given sample, this is indicated under “# of trays.” “Notes” is where any observations about the samples are recorded, especially for samples in which no roots were found.
A. Monolith procedureMonoliths are centered over one planted hill. The sampler is pounded into the soil with a sledgehammer until the top of the sampler is level with the soil. To remove the sample, a hole is dug adjacent to the monolith until the sampler can be tilted and pulled out of the soil. The sliding side of the monolith sampler is removed (Fig. 5), sometimes by hammering on the upper sampler edge if necessary. The soil is sliced into 15-cm-depth segments that are stored in labeled plastic bags closed with a rubber band. Samples are stored at –4 °C until root washing can be done.
Fig. 5. (A) A hole is dug in the soil to tilt the monolith sampler before removal from the soil. (B) The side of the sampler is slid off and the soil is divided into 15-cm segments.
A B

56 Methodologies for root drought studies in rice
B. Coring procedureCore tubes are centered between two hills (Fig. 6). In 4-row plots, this is between 2 rows; in 3-row plots, this is along the middle row. Three subreplicate cores from each plot are taken to a depth of 60 cm in lowland drought-stress treatments and upland studies. In lowland flooded control treatments, soil is sampled to a depth of 45 cm. In the drought-stress
treatment, samples are acquired with two successive 30-cm cores at the same point to minimize soil compaction from hammering. If re-watering is done to facilitate drilling of the sampler, sampling should not be done when the soil is very wet, especially if it is light-textured because, in those conditions, the soil sample can get left behind when the sampler is pulled up. Compaction is
Fig. 6. (From left to right) Root sampling by soil core: pounding in the core tube, using a wooden block to reduce equipment damage, removal of core tube with a chain block and pulley, and division of soil core to represent 15-cm-depth segments.
Root sampling in the field with soil cores and monoliths 57
minimized by pouring water with soap solution inside the tube before sampling. Tubes are pounded into the soil with a mallet as vertical as possible to the soil surface. A wooden block or a thick piece of rubber tire is used to cover the top of the corer tube to reduce damage to the metal while pounding. Cores are removed from the soil by pulling with a chain block hooked onto a metal bar inserted near the top of the core tube, and suspended above the core. Samples are divided into 15-cm segments. In the case of compaction of a sample, the total length from a sampled depth of 30 cm is measured, and the sample is divided in half. This procedure assumes that compaction of the 30-cm sampled depth is uniform. With the core tube design described here, the uppermost 15-cm segment can be easily removed through the side door of the corer tube. For the lower 15-cm segment, it is often necessary to hammer the soil from the end of the tube using a wooden dowel. Having a work table with an edge for support can make this more efficient, so that there is a surface against which the tube can be laterally supported during removal of the soil.
C. Root washing procedureSeparating roots from soil in field-acquired samples can be challenging because, in most samples, the roots are no longer connected to the shoot. Furthermore, lateral root diameters of rice roots can become very fine and are difficult to see against a soil background, making identification of the roots by eye inefficient. Separating roots by washing the soil away from the sample over a screen can result in large losses of fine roots. Therefore, we use a root washing protocol in which roots are separated from soil by flotation, based on the “Goetingen method” as described by Böhm (1979). Water is added to the plastic bag holding each sample in order to soften
the soil. This preparatory step can dramatically decrease the time required for root washing, especially when working with hard soils from drought-stress treatments. After soaking, the mixture of soil, roots, and water is transferred to a plastic open-topped container (approx. 2 L for cores and approx. 20-L buckets for monoliths) and mixed. Any remaining clods of soil are broken up by hand. Any large, visible pieces of roots are picked out by hand or with forceps and transferred to a small container of clean water. After mixing, the soil, water, and root mixture begins to separate: soil settles to the bottom and some roots, although not visible, float below the surface. To isolate these floating roots, the liquid portion only (no soil) is poured over a fine plastic sieve to catch the small roots that float below the surface. These roots are then transferred to the small container of clean water with roots. Water is again added to the 2-L plastic container of soil, mixed, and again the liquid portion is poured over the sieve to isolate the roots. This procedure is repeated until no more roots are collecting on the sieve (at least five times). The aim is to capture all roots, even the smallest ones. In some soils, especially at shallow depths, an excessive amount of organic matter can also be caught on the sieve. We have found it most efficient to aim for collecting all of the roots at this step, even if some organic matter is included. The organic matter will be removed in the lab before root scanning. After mixing the soil with water and capturing the roots on the sieve five times, the soil sample is visually examined for any remaining roots. All roots from the small container are then poured over the sieve and transferred to a small labeled plastic bag. Ethanol (25% for scanning only; 75% if root sectioning will be conducted) is added to cover the root sample, and the bag is closed with
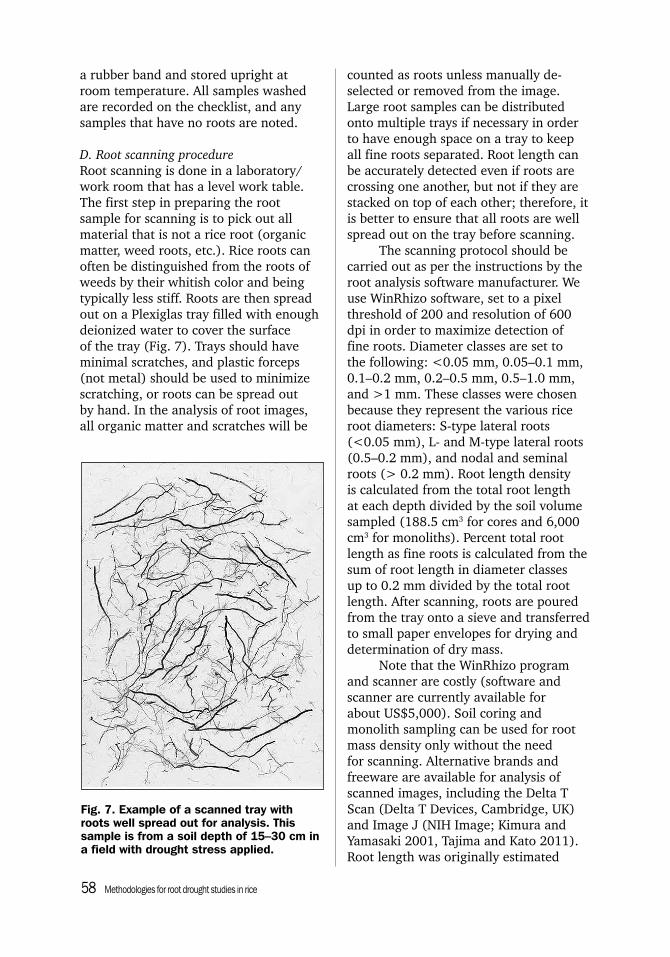
58 Methodologies for root drought studies in rice
a rubber band and stored upright at room temperature. All samples washed are recorded on the checklist, and any samples that have no roots are noted.
D. Root scanning procedureRoot scanning is done in a laboratory/work room that has a level work table. The first step in preparing the root sample for scanning is to pick out all material that is not a rice root (organic matter, weed roots, etc.). Rice roots can often be distinguished from the roots of weeds by their whitish color and being typically less stiff. Roots are then spread out on a Plexiglas tray filled with enough deionized water to cover the surface of the tray (Fig. 7). Trays should have minimal scratches, and plastic forceps (not metal) should be used to minimize scratching, or roots can be spread out by hand. In the analysis of root images, all organic matter and scratches will be
Fig. 7. Example of a scanned tray with roots well spread out for analysis. This sample is from a soil depth of 15–30 cm in a field with drought stress applied.
counted as roots unless manually de-selected or removed from the image. Large root samples can be distributed onto multiple trays if necessary in order to have enough space on a tray to keep all fine roots separated. Root length can be accurately detected even if roots are crossing one another, but not if they are stacked on top of each other; therefore, it is better to ensure that all roots are well spread out on the tray before scanning. The scanning protocol should be carried out as per the instructions by the root analysis software manufacturer. We use WinRhizo software, set to a pixel threshold of 200 and resolution of 600 dpi in order to maximize detection of fine roots. Diameter classes are set to the following: <0.05 mm, 0.05–0.1 mm, 0.1–0.2 mm, 0.2–0.5 mm, 0.5–1.0 mm, and >1 mm. These classes were chosen because they represent the various rice root diameters: S-type lateral roots (<0.05 mm), L- and M-type lateral roots (0.5–0.2 mm), and nodal and seminal roots (> 0.2 mm). Root length density is calculated from the total root length at each depth divided by the soil volume sampled (188.5 cm3 for cores and 6,000 cm3 for monoliths). Percent total root length as fine roots is calculated from the sum of root length in diameter classes up to 0.2 mm divided by the total root length. After scanning, roots are poured from the tray onto a sieve and transferred to small paper envelopes for drying and determination of dry mass. Note that the WinRhizo program and scanner are costly (software and scanner are currently available for about US$5,000). Soil coring and monolith sampling can be used for root mass density only without the need for scanning. Alternative brands and freeware are available for analysis of scanned images, including the Delta T Scan (Delta T Devices, Cambridge, UK) and Image J (NIH Image; Kimura and Yamasaki 2001, Tajima and Kato 2011). Root length was originally estimated
Root sampling in the field with soil cores and monoliths 59
using the line-intersect method (Tennant 1975).
E. Root massRoot samples are collected into a coin envelope or small paper bag after scanning and dried in an oven at about 70 °C for at least 48 hours. We wrap the root sample in a small piece of tissue to avoid sticking to the inside of the envelope. A high-precision balance (milligram) is used since the dry weights are typically <0.02 g.
F. Traits recorded■ Root length density (RLD) by soil
depth■ Root length distribution within
diameter classes■ Percent total root length as fine roots■ Root mass density by depth■ Specific root length (cm g–1) by depth■ Other parameters calculated by root
scanning software: average root diameter, root surface area, and root volume
G. Precautions/common mistakesSampling: Equipment may be damaged from repeated pounding of soil cores into hard soil. The parts of the soil core tubes that are most vulnerable to damage are the upper end of the tube, the door hinges, and the cutting edge at the bottom of the tube. Pounding can deform the holes at the top of the tube, making it difficult to insert the metal rod for pulling the tube out of the soil. Using wood or rubber to dampen the force on the metal tube can help reduce this damage. The samplers should be oriented perpendicular to the soil surface for proper root sampling and to avoid damage and difficulties with sampling. Care should be taken when pounding in the soil core tubes to avoid injury. Compaction of soil within the soil core tube is a common problem. Sampling after re-watering and brushing the inside of the soil core tube with soapy
water can help reduce compaction. It should be noted that a compacted sample represents the full size of the volume sampled—this should be taken into account when splitting soil cores into subsamples by depth. Root washing: Loss of roots during washing results in an underestimate of root length density. The method described above aims to optimize the capture of fine roots. Scanning: Loss of data may occur if scanned images are not properly saved. For scanning resolution, we recommend 600 dpi for rice roots for the detection of fine roots. Care should be taken to properly spread the roots out in the scanning tray for best detection by the root analysis software.
H. Case study A comparative study on root sampling by core and monolith of IR64 was carried out in drought-stressed and well-watered conditions. To compare root measurements as determined by core and monolith sampling methods, large (15 m2) plots were grown in three replicates at IRRI during the 2010 wet season (June-Novemer 2010) under lowland conditions. Well-watered and drought-stress treatments were included, with initiation of the drought stress by draining at 47 days after sowing (DAS), and all other crop management was conducted as described by Henry et al (2011). Soil water potentials during the study are reported in the previous chapter (Torres et al). Monolith samples and soil cores were taken at 91 DAS in the stress and control treatments. Sampling, root washing, and scanning protocols were followed as described above. Monolith samples in the control treatment were taken to a depth of 45 cm, whereas monolith samples in the stress treatment and all core samples were taken to a depth of 60 cm. Data from the four

60 Methodologies for root drought studies in rice
treatments (monolith stress, monolith control, core stress, and core control) were analyzed together by ANOVA and Tukey’s test in R software. The root length density differed among treatments (Fig. 8) at soil depths of 15–30 cm (P = 0.02), 30–45 cm (P = 0.01), and 45–60 cm (P = 0.004). The control core showed significantly greater root length densities at the three depth intervals below 15 cm compared with the other treatments. The four treatments showed significant differences in terms of lateral root production as a percent of total root length (Fig. 9, P<0.05). At 0–15 cm, the control core treatment had a significantly greater proportion of lateral roots than the monolith stress treatment (P = 0.046). At 15–30 cm, both sampling methods in the control treatment showed a greater proportion of lateral roots than the stress core treatment (P = 0.0113). At 30–45 cm, the monolith samples in both treatments had a greater proportion of lateral roots than the stress core treatment (P = 0.005). The stress monolith treatment also showed a significantly greater proportion of lateral
0
10
20
30
40
50
60
700 5 10 15 20
Depth (cm)
0
10
20
30
40
50
60
700 5 10 15 20
Root length density (cm–3)
Control core
Control monolith
Stress core
Stress monolith
Control core
Control monolith
Stress core
Stress monolith
Fig. 8. Root length density of IR64 in drought-stress and well-watered control treatments as measured by monolith and core sampling methods at 91 DAS.
roots at a depth of 45–60 cm compared with core samples in both treatments (P = 0.006). The response to drought stress differed between core and monolith methods for both root length density and percent lateral roots. This is likely due to the size and position of the sampler: monolith samples are much larger, but may provide less resolution between treatments than core samples placed mid-way between hills. Because of the reduced disturbance of core sampling, faster sample processing, and apparently greater distinction between treatments, we prefer the core sampling method for evaluating root growth in field drought evaluations.

Root sampling in the field with soil cores and monoliths 61
Control core
Control monolith
Stress core
Stress monolith
Control core
Control monolith
Stress core
Stress monolith
0
10
20
30
40
50
60
7040 50 60 70 80 90 100
% of total root length as lateral roots
Depth (cm)
Fig. 9. Percent of total root length as lateral roots of IR64 in drought-stress and well-watered control treatments as measured by monolith and core sampling methods at 91 DAS.
ReferencesBöhm W. 1979. Methods of studying root
systems: ecological studies. Berlin (Germany): Springer.
Henry A, Gowda VRP, Torres R, McNally K, Serraj R. 2011. Genetic variation in root architecture and drought response in Oryza sativa: rainfed lowland field studies of the Oryza SNP panel. Field Crops Res. 120:205-214.
Kimura K, Yamasaki S. 2001. Root length and diameter measurement using NIH Image: application of the line-intercept principle for diameter estimation. Plant Soil 234:37-46.
Tajima R, Kato Y. 2011. Comparison of threshold algorithms for automatic image processing of rice roots using freeware ImageJ. Field Crops Res. 121:460-463.
Tennant D. 1975. A test of a modified line intersect method of estimating root length. J. Ecol. 63:995-1001.
Notes
Authors’ address: International Rice Research Institute, DAPO Box 7777, Metro Manila, Philippines.

62 Methodologies for root drought studies in rice
Preamble
The purpose of this method is to quickly identify genotypes having deep root systems from dozens/hundreds of entries under field conditions, without laborious root observation. The key assumptions are that (1) the amount of deep roots becomes more related to soil water uptake, plant water status, plant response to dehydration (leaf rolling and drying), biomass, sterility, and yield as the surface soil becomes drier, and (2) the yield advantage of deep-rooted genotypes under intermittent drought is mostly derived from their rooting depth. Combining the deep-root restriction and raised-bed systems (Fig. 1), it would be possible to confirm the role of deep roots in drought adaptation in the target environment and identify deep-rooted genotypes without root sampling or monitoring soil moisture profiles.
The raised-bed system and deep-root restriction system: a unique method of screening deep-rooted genotypes in the fieldYoichiro Kato
Materials used
Deep-root restriction systemWater-permeable sheet with very fine mesh (mesh size < 0.05 mm; e.g., BKS0812, Toyobo Co. Ltd., Tokyo, Japan).
Raised-bed systemGravel, sand, wooden board or brick (any material that can be used to construct the raised bed).
Methods adoptedThe following methods are used for setting up the deep-root restriction and raised-bed systems in the field (Fig. 2).
Fig. 1. Illustrations of (A) the deep-root restriction system and (B) the raised-bed system.
Normal ground level
A B
Normal ground level
Water-permeable sheet
Soil layer (25 cm)
Top soil (25 cm)
Gravel (5 cm)

The raised-bed system and deep-root restriction system: a unique method of screening deep-rooted . . . 63
Deep-root restriction system■ Remove the soil of the 0 to 25-cm soil
layer for the entire plot. ■ Position the water-permeable sheet at
a depth of 25 cm throughout the plot and the edges.
■ Replace the topsoil homogeneously and do tilling with a small rotary cultivator.
■ The physical barrier of the water-permeable sheet restricts root growth to a maximum depth of 25 cm.
Raised-bed system■ Raise the bed 30 cm above ground
level by adding a 25-cm-thick layer of topsoil above a 5-cm-thick gravel layer. The gravel layer enables the surface soil to dry more easily and frequently as it prevents the capillary rise of water.
■ Insert a sand layer between gravel and topsoil layers (optional). This can prevent contamination of topsoil into the gravel layer.
■ Till the surface soil with a small rotary cultivator.
■ Rice roots are able to penetrate the gravel and reach deeper levels in the soil.
Fig. 2. (A) Preparing the deep-root restriction system, (B) rice response to drought in the deep-root restriction system, (C) preparing the raised-bed system, and (D) rice response to drought in the raised-bed system.

64 Methodologies for root drought studies in rice
Traits to be recorded Any kind of measurements for drought phenotyping are applicable (see Fischer et al 2003 for details). It can be inferred that genotypes showing less stress in response to soil drying in the raised-bed system compared with the deep-root restriction system are deep rooted.
Precautions to be taken(a) The size of the system depends on
the field size and the amount of laborers.
(b) The number of genotypes that can be screened depends on the size of the system and the size of each plot. Small plot size (i.e., one- or two-row plots) may not significantly affect the genotypic ranking in drought response in the raised-bed system, but it does in the deep-root restriction system (because of the competition for soil water in the surface soil layer between genotypes).
(c) It is good to include a fully irrigated treatment, in addition to the drought-stress treatment.
(d) Replacement of the topsoil every 2–3 years or fallowing the system may be necessary if soil-borne pests and diseases become a problem after continuous monocropping.
(e) The timing and intensity of drought stress can be managed if the systems are set up under a rainout shelter.
(f) The water-permeable sheet can last 5–10 years.
(g) The deep-root restriction system can also be used to rapidly screen drought-resistant lines/donors regardless of deep root growth.
(h) Depth of topsoil can be adjusted to the conditions in the target environment. In some environments where the rooting depth is shallow, 15 cm of topsoil layer may be enough.
(i) One of the drawbacks of this method is that one may not be able to take into account genotypic difference in the penetration ability of the hardpan.
Case study(a) The drought screening facility called
“raised-bed system” was developed at the Ibaraki Agriculture Institute, Japan, and had long been adopted in the upland rice breeding program in Japan (Hirayama and Suga 1996, Hirasawa et al 1998).
(b) In the raised-bed system, performance (biomass, yield, etc.) is mostly related to the amount of deep roots in normal soil environments. However, a genotypic difference might also be attributed to some other traits (dehydration tolerance, etc.) (Kato et al 2007).
(c) In the deep-root restriction system, the drought response has no relation to the amount of deep roots in normal soil environments (Kato et al 2007).
Common mistakes(a) Installing the soil moisture sensors
within the gravel layer, which creates a bypass route for root growth.
(b) Rice roots can penetrate the water-permeable sheet if its mesh size is > 0.05 mm.
(c) Nonuniform topsoil depth in the system.

The raised-bed system and deep-root restriction system: a unique method of screening deep-rooted . . . 65
ReferencesFischer KS, Lafitte R, Fukai S, Atlin
G, Hardy B, editors. 2003. Breeding rice for drought-prone environments. Los Baños (Philippines): International Rice Research Institute. 98 p.
Hirasawa H, Nemoto H, Suga R, Ishihara M, Hirayama M, Okamoto K, Miyamoto M. 1998. Breeding of a new upland rice variety “Yumenohatamochi” with high drought resistance and good eating quality. Breed. Sci. 48:415-419.
Hirayama M, Suga R. 1996. Drought resistance. In: Yamamoto R, Horisue N, Ikeda R, editors. Rice breeding manual. Tokyo: Yokendo. p 152-155.
Kato Y, Kamoshita A, Yamagishi J. 2007. Evaluating the resistance of six rice cultivars to drought: restriction of deep rooting and the use of raised beds. Plant Soil 300:149-161.
NotesAuthor’s address: Institute for Sustainable Agro-
Ecosystem Services, University of Tokyo, Japan.

66 Methodologies for root drought studies in rice