Embed Size (px)
Citation preview

@tp_initiative transitionpathwayinitiative.org
METHODOLOGY AND INDICATORS REPORT Version 1.0 – 11 January 2017
Rory Sullivan, Simon Dietz, Carlota Garcia-Manas, Adam Matthews and Faith Ward
2
CONTENTS
1. Introduction .......................................................................................................... 3
1.1 About the Transition Pathway Initiative (TPI) ..................................................................... 31.2 The January 2017 Data ...................................................................................................... 31.3 Updating the Methodology and Indicators Report ............................................................ 42. Key Concepts and Principles ................................................................................ 5
2.1 Differentiating between Companies’ Management Quality and their Carbon Performance ................................................................................................................................... 52.2 The Evolution of Management Quality (Levels 0–4) .......................................................... 62.3 The Use of Different Carbon Performance Frameworks for Different Sectors ................... 72.4 Design Principles ................................................................................................................ 83. Management Quality Indicators (Levels 0-4) ...................................................... 10
3.1 The Development of the Indicators ................................................................................. 103.2 The Company Assessment Process .................................................................................. 123.3 TPI Management Quality Indicators ................................................................................. 143.4 Allocating Companies to Levels ....................................................................................... 174. Carbon Performance Assessment Framework ................................................... 18
4.1 Framing the Assessment: the Sectoral Decarbonization Approach ................................. 184.2 The TPI Method for Electricity Utilities, and Carbon-intensive Manufacturing Sectors ... 224.3 The TPI Method for Automobiles .................................................................................... 234.4 The TPI Method for Diversified Mining, and Oil and Gas ................................................ 235. Company Coverage ........................................................................................... 25
6. Bibliography ....................................................................................................... 26
DISCLAIMER 1. All information contained on the Transition Pathway Initiative (TPI) website is derived from publically available
sources and is for general information use only. Information can change without notice and the Transition Pathway Initiative does not guarantee the accuracy of information on the website, including information provided by third parties, at any particular time.
2. The website does not provide investment advice and nothing on the site should be construed as being personalised investment advice for your particular circumstances. The website does not take account of individual investment objectives or the financial position or specific needs of individual users. You must not rely on the website to make a financial or investment decision. Before making any financial or investment decisions, we recommend you consult a financial planner to take into account your personal investment objectives, financial situation and individual needs.
3. The website contains information derived from publically available third party websites. It is the responsibility of these respective third parties to ensure this information is reliable and accurate. The Transition Pathway Initiative does not warrant or represent that the data or other information provided on the website is accurate, complete or up to date, and make no warranties and representations as to the quality or availability of this data or other information.
4. The Transition Pathway Initiative is not obliged to update or keep up-to-date the information that is made available on the website.
5. If you are a company referenced on the website and would like further information about the methodology used in our publications, or have any concerns about published information, then please contact [email protected] An overview of the methodology used is available at http://www.lse.ac.uk/GranthamInstitute/tpi/methodology
6. Please read the Terms & Conditions which apply to use of the website at http://www.lse.ac.uk/aboutThisWebsite/termsOfUse/Home.aspx

3
1. INTRODUCTION
1.1 About the Transition Pathway Initiative (TPI) The Transition Pathway Initiative (TPI)1 is an asset owner-led initiative, which assesses how companies are aligning themselves with the transition to a low-carbon economy. TPI: • Evaluates the quality of companies’ management of the greenhouse gas
emissions associated with their business (‘Management Quality’). • Evaluates how companies’ planned or expected future carbon performance
compares to international targets and national pledges made as part of the Paris Agreement2 (‘Carbon Performance’).
• Reports this information publicly through an online tool hosted by the Grantham Research Institute on Climate Change and the Environment at the London School of Economics and Political Science (LSE).
1.2 The January 2017 Data TPI released its first set of data in January 2017. It published Management Quality assessments for 20 large companies in the oil and gas sector and for 20 large companies in the electricity utilities sector. This Methodology and Indicators Report provides the technical background to these assessments and to the data that have been used in the assessments. The report describes: • The key concepts and principles that underpin the TPI (Section 2). • How the Management Quality framework was developed, the specific indicators
that were used to populate the framework and how companies’ positions were assessed on the TPI’s Level 0-4 framework (Section 3).
• How TPI expects to conduct the Carbon Performance assessments (Section 4), noting that TPI expects to publish the first of these assessments in May/June 2017.
• The universe of companies covered in the January 2017 TPI assessment (Section 5).
1 For information about the Transition Pathway Initiative (e.g. its governance, its funding, its partners) and to access the online tool, please visit the TPI website at transitionpathwayinitiative.org 2 http://unfccc.int/paris_agreement/items/9485.php

4
1.3 Updating the Methodology and Indicators Report This Methodology and Indicators Report relates to the data released in January 2017. It will be updated as more data are released by TPI and as the assessment framework, indicators and universe of companies evolve.

5
2. KEY CONCEPTS AND PRINCIPLES
2.1 Differentiating between Companies’ Management Quality and their Carbon Performance
Our assessment of companies’ alignment with the low-carbon transition is split into two complementary parts: Management Quality and Carbon Performance. The relationship between the quality of management processes and corporate carbon performance is by no means clear cut. The ideal scenario is that companies with robust, well-developed management systems and processes would be expected to make better, more enlightened business decisions. In turn, this would lead them to adopt business strategies and targets that align with the needs of a low-carbon economy. The converse should also apply; that is, companies with weaknesses in their management systems and processes would be expected to make poorer business decisions and be less likely to adopt business strategies and targets that align with the needs of a low-carbon economy. However, there are examples of companies with good management systems and processes, who nonetheless are not setting carbon performance targets that align with the transition to a low-carbon economy1. There are several possible explanations for this. Some may be external, such as weaknesses in the signals being sent by policy makers, and uncertainties about policy makers’ willingness to address climate change. Some may be internal; management may be sceptical about the business case for action on climate change, investments related to reducing carbon emissions may be competing with other investment opportunities, or the company may not have the knowledge or capacity to take advantage of the opportunities presented by the transition to a low-carbon economy. There may also be cases where the converse applies, where companies may set ambitious carbon performance targets but not have the knowledge, management systems or capacity to implement these targets. The consequence is that, when assessing companies, it is appropriate to examine quality of management and carbon performance, both separately and together, in order to get a fully informed picture of the company3.
3 We intend to monitor this over time, with the aim of assessing whether we can determine a more precisely articulated relationship between the TPI Management Quality indicators (individually or collectively) and the TPI’s Carbon Performance assessments.

6
2.2 The Evolution of Management Quality (Levels 0–4) In practice, companies tend to implement their management systems and processes in a relatively staged and structured manner. For example, they often start by publicly acknowledging the relevance of an issue, like climate change, to their business, followed by the development of a high level policy or statement. They then tend to set some relatively short-term, process-oriented targets, before progressively extending the quality and duration of their targets4. A similar phenomenon is often seen in reporting, where companies tend to start by reporting on their operational (or Scope 1 and 2) carbon emissions for part of their business, and then progressively extend this reporting to apply to more of the business and, in time, to cover some of the emissions from their supply chains and from the use of their products (Scope 3 emissions). In general, companies could be expected to progress through the following levels (which are the Management Quality levels used in the TPI): • Level 0 – Unaware of (or not Acknowledging) Climate Change as a Business Issue. • Level 1 – Acknowledging Climate Change as a Business Issue: The company
acknowledges that climate change presents business risks and/or opportunities, and that the company has a responsibility to manage its greenhouse gas emissions This is often the point where companies adopt a climate change policy.
• Level 2 – Building Capacity: The company develops its basic capacity, its management systems and processes, and starts to report on practice and performance.
• Level 3 – Integrated into Operational Decision-making: The company improves its operational practices, assigns senior management or board responsibility for climate change and provides comprehensive disclosures on its carbon practices and performance.
• Level 4 – Strategic Assessment: The company develops a more strategic and holistic understanding of risks and opportunities related to the low-carbon transition and integrates this into its business strategy and capital expenditure decisions.
The decision to move between these levels, and the rigour of implementation, is dependent on a variety of factors: knowledge and capacity, previous experience with emissions reductions, senior management’s views on the importance of climate change to the business and on the costs and benefits of taking action on climate change, and the pressures exerted by investors, government, industry peers and other stakeholders. An important corollary to this is that companies can move in
4 We intend to monitor and assess this over time.

7
both directions; for example, if the threat of regulation or taxation recedes, companies may assign a lower priority to efforts to reduce emissions or improve energy efficiency. Companies are at very different stages in this process. Many are still at the early stages of establishing carbon management and reporting processes, whereas others have assessed the resilience of their businesses and business models to a range of future low-carbon scenarios, published details of their low-carbon energy research and development (R&D) and investment strategies, and aligned their strategic key performance indicators (KPIs) on climate change and their executive incentives.
2.3 The Use of Different Carbon Performance Frameworks for Different Sectors Different sectors face different technological possibilities and costs in reducing their own direct carbon emissions, and indirect emissions associated with energy consumption (so-called Scope 1 and 2 emissions). This is recognised by, for example, the International Energy Agency (IEA), whose modelling for its biennial Energy Technology Perspectives report simulates the path of emissions in different sectors burning fossil fuels, or using energy generated from burning fossil fuels, given assumptions about key inputs, such as economic and population growth. In low-carbon scenarios, the model is required to adhere to an overall carbon emissions budget or target, with the cost of adhering to the carbon budget minimised by always allocating emissions reductions to sectors where they can be made most cheaply. As a result, different sectors make different contributions to the low-carbon transition, with some, such as electricity utilities, cutting their emissions very strongly, and others, such as cement, doing so less strongly (see Section 4 of this report). Furthermore, from the perspective of impacts on climate change, the most important issue in some sectors is companies’ own operational carbon emissions, whereas in others it is the emissions associated with the use of the company’s products. Examples of the former include the electricity utility and iron and steel sectors. Examples of the latter include automobile manufacturing and the oil and gas sector. Recognising these fundamental differences between sectors, the TPI has developed sector-specific measures of Carbon Performance (see Section 4). It will use these to assess individual company performance, with the first assessments expected to be released in May/June 2017.

8
2.4 Design Principles
The following high level principles have guided our approach to the design of the TPI: 1. Company assessments should be based on publicly available information only.
There are two reasons for this. The first is that encouraging companies to provide a better account of how they manage climate change is a core objective of the TPI5. The second is to ensure that companies are assessed consistently, and to avoid any suggestion that individual companies are in any way favoured by the assessment methodology.
2. Indicators should be objectively assessable. That is, the users of the TPI and other stakeholders (including companies themselves) should be able to understand why a company has met or not met a particular indicator, and why a company has been assessed as being at a particular Level.
3. Indicators of Management Quality should be relevant to all companies in all sectors covered by TPI. The reason is that investors want to be able to compare sectors and, when communicating with stakeholders, to be able to demonstrate the overall outcomes of their engagement.
4. The outputs from the TPI should be useful to asset owners that engage with companies and to asset owners that engage with asset managers. Of particular importance is ensuring that the TPI is relevant and useful to asset owners with relatively little capacity or expertise on climate change.
5. Indicators should link to, or build on, existing initiatives and disclosure frameworks
as far as possible. That is, unless there is a compelling reason to do otherwise, the data and indicators used in the TPI should be those that are already reported by companies or that are commonly requested by investors6.
5 Strengthening corporate climate change disclosures is also a core objective of the Financial Stability Board’s Task Force on Climate-related Financial Disclosures (TCFD) (https://www.fsb-tcfd.org/) and of investor-backed disclosure initiatives such as CDP (https://www.cdp.net/en) and the Climate Disclosure Standards Board (http://www.cdsb.net/) 6 We note that this is an evolving area. For example, on 14 December 2016, the Financial Stability Board’s Task Force on Climate-related Financial Disclosures (TCFD) opened a 60-day public consultation to solicit views on the Task Force’s recommendations. The Task Force recommended that the preparers of climate-related financial disclosures provide such disclosures in their mainstream (i.e., public) financial filings, and include discussion of the scenarios used to assess the implications of climate-related risks and opportunities for an organisation’s businesses, strategies, and financial planning. It identified four thematic areas that organisations should report on, namely governance, strategy, risk management, and metrics and targets. One of the most significant points made by the Task Force was that it saw its recommendations as applying to financial-sector organisations, including banks, insurance companies, asset managers and asset owners. See further: https://www.fsb-tcfd.org/. We will monitor the work of the Task Force and of others in this area and adapt our work accordingly.

9
6. Indicators should be pitched at a high level of aggregation and apply to the firm as a whole. It is acknowledged that investors may wish to dig deeper into specific aspects of practice or performance (e.g. to understand risk and opportunity on a country-by-country basis, to analyse the quality of the objectives and targets that have been set). For these investors, the TPI’s data and indicators can be used in conjunction with other measures such as those relating to financial performance (e.g. sales, turnover) and those that provide a more granular assessment of climate change performance.

10
3. MANAGEMENT QUALITY INDICATORS (LEVELS 0-4) 3.1 The Development of the Indicators The Management Quality indicators for the TPI were developed through an iterative research, testing and review process over the period October 2015 to December 2016. The main elements of this work were: • A comprehensive review of the literature; • The testing of the indicators; • The review of the indicators by the steering group that oversaw the development
of the TPI, and by investment and climate change experts.
Literature Review In developing the TPI, we sought, as far as possible, to align our work with other existing initiatives and disclosure frameworks. Specifically, we sought to: • Align the indicators with those requested by disclosure initiatives such as CDP7,
the Climate Disclosure Standards Board8 and the Global Reporting Initiative9. • Align the indicators with the manner in which investors articulate their
expectations of companies on climate change. The Institutional Investors Group on Climate Change’s Investor Expectations of Corporate Climate Risk Management10 (for sectors such as mining, oil and gas, and automobiles) and the Aiming for A Initiative11 (with its calls for companies in high impact sectors to reduce their operational carbon emissions, maintain a portfolio of assets resilient to future energy scenarios, and support low-carbon energy research and development) were of particular importance.
• Align the structure with the manner in which investors articulate their expectations of companies on other sustainability-related issues. To that end, we compared the structure and logic of the TPI with other investor-backed benchmarks and indices such as the Access to Medicines Index12, the Access to Nutrition Index13 and the Business Benchmark on Farm Animal Welfare14.
7 https://www.cdp.net/en 8 http://www.cdsb.net/ 9 https://www.globalreporting.org/Pages/default.aspx 10 http://www.iigcc.org/publications/category/Corporate-Climate-Risk-Management 11 http://investorsonclimatechange.org/portfolio/aiming-for-a/ 12 http://www.accesstomedicineindex.org/ 13 https://www.accesstonutrition.org/ 14 http://www.bbfaw.com/
11
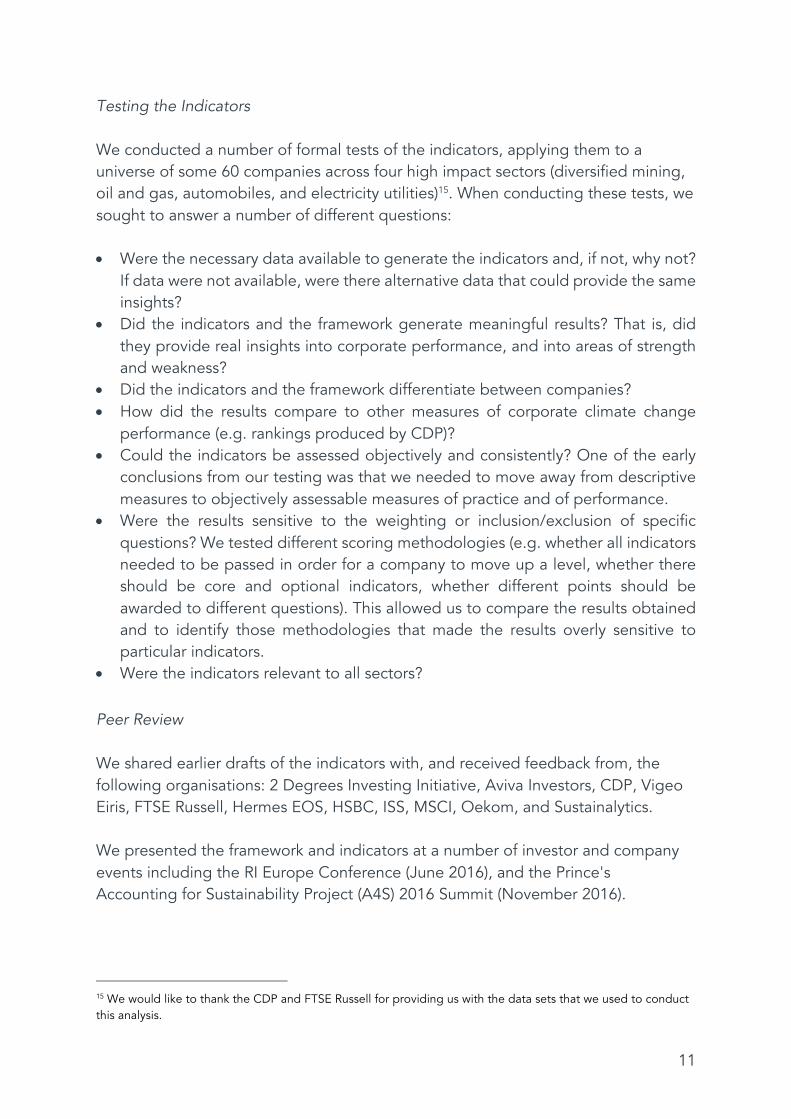
Testing the Indicators We conducted a number of formal tests of the indicators, applying them to a universe of some 60 companies across four high impact sectors (diversified mining, oil and gas, automobiles, and electricity utilities)15. When conducting these tests, we sought to answer a number of different questions: • Were the necessary data available to generate the indicators and, if not, why not?
If data were not available, were there alternative data that could provide the same insights?
• Did the indicators and the framework generate meaningful results? That is, did they provide real insights into corporate performance, and into areas of strength and weakness?
• Did the indicators and the framework differentiate between companies? • How did the results compare to other measures of corporate climate change
performance (e.g. rankings produced by CDP)? • Could the indicators be assessed objectively and consistently? One of the early
conclusions from our testing was that we needed to move away from descriptive measures to objectively assessable measures of practice and of performance.
• Were the results sensitive to the weighting or inclusion/exclusion of specific questions? We tested different scoring methodologies (e.g. whether all indicators needed to be passed in order for a company to move up a level, whether there should be core and optional indicators, whether different points should be awarded to different questions). This allowed us to compare the results obtained and to identify those methodologies that made the results overly sensitive to particular indicators.
• Were the indicators relevant to all sectors? Peer Review We shared earlier drafts of the indicators with, and received feedback from, the following organisations: 2 Degrees Investing Initiative, Aviva Investors, CDP, Vigeo Eiris, FTSE Russell, Hermes EOS, HSBC, ISS, MSCI, Oekom, and Sustainalytics. We presented the framework and indicators at a number of investor and company events including the RI Europe Conference (June 2016), and the Prince's Accounting for Sustainability Project (A4S) 2016 Summit (November 2016).
15 We would like to thank the CDP and FTSE Russell for providing us with the data sets that we used to conduct this analysis.
12
The specific indicators and the framework as a whole were subject to ongoing review and discussion by the steering group that oversaw the development of the TPI. This group also reviewed all of the feedback provided by third parties and the results of the various tests of the indicators and the framework as a whole. 3.2 The Company Assessment Process The TPI Management Quality assessments are based on data provided by FTSE Russell, specifically the data and indicators it uses to develop its ESG Ratings16. These data went through a four stage quality assurance process before being provided to TPI, as follows:
• Stage 1: Initial Assessment and Analyst Quality Control. A FTSE Russell analyst conducting the initial company assessment, including a review of the previous year’s assessment to assess if a change in data from the previous year was justified. This was followed by a second analyst carrying out a check on the company analysis and by a separate, more experienced, analyst reviewing company assessments to ensure accuracy and consistency.
• Stage 2: Company Review. FTSE Russell contacted the company to provide the company with the opportunity to review the data collected. FTSE Russell’s research process only allowed publicly available information to be used.
• Stage 3: Trend Quality Control. Senior FTSE Russell analysts conducted trend analysis to look for inconsistent data and data outliers. They also conducted a focused QC on particular indicators, based on their understanding of indicators that were more vulnerable to errors.
• Stage 4: Quality Management. FTSE Russell staff carried out a series of quality monitoring checks, focusing on both quantitative data consistency (e.g. units, gaps, outliers) and qualitative data (e.g. checking interpretation and criteria guidance). The results of these checks were shared with analysts in order for them to implement changes and enhance their quality control processes.
Following receipt of data from FTSE Russell, TPI conducted its own quality assurance on the data. This involved:
• Initial data review: We conducted a high level review to confirm that each company’s data was complete and consistent with our understanding of the
16 See, further, http://www.ftse.com/products/downloads/ESG-ratings-overview.pdf?800

13
company’s public disclosures. Potential outliers and gaps were discussed with FTSE Russell.
• Initial findings review: Following the application of the TPI indicators (see Section 3.3), we reviewed the overall findings, and each company’s assessment (both in absolute terms and relative to its sector peers). Where we identified outliers or unusual results, we analysed whether these were due to the interpretation or application of the TPI indicators or due to the raw data.
• Company review: Once we had completed the company assessments and were satisfied with the underlying data and with the manner in which we were applying the indicators, FTSE Russell wrote formally on behalf of TPI to each of the companies. It sent each company its draft TPI assessment and the FTSE Russell data that underpinned the assessment, requesting that the companies review the assessments and confirm the accuracy of the underlying data. These communications were sent on 16 December 2016 and companies were requested to respond by 4 January 2017.
• Final assessment: 14 of the 40 companies (35% of the total) responded to the request for comment on the draft assessment. Of these, six requested changes to some part of their assessments, presenting additional data that they wished us to consider in our assessment. We reviewed the information provided and amended individual questions for five companies, although these changes were confined to situations where the data was available at the time of FTSE Russell conducted its review or where we had made an error of interpretation of these data. The overall effect of the changes was that two companies moved up a Level (see further Section 4 below).
Responding to Companies Allowing companies the opportunity to review and, if necessary, correct their assessments are integral parts of TPI’s quality assurance process. We send each company its draft TPI assessment and the data that underpin the assessment, offering them the opportunity to review and comment on the data and assessment. We also allow companies to contact us at any point to discuss their assessment. If a company seeks to challenge its result/representation, our process is as follows: • We – TPI, LSE and FTSE Russell – review the information provided by the company. At
this point, we may request that the company provides additional information. • If we conclude that the company’s challenge has merit, we (a) update/correct the
relevant information on the website, (b) inform the company of the changes that have been made.
• If we conclude that there are insufficient grounds to change our assessment we explain our decision to the company,

14
• If a company chooses to further contest the results and reverts to legal means to do so, LSE will remove the company from the relevant part of the website and will list the company as having challenged its assessment.
3.3 TPI Management Quality Indicators
Level 0: Unaware of (or not Acknowledging) Climate Change as a Business Issue
Question 1 Does the company acknowledge climate change as a significant issue for the business? (Yes/No)
Explanatory Notes
Acknowledging climate change as a business issue is an important first step towards implementing a comprehensive approach to the low-carbon transition.
Companies are assessed as Yes if they:
• Have a policy or an equivalent statement committing them to take action on their greenhouse gas emissions (e.g. to reduce emissions, to improve their energy efficiency); or
• Have a formal statement recognising climate change and its potential impacts as a significant or material issue for their business; or
• Set energy efficiency or relative or absolute greenhouse gas emission reduction targets; or
• Have published information on their Scope 1 and Scope 2 greenhouse gas emissions.
Companies are assessed as ‘No’ if they do not meet any of these conditions.
Level 1: Acknowledging Climate Change as a Business Issue
Question 2 Does the company explicitly recognise climate change as a significant issue for the business? (Yes/No)
Explanatory Notes
Companies are assessed as Yes if they have a formal statement recognising climate change and its potential impacts as a significant or material issue for their business.
Question 3 Does the company have a policy (or equivalent) commitment to action on climate change? (Yes/No)
Explanatory Notes
It is good practice for companies to formalise their approach to climate change in a policy (or equivalent document, such as a statement of guiding principles, a code of practice, or a sourcing charter). While the existence of a policy may not provide a guarantee of implementation, the absence of a policy is a clear sign that climate change is not on the business agenda.
Companies are assessed as Yes if they have a published policy or commitment statement on climate change that commits them to addressing the issue or to reducing or avoiding their impact on climate change (e.g. to reduce emissions or improve their energy efficiency).

15
Level 2: Building Capacity
Question 4 Has the company set energy efficiency or relative or absolute greenhouse gas emission reduction targets? (Yes/No)
Explanatory Notes
Objectives and targets are the point where policy commitments are translated into substantive action, and where resources and responsibilities are allocated for the delivery of these objectives and targets.
Companies are assessed as Yes if they have time-specific targets, covering part or all of the business, to reduce energy consumption or greenhouse gas emissions. These can be process or performance targets, they can focus on energy or on greenhouse gas emissions, they can be expressed in qualitative or quantitative terms, and they can be expressed in relative or absolute terms.
This question is intended to assess whether companies have started the target-setting process. Questions 7 and 13 ask more detailed questions about whether companies have set targets for the reduction of greenhouse gases over the short and long term. Companies that are assessed as Yes on either of these questions (i.e. Questions 7 and 13), are also assessed as Yes on Question 4.
Question 5 Has the company published information on its Scope 1 and 2 greenhouse gas emissions? (Yes/No)
Explanatory Notes
Companies are assessed as Yes if they report on their Scope 1 and 2, or their Scope 1, 2 and 3 emissions.
Companies that only report Scope 1 emissions are assessed as No.
Companies that report normalised emissions only are assessed as No.
Level 3: Integrated into Operational Decision-making
Question 6 Has the company nominated a board member or board committee with explicit responsibility for oversight of the climate change policy? (Yes/No)
Explanatory Notes
Companies are assessed as Yes if they provide evidence of clear board or board committee oversight of climate change, or if they have a named individual/position responsible for climate change at board level.
Question 7 Has the company set quantitative relative or absolute targets for reducing its operational (Scope 1 and 2) greenhouse gas emissions? (Yes/No)
Explanatory Notes
Companies are assessed as Yes if they have set quantified targets to reduce operational greenhouse emissions in relative or absolute terms.
This question is more demanding than Question 4 as it is looking for companies to have set, at least, short-term (up to 5 years) quantitative targets to reduce operational greenhouse gas emissions beyond regulatory requirements. In contrast, Question 4 allows companies to set process targets (e.g. to take particular actions) and to focus these on energy or on greenhouse gas emissions.
This question differs from Question 13 which asks whether companies have set targets for the reduction of greenhouse gases over the long term (i.e. that are more than 5 years in duration from start to end). Companies that are assessed as Yes on Question 13 are also assessed as Yes on this question.
Question 8 Does the company report on Scope 3 emissions? (Yes/No)

16
Explanatory Notes
Companies are assessed as Yes if they report on Scope 3 emissions separately, or if they provide a total for Scope 1, 2 and 3 emissions.
Question 9 Has the company had its operational (or Scope 1 and 2) greenhouse gas emissions data verified? (Yes/No)
Explanatory Notes
Companies are assessed as Yes if their operational greenhouse gas emissions have been independently verified by a third party, or if they state the international assurance standard they have used and the level of assurance.
Question 10 Does the company support domestic and international efforts to mitigate climate change? (Yes/No)
Explanatory Notes
Companies are assessed as Yes if they demonstrate support for mitigating climate change through membership of business associations that are supportive, and if they have a clear company position on public policy and regulation.
Level 4: Strategic Assessment
Question 11 Has the company reduced its operational (Scope 1 and 2) greenhouse gas emissions over the past 3 years?
Explanatory Notes
Companies are assessed as Yes if their operational (i.e. total Scope 1 and 2) greenhouse gas emissions have reduced over 3 years.
For companies that do not report a breakdown of Scope 1, 2 and 3 emissions, total Scope 1, 2 and 3 emissions are used in this calculation.
Companies that do not report Scope 1 and 2 emissions are assessed as No, as are companies that report less than 3 years’ data.
Question 12 Does the company provide information on the business costs – for example, capital investments, costs of carbon permits – associated with climate change? (Yes/No)
Explanatory Notes
Companies are assessed as Yes if they quantify the business costs associated with climate change.
Question 13 Has the company set long-term relative or absolute targets for reducing its greenhouse gas emission? (Yes/No)
Explanatory Notes
Companies are assessed as Yes if they have set quantified long-term (i.e. more than 5 years) targets to reduce operational (Scope 1 and 2) greenhouse emissions in relative or absolute terms.
This question is more demanding than Question 7, as it looks for companies to have set long-term quantitative targets (i.e. that are more than 5 years in duration from start to end) to reduce operational greenhouse gas emissions. In contrast, Question 7 asks whether the company has set short-term targets (i.e. less than 5 years in duration).
Question 14 Has the company incorporated environmental, social and governance issues into executive remuneration? (Yes/No)
Explanatory Notes
Companies are assessed as Yes if executive remuneration includes incorporates environmental, social and governance performance.

17
3.4 Allocating Companies to Levels The TPI categorises companies into one of five levels (referred to as Levels 0-4) depending on how they are assessed against the questions above. The rule defining which level companies sit on is as follows: “Companies need to be assessed as Yes to all of the questions in a Level before they can advance to the next Level”. So, to illustrate this, in order to be on Level 3, companies need to have been assessed as Yes for each of Questions 1 to 5. Similarly, in order to be on Level 4, companies need to have been assessed as Yes for each of Questions 1 to 10. We do not differentiate between companies in a Level but simply list them in alphabetical order.

18
4. CARBON PERFORMANCE ASSESSMENT FRAMEWORK 4.1 Framing the Assessment: the Sectoral Decarbonization Approach The TPI’s Carbon Performance assessment is built on the principle of recognising the different challenges faced by different sectors of the economy in aligning themselves with the low-carbon transition, in particular the different technological possibilities they have at their disposal to reduce carbon emissions, and consequently the different costs they face. The assessment framework is also built on the foundation that different carbon performance metrics will be of interest for different sectors. From the perspective of investors, the most important issue in some sectors is companies’ own operational carbon emissions, while in other sectors it is the emissions embodied in the main product that companies sell. Examples of the former include the electricity utility and iron and steel sectors, while examples of the latter include the automobile manufacturing and oil and gas sectors. The TPI’s Carbon Performance assessment is based on the Sectoral Decarbonization Approach (SDA).2 The SDA has recently been proposed as a means to compare companies within a sector based on their current and future intensity of operational carbon emissions (i.e. Scope 1 and 2 carbon dioxide or CO2 emissions per unit of production or economic activity). In the automobile manufacturing sector, it has been extended such that companies are instead compared in terms of their fleet CO2 emissions efficiency. The SDA is not the only approach that has been proposed to translating national and international climate targets into consistent targets at the corporate level. However, unlike most other approaches, it takes into account innate differences between sectors, in terms of their costs of reducing carbon emissions. Other approaches have taken the simpler route of requiring all companies to reduce their emissions intensity at the same rate.3,4 These simpler approaches have the advantage of requiring fewer data and assumptions, but in reality emissions reductions will be much more difficult to make for companies in some sectors than in others. The key inputs to the SDA are: • A global pathway for carbon emissions, which is consistent with the delivery of a
particular climate target (e.g. limiting the increase in global mean temperature to well below 2°C from the pre-industrial level).
• A breakdown of this economy-wide emissions pathway into key sectors.

19
• Consistent estimates of economic activity in these key sectors. All three of these inputs are provided by the International Energy Agency (IEA), through the modelling it carries out for its biennial Energy Technology Perspectives report.5 The IEA runs a model, which simulates the supply of energy and the path of emissions in different sectors burning fossil fuels, or consuming energy generated by burning fossil fuels, given assumptions about key inputs, such as economic and population growth. In low-carbon scenarios, the IEA model is required to adhere to an overall carbon emissions budget or target. The model minimises the cost of adhering to the budget by always allocating emissions reductions to sectors where they can be made most cheaply. Therefore, if company targets are set on the basis of the IEA model projections, then they are consistent with the most economically efficient allocation of effort among sectors overall, assuming the IEA model projections turn out to be accurate. The IEA’s work can be used to derive two benchmark emissions paths, against which companies will be evaluated in the TPI. The first is a 2 Degrees scenario, which is consistent with the overall aim of the Paris Agreement to hold “the increase in the global average temperature to well below 2°C above pre-industrial levels and to pursue efforts to limit the temperature increase to 1.5°C above pre-industrial levels”.6 As a general rule, maintaining a 2/3 chance of limiting global warming to 2°C requires limiting cumulative greenhouse gas emissions between 2011 and 2050 to the equivalent of 1 trillion tonnes of CO2 (i.e. 1000 gigatonnes), with a margin for error of a few hundred gigatonnes.7 The IEA’s ‘2DS’ scenario is estimated to be associated with cumulative greenhouse gas emissions equivalent to about 1.2 trillion tonnes of CO2 between 2011 and 20508, thus it is within the margin for error. The second is a Paris Pledges scenario. It has been established that the sum of the emissions reductions pledged by individual countries as part of their Nationally Determined Contributions (or NDCs) to the Paris Agreement is insufficient to put the world on a path to limit warming to 2°C, even if it will constitute a departure from the baseline or business-as-usual trend. Analysis by various groups suggests that, if the NDCs are fully implemented, then annual global greenhouse gas emissions in 2030 will be in the range 52-61 gigatonnes of CO2 equivalent (GtCO2e).9–11 The IEA ‘4DS’ scenario (standing for 4 degrees) delivers 53 GtCO2e in 2030, using the IEA’s own estimate of greenhouse gas emissions from outside the energy sector. Thus the 4DS scenario is within the envelope of forecasts of what the

20
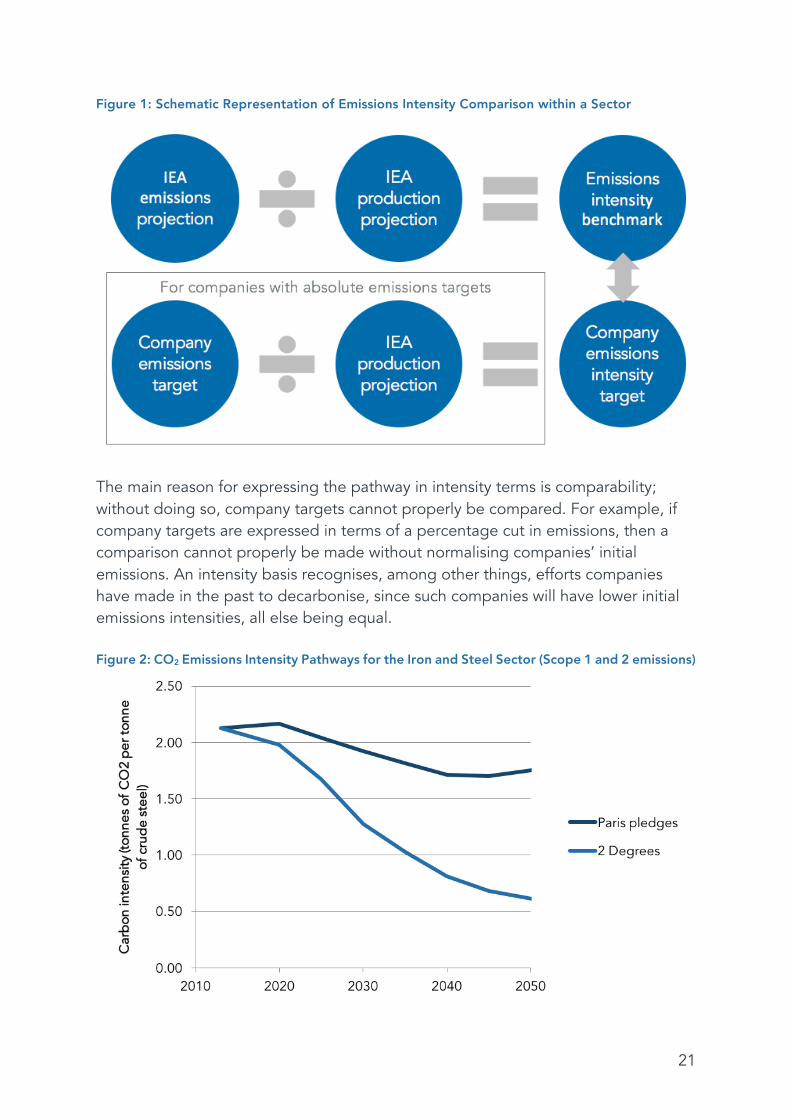
NDCs can achieve on aggregate, and it can be used in the TPI as the basis for a Paris pledges scenario. It must be stressed that this does not imply the Paris NDCs will lead to 4°C warming. This largely depends on what happens after 2030, a period that is not covered by current NDCs (although countries are expected to submit targets on a five-year cyclical basis, each of which are expected to be progressively more ambitious than the last). It has been estimated that the current NDCs can limit warming to 2.6-3.1°C, based on lower assumed emissions after 2030.12 It must also be stressed that, while this scenario is representative of the global sum of emissions cuts pledged in NDCs, the emissions cuts pledged by individual countries in their NDCs do of course vary and will in most cases differ from the global average cuts. There is no way to account for how country-by-country variation in emissions targets would affect individual companies, depending on these companies’ geographical focus, while at the same time maintaining a single benchmark emissions path against which all companies in a sector can be compared. Therefore this is a contextual factor that should be borne in mind when using the TPI for engagement and decision-making purposes. For each of these two scenarios, IEA modelling output is used to obtain sector-specific carbon budgets and consistent pathways for absolute CO2 emissions (both Scope 1 and 2). These data are then combined with IEA’s assumptions about production in each sector, or overall economic growth, to derive sectoral pathways for CO2 emissions intensity (i.e. emissions/output). In each sector, this gives the carbon budget, in intensity terms, for an average company, and is the benchmark against which companies’ actual targets can be compared. Figure 1 provides a schematic representation of this approach, while Figure 2 illustrates benchmark emissions intensity paths in the iron and steel sector. Some companies will set targets in terms of emissions intensity, but other companies will set targets in terms of absolute emissions. In this case there is a need to estimate the company’s target in intensity terms. This is done consistently for any such company by assuming its production increases at the same rate as the sector as a whole (i.e. this amounts to an assumption of constant market share).
21
Figure 1: Schematic Representation of Emissions Intensity Comparison within a Sector
The main reason for expressing the pathway in intensity terms is comparability; without doing so, company targets cannot properly be compared. For example, if company targets are expressed in terms of a percentage cut in emissions, then a comparison cannot properly be made without normalising companies’ initial emissions. An intensity basis recognises, among other things, efforts companies have made in the past to decarbonise, since such companies will have lower initial emissions intensities, all else being equal. Figure 2: CO2 Emissions Intensity Pathways for the Iron and Steel Sector (Scope 1 and 2 emissions)

22
While companies in a particular sector will have different initial emissions intensities – i.e. different starting points – a fundamental tenet of the SDA approach is that all companies in that sector are required to converge to the same emissions intensity in 2050. Not only does this correspond with a fair distribution of effort across companies, there are good reasons to expect companies’ emissions intensities to converge over time, as techniques and technologies for reducing emissions diffuse from leaders to laggards.8 On the other hand, it might be argued that the possibilities for reducing emissions intensity vary from region to region, for reasons of natural endowments, and therefore that companies with different geographical distributions of production should be allowed different emissions intensities. Again, these regional differences cannot be accommodated while at the same time maintaining a single benchmark emissions path against which all companies in a sector can be compared, so they are an important contextual factor to take into account when applying the TPI. 4.2 The TPI Method for Electricity Utilities, and Carbon-intensive Manufacturing
Sectors In the electricity utilities sector, and in carbon- and energy-intensive manufacturing sectors such as iron and steel, the key to understanding the alignment of a company’s strategy with the transition to a low-carbon economy lies in looking at its own direct emissions, and in the emissions it is indirectly responsible for via its consumption of electricity, i.e. from its Scope 1 and 2 emissions. Strategies for companies in these sectors to align themselves with the low-carbon transition include substituting fossil fuels with renewables in supplying energy, increasing energy efficiency, reducing energy demand (e.g. by substituting with other inputs such as labour), carbon capture and storage, and various other sector-specific technical solutions for reducing direct emissions. The TPI has applied the SDA to develop CO2 emissions intensity pathways for electricity utilities as well for the following sectors which will be covered in future iterations of the TPI: iron and steel, cement, aluminium, pulp and paper, and chemicals and petrochemicals. With the exception of chemicals and petrochemicals, IEA modelling output includes a projection of the future output of the sector’s main good. For electricity utilities the unit is megawatt hours, for example, while for iron and steel it is tonnes of crude steel. These measures of sectoral production are imputed to calculate emissions intensity. By contrast, IEA modelling does not identify the physical output of the chemicals and petrochemicals sector (it is in any case a sector with a heterogeneous
23
product), so an alternative solution is sought. In particular, this is to estimate the overall economic activity of the sector and assume that a measure of each company’s economic activity grows at the same rate as the sector. 4.3 The TPI Method for Automobiles A sector that is different in character to electricity utilities and the carbon- and energy-intensive manufacturing sectors is automobile manufacturing. This is a sector where what really matters is the carbon intensity of the product – automobiles – rather than the carbon intensity of the manufacturing process itself. Such emissions fall within the category of so-called Scope 3 emissions (the use of sold products). IEA provides modelling output on emissions and economic activity from what it calls the ‘light road passenger transport’ sector (i.e. emissions from the use of automobiles), specifically well-to-wheel emissions of CO2, and passenger kilometres travelled. Given additional assumptions, including about the number of passengers per vehicle and the lifetime of a vehicle, these data can be converted into the carbon intensity of automobile manufacturers’ fleets of new vehicles, where the metric is average grams of CO2 per kilometre. Thus a pathway is mapped out for average grams of CO2 per kilometre, which is compatible with the 2 degrees and Paris pledges scenarios. When we cover this sector (scheduled for 2017), company starting points and targets will be compared with the sectoral pathway to test whether these companies are in alignment. 4.4 The TPI Method for Diversified Mining, and Oil and Gas The SDA has yet to be applied to the extractive sectors, namely diversified mining, and oil and gas. However, these are critical sectors from a climate change perspective. Like automobile manufacturing, the primary concern is the carbon intensity of their product, not the carbon intensity of the production process itself17. That is, what really matters is how much coal, oil and gas these companies are producing today and how much they plan to produce in the future. The initial development of the TPI does not include carbon performance assessment for these two sectors, but we will include them in future iterations. There are two practical obstacles to overcome in the meantime. First, IEA does not explicitly identify these two sectors in its modelling, so the data are more limited compared
17 Although we note that different types of production have very different energy requirements and that in some cases (e.g. tar sands), these energy requirements (and associated greenhouse gas emissions) may be significant compared to emissions associated with the burning of these products.

24
with automobile manufacturers, for example. Second, with some exceptions, companies do not produce sufficient disclosures of their future hydrocarbon production to enable comparisons with a benchmark to be made. Third party modelling of production might be a viable alternative, provided the assumptions therein are consistent with the IEA data that would be used to derive the benchmark paths.

25
5. COMPANY COVERAGE For the first iteration of the TPI (i.e. the information released in January 2017), we presented Management Quality information for 40 companies, 20 of the largest companies in the Conventional Electricity Sector and 20 of the largest companies in the (Oil and Gas) Exploration and Production Sector.
Conventional Electricity Oil and Gas Exploration and Production
American Electric Power Co. Anadarko
CLP Holdings Apache Corp
Dominion Resources BP
DTE Energy Canadian Natural Resources
Edison International Chevron
Enel Concho Resources
Entergy ConocoPhillips
Eversource Devon Energy
Exelon Eni
FirstEnergy EOG Resources
Fortis Exxon Mobil Corporation
Iberdrola Marathon Petroleum
NextEra Energy Occidental Petroleum
PG&E Corporation Phillips 66
Power Assets Holdings Pioneer Natural Resource
PPL Royal Dutch Shell B
Public Service Enterprise Group Suncor Energy
Southern Company Total
SSE Valero Energy
Xcel Energy Woodside Petroleum

26
6. BIBLIOGRAPHY 1. Doda, B., Gennaioli, C., Gouldson, A., Grover, D. & Sullivan, R. Are Corporate
Carbon Management Practices Reducing Corporate Carbon Emissions? Corp. Soc. Responsib. Environ. Manag. 23, 257–270 (2016).
2. Krabbe, O. et al. Aligning corporate greenhouse-gas emissions targets with climate goals. Nat. Clim. Chang. 5, 1057–1060 (2015).
3. Randers, J. Greenhouse gas emissions per unit of value added (‘GEVA’) - A corporate guide to voluntary climate action. Energy Policy 48, 46–55 (2012).
4. Sayani, A., Nishikawa, L. & Shakdwipee, M. Implications of COP-21: how do corporate carbon reduction targets stack up? (2015).
5. International Energy Agency. Energy Technology Perspectives 2016. (International Energy Agency, 2016).
6. UNFCCC. Paris Agreement. (2015). 7. IPCC. in Climate Change 2013: The Physical Science Basis. Working Group I
Contribution to the IPCC Fifth Assessment Report. (IPCC, 2013). 8. Science Based Targets. Sectoral Decarbonization Approach (SDA): A method
for setting corporate emission reduction targets in line with climate science. (2015).
9. United Nations. Adoption of the Paris Agreement. (2015). 10. UNEP. The Emissions Gap Report 2015: A UNEP Synthesis Report. (2015). 11. Boyd, R., Cranston Turner, J. & Ward, B. Intended nationally determined
contributions: what are the implications for greenhouse gas emissions in 2030? (2015).
12. Rogelj, J. et al. Paris Agreement climate proposals need a boost to keep warming well below 2°C. Nature (2016).