Embed Size (px)
Citation preview

©FUNPEC-RP www.funpecrp.com.brGenetics and Molecular Research 11 (2): 1117-1129 (2012)
Event-specific qualitative and quantitative PCR detection of the GMO carnation (Dianthus caryophyllus) variety Moonlite based upon the 5'-transgene integration sequence
P. Li, J.W. Jia, L.X. Jiang, H. Zhu, L. Bai, J.B. Wang, X.M. Tang and A.H. Pan
Key Laboratory of Agricultural Genetics and Breeding,Biotech Research Institute, Shanghai Academy of Agricultural Sciences, Shanghai, China
Corresponding author: A.H. PanE-mail: [email protected]
Genet. Mol. Res. 11 (2): 1117-1129 (2012)Received September 26, 2011Accepted January 16, 2012Published April 27, 2012DOI http://dx.doi.org/10.4238/2012.April.27.11
ABSTRACT. To ensure the implementation of genetically modified organism (GMO)-labeling regulations, an event-specific detection method was developed based on the junction sequence of an exogenous integrant in the transgenic carnation variety Moonlite. The 5ꞌ-transgene integration sequence was isolated by thermal asymmetric interlaced PCR. Based upon the 5ꞌ-transgene integration sequence, the event-specific primers and TaqMan probe were designed to amplify the fragments, which spanned the exogenous DNA and carnation genomic DNA. Qualitative and quantitative PCR assays were developed employing the designed primers and probe. The detection limit of the qualitative PCR assay was 0.05% for Moonlite in 100 ng total carnation genomic DNA, corresponding to about 79 copies of the carnation haploid genome; the limit of detection and quantification of the quantitative PCR assay were estimated to be 38 and 190 copies of haploid carnation genomic DNA, respectively. Carnation samples with different contents of genetically
Methodology
1118
©FUNPEC-RP www.funpecrp.com.brGenetics and Molecular Research 11 (2): 1117-1129 (2012)
P. Li et al.
modified components were quantified and the bias between the observed and true values of three samples were lower than the acceptance criterion (<25%) of the GMO detection method. These results indicated that these event-specific methods would be useful for the identification and quantification of the GMO carnation Moonlite.
Key words: Moonlite; GMO; Qualitative and quantitative PCR; TAIL-PCR
INTRODUCTION
Since the first genetically modified (GM) tomato FLAVR SAVRTM was permitted for planting in 1994 (Kahl, 1994), an increasing number of GM plants (GMPs) have been intro-duced in the field of agriculture. This has reduced the environmental impact of agriculture and increased agricultural production and is expected to contribute to solving the global food problem. According to statistical data, GMPs have been planted in an accumulated hectarage exceeding 1 billion during 1996-2010. There has been an 87-fold increase in the growth of biotech crops from 1.7 to 148 million hectares between 1996 and 2010. This has made biotech crops the fastest adopted crop technology in the history of modern agriculture. In 2010, the number of countries planting biotech crops reached 29, of which 19 were developing countries (James, 2010). However, with the introduction of GMPs, there has been scientific discus-sion and debate regarding the risks associated with GMPs and the production process. There-fore, consumers have been concerned about the safety and environmental effects of GMPs, and companies were required to label products containing GM organism (GMO) ingredients. Hence, there was a need to determine the threshold level of GMO ingredients. The labeling threshold of GM presence in a food product differed across countries: 0.9% in the European Union (European Commission, 2003a,b), 3% in Korea (Ministry of Agriculture and Forestry, 2000), 5% in Japan (Matsuoka, 2001), 1% in New Zealand and Australia, 2% in Norway, and 0.9% in Switzerland and the Russian Federation (Center for Food Safety, 2006).
For implementing labeling regulations, several reliable and sensitive detection meth-ods for GMO detection have been developed. GMO detection was mainly performed at the DNA level by using polymerase chain reaction (PCR)-based methods; however, protein-level detection by using immunoassays such as enzyme-linked immunosorbent assay (ELISA) and lateral flow strip tests has also been predominantly used (Kim et al., 2010). Among these tech-niques, the PCR method was popularly used for GMO analysis because of its high sensitivity and specificity (Holst-Jensen et al., 2003). On the basis of the difference among the different elements of exogenous integration, the GMO PCR detection methods have been divided into 4 categories: screening methods and gene-, construct-, and event-specific methods (Holst-Jensen et al., 2003). The event-specific PCR detection method was primarily used for GMO detection because of its high specificity for the flanking sequence of the exogenous integrant (Yang et al., 2005). In recent years, several event-specific quantitative PCR methods have been established for MON 863 (Yang et al., 2005), Oxy-235 Canola (Wu et al., 2008), MIR 604 and DAS-59122-7 (Lee et al., 2009), rapeseed Topas 19/2 (Wu et al., 2009), Huanong No. 1 papaya (Guo et al., 2009), and MON 15985 (Jiang et al., 2010).
Carnation (Dianthus caryophyllus) is one of the most important cut flower varieties.
1119
©FUNPEC-RP www.funpecrp.com.brGenetics and Molecular Research 11 (2): 1117-1129 (2012)
Identification and quantification of the GMO Moolite
It is the first cut flower variety to be planted on a large scale (Hu et al., 2004). With economic development and social progress, the demand for flowers has been increasing continuously, especially for new varieties of novel color, fragrance, and shape. Blue flowers were very popu-lar because the blue color represents purity and wisdom. The GM carnation line Moonlite of violet color was developed by Florigene Pty. Ltd., Australia, and Suntory Ltd., Japan. This line was produced by Agrobacterium tumefaciens-mediated transformation using the disarmed strain AGL0 to introduce the binary vector pCGP1470. This vector contained f3′5′h (flavonoid 3ꞌ,5ꞌ-hydroxylase) and dfr (dihydroflavonol-4-reductase) genes, which were responsible for the production of purple, mauve, or blue flower color, and the selectable marker, SuRB (sulfo-nylurea resistance gene B), that conferred tolerance to sulfonylurea herbicides and a range of other acetolactate synthase (ALS)-inhibiting herbicides (Figure 1A). Moonlite received previ-ous approval for production in the European Union, Japan, and Australia (http://www.isaaa.org/gmapprovaldatabase/events/default.asp?EventID=132).
In this study, on the basis of the 5ꞌ-transgene integration sequence identified by us-ing the thermal asymmetric interlaced (TAIL)-PCR technique (Liu et al., 1995), we designed event-specific primers and TaqMan probe and developed qualitative and quantitative PCR methods for Moonlite, providing the basis for detection and monitoring of GM carnation.
MATERIAL AND METHODS
GM carnation line Moonlite, Moonshade, and the parent cultivar “FE123” were de-veloped and supplied by Florigene Pty. Ltd. Local carnation variety “Master” as a control was purchased from Shanghai Oriental Flower Co. Ltd. BT11 was developed and supplied by Syngena Seeds, Inc. RRS and MON 531 were developed and supplied by Monsanto Company.
DNA isolation
Plant genomic DNA was extracted and purified using the Plant DNA Mini-Prep kit (Ruifeng Agro-Tech Co., Ltd., Shanghai, China) in accordance with manufacturer instruc-tions. The quantity of DNA samples was measured at 260 nm wavelength, and DNA copy number was calculated by considering the DNA quantity and carnation genomic DNA average size (Royal Botanic Gardens Kew, 2005).
Determination of the 5ꞌ-flanking DNA sequence
The 5ꞌ-flanking sequence of the Moonlite exogenous insertion was determined using the TAIL-PCR method, essentially as described by Liu et al. (1995). PCRs were performed ac-cording to the protocol of Liu et al. (1995), with slight modifications. Amplification conditions are summarized in Table 1. The first TAIL-PCR amplification was performed in a total volume of 20 μL containing 1X PCR buffer (50 mM KCl; 10 mM Tris-HCl, pH 8.3; 1.5 mM MgCl2), 100 μM dNTPs, 0.15 μM primer LB1R, 2 μM primer AD2, 1 U Taq DNA polymerase (TaKaRa Biotechnology Co., Ltd., Dalian, China), and 10 ng Moonlite template DNA. The secondary TAIL-PCR amplification was performed in a total volume of 25 μL containing 1X PCR buffer (50 mM KCl; 10 mM Tris-HCl, pH 8.3; 1.5 mM MgCl2), 100 μM dNTPs, 0.2 μM primer LB2R, 2 μM primer AD2, 0.8 U Taq DNA polymerase, and 1 μL 40-fold dilution of the primary PCR

1120
©FUNPEC-RP www.funpecrp.com.brGenetics and Molecular Research 11 (2): 1117-1129 (2012)
P. Li et al.
products. The third TAIL-PCR amplification was performed in a total volume of 50 μL contain-ing 1X PCR buffer (50 mM KCl; 10 mM Tris-HCl, pH 8.3; 1.5 mM MgCl2), 100 μM dNTPs, 0.2 μM primer LB3R, 2 μM primer AD2, 1.5 U Taq DNA polymerase, and 1 μL 10-fold dilu-tion of the secondary PCR products. All PCRs were performed using a GeneAmp PCR 9700 system (Applied Biosystems, Division of Perkin Elmer Corp., Foster City, CA, USA). The product of the third TAIL-PCR amplification was analyzed on 2% agarose gel electrophoresis and stained with ethidium bromide. The DNA fragments were purified and subsequently ligated into the pMD18-T vector (TaKaRa Biotechnology Co. Ltd.). DNA inserted in this vector was sequenced by using ABI PRISMTM 377 DNA Sequencer (Applied Biosystems).
Reaction Cycle number Thermal condition
Primary 1 92°C (3 min), 95°C (1 min) 5 94°C (30 s), 65°C (1 min), 72°C (2 min) 1 94°C (30 s), 25°C (2 min), ramping to 72°C over 2 min, 72°C (2 min) 15 94°C (30 s), 65°C (1 min), 72°C (2 min) 94°C (30 s), 65°C (1 min), 72°C (2 min) 94°C (30 s), 44°C (1 min), 72°C (2 min) 1 72°C (5 min)Secondary 1 94°C (2 min) 12 94°C (30 s), 65°C (1 min), 72°C (2 min) 94°C (30 s), 65°C (1 min), 72°C (2 min) 94°C (30 s), 45°C (1 min), 72°C (2 min) 1 72°C (5 min)Tertiary 20 94°C (40 s), 45°C (1 min), 72°C (2 min) 1 72°C (5 min)
Table 1. Cycling conditions used for TAIL-PCR program.
Oligonucleotide primers and probes
The oligonucleotide primers and TaqMan fluorescent probes used in this study were de-signed by using the Primer Express version 3.0 software (Applied Biosystems) and listed in Table 2. For carnation, the ans gene was selected as an endogenous reference gene (Zhu et al., 2011). The locations of designed event-specific primer pairs and probes targeting the detected DNA fragment are shown in Figure 1B. Probes for the ans gene and the exogenous event-specific probe were labeled on the 5'-end by using the fluorescent reporter dye 5-hexachloro-fluorescein (HEX) and 6-carboxyfluorescein (FAM), respectively. The fluorescent quencher dye 6-carboxytetramethyl-rhodamine (TAMRA) was labeled on the 3'-end of the probes. The specific primers LB1R/2R/3R used in TAIL-PCR were designed on the basis of the sequence of the binary vector pCGP1470, and the arbitrary primer AD2 was selected and used in TAIL-PCR. The event-specific PCR primer pairs (LiteC1F/1R and LiteR1F/1R) and probe Lite-Probe used for Moonlite detection were de-signed on the basis of the junction region between carnation genomic DNA and the 5ꞌ-end se-quence of exogenous integration. The primer LiteC1F/1R was used for qualitative PCR, and the primer LiteR1F/1R combined with probe Lite-Probe was used for TaqMan quantitative PCR. All the primers and probes were synthesized by Invitrogen Co. Ltd. (Shanghai, China).
Qualitative PCR assays
All qualitative PCR assays were performed in a total volume of 25 μL containing

1121
©FUNPEC-RP www.funpecrp.com.brGenetics and Molecular Research 11 (2): 1117-1129 (2012)
Identification and quantification of the GMO Moolite
5 μL template DNA samples, 1X PCR buffer (50 mM KCl; 10 mM Tris-HCl, pH 8.3; 1.5 mM MgCl2), 200 μM dNTPs, 0.6 μM of each primer, and 1.5 U Taq DNA polymerase (Ta-KaRa Biotechnology Co. Ltd.). All PCR amplifications were performed using the Gene-Amp PCR 9700 system (Applied Biosystems), according to the following temperature program: denaturation at 94°C for 5 min; 35 cycles of 94°C for 30 s, 58°C for 30 s, 72°C for 30 s, and extension at 72°C for 7 min. The amplified products were electrophoresed on 2% agarose gel for approximately 20 min at 100 V and stained with ethidium bromide for visualization.
PCR system Name Sequence (5ꞌ-3ꞌ) Amplicon (bp)
Tail-PCR LB1R AATTGACGCCGAGTTGACAGAC LB2R ACGTGAATGTAGACACGTCG LB3R GCTGCGGACATCTACATTTTTG AD2 NGTCGASWGANAWGAAQualitative PCR ANS-F1 CTAAAGCCCAGTTGTCGTCT 356 ANS-R1 ACCTTGTATGTCGCCATC LiteC1F CGTACTCATCTTCCGTTATTTGG 327 LiteC1R GCTGCGGACATCTACATTTTTG GenomeC1F TTTCAAAGGTGGACGAGGCT 449 GenomeC1R AGGCGAGGCATTGGAGTGTTQuantitative PCR ANS-F2 CCTAAATGTAAGAACAACGCAATCA 91 ANS-R2 GCGTAGCGCTGAACATCGT ANS-Probe HEX-TATAAGACCAATAAATGGTTGATGGATGGAG-TAMRA LiteR1F CATTGCGAAAGTGAATTGATAC 137 LiteR1R GCTGCGGACATCTACATTTTTG Lite-Probe FAM-CTCTTTCTTTTTCTCCATATTGACC-TAMRA
Table 2. Primers and TaqMan probes used for PCR systems.
Quantitative PCR assays
Quantitative PCR assays were performed using a fluorometric thermal cycler ABI7500 (Applied Biosystems), with a final volume of 25 μL 1X PCR buffer (50 mM KCl; 10 mM Tris-HCl, pH 8.3), 200 μM dNTPs, 5 mM MgCl2, 0.2 μM primers (ans gene or Moonlite event-specific primers), 0.2 μM TaqMan probes (ans gene or Moonlite event-specific probe), 1.5 U Taq DNA polymerase (TaKaRa Biotechnology Co. Ltd.), and 5 μL template DNA samples. Quantitative PCRs were performed using the following temperature program: 2 min at 50°C and 10 min at 95°C, 45 cycles of 15 s at 95°C and 45 s at 60°C. Fluorescence was monitored during every PCR cycle at the annealing step, and data were analyzed using the ABI7500 ver-sion V2.0.1 software (Applied Biosystems).
Construction of standard curves
Genomic DNA isolated from 100% homozygous Moonlite leaves was serially diluted with water to 5-fold concentrations of 15, 3, 0.6, 0.12, and 0.024 ng/μL, corresponding to about 23810, 4762, 952, 190, and 38 copies of haploid genome/μL, respectively. This calcu-lation was performed considering the carnation genomic size of 0.63 pg per haploid genome (Royal Botanic Gardens Kew, 2005). All the quantitative PCR were repeated three times, with each reaction containing triplicate samples.

1122
©FUNPEC-RP www.funpecrp.com.brGenetics and Molecular Research 11 (2): 1117-1129 (2012)
P. Li et al.
Limit of detection and quantification analysis
To determine the limits of detection and quantification (LOD and LOQ), 5-fold seri-ally diluted concentrations of 15, 3, 0.6, 0.12, 0.0240, and 0.0048 ng/μL, corresponding to about 23810, 4762, 952, 190, 38, and 7 copies of haploid genome/μL of Moonlite carnation DNA samples were used.
Quantification of GM carnation blind sample
The event-specific quantitative PCR system of Moonlite and the carnation endog-enous reference gene ans system were used to quantify GM carnation blind samples. The standard curves were generated by plotting the observed Ct value against the log initial quan-tities of 5-fold serially diluted genomic DNA, and a linear regression line was fitted to these data. The quantified biases from true values needed to be lower than the acceptance criterion (<25%) of the GMO detection method (European Network of GMO Laboratories, ENGL, 2008). The standard curves were then used to estimate the DNA amount in the blind sample by interpolating from the standard curves (Jiang et al., 2010).
RESULTS
Characterization of the 5ꞌ-flanking region of Moonlite
According to the information of “Application for license for dealings involving an intentional release into the environment DIR 030/2002” from the OGTR website (http://www.ogtr.gov.au/internet/ogtr/publishing.nsf/Content/dir030-2002), the schematic representation of the integrated heterologous DNA in Moonlite was obtained (Figure 1A). The binary vector pCGP1470 containing dfr, f3′5′h, and SuRB genes was used for carnation transformation.
For identification and analysis of the junction region of the exogenous integrant and the host genomic DNA of Moonlite, 3 appropriate specific primers (LB1R/2R/3R) were designed based on the pCGP1470 sequence to amplify the 5ꞌ-flanking sequences by using the TAIL-PCR technique. The combination of the arbitrary primer AD2 and the specific primer LB3R in the tertiary amplification reactions amplified a 1.0-kb fragment, and no amplification fragment was obtained in parallel experiments using the parent cultivar (FE123). This suggested that the struc-ture of the flanking region was specific to Moonlite and was suitable for event-specific detection of Moonlite. The tertiary TAIL-PCR product was cloned into the pMD18-T vector and completely sequenced. Figure 1B shows the 5ꞌ-junction sequence of an exogenous integrant of Moonlite. This sequence consisted of a 93-bp fragment from pCGP1470 and an 887-bp unknown DNA sequence.
Since little sequence information of the carnation genome was available from the GenBank database, determination of whether the unknown DNA sequence (887 bp) was from the carnation genome was not possible. Therefore, 1 pair of specific primers (Genome C1F/1R) was designed based on the 887-bp DNA sequence, and qualitative PCR was performed using the DNA of Moonlite, Moonshade, FE123, Master, BT11, RRS, and MON 531 as templates. As expected, 1 specific DNA fragment of 449 bp was obtained from Moonlite, Moonshade, FE123, and Master, while no amplicon was observed for BT11, RRS, and MON 531 (Figure 2). Hence, the unknown DNA sequence was con-firmed to be from the carnation genomic DNA.

1123
©FUNPEC-RP www.funpecrp.com.brGenetics and Molecular Research 11 (2): 1117-1129 (2012)
Identification and quantification of the GMO Moolite
Figure 2. Agarose gel (2%) analysis of specific fragment PCR amplification of carnation genomic DNA with the primers Genome C1F/1R. Arrow indicates the expected PCR amplification products. Lane M = DL2000 DNA marker. Lane 1 = negative control (no template DNA); lanes 2-8 = amplification of Moonlite, Moonshade, FE123, Master, BT11, RRS, and MON 531, respectively.
Figure 1. Organization of transgenic elements in Moonlite carnation genome. A. Schematic representation of the integrated heterologous DNA in Moonlite. B. TAIL-PCR amplified 5ꞌ-junction sequence was cloned and sequenced. Capital letters represent the flanking genomic sequence and lowercase letters show sequence from pCGP1470. Primers and probes used for PCR amplifications, detailed in Table 2, are underlined.
A
B

1124
©FUNPEC-RP www.funpecrp.com.brGenetics and Molecular Research 11 (2): 1117-1129 (2012)
P. Li et al.
Qualitative PCR assay for Moonlite
On the basis of the revealed 5ꞌ-junction sequence, we designed event-specific primers (LiteC1F/1R) and used them for the qualitative PCR assay for Moonlite. LiteC1F was located at the carnation genome, and primer LiteC1R was located at the left border region of the DNA insert, yielding a 327-bp amplicon. The carnation ans gene was selected as the endogenous reference gene (Zhu et al., 2011), and the primer pair ANS-F1/R1 was used for carnation identification. As expected, in the established Moonlite event-specific qualitative PCR assay, a single 327-bp DNA fragment was obtained from Moonlite, and no amplification product was observed for other GM carnation line (Moonshade), GM maize (BT11), GM soybean (RRS), GM cotton (MON 531), the parent cultivar (FE123), and no template control (NTC) (Figure 3A). The target amplification fragment of the carnation ans gene (356 bp) was obtained in all GM carnation varieties and the parent cultivar, except for GM soybean (RRS), GM maize (BT11), GM cotton (MON 531), and NTC (Figure 3B). These data indicated that the obtained DNA fragment (327 bp) was unique for Moonlite, and the qualitative event-specific PCR as-say was highly specific for Moonlite carnation.
A B
Figure 3. Qualitative PCR amplification of the event-specific fragments of Moonlite with the primers LiteC1F/1R, and the specific fragment of the carnation endogenous ans gene with the primers ANS-F1/R1. Agarose gel (2%) electrophoresis of the amplification products of PCR corresponded to A. 327-bp Moonlite and B. 356-bp ans gene. Arrows indicate the expected PCR amplification products. Lane M = DL2000 DNA marker. Lane 1 = negative control (no template DNA); lanes 2-7 = amplification of Moonlite, Moonshade, FE123, BT11, RRS, and MON 531, respectively.
An ideal qualitative PCR assay has a good LOD. To test the LOD of the established Moonlite qualitative PCR assay, mixed DNA samples were prepared from Moonlite and non-GM carnation varieties at various concentrations such as 10.0, 5.0, 1.0, 0.1, 0.01, and 0.001%. In the LOD test, 100 ng total carnation genomic DNA was used as template in each PCR. The LOD test results showed that the 327-bp target DNA fragment was obtained at all except the 0.001% level (Figure 4A), whereas the target fragment of the ans gene could be detected in all samples (Figure 4B). This indicated that the LOD of the Moonlite qualitative PCR assay was 0.05% for 100 ng genomic DNA, which corresponded to 79 copies of haploid carnation genomic DNA.
Construction of standard curves
After the quantitative PCR conditions were optimized, the quantitative standard curves of Moonlite event-specific quantitative PCR assay were constructed by using the Moonlite ge-

1125
©FUNPEC-RP www.funpecrp.com.brGenetics and Molecular Research 11 (2): 1117-1129 (2012)
Identification and quantification of the GMO Moolite
nomic DNA samples with concentrations of 119,048, 23,810, 4,762, 952, and 190 copies of haploid genome. The quantitative PCR results showed that the PCR had an efficiency of 0.93, and the squared regression coefficient (R2) of the standard curve was 0.9999 (Figure 5). The high PCR efficiency indicated that the quantitative PCR assay was suitable for Moonlite genomic DNA quantification. The good linearity between log DNA quantities and fluorescence value (Ct) indicated that the quantitative PCR assay was suitable for quantitative measurements.
A B
Figure 4. Agarose gel (2%) electrophoresis of Moonlite qualitative PCR products with different GM content levels. A. Sensitivity test of the event-specific qualitative PCR assay of Moonlite with different GM content levels. B. Stability test of the endogenous gene ans with different GM content levels. Arrows indicate the expected PCR amplification products. Lane M = DL2000 DNA marker; lane 1 = negative control (no template DNA); lanes 2-7 = amplification of mixed GM carnation samples with GM contents of 10.0, 5.0, 1.0, 0.1, 0.01, and 0.001%, respectively.
Figure 5. Amplification plots and standard curve for the Moonlite event-specific quantitative PCR assay. A. Amplification curves (the amount of the serially diluted Moonlite genomic DNA was 75, 15, 3, 0.6, and 0.12 ng, corresponding to 119,048, 23,810, 4,762, 952, and 190 copies of haploid genome per reaction) were generated for Moonlite quantification. B. Parameters of the regression line through data points were indicated within the plot.
1126
©FUNPEC-RP www.funpecrp.com.brGenetics and Molecular Research 11 (2): 1117-1129 (2012)
P. Li et al.
Reproducibility of the TaqMan assay
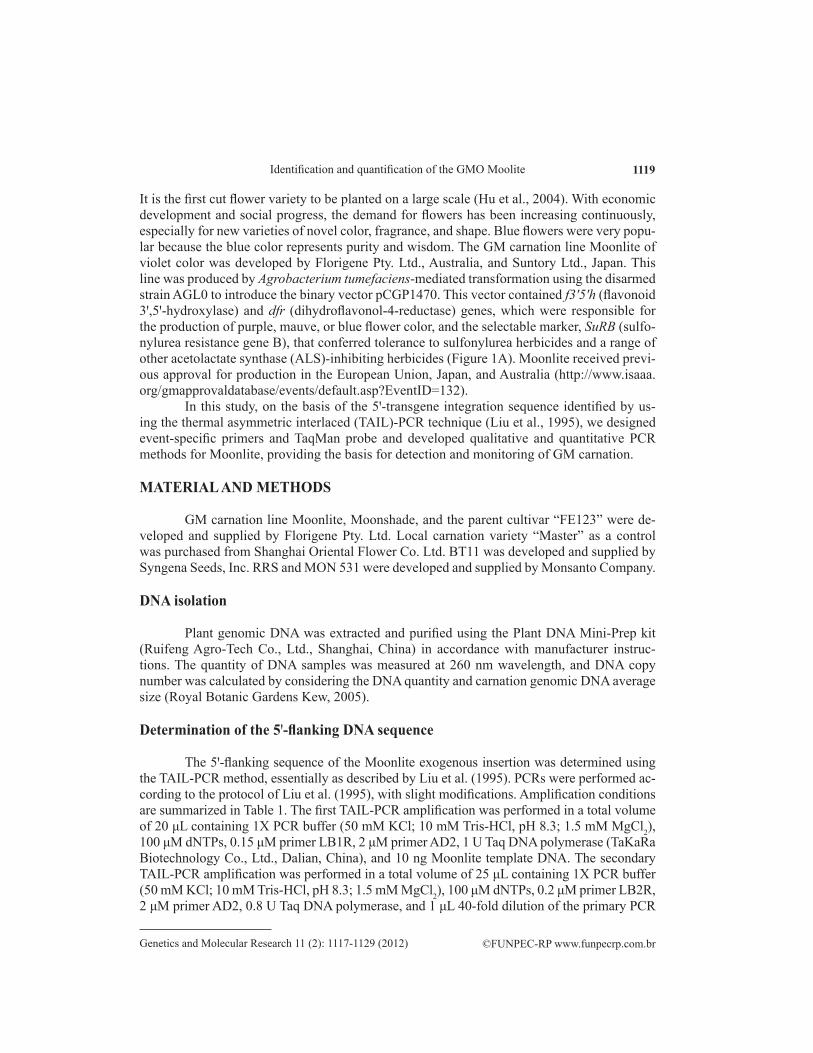
Reproducibility of the Ct measurements was determined and calculated using the de-scribed Moonlite genomic DNA dilutions performed in triplicate. In the reproducibility test of Moonlite quantitative PCR assay, the average Ct values of the event-specific PCR assay ranged from 24.38 to 34.59 cycles, with standard deviation (SD) value of 0.06-0.16, and the average Ct values of the ans gene detection ranged from 20.08 to 30.48 cycles, with the standard deviation (SD) value of 0.01-0.10 (Table 3). These data indicated that the established Moonlite event-spe-cific quantitative PCR assay was stable and reliable for GM Moonlite carnation quantification.
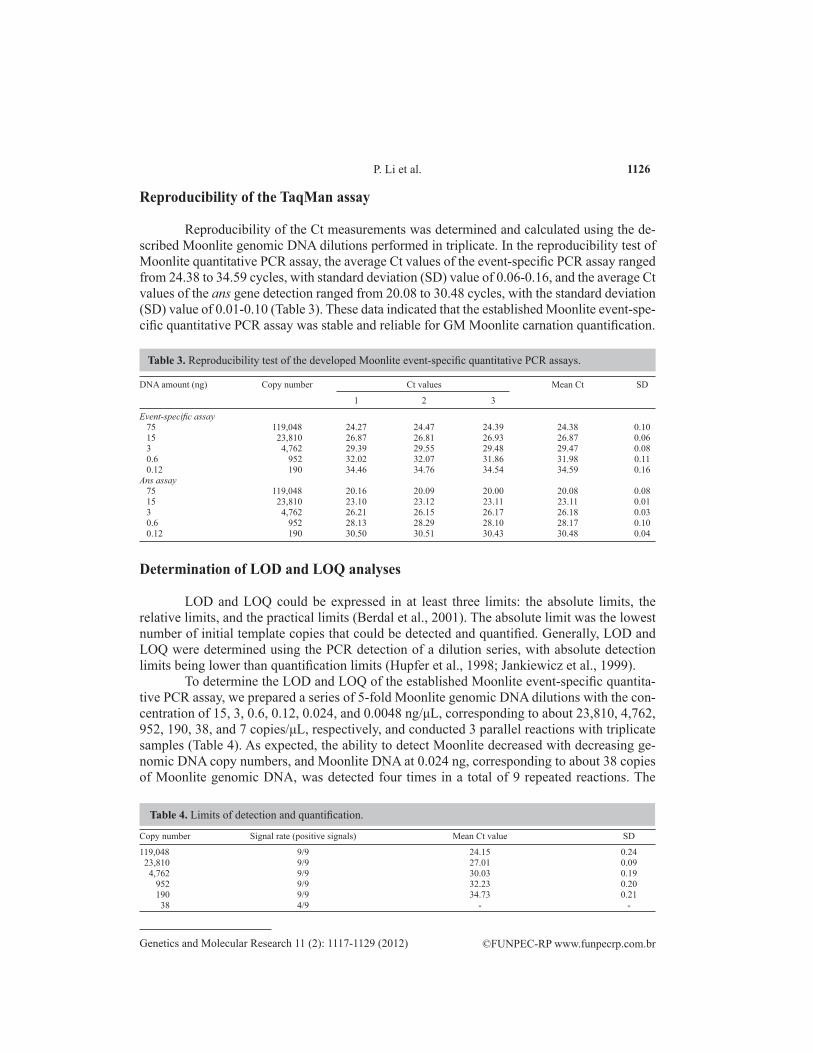
Copy number Signal rate (positive signals) Mean Ct value SD
119,048 9/9 24.15 0.24 23,810 9/9 27.01 0.09 4,762 9/9 30.03 0.19 952 9/9 32.23 0.20 190 9/9 34.73 0.21 38 4/9 - -
Table 4. Limits of detection and quantification.
Determination of LOD and LOQ analyses
LOD and LOQ could be expressed in at least three limits: the absolute limits, the relative limits, and the practical limits (Berdal et al., 2001). The absolute limit was the lowest number of initial template copies that could be detected and quantified. Generally, LOD and LOQ were determined using the PCR detection of a dilution series, with absolute detection limits being lower than quantification limits (Hupfer et al., 1998; Jankiewicz et al., 1999).
To determine the LOD and LOQ of the established Moonlite event-specific quantita-tive PCR assay, we prepared a series of 5-fold Moonlite genomic DNA dilutions with the con-centration of 15, 3, 0.6, 0.12, 0.024, and 0.0048 ng/μL, corresponding to about 23,810, 4,762, 952, 190, 38, and 7 copies/μL, respectively, and conducted 3 parallel reactions with triplicate samples (Table 4). As expected, the ability to detect Moonlite decreased with decreasing ge-nomic DNA copy numbers, and Moonlite DNA at 0.024 ng, corresponding to about 38 copies of Moonlite genomic DNA, was detected four times in a total of 9 repeated reactions. The
DNA amount (ng) Copy number Ct values Mean Ct SD
1 2 3
Event-specific assay 75 119,048 24.27 24.47 24.39 24.38 0.10 15 23,810 26.87 26.81 26.93 26.87 0.06 3 4,762 29.39 29.55 29.48 29.47 0.08 0.6 952 32.02 32.07 31.86 31.98 0.11 0.12 190 34.46 34.76 34.54 34.59 0.16Ans assay 75 119,048 20.16 20.09 20.00 20.08 0.08 15 23,810 23.10 23.12 23.11 23.11 0.01 3 4,762 26.21 26.15 26.17 26.18 0.03 0.6 952 28.13 28.29 28.10 28.17 0.10 0.12 190 30.50 30.51 30.43 30.48 0.04
Table 3. Reproducibility test of the developed Moonlite event-specific quantitative PCR assays.

1127
©FUNPEC-RP www.funpecrp.com.brGenetics and Molecular Research 11 (2): 1117-1129 (2012)
Identification and quantification of the GMO Moolite
results indicated that the LOD value was about 38 copies. To obtain reliable quantification results under ideal conditions, approximately 0.12 ng, corresponding to about 190 initial tem-plate copies, was required. Hence, we concluded that the LOQ of the event-specific quantita-tive PCR assay was 190 copies of the haploid genome.
Quantification of practical GM carnation samples
Three mixed Moonlite DNA samples, i.e., S1, S2, and S3 having 1, 3, and 5% GM each, were artificially prepared by mixing the Moonlite with non-GM carnation genomic DNA as per the concentration ratio. In this study, 10 ng DNA extracted from each Moonlite DNA samples was used as a template in each reaction. On the basis of the standard curves, the ob-served values of the 3 DNA samples (S1, S2, and S3) were 1.08, 2.96, and 5.13%, respectively, and deviated only slightly from the actual contents of the Moonlite DNA (Table 5). The quan-tified biases from true values were lower than the acceptance criterion (<25%) of the GMO detection method, suggesting that the developed event-specific quantitative PCR assay was creditable and accurate for the quantification of GM Moonlite.
Sample Ct Mean Ct value SD Calculated DNA Genetically amounts modified content (%) Mean 1 Mean 2 Mean 3
Event-specific PCR assay S1 (1%) 33.26 33.36 33.74 33.45 0.25 0.12 1.08 S2 (3%) 32.03 31.94 32.03 32.00 0.05 0.31 2.96 S3 (5%) 31.14 31.45 31.32 31.30 0.16 0.49 5.13Ans PCR assay S1 (1%) 21.51 21.37 21.20 21.36 0.16 11.12 - S2 (3%) 21.38 21.40 21.53 21.45 0.08 10.47 - S3 (5%) 21.50 21.67 21.59 21.59 0.09 9.55 -
Table 5. Quantification of Moonlite carnation content in three mixed samples.
CONCLUSION
GM carnation is intended to be used solely as an ornamental plant. The majority of Di-anthus species are self-sterile because the stigma is not receptive to the pollen until 1 week or more after anthers have shed the pollen (Bird, 1994). In addition, carnation pollen is heavy and sticky and has low viability (Department of Health and Ageing Office of the Gene Technol-ogy Regulator, Australian Government, 2005). Thus far, no experimental data indicating that pollen transfer can occur in carnation are available, and plantation of Moonlite has received previous approval in several countries. GM carnations for flower color are known to have a wider market in the future.
In this study, the 5ꞌ-transgene integration sequence was isolated, and event-specific qualitative and quantitative PCR assays for the identification and quantification of Moonlite carnation were established. The LOD of qualitative PCR was 0.05%, and the LOD and LOQ of quantitative PCR assays were estimated to be 38 and 190 copies of carnation haploid ge-nome, respectively. Moreover, bias values were lower, as revealed in practical sample quanti-fication. These results suggested that the developed event-specific qualitative and quantitative PCR assays were useful for GM carnation Moonlite detection and labeling.

1128
©FUNPEC-RP www.funpecrp.com.brGenetics and Molecular Research 11 (2): 1117-1129 (2012)
P. Li et al.
ACKNOWLEDGMENTS
Research supported by the Fund of Key Project of Science and Technology of the Shanghai Committee of Agriculture (#2008-8-9) and the youth Fund of Shanghai Academy of Agricultural Sciences, P.R. China (#2010-15).
REFERENCES
Berdal KG and Holst-Jensen A (2001). Roundup Ready® soybean event-specific real-time quantitative PCR assay and estimation of the practical detection and quantification limits in GMO analyses. Eur. Food Res. Technol. 213: 432-438.
Bird R (1994). Border Pinks. Timber Press, Portland.Center for Food Safety (2006). Genetically Engineered Crops and Foods: Worldwide Regulation and Prohibition. Available
at [http://www.centerforfoodsafety.org/pubs/World_Regs_Chart %20_6-2006.pdf]. Accessed April 11, 2011. Department of Health and Ageing Office of the Gene Technology Requlator AG (2005). The Biology and Ecology of
Dianthus Caryophyllus L. (Carnation). Available at [http://www.ogtr.gov.au/internet/ogtr/publishing.nsf/content/carnation-3/$FI LE/biologycarnation.pdf]. Accessed April 11, 2011.
European Commission (2003a). Commission regulation (EC) No. 1829/2003 of September 22, 2003, concerning on genetically modified food and feed. Off. J. Eur. Commun. L268: 1-23.
European Commission (2003b). Commission regulation (EC) No. 1830/2003 of September 22, 2003, concerning the traceability of food and feed products produced from genetically modified organisms and amending directive2001/18/EC. Off. J. Eur. Commun. L268: 24-28.
European Network of GMO Laboratories (ENGL) (2008). Definition of Minimum Performance Requirements for Analytical Methods of GMO Testing. Available at [http://gmo-crl.jrc.ec. Europa.eu/ doc/Min_Perf_Requirements_Analytical_methods.pdf]. Accessed April 16, 2011.
Guo J, Yang L, Liu X, Guan X, et al. (2009). Characterization of the exogenous insert and development of event-specific PCR detection methods for genetically modified Huanong No. 1 papaya. J. Agric. Food Chem. 57: 7205-7212.
Holst-Jensen A, Ronning SB, Lovseth A and Berdal KG (2003). PCR technology for screening and quantification of genetically modified organisms (GMOs). Anal Bioanal. Chem. 375: 985-993.
Hu J, Gu QX and Chi J (2004). Carnation Production Technology. China Agricultural Press, Beijing.Hupfer C, Hotzel H, Sachse K and Engel KH (1998). Detection of the genetic modification in heat-treated products of Bt
maize by polymerase chain reaction. Lebensm Unters Forsch. 206: 203-207.James C (2010). Global Status of Commercialized Biotech/GM Crops. ISAAA Brief 42-2010 M. New York, USA: The
International Service for the Acquisition of Agri-biotech Applications. Available at [http://www.isaaa.org]. Accessed April 11, 2011.
Jankiewicz A, Broll H and Zagon J (1999). The official method for the detection of genetically modified soybeans: A semi-quantitative study of sensitivity limits with glyphosate-tolerant soybeans (Roundup Ready) and insect-resistant Bt maize (Maximizer). Eur. Food Res. Technol. 209: 77-82.
Jiang L, Yang L, Rao J, Guo J, et al. (2010). Development and in-house validation of the event-specific qualitative and quantitative PCR detection methods for genetically modified cotton MON15985. J. Sci. Food Agric. 90: 402-408.
Kahl LS (1994). Summary of Consultation with Calgene, Inc. Concerning FLAVR SAVRTM Tomato. FDA, Docket No. 91A20330.
Kim HY, Kim JH and Oh MH (2010). Regulation and detection methods for genetically modified foods in Korea. Pure Appl. Chem. 82: 129-137.
Lee SH, Yi BY and Kim SJ (2009). Event-specific analytical methods for biotech maize MIR 604 and DAS-59122-7. J. Sci. Food Agric. 89: 2616-2624.
Liu YG, Mitsukawa N, Oosumi T and Whittier RF (1995). Efficient isolation and mapping of Arabidopsis thaliana T-DNA insert junctions by thermal asymmetric interlaced PCR. Plant J. 8: 457-463.
Matsuoka T (2001). GMO Labeling and Detection Methods in Japan. APEC-JIRCAS Joint Symposium and Workshop on Agriculture Biotechnology, September 6, Bangkok, Thailand. JIRCAS, Tsukuba.
Ministry of Agriculture and Forestry (2000). Guidelines for Labeling of Genetically Modified Agriculture Products. MAF Notification 2000-31. Ministry of Agriculture and Forestry, Korea.
Royal Bbotanic Gardens Kew (2005). Plant c-DNA Value Database (Release 4.0, October 2005). Available at [http://www.rbgkew.org.uk/cval/homepage.html]. Accessed April 11, 2011.
Wu G, Wu YH, Xiao L and Lu CM (2008). Event-specific qualitative and quantitative PCR methods for the detection of

1129
©FUNPEC-RP www.funpecrp.com.brGenetics and Molecular Research 11 (2): 1117-1129 (2012)
Identification and quantification of the GMO Moolite
genetically modified rapeseed Oxy-235. Transgenic Res. 17: 851-861.Wu G, Wu YH, Xiao L and Lu CM (2009). Event-specific qualitative and quantitative PCR detection of genetically
modified rapeseed Topas 19/2. Food Chem. 112: 232-238.Yang L, Xu S, Pan A, Yin C, et al. (2005). Event specific qualitative and quantitative polymerase chain reaction detection
of genetically modified MON863 maize based on the 5’-transgene integration sequence. J. Agric. Food Chem. 53: 9312-9318.
Zhu H, Jiang LX, Tao SR, Li HY, et al. (2011). Validation of a carnation-specific gene, ANS, used as an endogenous reference gene in qualitative and real-time quantitative PCR for transgenic carnations. J. AOAC int. 94: 1227-1232.